Dateiliste
Aus Klimawandel
Diese Spezialseite listet alle hochgeladenen Dateien auf.
| Datum | Name | Vorschaubild | Größe | Benutzer | Beschreibung | Versionen |
|---|---|---|---|---|---|---|
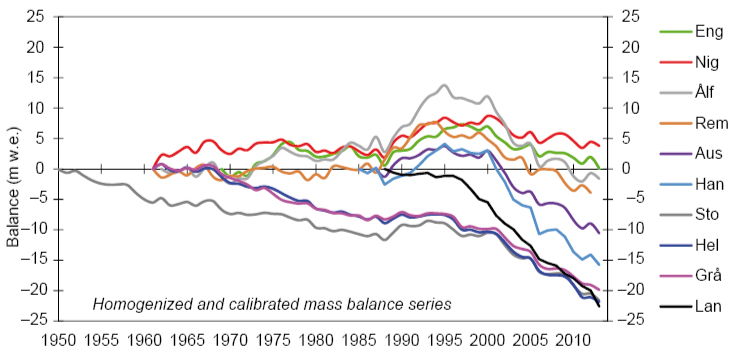
| 16:52, 3. Dez. 2018 | 10 Norwegian glaciers MB.jpg (Datei) |  |
108 KB | Dieter Kasang | Massenbilanz von 10 norwegischen Gletschern == Lizenzhinweis == {| style="border:1px solid #8888aa; background-color:#f7f8ff;padding:5px;font-size:95%;" | Quelle: Andreassen, L.M., H. Elvehøy, B. Kjøllmoen, and R.V. Engeset. 2016. Reanalysis of long-… | 1 |
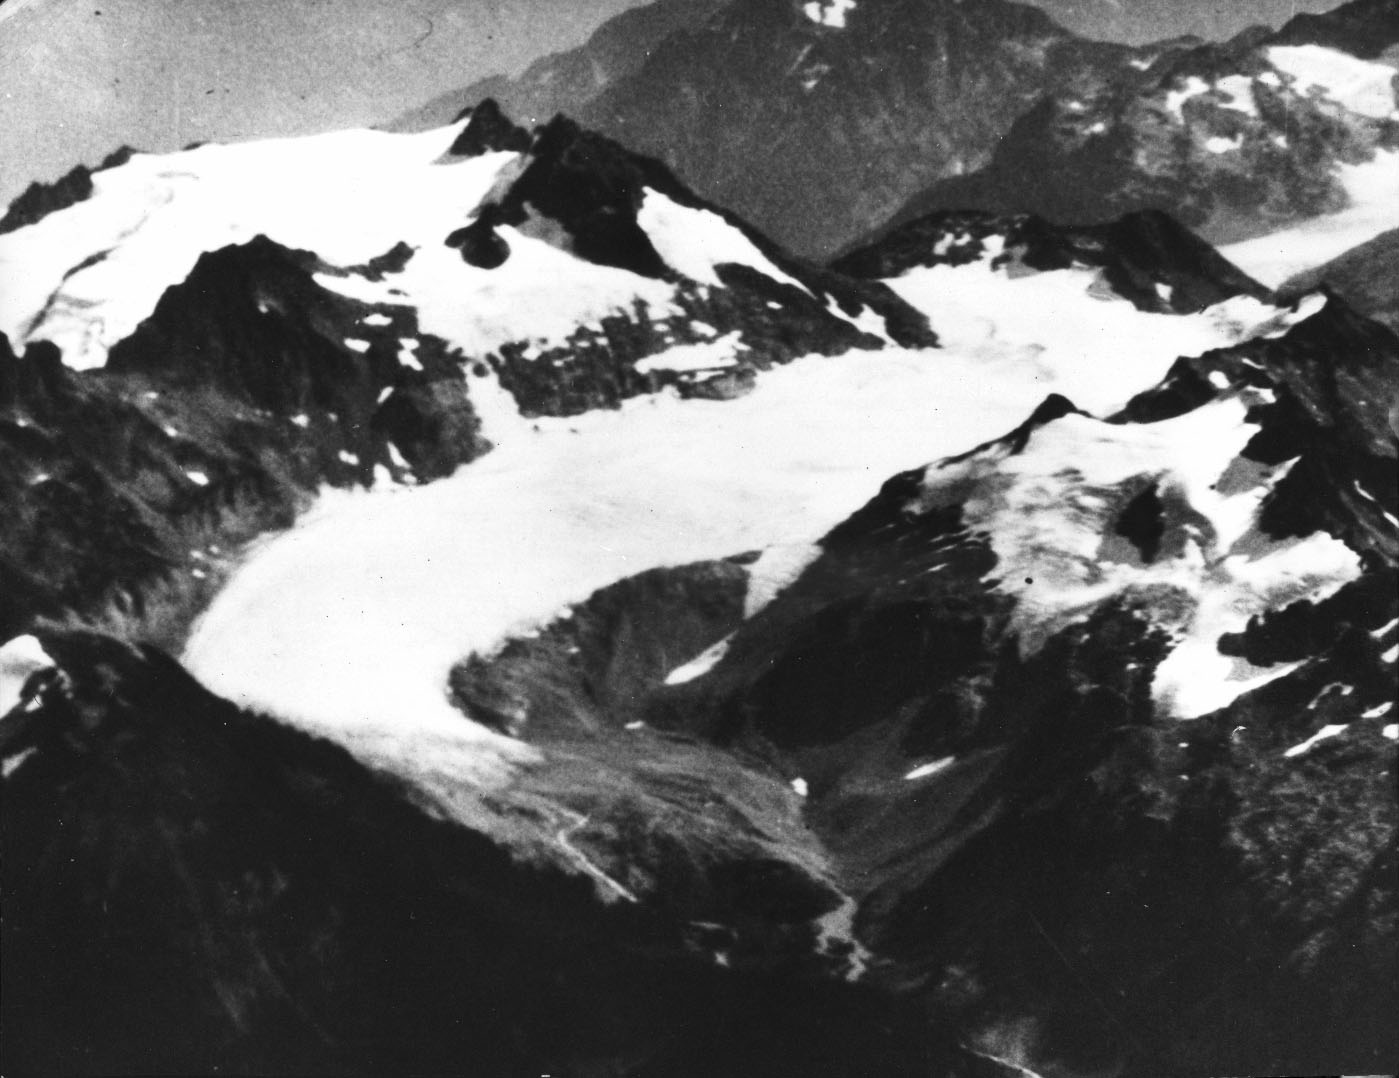
| 11:38, 18. Feb. 2020 | 1928 scascade glacier.jpg (Datei) |  |
149 KB | Kklara | South Cascade-Gletscher 1928 ==Lizenzhinweis== {| style="border:1px solid #8888aa; background-color:#f7f8ff;padding:5px;font-size:95%;" | Quelle: USDA, USGS: [https://www.usgs.gov/media/images/1928-south-cascade-glacier South Cascade Glacier 1928]<br>… | 1 |
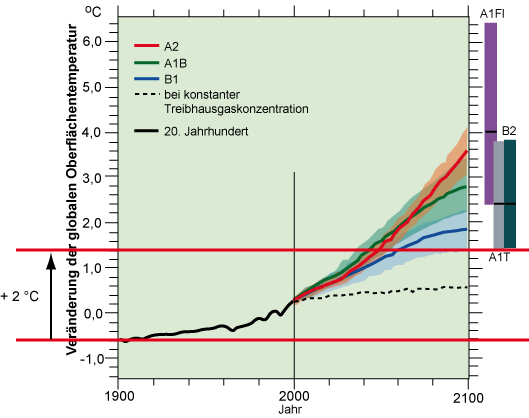
| 14:31, 16. Nov. 2011 | 2-Grad-Ziel.jpg (Datei) |  |
72 KB | Dieter Kasang | Das 2-Grad-Ziel und die Temperaturveränderungen bis 2100 nach verschiedenen IPCC-Szenarien ==Lizenzhinweis== {| style="border:1px solid #8888aa; background-color:#f7f8ff;padding:5px;font-size:95%;" | Eigene Darstellung nach IPCC (2007): Climate Change 20 | 1 |
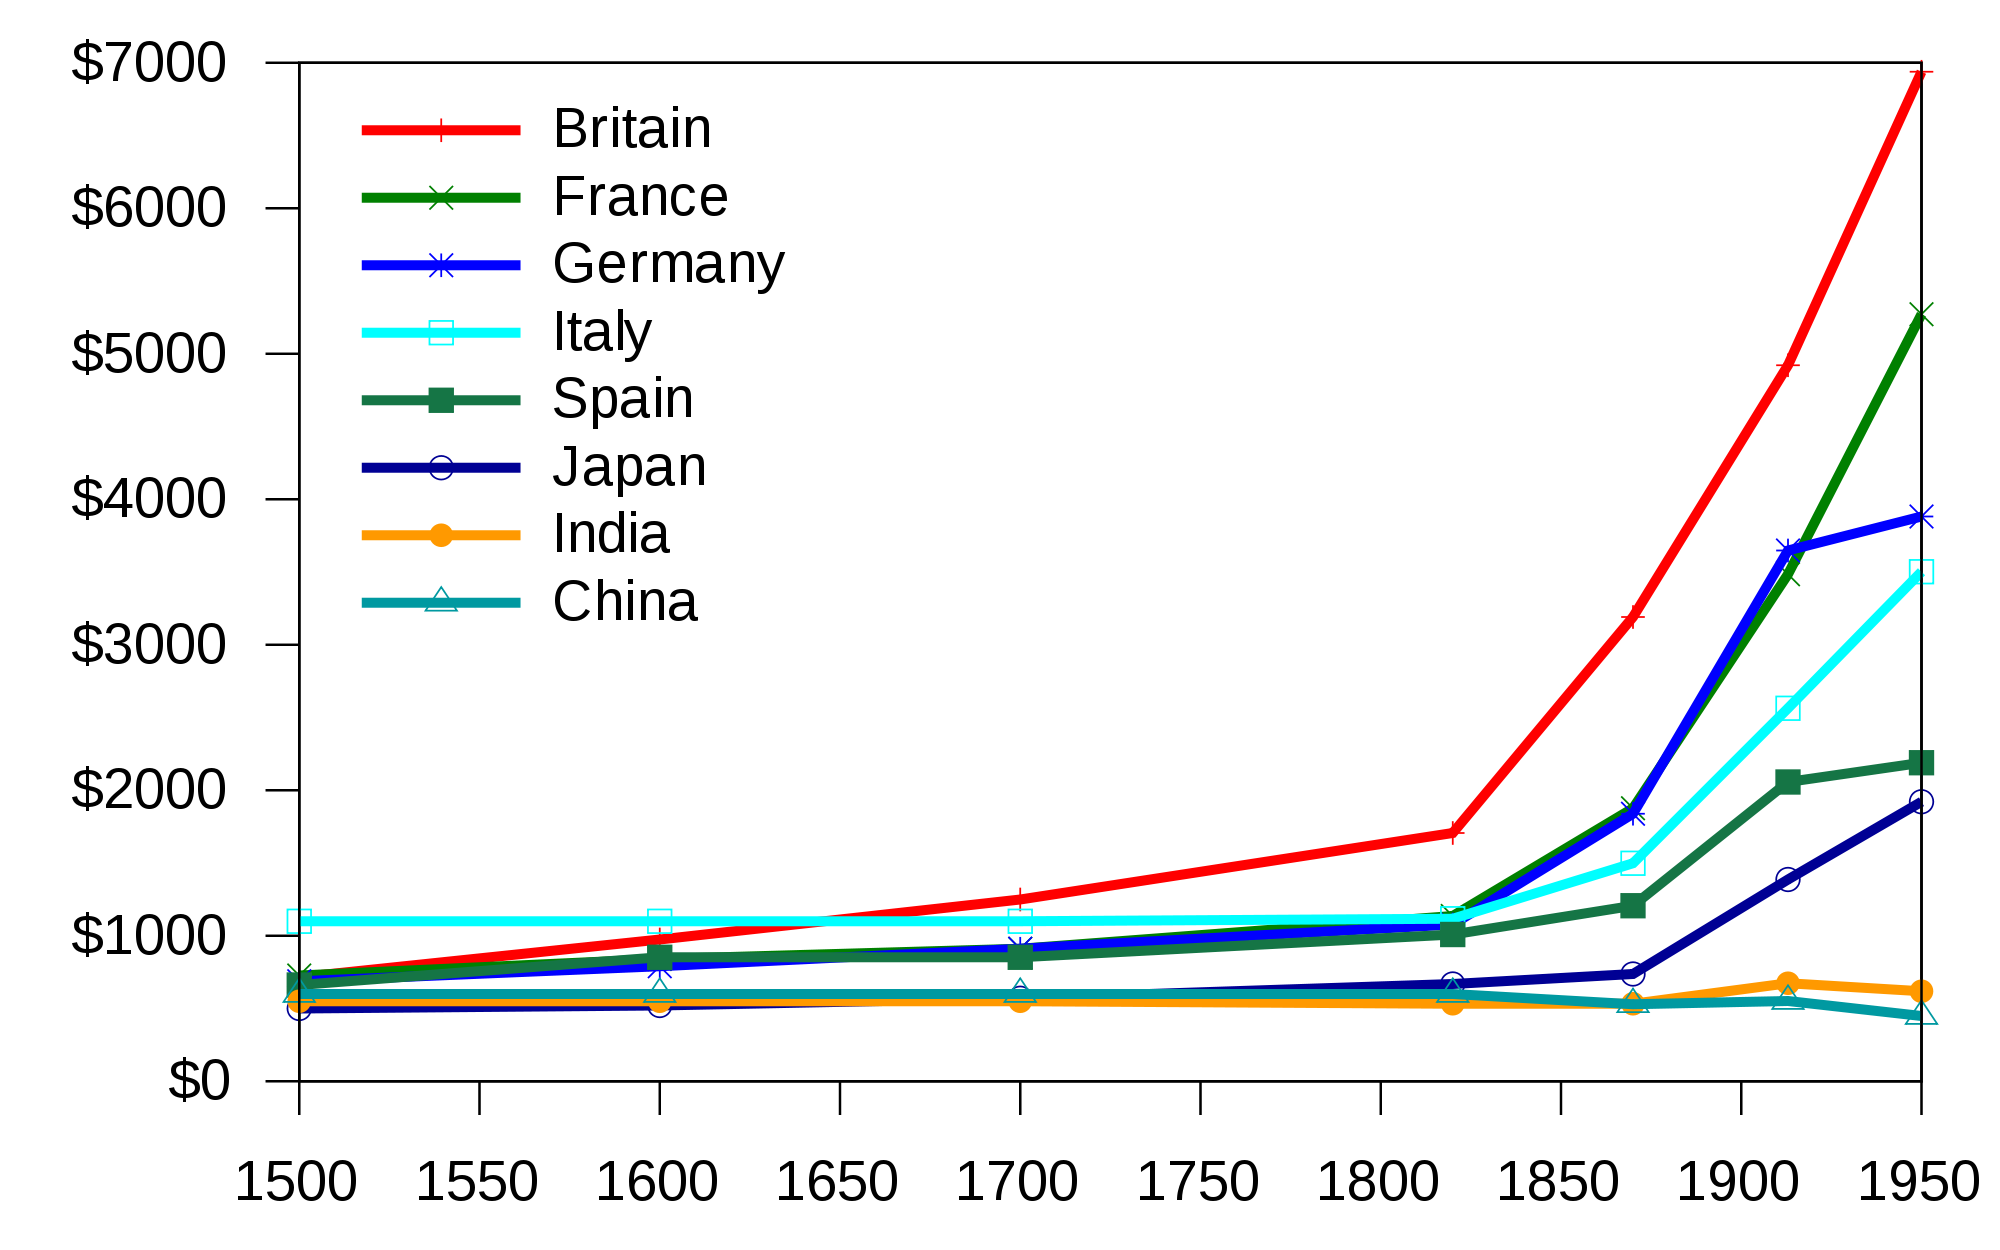
| 11:49, 13. Mär. 2012 | 2000px-Maddison GDP per capita 1500-1950.svg.png (Datei) |  |
121 KB | Sandra Burger | Gross domestic product (at purchasing power parity) per capita between 1500 and 1950 in 1990 International Dollars for selected nations, depicting data excerpted from Contours of the World Economy, 1–2030 AD. Essays in Macro-Economic History by Angus Ma | 1 |
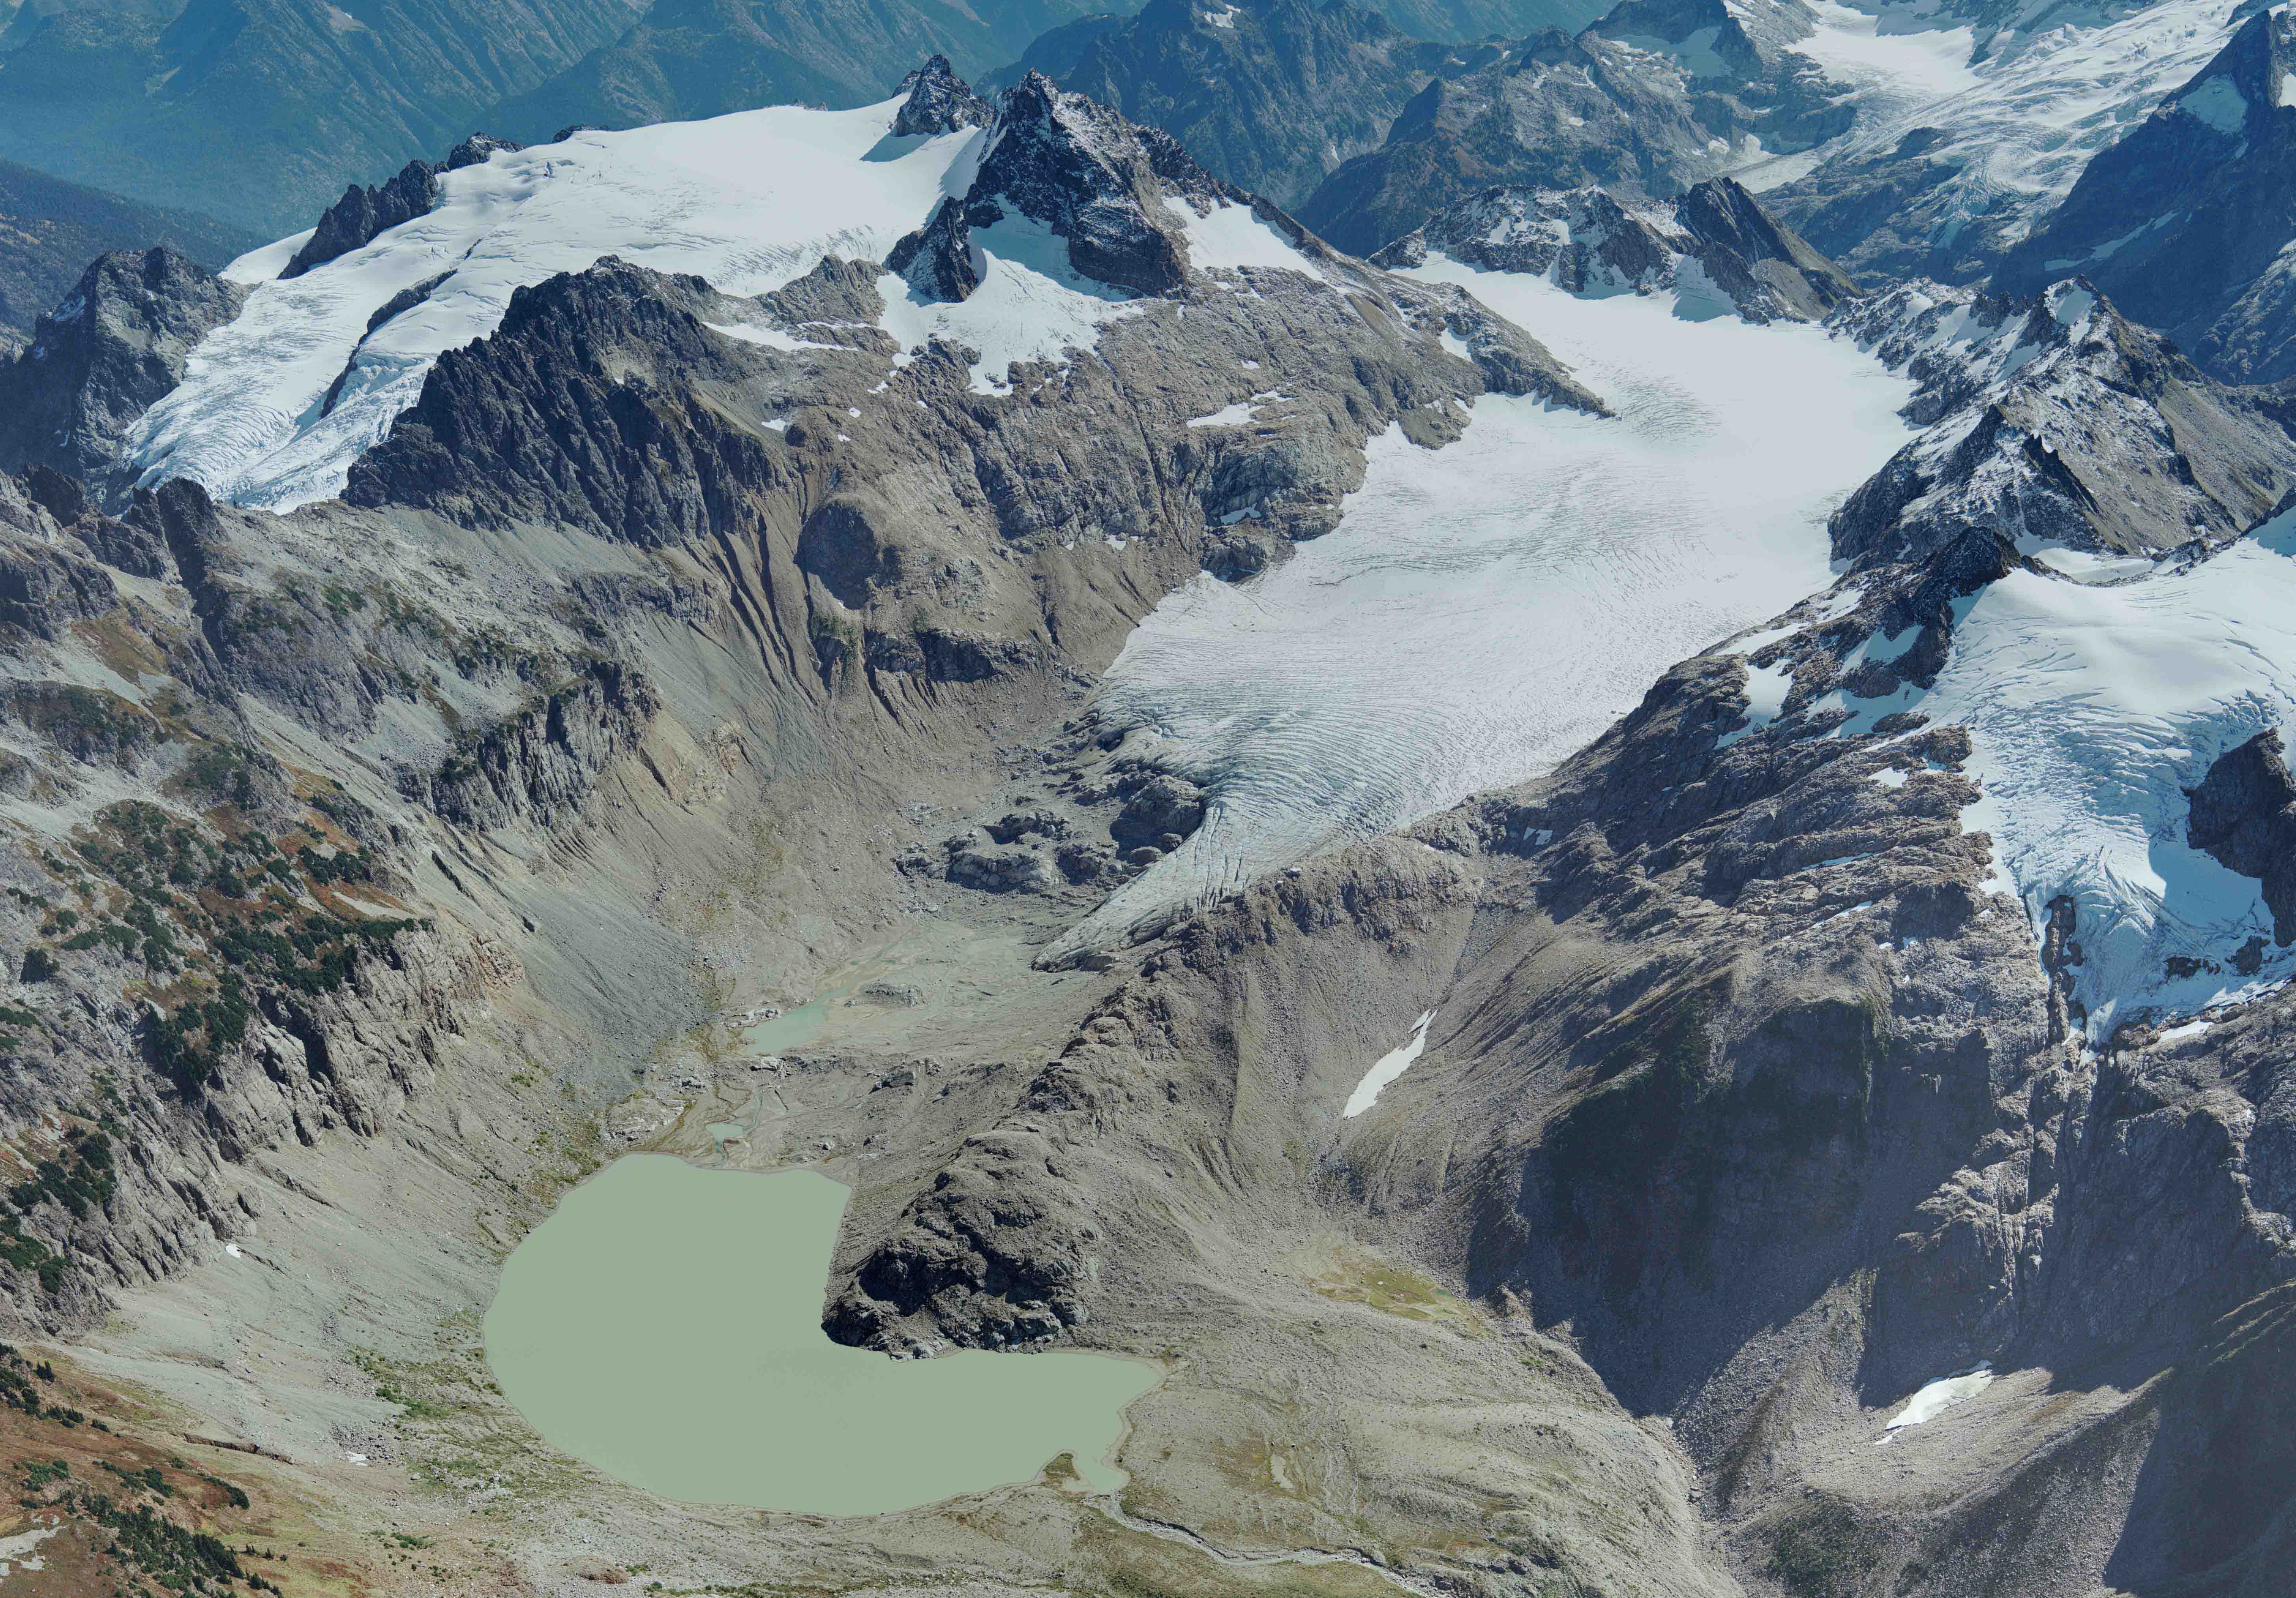
| 11:43, 18. Feb. 2020 | 2006 scascade glacier .jpg (Datei) |  |
8,28 MB | Kklara | South Cascade-Gletscher 2006 ==Lizenzhinweis== {| style="border:1px solid #8888aa; background-color:#f7f8ff;padding:5px;font-size:95%;" | Quelle: USGS: [https://www.usgs.gov/media/images/2006-south-cascade-glacier South Cascade Glacier 2006]<br> Lizen… | 1 |
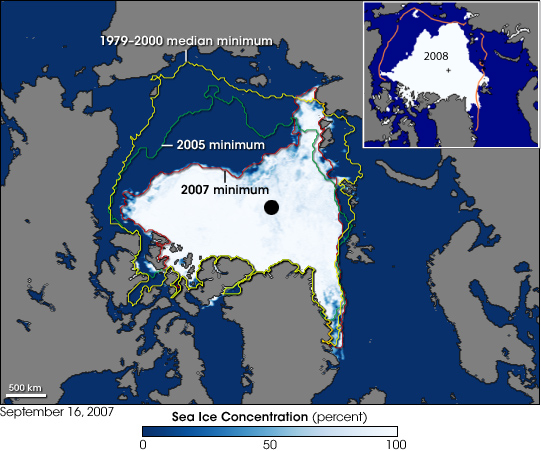
| 20:35, 15. Okt. 2008 | 2007 Arctic Sea Ice.jpg (Datei) |  |
167 KB | Dieter Kasang | 2 | |
| 11:21, 25. Nov. 2020 | 2011 ln water.png (Datei) |  |
554 KB | Lina Teckentrup | Änderung Wassermasse in 2011 (Januar, Februar, März Durchschnitt) im Vergleich zu 2010 (März, April, Mai Durchschnitt).Blau zeigt einen Anstieg in der Wassermasse über den Kontinenten. | 1 |
| 11:26, 25. Nov. 2020 | 2012 ln greening.jpg (Datei) |  |
161 KB | Lina Teckentrup | Anomalien für einen Vegetationsindex (‘Normalized Difference Vegetation Index’; NDVI) am Ende eines La Niña Ereignisses im Februar 2012 im Vergleich zu 2006 - 2009 in Australien. In grünen Regionen ist die Vegetation gewachsen, in braunen Region… | 1 |
| 21:36, 18. Okt. 2016 | 2015 winter summer.jpg (Datei) |  |
248 KB | Dieter Kasang | Temperaturabweichungen 2015 im Winter und Sommer vom Mittel 1981-2010 in °C ==Lizenzhinweis== {| style="border:1px solid #8888aa; background-color:#f7f8ff;padding:5px;font-size:95%;" | Quelle: van den Besselaar, E., R. Cornes, C. Photiadou, G.van der… | 1 |
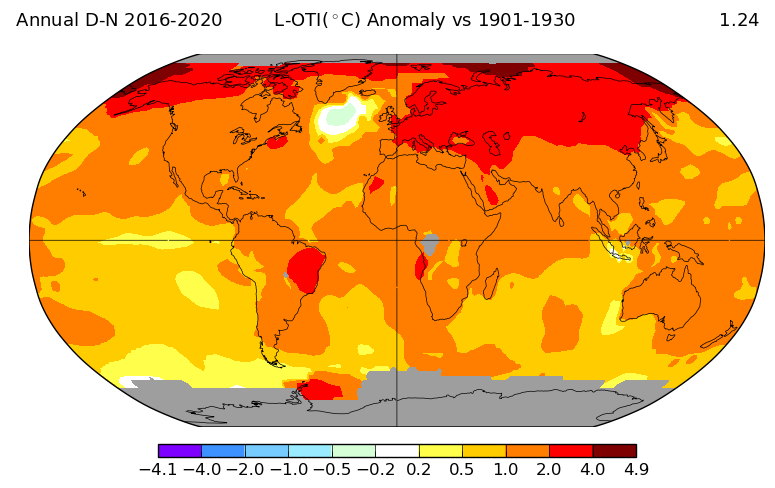
| 17:05, 27. Nov. 2021 | 2016-2020 global temp diff.png (Datei) |  |
82 KB | Dieter Kasang | Temperaturdifferenz 2016-2020 im Vergleich zum Beginn des 20. Jahrhunderts (1901-1930) ==Lizenzhinweis== {| style="border:1px solid #8888aa; background-color:#f7f8ff;padding:5px;font-size:95%;" | Quelle: NASA (2021): GISS Surface Temperature Analysis (v4), https://data.giss.nasa.gov/gistemp/maps/ Lizenz: public domain |} | 1 |
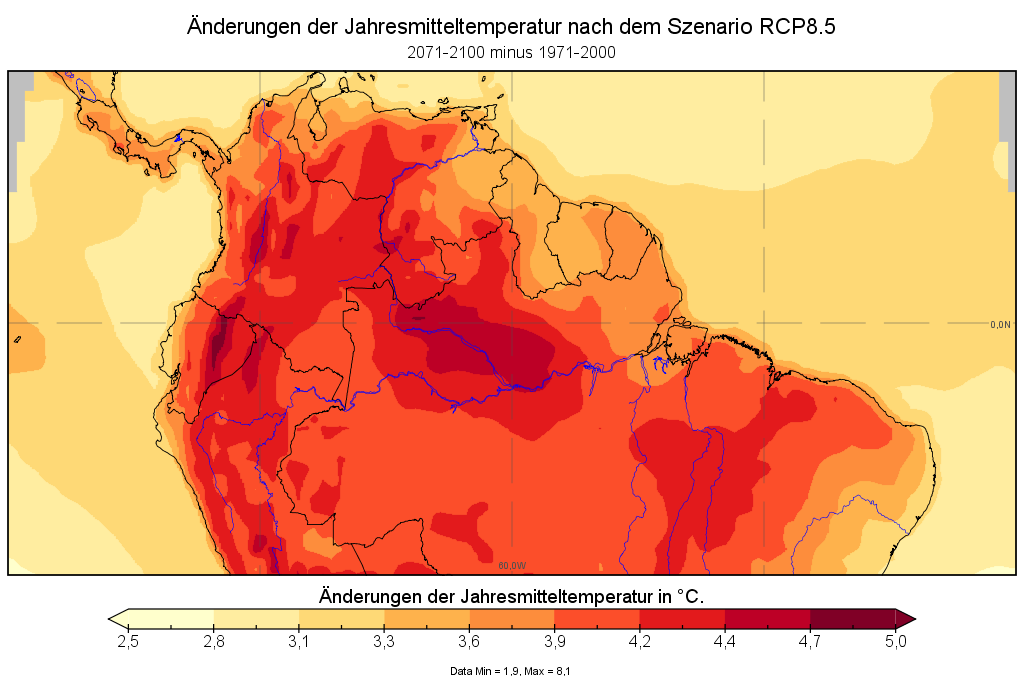
| 18:22, 10. Jul. 2017 | 2mtemp in Temperatur Suedamerika rcp85 dif.png (Datei) |  |
100 KB | Anja | Änderungen der Jahresmitteltemperatur nach dem Szenario RCP8.5, 2071-2100 minus 1971-2000. == Lizenzhinweis == {| style="border:1px solid #8888aa; background-color:#f7f8ff;padding:5px;font-size:95%;" |Eigene Darstellung, geplottet mit Panoply; Datenq… | 1 |
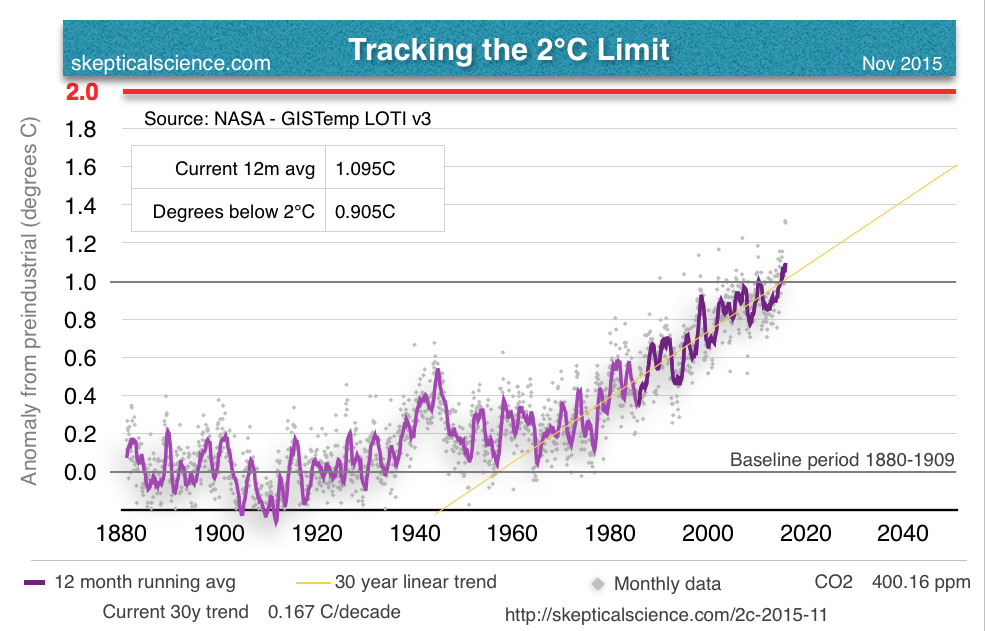
| 20:25, 2. Jan. 2016 | 2° limit skepticalscience.png (Datei) |  |
273 KB | Dieter Kasang | ==Lizenzhinweis== {| style="border:1px solid #8888aa; background-color:#f7f8ff;padding:5px;font-size:95%;" | Quelle: Rob Honeycutt: http://www.skepticalscience.com/2c-2015-11.html Tracking the 2°C Limit - November 2015 |} | 1 |
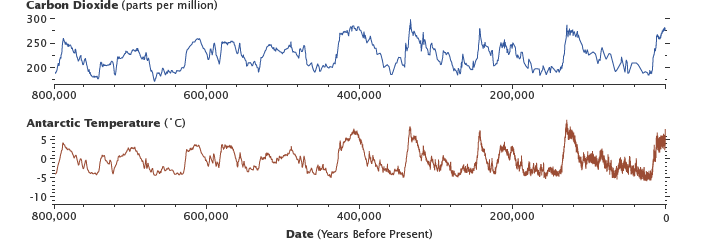
| 15:55, 27. Jan. 2019 | 800.000 CO2 Antarctic temp.png (Datei) |  |
12 KB | Dieter Kasang | CO2-Konzentration und Temperatur im Eiszeitalter während der letzten 800 000 Jahre ==Lizenzhinweis== {| style="border:1px solid #8888aa; background-color:#f7f8ff;padding:5px;font-size:95%;" | Quelle: Riebeck, H., NASA Earth Observatory (2011): The Ca… | 1 |
| 17:19, 13. Nov. 2012 | 800px-Sphagnum squarrosum 141006.jpg (Datei) |  |
111 KB | Anastasia | http://commons.wikimedia.org/wiki/File:Sphagnum_squarrosum_141006.jpg | 1 |
| 17:49, 11. Nov. 2009 | 90px-Regenmesser Prof Hellmann.JPG (Datei) |  |
6 KB | Katharina | Hellmann Regenmesser | 1 |
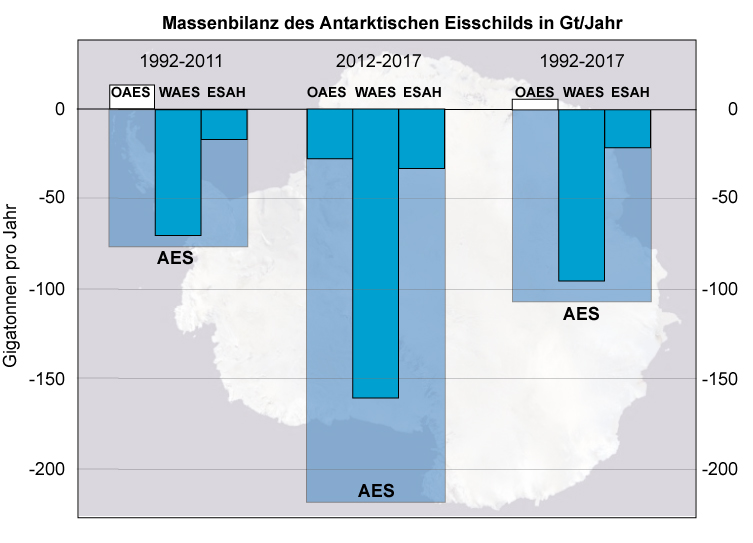
| 11:41, 26. Jul. 2018 | AES MB1992-2017.jpg (Datei) |  |
111 KB | Dieter Kasang | Massenbilanz des Antarktischen Eisschilds ==Lizenzhinweis== {| style="border:1px solid #8888aa; background-color:#f7f8ff;padding:5px;font-size:95%;" | Quelle: Graphik: eigene Darstellung nach Daten von The IMBIE Team (2018): Mass balance of the Antarc… | 1 |
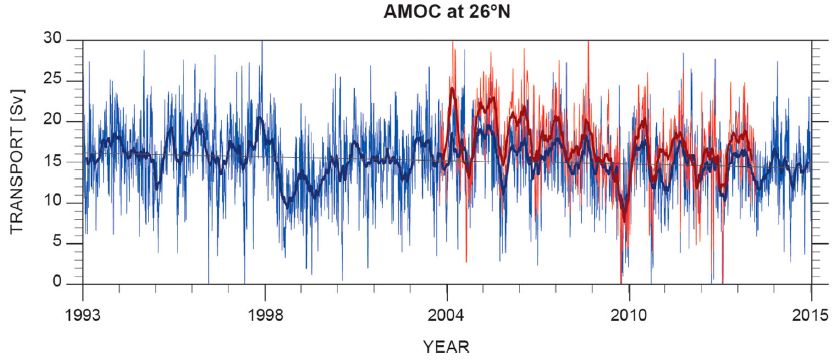
| 19:01, 15. Feb. 2019 | AMOC1993-2015.jpg (Datei) |  |
54 KB | Dieter Kasang | Die Antlantische Meridionale Umwälzzirkulation bei 26 °N in Sverdrup (Sv) nach zwei Datenreihen. Feine Linie: 10-Tages-, dicke Linie: 3-Monats-Mittel. ==Lizenzhinweis== {| style="border:1px solid #8888aa; background-color:#f7f8ff;padding:5px;font-si… | 1 |
| 19:52, 7. Jul. 2018 | AMOC2004-2017.jpg (Datei) |  |
52 KB | Dieter Kasang | Atlantische meridionale Umwälzzirkulation (AMOC). Veränderungen 2004 bis 2017 in Sverdrup (Sv) ==Lizenzhinweis== {| style="border:1px solid #8888aa; background-color:#f7f8ff;padding:5px;font-size:95%;" | Quelle: Eigene Darstellung nach Smeed, D. A.,… | 1 |
| 21:30, 5. Jul. 2018 | AMOC RAPID.jpg (Datei) |  |
44 KB | Dieter Kasang | Atlantische Umwälzzirkulation und Messpunkte des RAPID-Projekts. Warme Strömungen in den oberen 1000 m (rot), kältere Strömungen darunter (blau). Messstellen bei 26 °N. ==Lizenzhinweis== {| style="border:1px solid #8888aa; background-color:#f7f8f… | 1 |
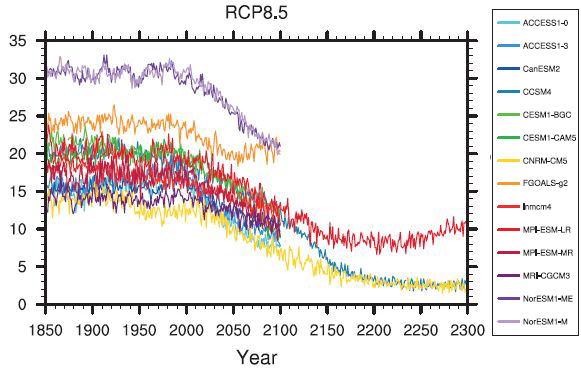
| 11:52, 9. Jul. 2018 | AMOC projections2300.jpg (Datei) |  |
118 KB | Dieter Kasang | Abschwächung der Atlantischen Umwälzzirkulation 2004-2012 in Sverdrup (Sv) ==Lizenzhinweis== {| style="border:1px solid #8888aa; background-color:#f7f8ff;padding:5px;font-size:95%;" | Quelle: IPCC (2013): Climate Change 2014, Working Group I: The S… | 1 |
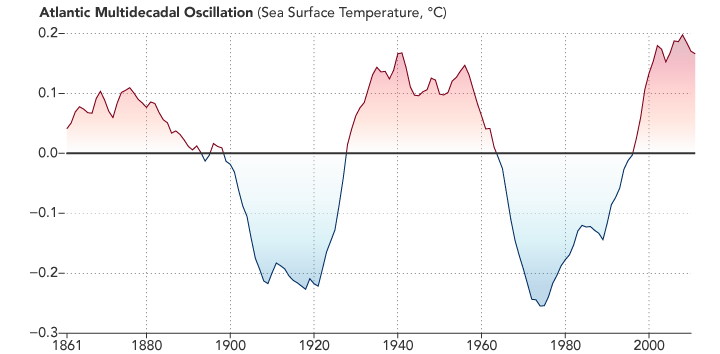
| 18:47, 12. Jan. 2018 | AMO 1861-2010.png (Datei) |  |
26 KB | Dieter Kasang | AMO und Sahel-Dürren ==Lizenzhinweis== {| style="border:1px solid #8888aa; background-color:#f7f8ff;padding:5px;font-size:95%;" | Quelle: https://earthobservatory.nasa.gov/IOTD/view.php?id=88670 Atlantic Multi-decadal Oscillation and Drought in Africa… | 1 |
| 10:35, 13. Sep. 2021 | AR6 SLR 10.000 paleo.jpg (Datei) |  |
67 KB | Dieter Kasang | == Beschreibung == Langfristiger Meeresspiegelanstieg ==Lizenzhinweis== {| style="border:1px solid #8888aa; background-color:#f7f8ff;padding:5px;font-size:95%;" |Quelle: Eigene Darstellung nach Daten aus IPCC (2021): Climate Change 2021, Working Group I: The Science of Climate Change, Technical Summary<br> Lizenz: CC BY-SA |} | 2 |
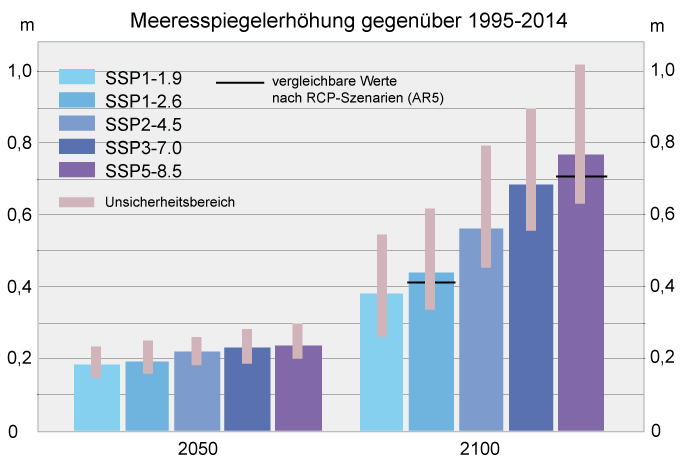
| 16:37, 1. Jun. 2022 | AR6 SLR 2100.jpg (Datei) |  |
79 KB | Dieter Kasang | == Beschreibung == Anstieg des globalen Meeresspiegels nach den SSP-Szenarien bis 2050 und 2100 == Lizenzhinweis == {| style="border:1px solid #8888aa; background-color:#f7f8ff;padding:5px;font-size:95%;" |Quelle: Eigene Darstellung, Daten nach IPCC AR6 WGI (2021): Climate Change 2021: The Physical Science Basis, Ch..9: Ocean, Cryosphere and Sea Level Change<br> Lizenz: CC BY-SA |} | 1 |
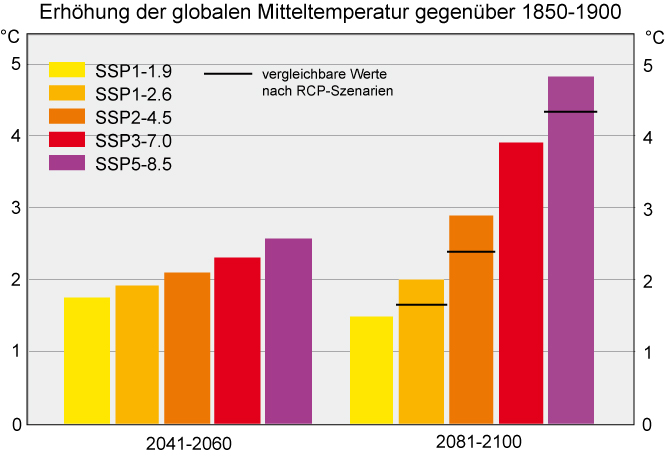
| 17:11, 21. Aug. 2021 | AR6 SSP temp2100.jpg (Datei) |  |
46 KB | Dieter Kasang | == Beschreibung == Erhöhung der globalen Mitteltemperatur 1850-1900 bis 2041-2060 und 2081-2100 nach verschiedenen SSP-Szenarien == Lizenzhinweis == {| style="border:1px solid #8888aa; background-color:#f7f8ff;padding:5px;font-size:95%;" | Quelle: eigene Darstellung (D. Kasang), Daten nach IPCC (2021): Climate Change 2021, Working Group I: The Science of Climate Change, Table 4.2<br> Lizenz: CC BY-SA |} | 1 |
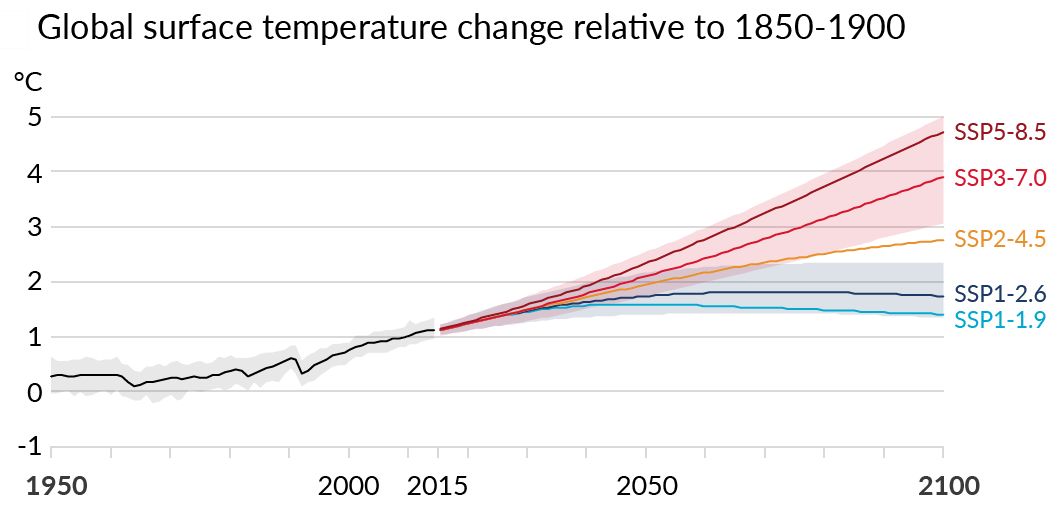
| 20:28, 22. Aug. 2021 | AR6 temp2100.jpg (Datei) |  |
70 KB | Dieter Kasang | == Beschreibung == Erhöhung der globalen Mitteltemperatur 1850-1900 bis 2041-2060 und 2081-2100 nach verschiedenen SSP-Szenarien == Lizenzhinweis == {| style="border:1px solid #8888aa; background-color:#f7f8ff;padding:5px;font-size:95%;" | Quelle: eigene Darstellung (D. Kasang), Daten nach IPCC (2021): Climate Change 2021, Working Group I: The Science of Climate Change, Table 4.2<br> Lizenz: CC BY-SA |} | 3 |
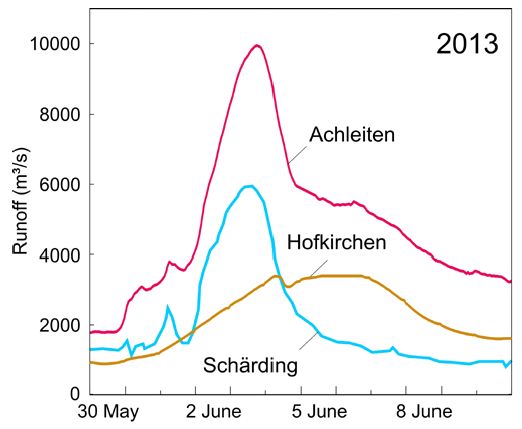
| 21:31, 22. Mär. 2015 | Abfluss Donau2013.jpg (Datei) |  |
26 KB | Dieter Kasang | Abflussmengen in m3 ==Lizenzhinweis== {| style="border:1px solid #8888aa; background-color:#f7f8ff;padding:5px;font-size:95%;" | Quelle: Blöschl, G., T. Nester, J. Komma, J. Parajka, and R.A.P. Perdigão (2013): The June 2013 flood in the Upper Danube… | 1 |
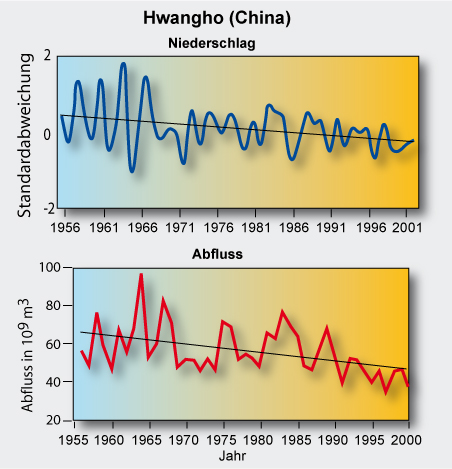
| 11:55, 1. Aug. 2012 | Abfluss Hwangho.jpg (Datei) |  |
108 KB | Dieter Kasang | Niederschläge (oben) im Einzugsgebiet und Abflussmengen (unten) des Hwangho == Lizenzhinweis == {| style="border:1px solid #8888aa; background-color:#f7f8ff;padding:5px;font-size:95%;" |Eigene Darstellung nach S. Wang, and Z. Zhang (2011): Effects of cli | 1 |
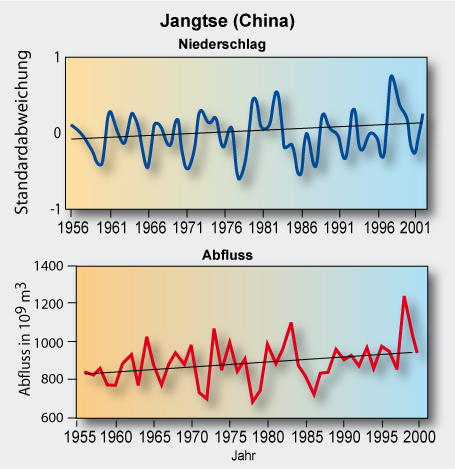
| 11:45, 1. Aug. 2012 | Abfluss Jangtse.jpg (Datei) |  |
109 KB | Dieter Kasang | Niederschläge (oben) im Einzugsgebiet und Abflussmengen (unten) des Jangtse == Lizenzhinweis == {| style="border:1px solid #8888aa; background-color:#f7f8ff;padding:5px;font-size:95%;" |Eigene Darstellung nach S. Wang, and Z. Zhang (2011): Effects of cli | 2 |
| 20:15, 24. Jun. 2008 | Abfluss zu niederschlag.gif (Datei) |  |
9 KB | Dieter Kasang | Das Verhältnis von Abfluss zu Niederschlag auf den verschiedenen Kontinenten der Welt | 1 |
| 18:58, 26. Feb. 2022 | Abflusskoeffizient-Sahel.jpg (Datei) |  |
98 KB | Dieter Kasang | == Beschreibung == Abflusskoeffizient (Anteil des Abflusses am Niederschlag in %) bei Nebenflüssen des Volta (Nakambé) und des mittleren Niger (alle übrigen). == Lizenzhinweis == {| style="border:1px solid #8888aa; background-color:#f7f8ff;padding:5px;font-size:95%;" | Quelle: Descroix, L., F. Guichard, M. Grippa (2018): Evolution of surface hydrology in the sahelo-sudanian strip: an updated review. Water 10, 748. https://doi.org/10.3390/w10060748<br> Lizenz: [http://creativecommons.org/licen… | 1 |
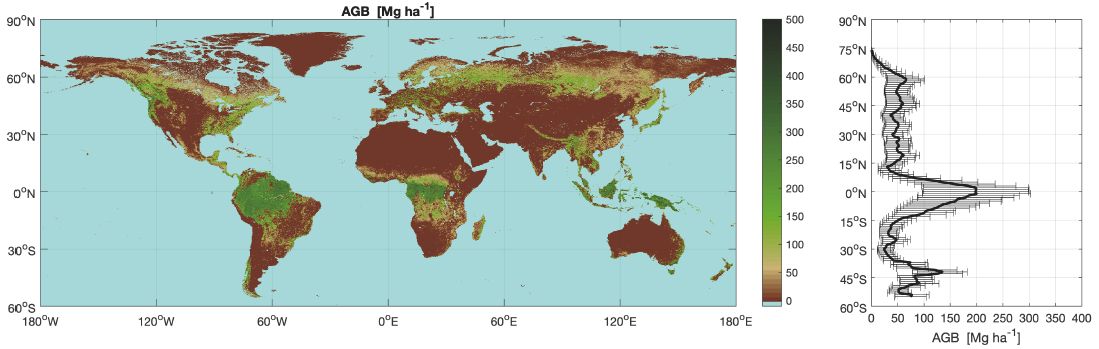
| 20:13, 6. Mai 2021 | Above Ground Biomasse.jpg (Datei) |  |
61 KB | Dieter Kasang | == Beschreibung == Oberirdische Biomasse (AGB=Above Ground Biomass) in Mg C (t Kohlenstoff) pro ha in 2010 (Karte) und nach Breitengrad (rechts). == Lizenzhinweis == {| style="border:1px solid #8888aa; background-color:#f7f8ff;padding:5px;font-size:95%;" | Quelle: Santoro, M., O. Cartus, N. Carvalhais et al. (2020): The global forest above-ground biomass pool for 2010 estimated from high-resolution satellite observations, Earth Syst. Sci. Data Discuss. [preprint], https://doi.org/10.5194/essd… | 1 |
| 19:45, 26. Dez. 2021 | Aboveground soils gases.jpg (Datei) |  |
135 KB | Dieter Kasang | == Beschreibung == Bodenfunktionen, übersetzt == Lizenzhinweis == {| style="border:1px solid #8888aa; background-color:#f7f8ff;padding:5px;font-size:95%;" | Quelle: FAO (2015): [https://www.fao.org/resources/infographics/infographics-details/en/c/284478/ Soil funtions]<br> Lizenz: material may be copied, downloaded and printed for private study, research and teaching purposes, or for use in non-commercial products or services, provided that appropriate acknowledgement of FAO as the source and c… | 1 |
| 14:01, 15. Feb. 2010 | Absinkinversion.png (Datei) |  |
12 KB | Christian W. | Skizze zur Entstehung einer Absinkinversion aus wikipedia (Wikimedia Commons) | 1 |
| 16:47, 30. Mär. 2008 | Absorption.gif (Datei) |  |
15 KB | Kathi | links (a): theoretische Ausstrahlung der Erdoberfläche ohne Treibhauswirkung (rote Kurve) und tatsächliche Ausstrahlung aufgrund der Wirkung der Treibhausgase(blaue Fläche); rechts (b): Wellenlängenbereiche, in denen die angegebenen Treibhausgase die | 1 |
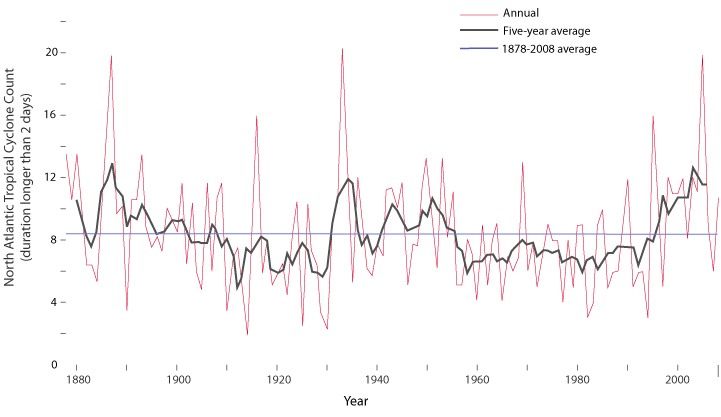
| 14:51, 13. Dez. 2020 | AdjustedTCCount 1878-2008.png (Datei) |  |
34 KB | Dieter Kasang | Jährliche tropische Wirbelstürme im tropischen N-Atlantik 1878-2010. Stürme von weniger als 2 Tagen wurden ausgelassen und Stürme, die vor der Satellitenbeobachtung nicht erfasst wurden, hinzugefügt (s. Text). Rote Linie: Jahresmittel, schwarze Linie: 5-Jahresmittel, blaue Linie: Durchschnitt der Periode 1878-2008 ==Lizenzhinweis== {| style="border:1px solid #8888aa; background-color:#f7f8ff;padding:5px;font-size:95%;" | Quelle: Scott, M., NOAA Climate.gov (2010): Will Hurricanes Change as the… | 1 |
| 19:35, 18. Mär. 2010 | Aedes aegypti.jpg (Datei) |  |
31 KB | Dieter Kasang | Die Mücke Aedes Aegypti beim Blutmahl http://de.wikipedia.org/w/index.php?title=Datei:Aedes_aegypti_during_blood_meal.jpg&filetimestamp=20060607084836 | 1 |
| 19:03, 2. Jun. 2008 | Aerosol-antrieb indischer ozean.gif (Datei) |  |
9 KB | Dieter Kasang | Veränderung der Strahlungsbilanz durch natürliche und anthropogene Aerosole über dem Indischen Ozean: direkter und indirekter Effekt gemittelt zwischen 40° Ost und 100° West. In den verschmutzten Regionen nördlich des Äquators sind die untere Atmos | 1 |
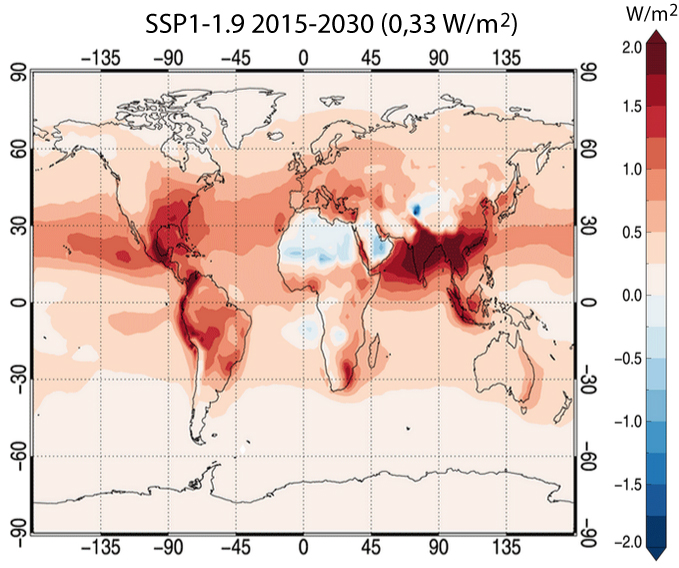
| 15:55, 30. Okt. 2023 | Aerosol-radiation-SSP1-2030.jpg (Datei) |  |
251 KB | Dieter Kasang | Strahlungsantrieb durch Aerosole bis 2030 nach dem SSP-Szenario SSP1-1.9, verändert ==Lizenzhinweis== {| style="border:1px solid #8888aa; background-color:#f7f8ff;padding:5px;font-size:95%;" | Quelle: Lund, M. T., Myhre, G., and Samset, B. H.: Anthropogenic aerosol forcing under the Shared Socioeconomic Pathways, Atmos. Chem. Phys., 19, 13827–13839, https://doi.org/10.5194/acp-19-13827-2019<br> Lizenz: [https://creativecommons.org/licenses/by/4.0/deed.de CC BY] |} | 1 |
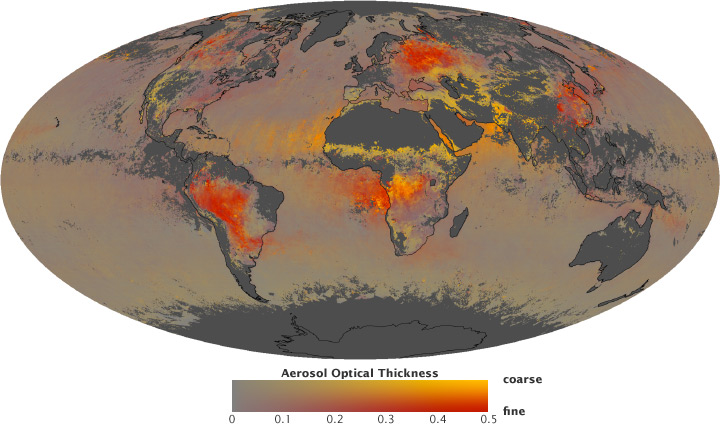
| 21:46, 7. Mai 2020 | Aerosol AOD.jpg (Datei) |  |
99 KB | Dieter Kasang | Globale Verteilung von Aerosolen und der Anteil von großen und kleinen Aerosolen. ==Lizenzhinweis== {| style="border:1px solid #8888aa; background-color:#f7f8ff;padding:5px;font-size:95%;" | Quelle: NASA Earth Observatory (2010): [https://earthobserva… | 1 |
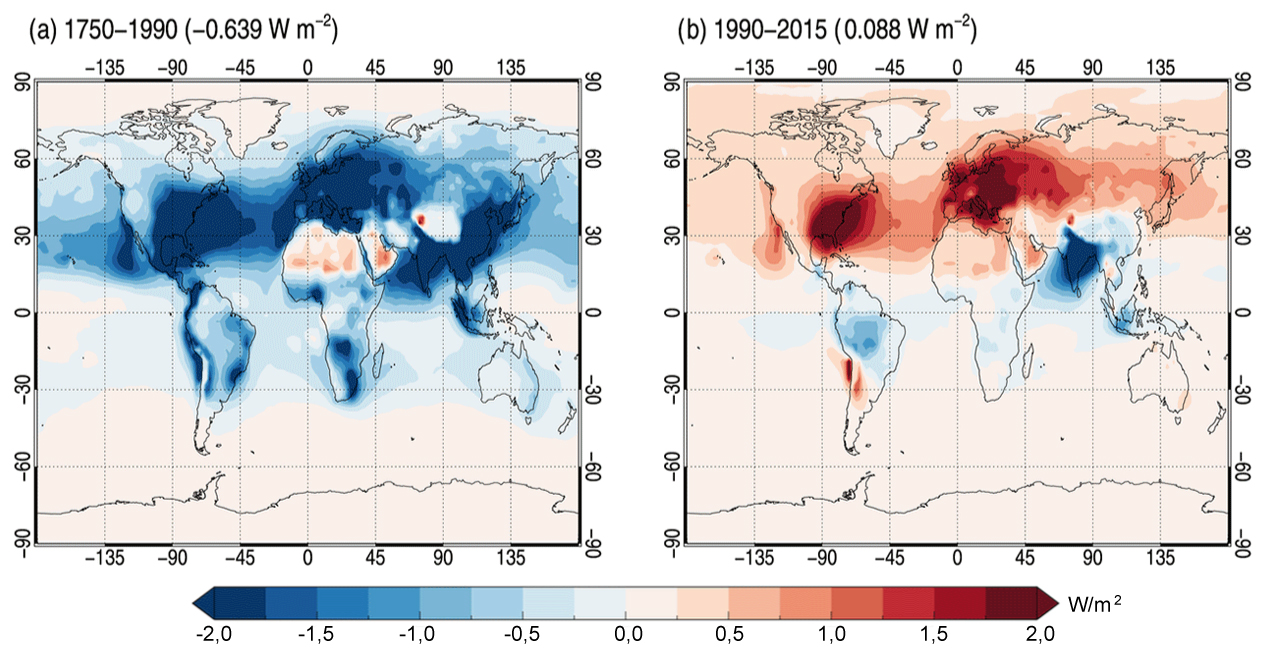
| 21:59, 7. Mai 2020 | Aerosol RF 1750-1990-2015.jpg (Datei) |  |
526 KB | Dieter Kasang | Strahlungsantrieb durch Aerosole 1750-1990 (links) und 1990-2015 (rechts) ==Lizenzhinweis== {| style="border:1px solid #8888aa; background-color:#f7f8ff;padding:5px;font-size:95%;" | Quelle: Lund, M. T., Myhre, G., and Samset, B. H.: Anthropogenic aer… | 1 |
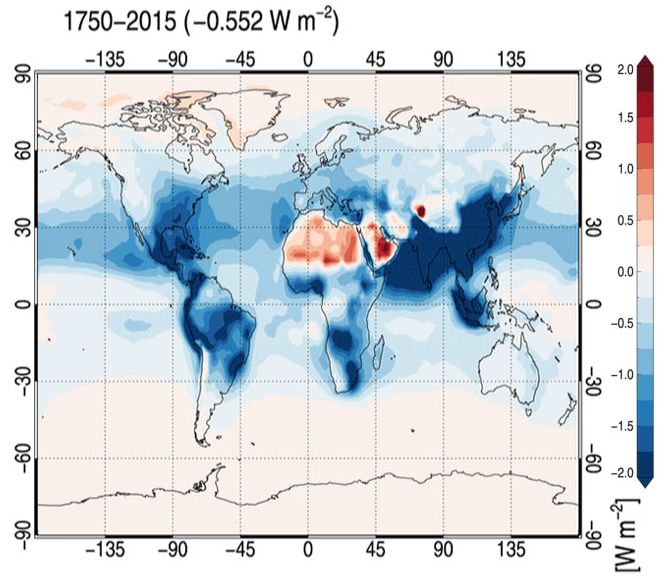
| 19:06, 12. Mai 2020 | Aerosol RF 1750-2015.jpg (Datei) |  |
66 KB | Dieter Kasang | Veränderung des Strahlungsantriebs durch Aerosole 1750-2015 == Lizenzhinweis == {| style="border:1px solid #8888aa; background-color:#f7f8ff;padding:5px;font-size:95%;" |Lund, M. T., Myhre, G., and Samset, B. H.: Anthropogenic aerosol forcing under t… | 1 |
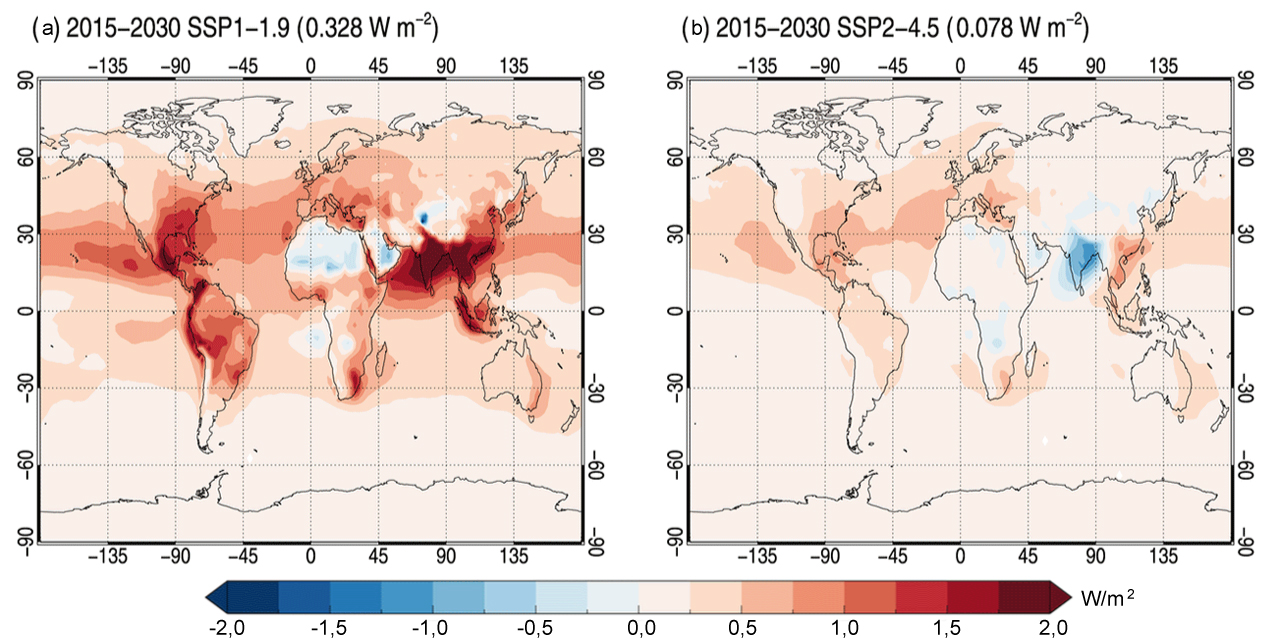
| 22:06, 7. Mai 2020 | Aerosol RF SSP1-2 2030.jpg (Datei) |  |
489 KB | Dieter Kasang | Strahlungsantrieb durch Aerosole bis 2030 nach zwei SSP-Szenarien ==Lizenzhinweis== {| style="border:1px solid #8888aa; background-color:#f7f8ff;padding:5px;font-size:95%;" | Quelle: Lund, M. T., Myhre, G., and Samset, B. H.: Anthropogenic aerosol forc… | 1 |
| 12:43, 19. Aug. 2022 | Aerosol forcing1860-2100.jpg (Datei) |  |
36 KB | Dieter Kasang | == Beschreibung == Strahlungsantrieb von Aerosolen historisch ab 1860 und nach Szenarien bis 2100 ==Lizenzhinweis== {| style="border:1px solid #8888aa; background-color:#f7f8ff;padding:5px;font-size:95%;" | Quelle: Westervelt, D. M., Horowitz, L. W., Naik, V., Golaz, J.-C., and Mauzerall, D. L.: [https://doi.org/10.5194/acp-15-12681-2015 Radiative forcing and climate response to projected 21st century aerosol decreases], Atmos. Chem. Phys., 15, 12681–12703<br> Lizenz: [https://creativecommons.o… | 1 |
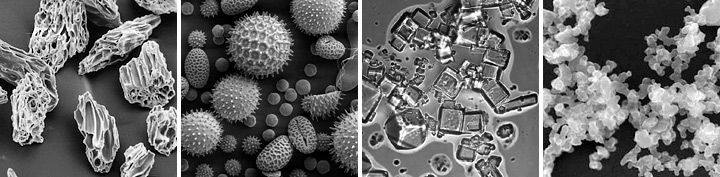
| 21:39, 7. Mai 2020 | Aerosol micrographs.jpg (Datei) | 66 KB | Dieter Kasang | Arten von Aerosolen unter dem Elektronik-Mikroskop (von links nach rechts): vulkanische Asche, Pollen, Meersalz, Ruß. ==Lizenzhinweis== {| style="border:1px solid #8888aa; background-color:#f7f8ff;padding:5px;font-size:95%;" | Quelle: NASA Earth Obser… | 1 | |
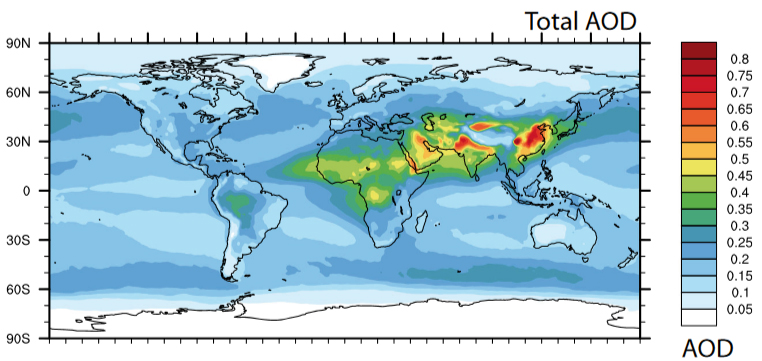
| 17:47, 10. Nov. 2018 | Aerosol optical depth2010.jpg (Datei) |  |
185 KB | Dieter Kasang | Aerosol optische Dicke (AOD) 2010 ==Lizenzhinweis== {| style="border:1px solid #8888aa; background-color:#f7f8ff;padding:5px;font-size:95%;" | Quelle: Tegen, I. & K. Schepanski (2018): Current Climate Change Reports 4, 1. https://doi.org/10.1007/s4064… | 1 |
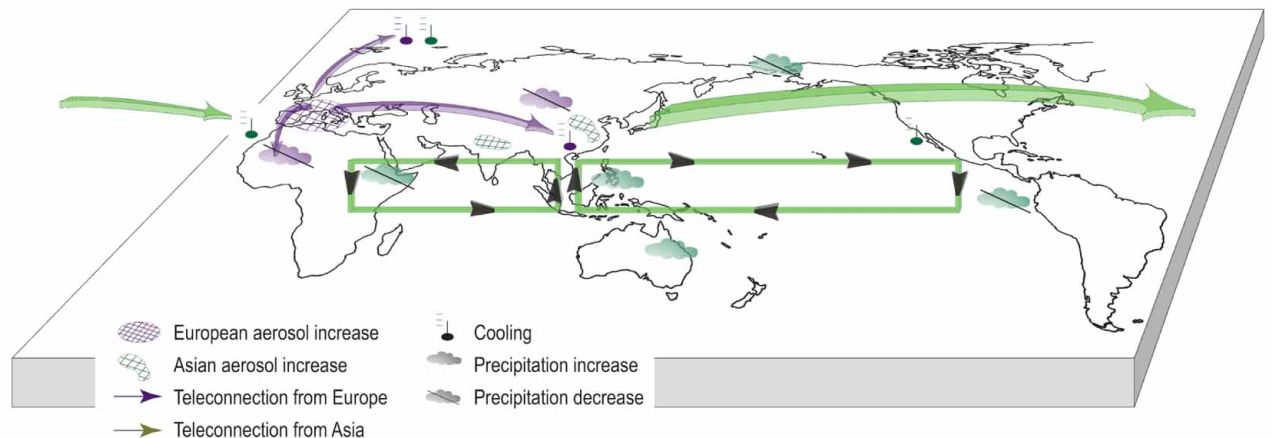
| 14:21, 18. Okt. 2023 | Aerosol teleconnections.jpg (Datei) |  |
60 KB | Dieter Kasang | Fernwirkungen von Aerosolen. Die lila Pfeile zeigen die Fernwirkungen europäischer Aerosole, die grünen Pfeile die von Ostasien. Außerdem ist die Walkerzirkulation als zentraler Transportweg in den Tropen eingezeichnet. == Lizenzhinweis == {| style="border:1px solid #8888aa; background-color:#f7f8ff;padding:5px;font-size:95%;" |Quelle: Persad, G., B.H. Samset and L.J. Wilcox et al. (2023): Rapidly evolving aerosol emissions are a dangerous omission from near-term climate risk assessments, Envir… | 1 |
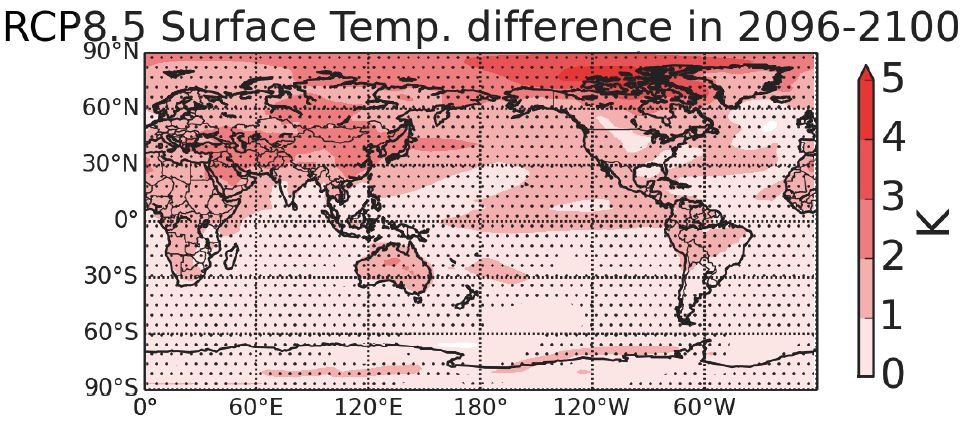
| 12:35, 19. Aug. 2022 | Aerosol temp 2100 RCP8.5.jpg (Datei) |  |
128 KB | Dieter Kasang | == Beschreibung == Regionale Veränderung der Temperatur durch Aerosolabnahme 2096-2100 im Vergleich zu 2005 nach dem Szenario RCP8.5 ==Lizenzhinweis== {| style="border:1px solid #8888aa; background-color:#f7f8ff;padding:5px;font-size:95%;" | Quelle: Westervelt, D. M., Horowitz, L. W., Naik, V., Golaz, J.-C., and Mauzerall, D. L.: [https://doi.org/10.5194/acp-15-12681-2015 Radiative forcing and climate response to projected 21st century aerosol decreases], Atmos. Chem. Phys., 15, 12681–12703<br>… | 1 |
| 12:32, 19. Aug. 2022 | Aerosol temp 2100 RCP8.5 E-Asia.jpg (Datei) |  |
48 KB | Dieter Kasang | == Beschreibung == Temperaturzunahme durch den Rückgang der Aerosolemissionen bis 2100 nach verschiedenen Szenarien in Ostasien ==Lizenzhinweis== {| style="border:1px solid #8888aa; background-color:#f7f8ff;padding:5px;font-size:95%;" | Quelle: Westervelt, D. M., Horowitz, L. W., Naik, V., Golaz, J.-C., and Mauzerall, D. L.: [https://doi.org/10.5194/acp-15-12681-2015 Radiative forcing and climate response to projected 21st century aerosol decreases], Atmos. Chem. Phys., 15, 12681–12703<br> Lize… | 1 |
| 12:28, 19. Aug. 2022 | Aerosol temp RCP 2100.jpg (Datei) |  |
43 KB | Dieter Kasang | Temperaturzunahme durch den Rückgang der Aerosolemissionen bis 2100 nach verschiedenen Szenarien ==Lizenzhinweis== {| style="border:1px solid #8888aa; background-color:#f7f8ff;padding:5px;font-size:95%;" | Quelle: Westervelt, D. M., Horowitz, L. W., Naik, V., Golaz, J.-C., and Mauzerall, D. L.: Radiative forcing and climate response to projected 21st century aerosol decreases, Atmos. Chem. Phys., 15, 12681–12703, https://doi.org/10.5194/acp-15-12681-2015 <br> Lizenz: CC BY https://creativecommo… | 1 |
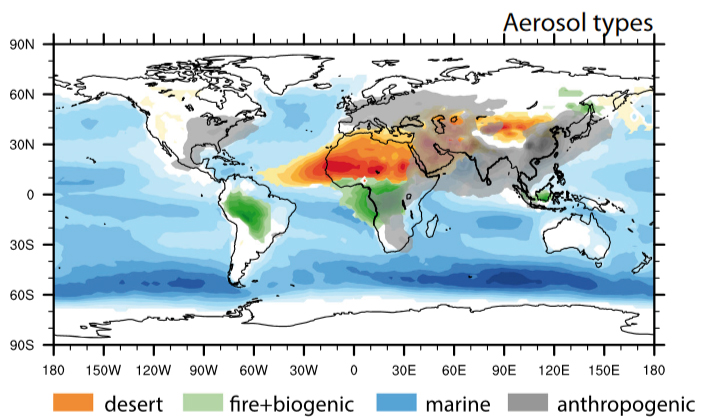
| 17:52, 10. Nov. 2018 | Aerosol types.jpg (Datei) |  |
181 KB | Dieter Kasang | Regional dominierende Aerosol-Arten ==Lizenzhinweis== {| style="border:1px solid #8888aa; background-color:#f7f8ff;padding:5px;font-size:95%;" | Quelle: Tegen, I. & K. Schepanski (2018): [https://doi.org/10.1007/s40641-018-0086-1 Climate Feedback on Ae… | 1 |