Dateiliste
Aus Klimawandel
Diese Spezialseite listet alle hochgeladenen Dateien auf.
| Datum | Name | Vorschaubild | Größe | Benutzer | Beschreibung | Versionen |
|---|---|---|---|---|---|---|
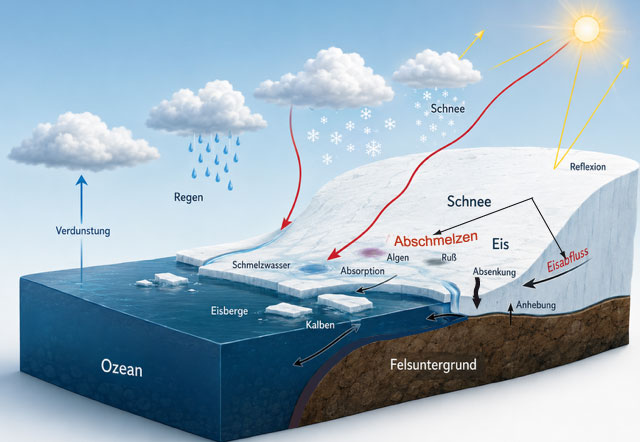
| 09:15, 10. Jul. 2026 | Grönland-Prozesse.jpg (Datei) |  |
52 KB | Dieter Kasang (Diskussion | Beiträge) | 2 | |
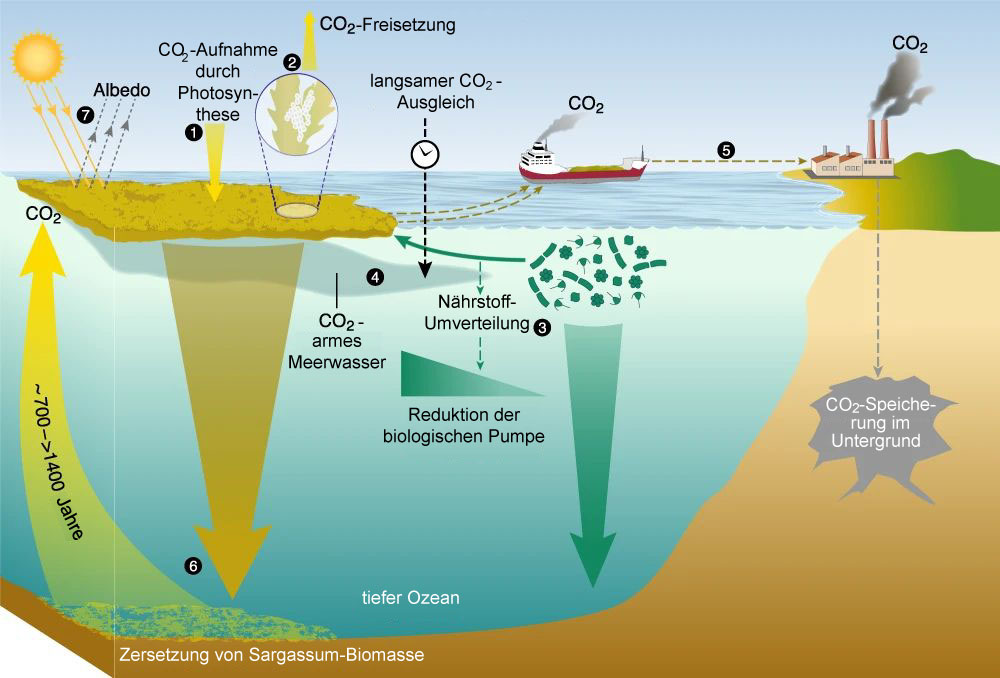
| 16:03, 8. Jul. 2026 | CDR-efficacy-Sargassum-dt.jpg (Datei) |  |
93 KB | Dieter Kasang (Diskussion | Beiträge) | == Beschreibung == CDR-Effekte durch Sargassum, übersetzt ==Lizenzhinweis== {| style="border:1px solid #8888aa; background-color:#f7f8ff;padding:5px;font-size:95%;" |Quelle: Bach, L.T., V. Tamsitt, J. Gower et al. (2021): [https://doi.org/10.1038/s41467-021-22837-2 Testing the climate intervention potential of ocean afforestation using the Great Atlantic Sargassum Belt]. Nat Commun 12, 2556 <br> Lizenz: CC BY |} | 1 |
| 17:09, 7. Jul. 2026 | Clipboard 07-07-2026 01 sm.jpg (Datei) |  |
37 KB | Dieter Kasang (Diskussion | Beiträge) | 3 | |
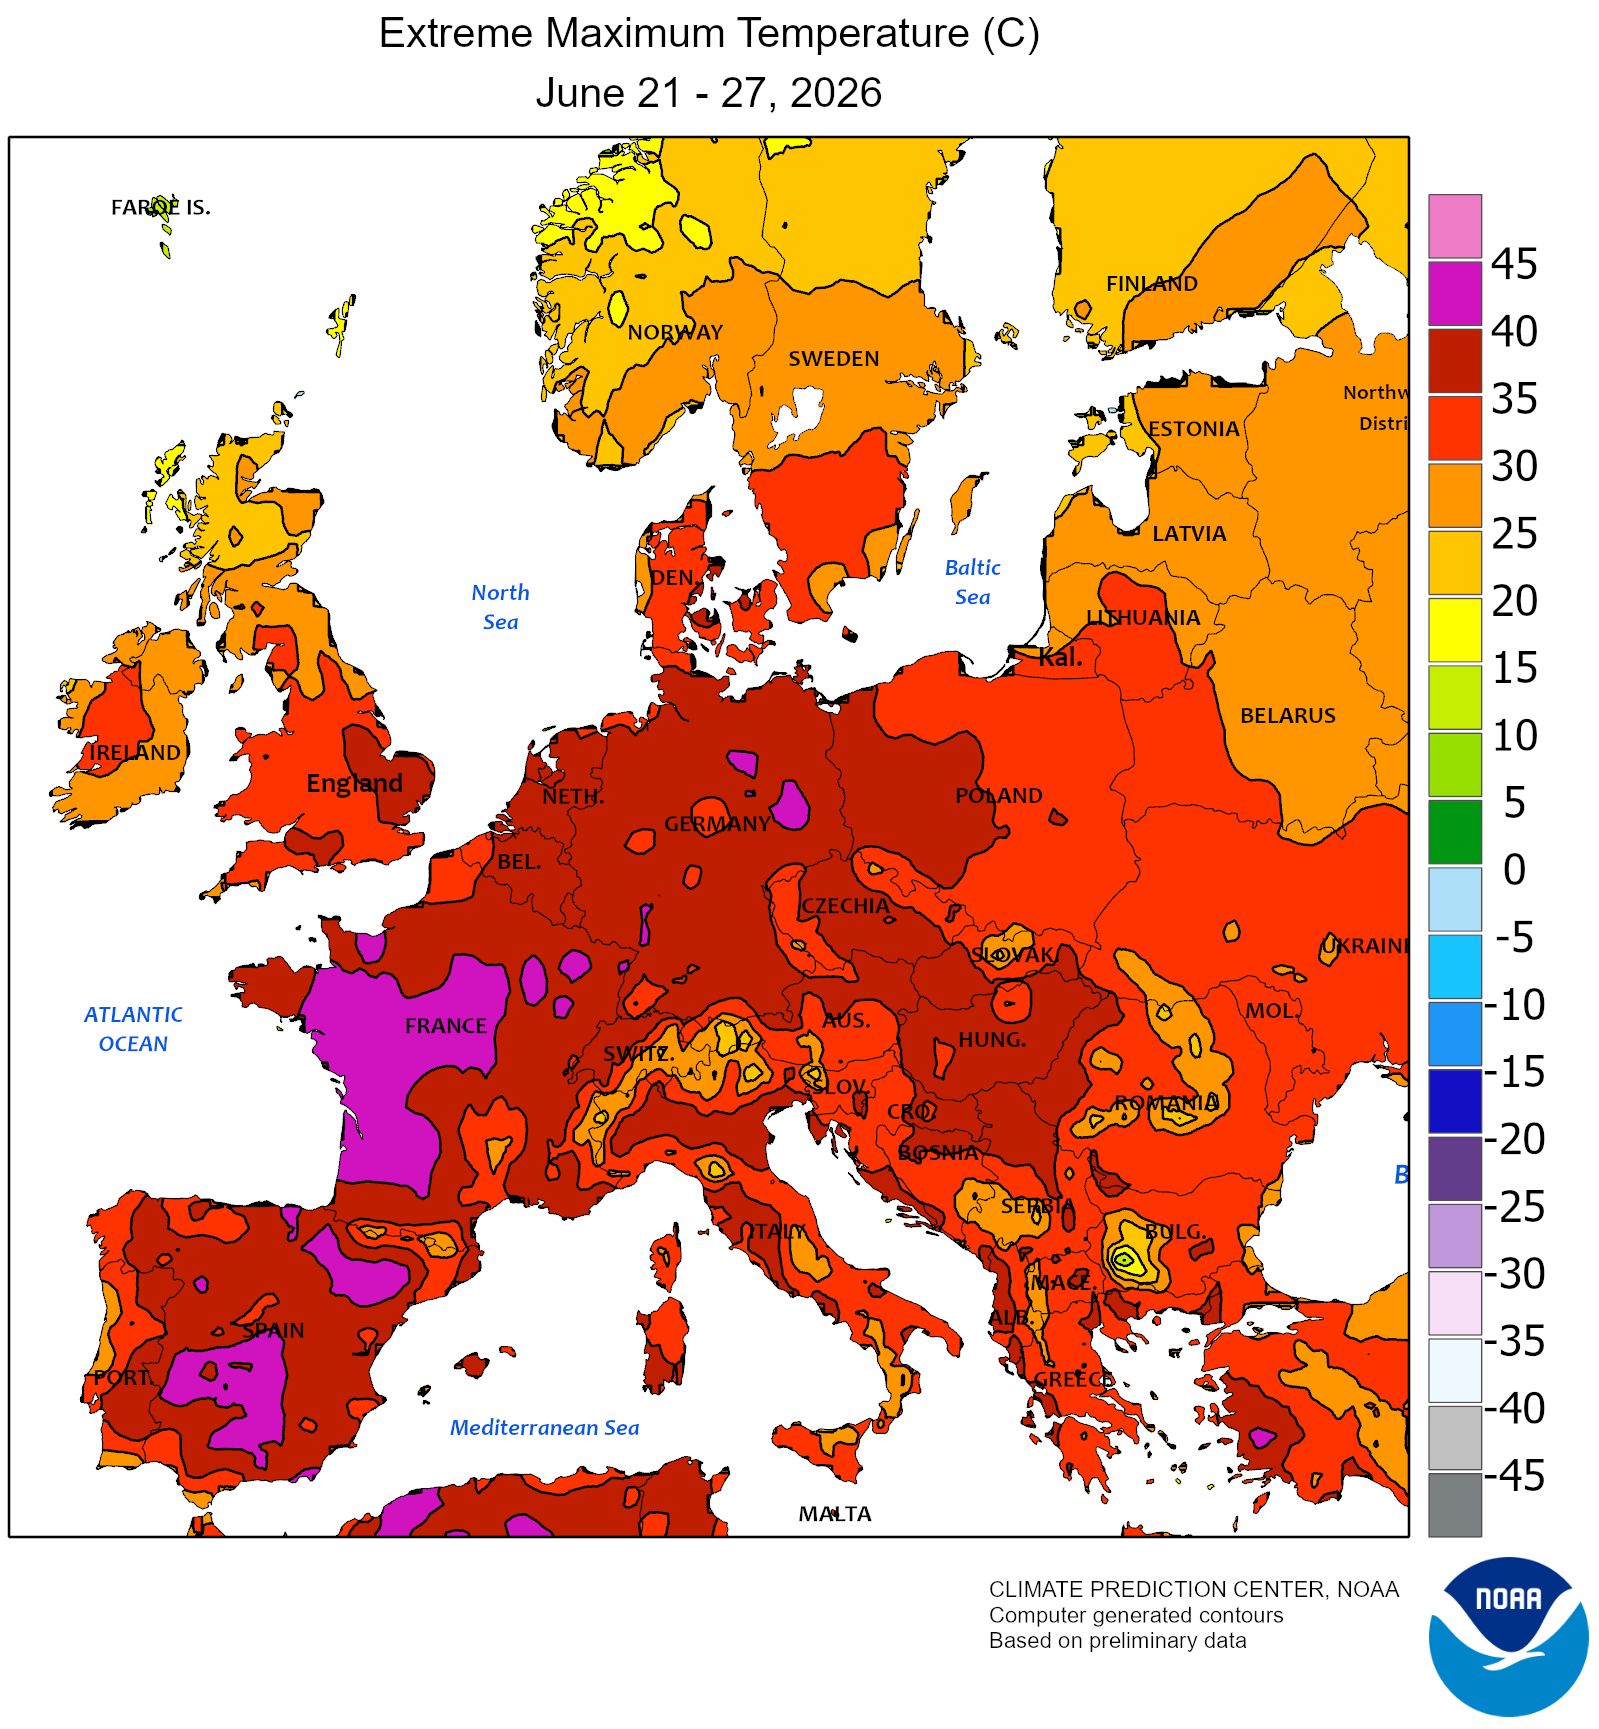
| 16:41, 7. Jul. 2026 | Hitzewelle-Juni-2026.jpg (Datei) |  |
111 KB | Dieter Kasang (Diskussion | Beiträge) | == Beschreibung == Maximum-Temperatur vom 21.-27. Juni 2026 in Europa ==Lizenzhinweis== {| style="border:1px solid #8888aa; background-color:#f7f8ff;padding:5px;font-size:95%;" | Quelle: NOAA (2026): [https://www.cpc.ncep.noaa.gov/products/analysis_monitoring/regional_monitoring/europe.shtml Regional Climate Maps: Europe]; Abbildung: [https://www.cpc.ncep.noaa.gov/products/analysis_monitoring/regional_monitoring/wcmax1.png Extreme Maximum Temperatur June 21.-27.2026] <br> Lizenz: public do… | 1 |
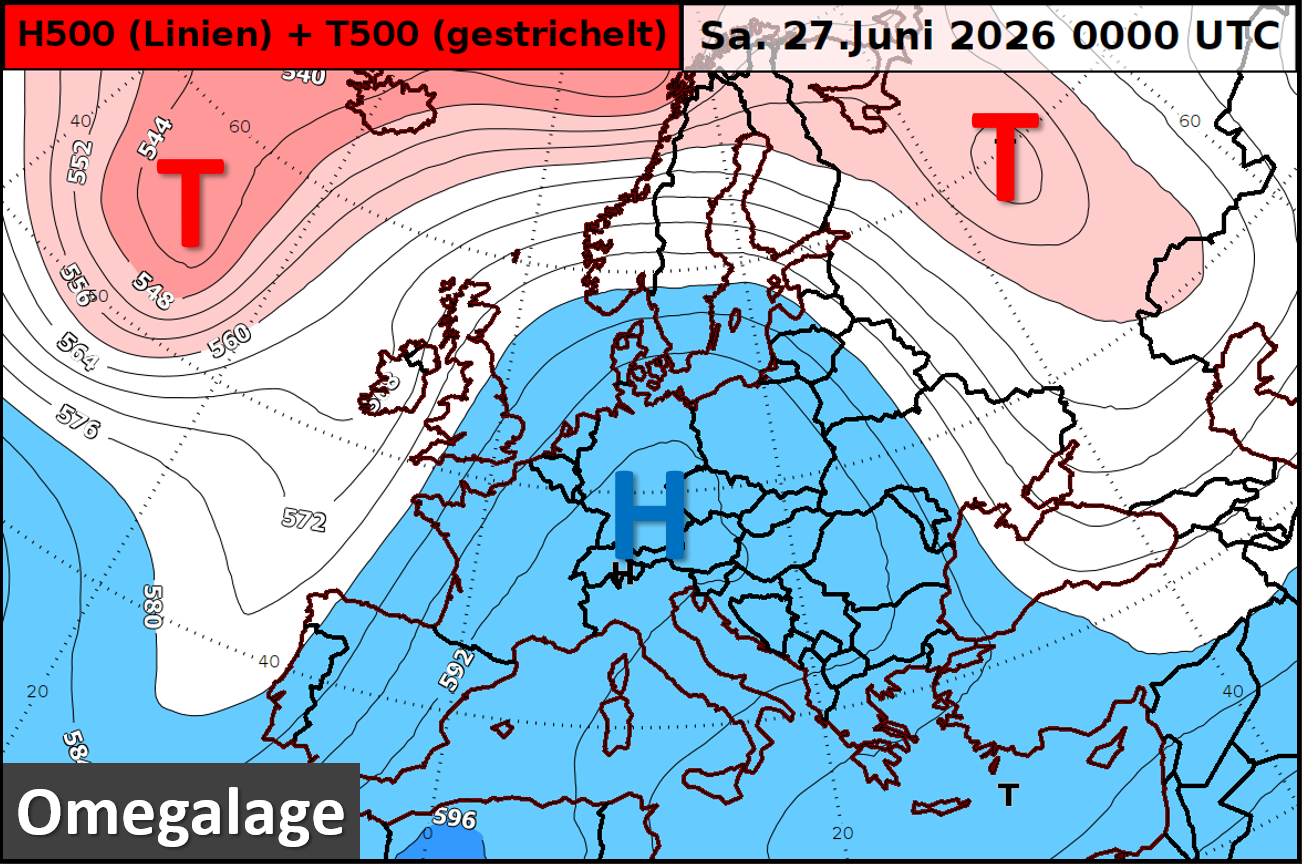
| 13:06, 4. Jul. 2026 | Omega-Lage 27.6.2026.png (Datei) |  |
599 KB | Dieter Kasang (Diskussion | Beiträge) | == Beschreibung == Omega-Lage während der Hitzewelle Ende Juni 2026 ==Lizenzhinweis== {| style="border:1px solid #8888aa; background-color:#f7f8ff;padding:5px;font-size:95%;" | Quelle: DWD (2026): Eine Hitzewelle für die Geschichtsbücher – Eine erste vorläufige Bilanz, https://www.dwd.de/DE/wetter/thema_des_tages/2026/6/28.html <br> Lizenz: [https://creativecommons.org/licenses/by/4.0/ CC BY 4.0] |} | 1 |
| 11:25, 4. Jul. 2026 | Waldbrandgefahr D Juni 2026.png (Datei) |  |
15 KB | Dieter Kasang (Diskussion | Beiträge) | == Beschreibung == Waldbrandgefahrenindex für den 28.6.2026 ==Lizenzhinweis== {| style="border:1px solid #8888aa; background-color:#f7f8ff;padding:5px;font-size:95%;" | Quelle: DWD (2026): Wie das Wetter die Waldbrandgefahr bestimmt, https://www.dwd.de/DE/wetter/thema_des_tages/2026/6/29.html <br> Lizenz: CC BY 4.0 https://creativecommons.org/licenses/by/4.0/ |} | 1 |
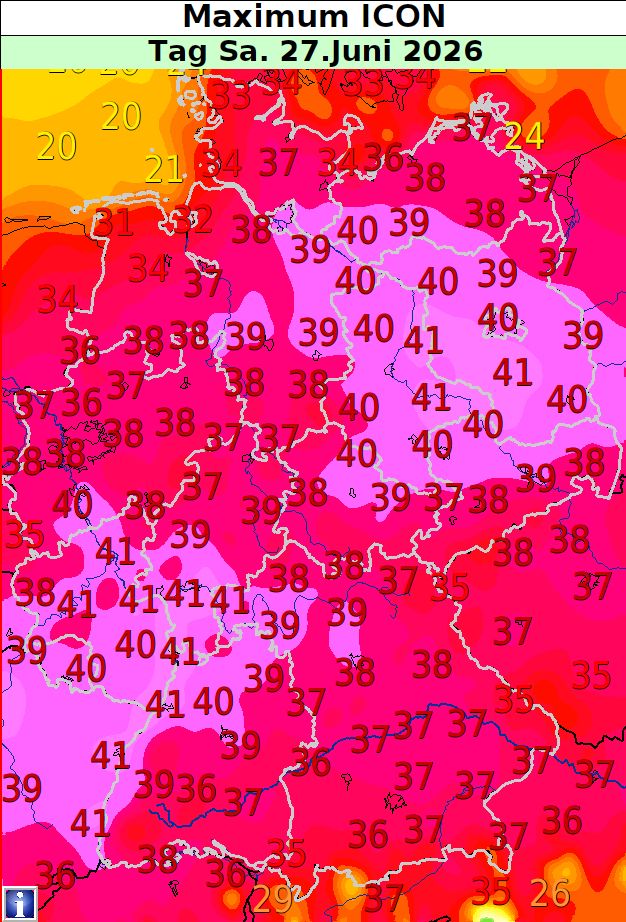
| 11:24, 4. Jul. 2026 | D Maximum-Temp 27.6.2026.jpg (Datei) |  |
153 KB | Dieter Kasang (Diskussion | Beiträge) | == Beschreibung == Vorhersage der Maximumtemperaturen für den 27. Juni 2026 in Deutschland mit dem Modell ICON. ==Lizenzhinweis== {| style="border:1px solid #8888aa; background-color:#f7f8ff;padding:5px;font-size:95%;" | Quelle: DWD (2026): Heiß, heißer, HARTMUT! https://www.dwd.de/DE/wetter/thema_des_tages/2026/6/25.html <br> Lizenz: CC BY 4.0 https://creativecommons.org/licenses/by/4.0/ |} | 1 |
| 11:17, 4. Jul. 2026 | Max Temp Eu 21.-27.6.26.jpg (Datei) |  |
410 KB | Dieter Kasang (Diskussion | Beiträge) | == Beschreibung == Maximum-Temperatur vom 21.-27. Juni 2026 in Europa ==Lizenzhinweis== {| style="border:1px solid #8888aa; background-color:#f7f8ff;padding:5px;font-size:95%;" | Quelle: NOAA (2026): Regional Climate Maps: Europe, https://www.cpc.ncep.noaa.gov/products/analysis_monitoring/regional_monitoring/europe.shtml; Bild: https://www.cpc.ncep.noaa.gov/products/analysis_monitoring/regional_monitoring/wcmax1.png <br> Lizenz: public domain |} | 1 |
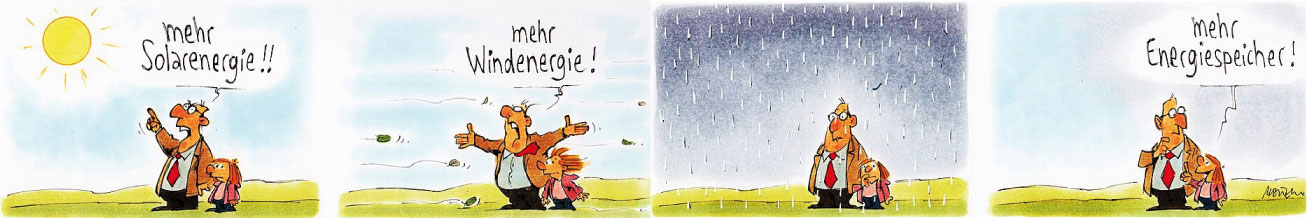
| 15:39, 2. Jul. 2026 | Mester-Energiespeicher2.jpg (Datei) | 76 KB | Dieter Kasang (Diskussion | Beiträge) | == Beschreibung == Karikatur von Gerhard Mester zum Thema Energiespeicher und erneuerbare Energien ==Lizenzhinweis== {| style="border:1px solid #8888aa; background-color:#f7f8ff;padding:5px;font-size:95%;" |Quelle: Wikimedia Commons (2017): Karikatur Gerhard Mester Energiespeicher, https://commons.wikimedia.org/wiki/File:20170313_xl_1911-Karikatur-Gerhard-Mester--Energiespeicher.jpg<br> Lizenz: CC BY-SA https://creativecommons.org/licenses/by-sa/4.0/deed.en |} | 1 | |
| 12:42, 2. Jul. 2026 | Cities without greenery.jpg (Datei) |  |
41 KB | Dieter Kasang (Diskussion | Beiträge) | == Beschreibung == Klima- und Umweltbelastung von Städten ohne Grün == Lizenzhinweis == {| style="border:1px solid #8888aa; background-color:#f7f8ff;padding:5px;font-size:95%;" |Quelle: Azmeer, A., F. Tahir and S.G. Al-Ghamdi (2024): [https://kids.frontiersin.org/articles/10.3389/frym.2024.1419477 Towards SDG 11: How Urban Greenery Can Help Us Build Sustainable Cities]. Front. Young Minds. 12:1419477<br> Lizenz: [http://creativecommons.org/licenses/by/4.0/ CC BY] |} | 1 |
| 12:36, 2. Jul. 2026 | Green City.jpg (Datei) |  |
46 KB | Dieter Kasang (Diskussion | Beiträge) | == Beschreibung == Eine grüne Stadt mit geringer Umweltbelastung == Lizenzhinweis == {| style="border:1px solid #8888aa; background-color:#f7f8ff;padding:5px;font-size:95%;" |Quelle: Azmeer, A., F. Tahir and S.G. Al-Ghamdi (2024): Towards SDG 11: How Urban Greenery Can Help Us Build Sustainable Cities. Front. Young Minds. 12:1419477. doi: 10.3389/frym.2024.1419477<br> Lizenz: [http://creativecommons.org/licenses/by/4.0/ CC BY] |} | 1 |
| 19:49, 1. Jul. 2026 | Scenarios-dt.jpg (Datei) |  |
30 KB | Dieter Kasang (Diskussion | Beiträge) | == Beschreibung == Das Schlimmste vermieden! Das Ziel verfehlt! == Lizenzhinweis == {| style="border:1px solid #8888aa; background-color:#f7f8ff;padding:5px;font-size:95%;" | Quelle: Eigene Darstellung unter Verwendung von Graphiken des [https://mscm.dkrz.de/ Monash Simple Climate Model] (MSCM)<br /> MSCM-Lizenz: CC BY-NC-SA |} | 1 |
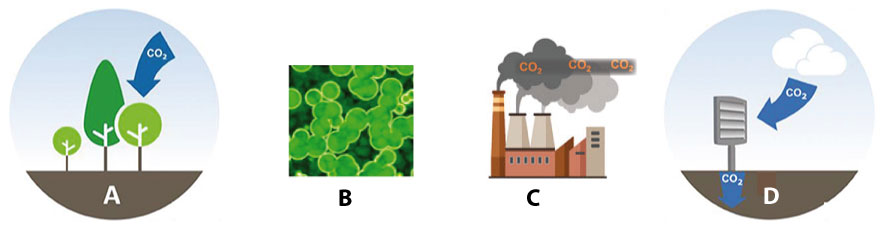
| 12:34, 30. Jun. 2026 | CDR-Methoden.jpg (Datei) |  |
53 KB | Dieter Kasang (Diskussion | Beiträge) | == Beschreibung == Methoden der CO2-Entnahme: A. Aufforstung und Wiederaufforstung, B. Kohlenstoffentnahme durch Mikroalgen, C. Entnahme aus Rauchgasen, D. direkte Kohlenstoffentnahme ==Lizenzhinweis== {| style="border:1px solid #8888aa; background-color:#f7f8ff;padding:5px;font-size:95%;" |Quelle: (1., 3. und 4. Bild:) Fuss S, Jones CD, Schulte I and Vaughan N (2024): Cleaning Up After Ourselves: The Role of Carbon Dioxide Removal. Front. Young Minds. 12:1345470, https://kids.frontiersin.org/a… | 1 |
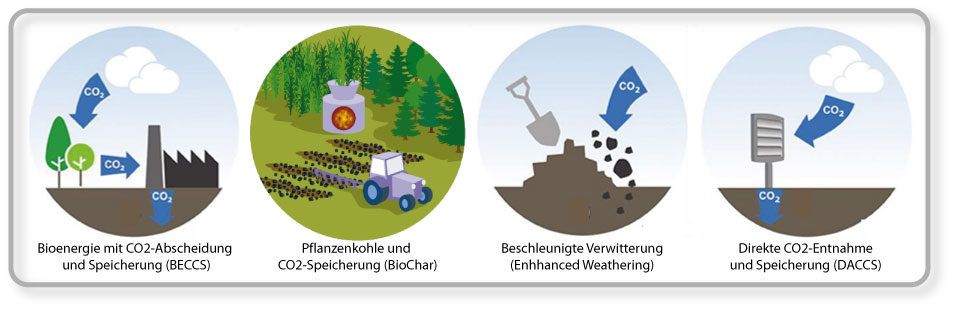
| 12:19, 30. Jun. 2026 | 4-CO2-Entnahmen.jpg (Datei) | 27 KB | Dieter Kasang (Diskussion | Beiträge) | == Beschreibung == Methoden der CO2-Entnahme ==Lizenzhinweis== {| style="border:1px solid #8888aa; background-color:#f7f8ff;padding:5px;font-size:95%;" |Quelle: Fuss S, Jones CD, Schulte I and Vaughan N (2024): Cleaning Up After Ourselves: The Role of Carbon Dioxide Removal. Front. Young Minds. 12:1345470, https://kids.frontiersin.org/articles/10.3389/frym.2024.1345470 <br> Lizenz: CC BY https://creativecommons.org/licenses/by/4.0/ |} | 1 | |
| 10:44, 30. Jun. 2026 | Biochar-process.jpg (Datei) |  |
53 KB | Dieter Kasang (Diskussion | Beiträge) | == Beschreibung == Quellen, Herstellung und Anwendung von Pflanzenkohle == Lizenzhinweis == {| style="border:1px solid #8888aa; background-color:#f7f8ff;padding:5px;font-size:95%;" |Quelle: Zusammengefügt nach: Ayaz, M., S.T. Muntaha, E. Baltrėnaitė-Gedienė et al. (2025): Biochar and carbon-negative technologies: exploring opportunities for climate change mitigation. Biochar 7, 17 https://doi.org/10.1007/s42773-024-00421-3; Bo, X., Z. Zhang, J. Wang et al. (2023): Benefits and limitations of b… | 1 |
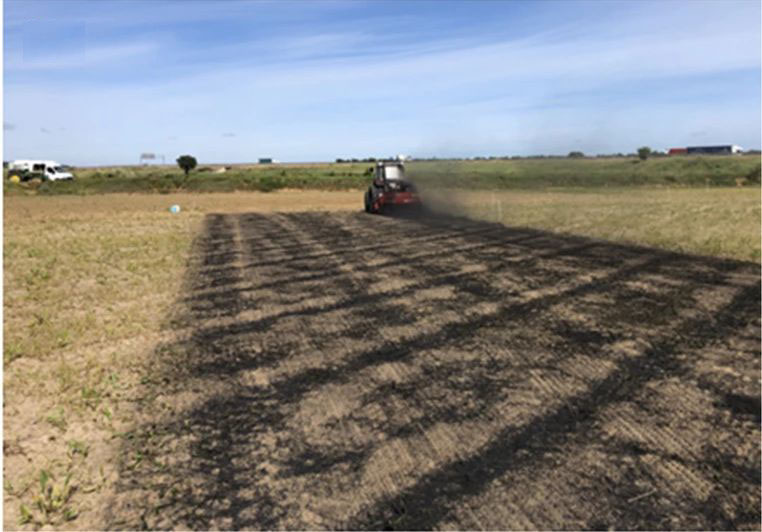
| 19:25, 27. Jun. 2026 | Pflanzenkohle-Ausbringung.jpg (Datei) |  |
72 KB | Dieter Kasang (Diskussion | Beiträge) | == Beschreibung == Ausbringung von Pflanzenkohle beim Reisanbau. == Lizenzhinweis == {| style="border:1px solid #8888aa; background-color:#f7f8ff;padding:5px;font-size:95%;" |Quelle: Vicente, L., D. Peña, D. Fernández et al. (2025): Alternate wetting and drying irrigation with field aged biochar may enhance water and rice productivity. Agron. Sustain. Dev. 45, 6 https://doi.org/10.1007/s13593-024-01000-3<br> Lizenz: CC BY http://creativecommons.org/licenses/by/4.0/ |} | 1 |
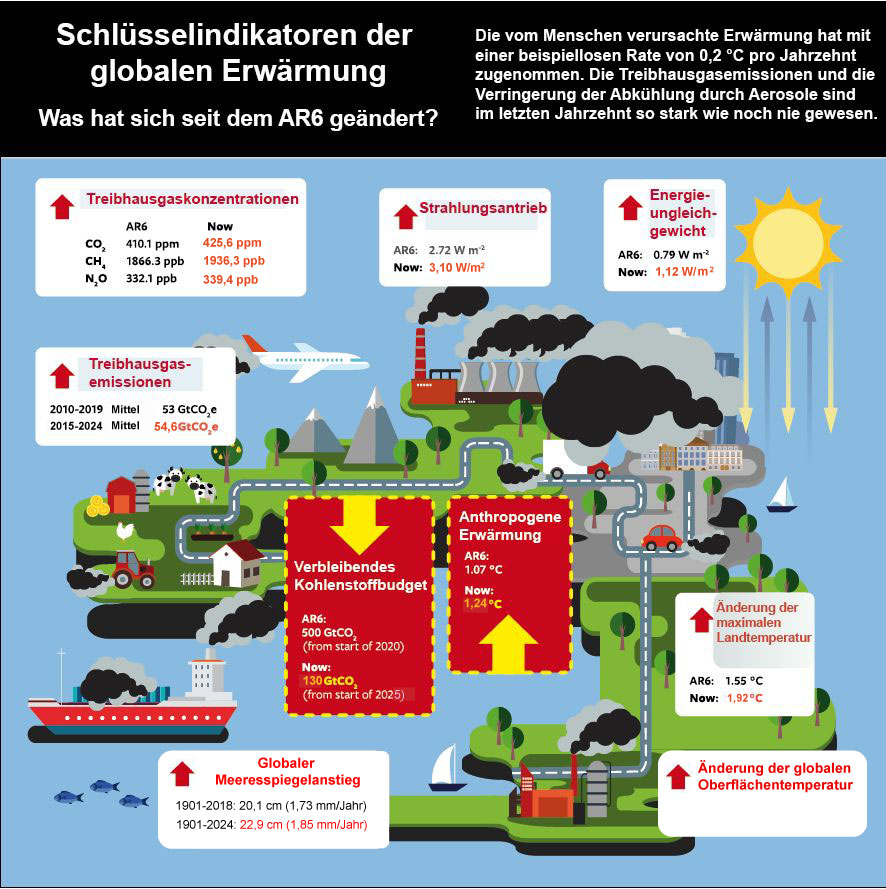
| 09:14, 24. Jun. 2026 | Klimaindikatoren-2025-Startseite.jpg (Datei) |  |
81 KB | Dieter Kasang (Diskussion | Beiträge) | == Beschreibung == Überblick über Schlüsselindikatoren der globalen Erwärmung. Übersicht über Schlüsselindikatoren des anthropogenen Klimawandels. AR6 = 6. Bericht des Weltklimarates IPCC von 2021<ref>IPCC: [https://www.ipcc.ch/reports/ Reports]</ref> ; Now = 2025. == Lizenzhinweis == {| style="border:1px solid #8888aa; background-color:#f7f8ff;padding:5px;font-size:95%;" | Quelle: Forster, T. Walsh, C. Smith, et al. (2026): [https://doi.org/10.5194/essd-18-3889-2026 Indicators of Global Clim… | 1 |
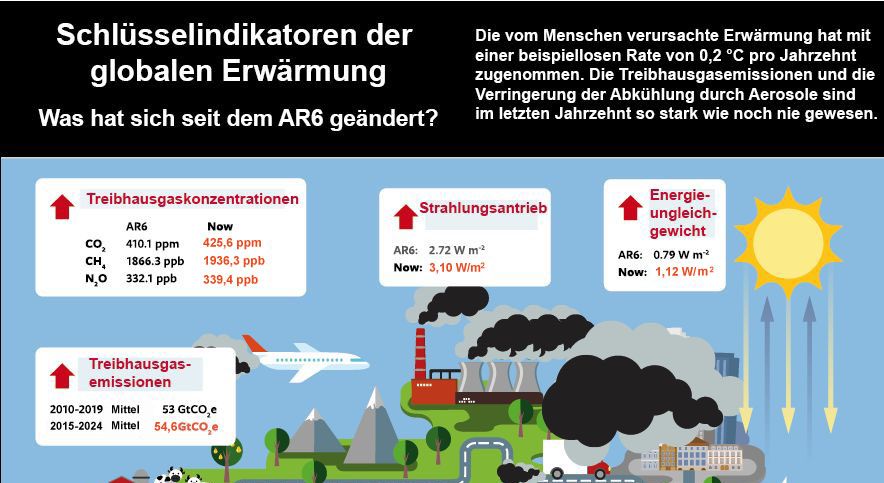
| 11:17, 23. Jun. 2026 | Klimaindikatoren-2025-dt.jpg (Datei) |  |
185 KB | Dieter Kasang (Diskussion | Beiträge) | == Beschreibung == Überblick über Schlüsselindikatoren der globalen Erwärmung. Übersicht über Schlüsselindikatoren des anthropogenen Klimawandels. AR6 = 6. Bericht des Weltklimarates IPCC von 2021<ref>IPCC: [https://www.ipcc.ch/reports/ Reports]</ref> ; Now = 2024. == Lizenzhinweis == {| style="border:1px solid #8888aa; background-color:#f7f8ff;padding:5px;font-size:95%;" | Quelle: Forster, T. Walsh, C. Smith, et al. (2026): [https://doi.org/10.5194/essd-18-3889-2026 Indicators of Global Clim… | 1 |
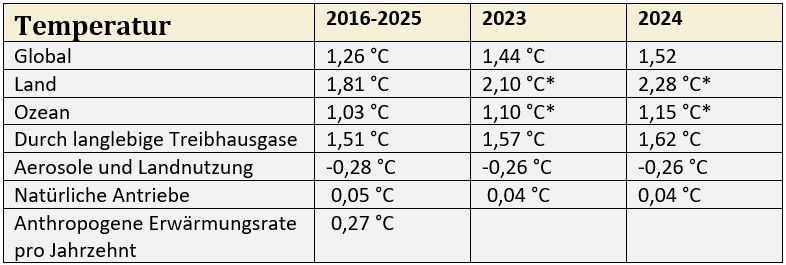
| 10:51, 23. Jun. 2026 | Temperatur 2025.jpg (Datei) |  |
43 KB | Dieter Kasang (Diskussion | Beiträge) | == Beschreibung == Die globale Mitteltemperatur 2015-2024 und 2023 und 2014 und ihre Ursachen im Vergleich zur vorindustriellen Zeit 1850-1900. * Daten nach [https://berkeleyearth.org/global-temperature-report-for-2023/ Berkeley Earth 2023] und [https://berkeleyearth.org/global-temperature-report-for-2024/ 2024] == Lizenzhinweis == {| style="border:1px solid #8888aa; background-color:#f7f8ff;padding:5px;font-size:95%;" | Quelle: Forster, T. Walsh, C. Smith, et al. (2026): [https://doi.org/10.5… | 1 |
| 09:04, 23. Jun. 2026 | Strahlungsantrieb1750-2025.jpg (Datei) |  |
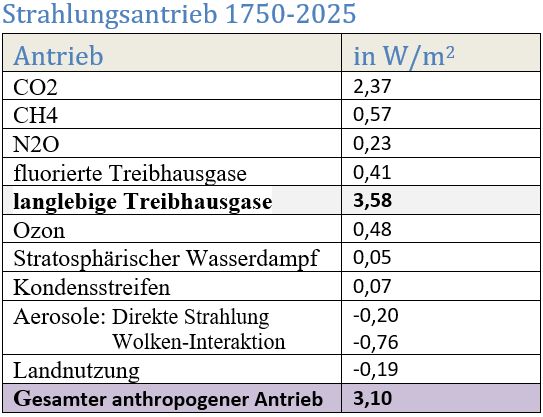
47 KB | Dieter Kasang (Diskussion | Beiträge) | == Beschreibung == Anthropogener Strahlungsantrieb 1750 bis 2024 ==Lizenzhinweis== {| style="border:1px solid #8888aa; background-color:#f7f8ff;padding:5px;font-size:95%;" | Quelle: Forster, T. Walsh, C. Smith, et al. (2026): [https://doi.org/10.5194/essd-18-3889-2026 Indicators of Global Climate Change 2025: annual update of key indicators of the state of the climate system and human influence], Earth System Science Data 18, 6, 3889–3933<br> Lizenz: [https://creativecommons.org/licenses/b… | 2 |
| 19:32, 22. Jun. 2026 | Strahlungsantrieb-1750-2025.jpg (Datei) |  |
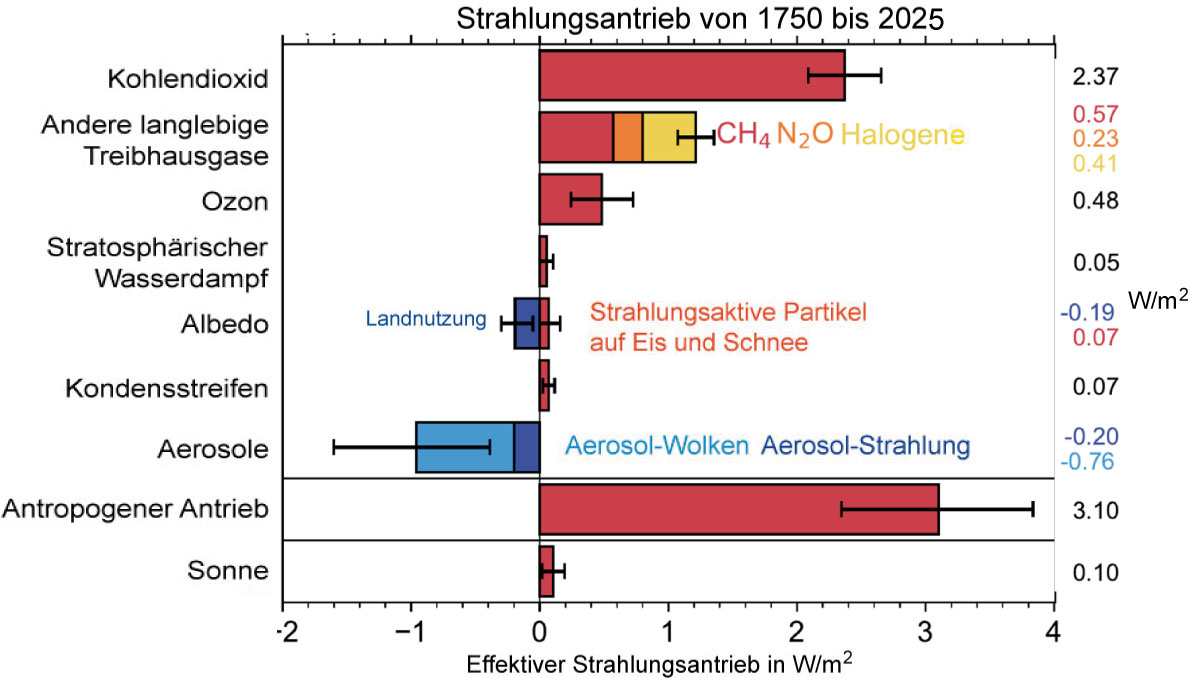
91 KB | Dieter Kasang (Diskussion | Beiträge) | == Beschreibung == Historischer Strahlungsantrieb durch Treibhausgase, Landnutzung, Aerosole und die Sonne 1750 bis 2024 == Lizenzhinweis == {| style="border:1px solid #8888aa; background-color:#f7f8ff;padding:5px;font-size:95%;" | Quelle: Forster, T. Walsh, C. Smith, et al. (2026): [https://doi.org/10.5194/essd-18-3889-2026 Indicators of Global Climate Change 2025: annual update of key indicators of the state of the climate system and human influence], Earth System Science Data 18, 6, 3889–3… | 1 |
| 18:34, 22. Jun. 2026 | THG-Konzentration 2025.jpg (Datei) |  |
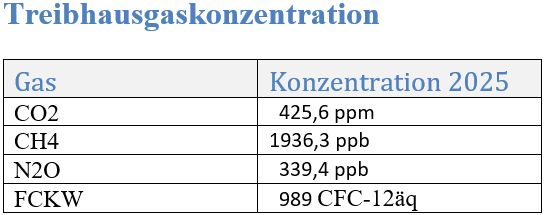
21 KB | Dieter Kasang (Diskussion | Beiträge) | == Beschreibung == Treibhausgas-Konzentration 2024 ==Lizenzhinweis== {| style="border:1px solid #8888aa; background-color:#f7f8ff;padding:5px;font-size:95%;" | Quelle: Forster, T. Walsh, C. Smith, et al. (2026): [https://doi.org/10.5194/essd-18-3889-2026 Indicators of Global Climate Change 2025: annual update of key indicators of the state of the climate system and human influence], Earth System Science Data 18, 6 <br> Lizenz: [https://creativecommons.org/licenses/by/4.0/ CC BY 4.0] |} | 1 |
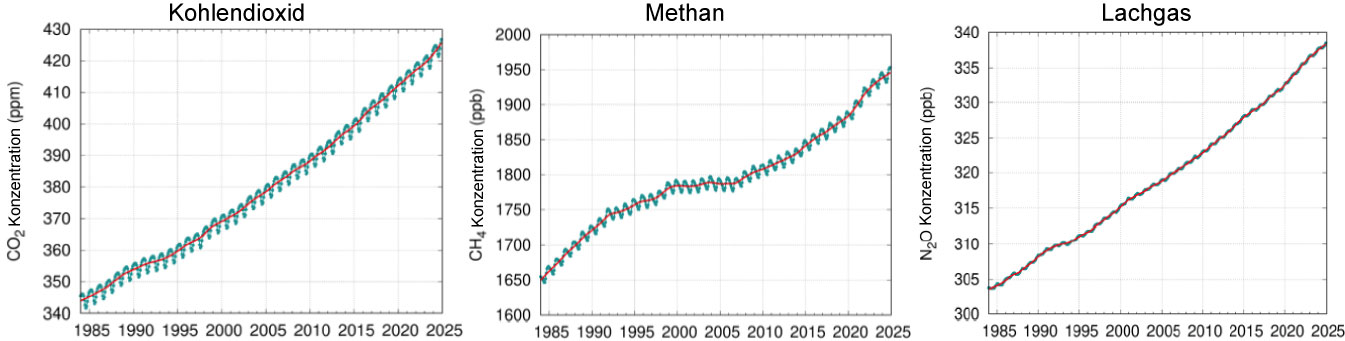
| 17:20, 22. Jun. 2026 | THG-Konzentration-1985-2025.jpg (Datei) | 72 KB | Dieter Kasang (Diskussion | Beiträge) | == Beschreibung == Änderung der globalen Konzentration der drei wichtigsten Treibhausgase Kohlendioxid (CO<sub>2</sub>), Methan (CH<sub>4</sub>) und Distickstoffoxid (N<sub>2</sub>O) 1985 bis 2025. ==Lizenzhinweis== {| style="border:1px solid #8888aa; background-color:#f7f8ff;padding:5px;font-size:95%;" | Quelle: World Meteorological Organization, WMO (2025): [https://wmo.int/files/greenhouse-gas-bulletin-no-21 Greenhouse Gas Bulletin - No. 21]<br> Lizenz: Short extracts from WMO publication… | 1 | |
| 16:41, 22. Jun. 2026 | THG-Emissionen 2000-2024.jpg (Datei) | 20 KB | Dieter Kasang (Diskussion | Beiträge) | 2 | ||
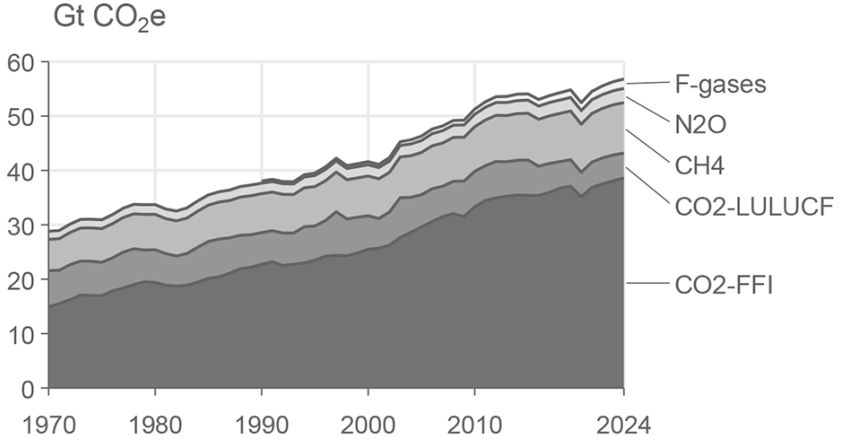
| 15:58, 22. Jun. 2026 | Global THG emissions2024.jpg (Datei) |  |
26 KB | Dieter Kasang (Diskussion | Beiträge) | == Beschreibung == Treibhausgasemissionen 1970 bis 2024. F-gases = fluorierte Kohlenwasserstoffe, N<sub>2</sub>O = Distickstoffoxid, CH<sub>4</sub>= Methan, CO<sub>2</sub>-LULUCF = CO<sub>2</sub> aus Landnutzungsänderungen, CO<sub>2</sub>-FFI = fossile und industrielle CO<sub>2</sub>-Emissionen ==Lizenzhinweis== {| style="border:1px solid #8888aa; background-color:#f7f8ff;padding:5px;font-size:95%;" | Quelle: Forster, T. Walsh, C. Smith, et al. (2026): [https://doi.org/10.5194/essd-18-3889-202… | 1 |
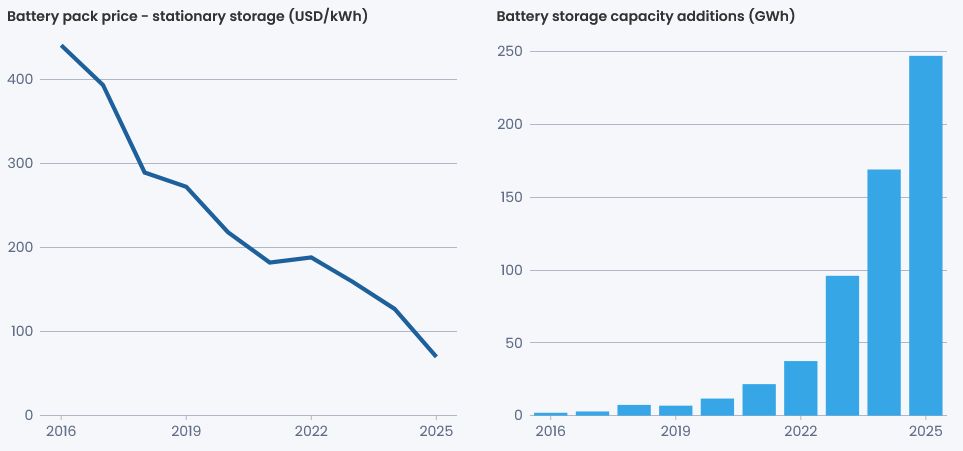
| 15:31, 22. Jun. 2026 | Battery price storage2016-2025.jpg (Datei) |  |
27 KB | Dieter Kasang (Diskussion | Beiträge) | == Beschreibung == Die Batterie-Kosten stürzen ab, die Kapazitäten explodieren. ==Lizenzhinweis== {| style="border:1px solid #8888aa; background-color:#f7f8ff;padding:5px;font-size:95%;" |Quelle:EMBER (2026): Global Electricity Review 2026, https://ember-energy.org/latest-insights/global-electricity-review-2026/<br> Lizenz: CC BY-SA 4.0 |} | 1 |
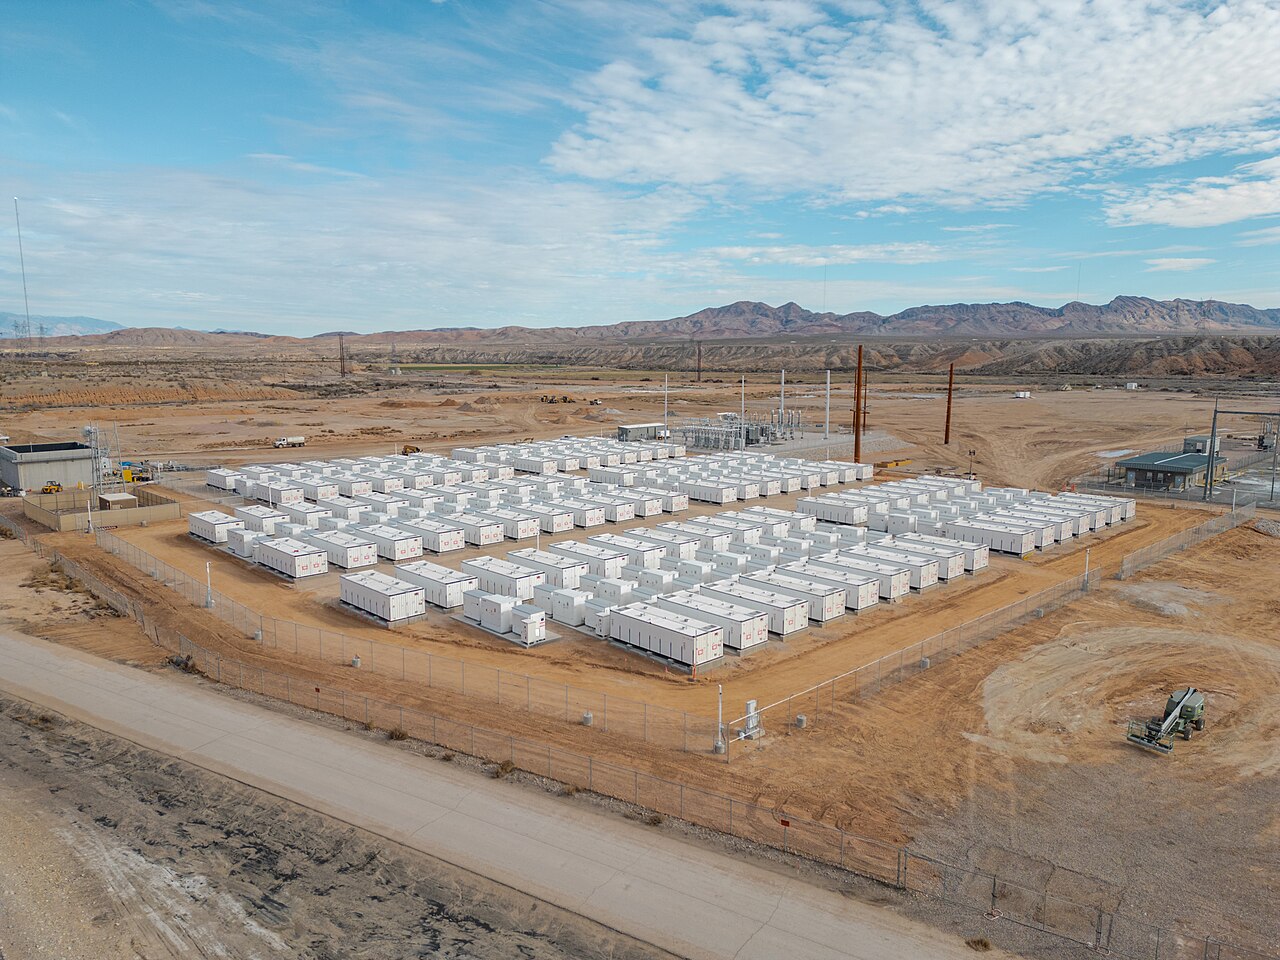
| 15:26, 22. Jun. 2026 | Battery Storage Nevada.jpg (Datei) |  |
310 KB | Dieter Kasang (Diskussion | Beiträge) | == Beschreibung == Batterie-Speicherkraftwerk in Nevada, USA ==Lizenzhinweis== {| style="border:1px solid #8888aa; background-color:#f7f8ff;padding:5px;font-size:95%;" |Quelle: Wikimedia Commons (2025): Reid Gardner Battery Energy Storage project near Moapa, Nevada https://commons.wikimedia.org/wiki/File:Reid_Gardner_BESS.jpg <br> Lizenz: CC 0 |} | 1 |
| 15:20, 22. Jun. 2026 | Windturbine Batterie.jpg (Datei) |  |
91 KB | Dieter Kasang (Diskussion | Beiträge) | == Beschreibung == Windenergie mit Batteriespeicher ==Lizenzhinweis== {| style="border:1px solid #8888aa; background-color:#f7f8ff;padding:5px;font-size:95%;" |Quelle: Pixabay https://pixabay.com/de/illustrations/energie-windturbine-solare-energie-10064887/<br> Lizenz: Pixabay-Lizenz |} | 1 |
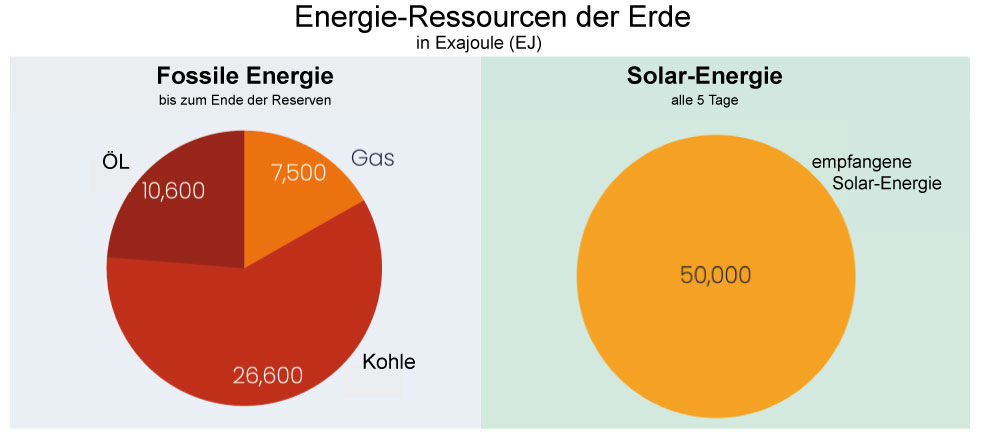
| 10:30, 21. Jun. 2026 | Erde-Energieressourcen.jpg (Datei) |  |
41 KB | Dieter Kasang (Diskussion | Beiträge) | == Beschreibung == Energieressourcen der Erde: Fossile und Solar-Energie == Lizenzhinweis == {| style="border:1px solid #8888aa; background-color:#f7f8ff;padding:5px;font-size:95%;" |Quelle: Walter, D., EMBER (2025): Silos for Sunshine: we’ve mastered harvesting the sun, but storage is the gamechanger, https://ember-energy.org/latest-insights/silos-for-sunshine-weve-mastered-harvesting-the-sun-but-storage-is-the-gamechanger/, verändert<br> Lizenz: CC BY 4.0 |} | 1 |
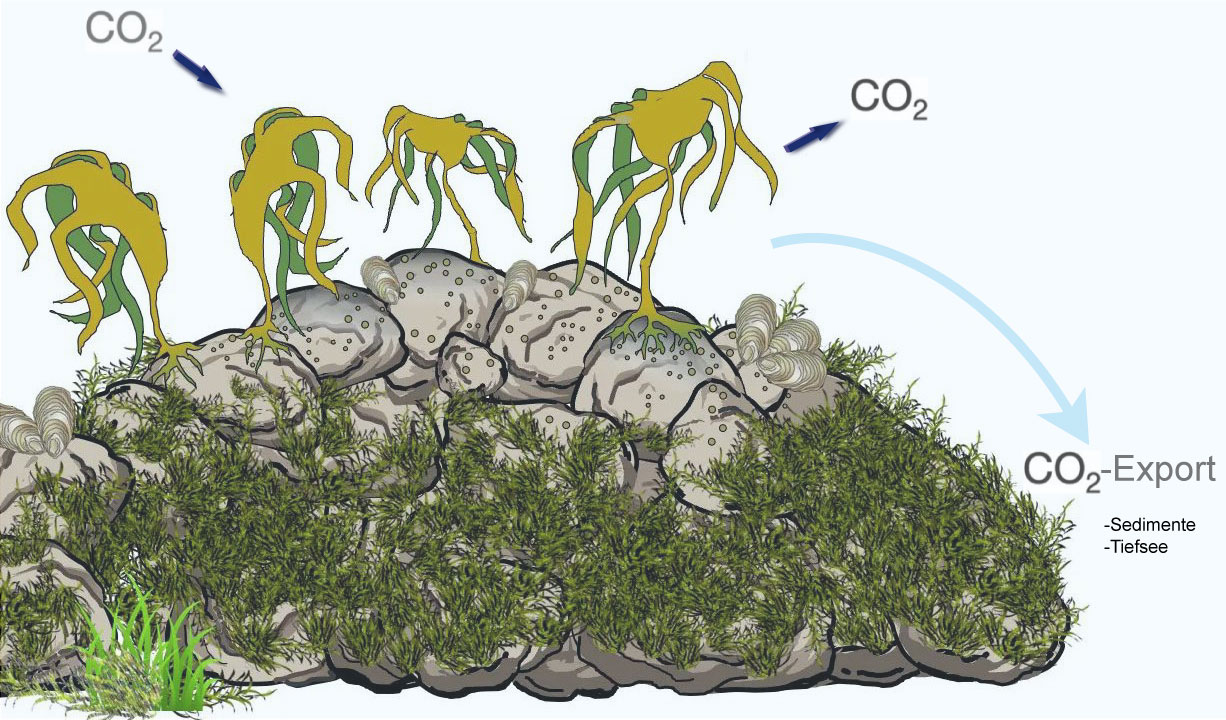
| 09:41, 20. Jun. 2026 | Kelp-CO2-Austausch.jpg (Datei) |  |
235 KB | Dieter Kasang (Diskussion | Beiträge) | 2 | |
| 15:58, 19. Jun. 2026 | Sargassum stranded biomass.jpg (Datei) |  |
54 KB | Dieter Kasang (Diskussion | Beiträge) | == Beschreibung == CDR-Effekte durch Sargassum ==Lizenzhinweis== {| style="border:1px solid #8888aa; background-color:#f7f8ff;padding:5px;font-size:95%;" |Quelle: Bach, L.T., V. Tamsitt, J. Gower et al. (2021): Testing the climate intervention potential of ocean afforestation using the Great Atlantic Sargassum Belt. Nat Commun 12, 2556 https://doi.org/10.1038/s41467-021-22837-2<br> Lizenz: CC BY |} | 1 |
| 15:51, 19. Jun. 2026 | CDR efficacy Sargassum.jpg (Datei) |  |
73 KB | Dieter Kasang (Diskussion | Beiträge) | == Beschreibung == CDR-Effekte durch Sargassum ==Lizenzhinweis== {| style="border:1px solid #8888aa; background-color:#f7f8ff;padding:5px;font-size:95%;" |Quelle: Bach, L.T., V. Tamsitt, J. Gower et al. (2021): Testing the climate intervention potential of ocean afforestation using the Great Atlantic Sargassum Belt. Nat Commun 12, 2556 https://doi.org/10.1038/s41467-021-22837-2<br> Lizenz: CC BY |} | 1 |
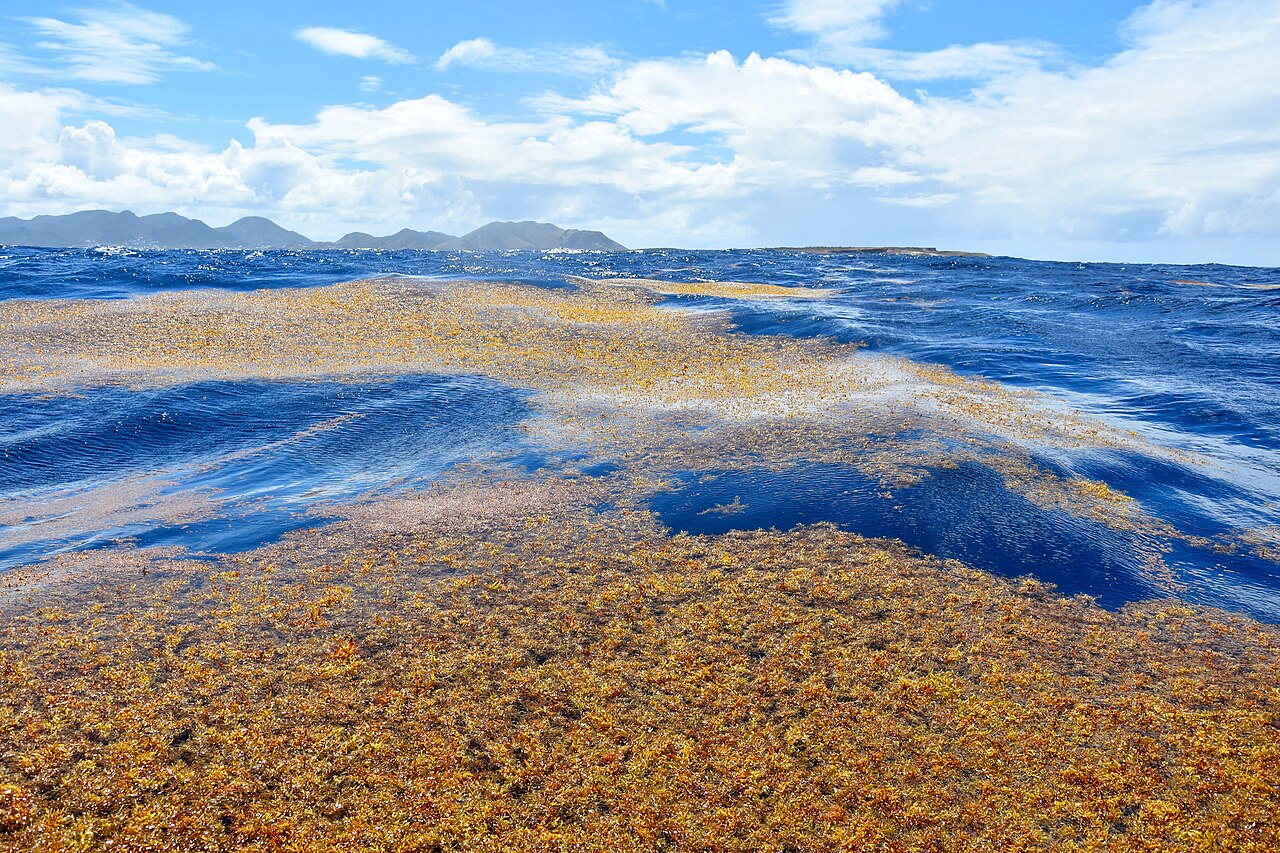
| 15:46, 19. Jun. 2026 | Sargassum St.Martin Antillen.jpg (Datei) |  |
502 KB | Dieter Kasang (Diskussion | Beiträge) | == Beschreibung == Sargassum-Teppiche bei den Antillen ==Lizenzhinweis== {| style="border:1px solid #8888aa; background-color:#f7f8ff;padding:5px;font-size:95%;" |Quelle: Wikimedia Commons (2018): Sargassums arrive en masse, https://commons.wikimedia.org/wiki/File:Sargasses_au_large_de_Tintamare-_RNN_de_Saint_Martin.jpg<br> Lizenz: CC BY-SA 4.0 https://creativecommons.org/licenses/by-sa/4.0/deed.en |} | 1 |
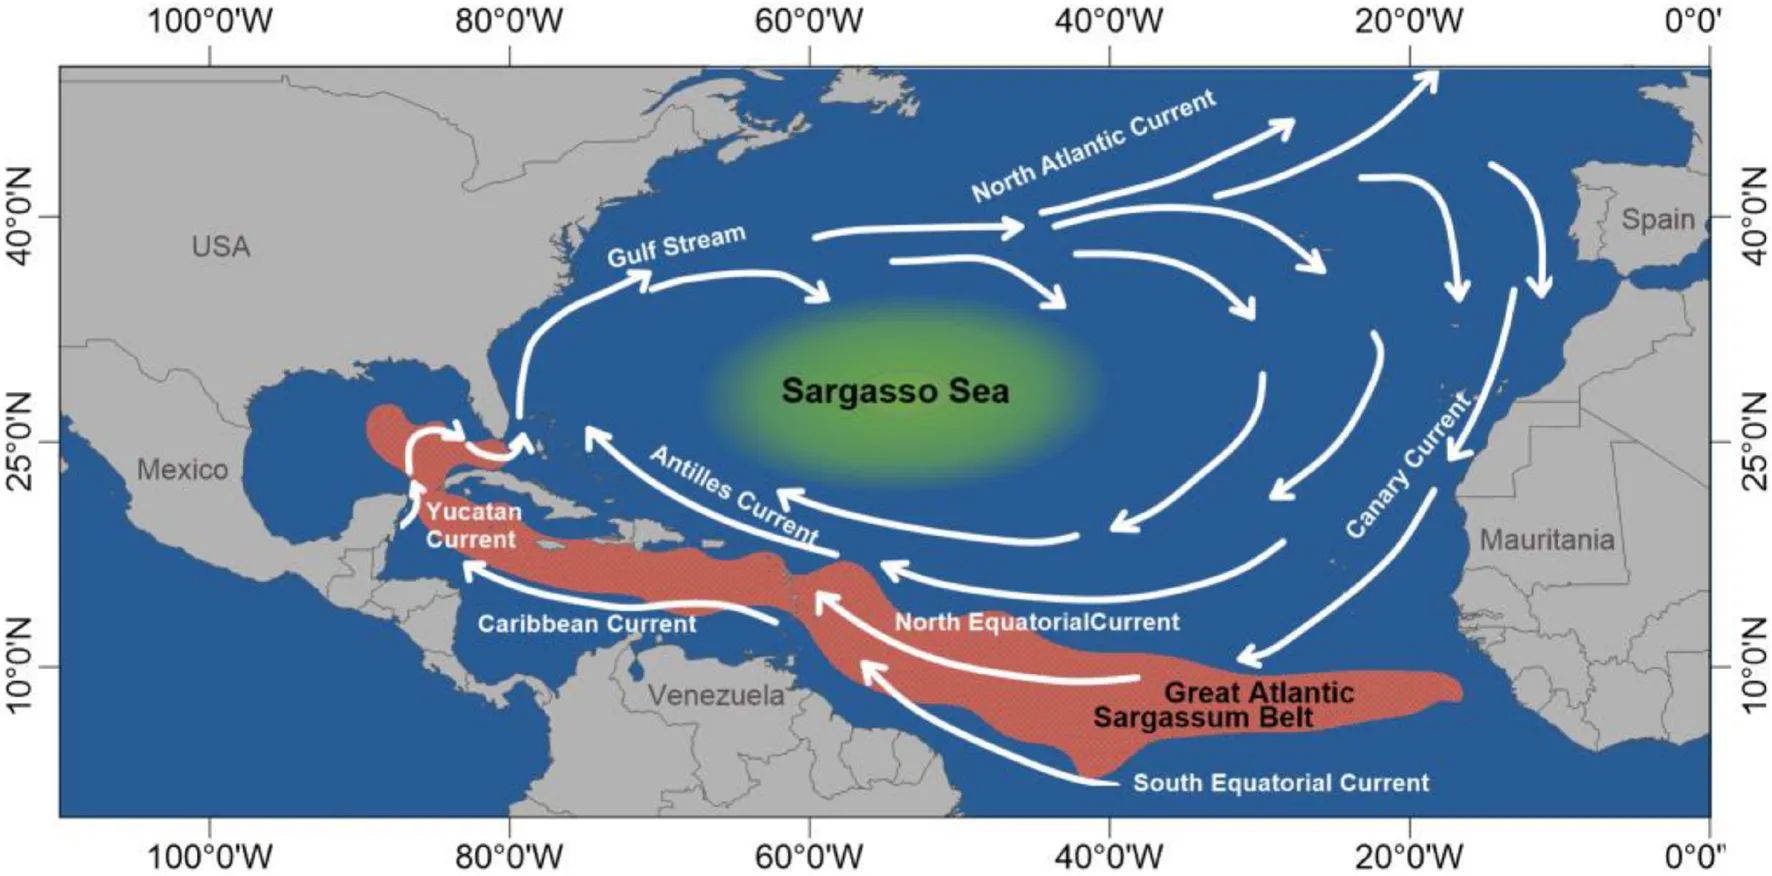
| 15:37, 19. Jun. 2026 | Sargassum-Folgen-Küste.jpg (Datei) |  |
116 KB | Dieter Kasang (Diskussion | Beiträge) | == Beschreibung == Sargassosee (grün) und der Große Atlantische Sargasso-Gürtel (braun) ==Lizenzhinweis== {| style="border:1px solid #8888aa; background-color:#f7f8ff;padding:5px;font-size:95%;" |Quelle: López Miranda, J.L., L.B. Celis, M. Estévez (2021): [https://doi.org/10.3389/fmars.2021.768470 Commercial Potential of Pelagic Sargassum spp. in Mexico]. Front. Mar. Sci. 8:768470<br> Lizenz: [http://creativecommons.org/licenses/by/4.0/ CC BY] |} | 1 |
| 15:29, 19. Jun. 2026 | Sargasso Sea GASB.jpg (Datei) |  |
137 KB | Dieter Kasang (Diskussion | Beiträge) | == Beschreibung == Karte der Sargassosee ==Lizenzhinweis== {| style="border:1px solid #8888aa; background-color:#f7f8ff;padding:5px;font-size:95%;" |Quelle: López Miranda, J.L., L.B. Celis, M. Estévez (2021): Commercial Potential of Pelagic Sargassum spp. in Mexico. Front. Mar. Sci. 8:768470. doi: 10.3389/fmars.2021.768470<br> Lizenz: CC BY http://creativecommons.org/licenses/by/4.0/ |} | 1 |
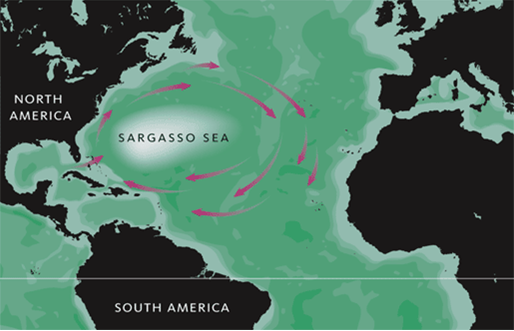
| 10:57, 19. Jun. 2026 | Sargasso Sea.png (Datei) |  |
133 KB | Dieter Kasang (Diskussion | Beiträge) | == Beschreibung == Karte der Sargassosee ==Lizenzhinweis== {| style="border:1px solid #8888aa; background-color:#f7f8ff;padding:5px;font-size:95%;" |Quelle: Wikimedia Commons (2006): Map of the Sargasso Sea, https://commons.wikimedia.org/wiki/File:Sargasso.png<br> Lizenz: public domain |} | 1 |
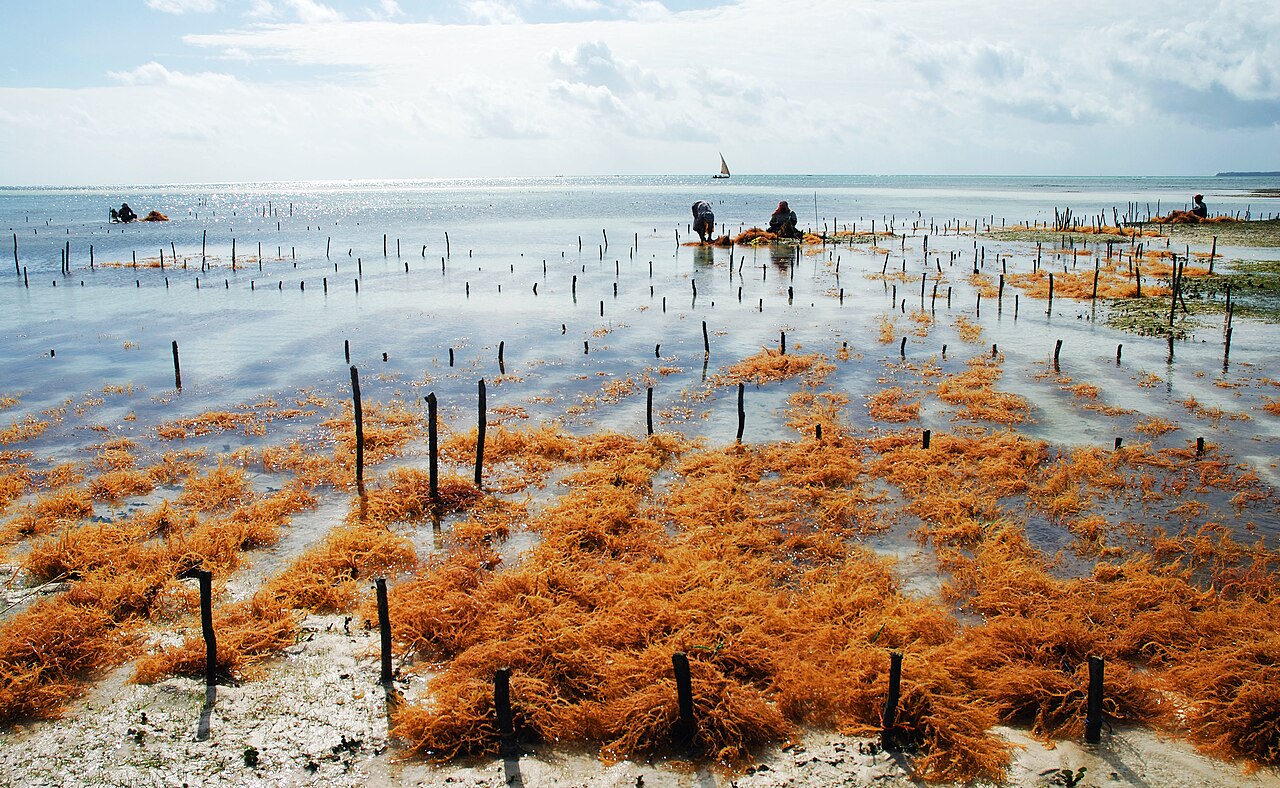
| 19:39, 15. Jun. 2026 | Seaweed farm zanzibar.jpg (Datei) |  |
411 KB | Dieter Kasang (Diskussion | Beiträge) | == Beschreibung == Seetang-Farm in Sansibar ==Lizenzhinweis== {| style="border:1px solid #8888aa; background-color:#f7f8ff;padding:5px;font-size:95%;" |Quelle: Wikipedia: https://de.wikipedia.org/wiki/Datei:Seaweed_farm_uroa_zanzibar.jpg; Urheber: Moongateclimber https://commons.wikimedia.org/wiki/User:Moongateclimber<br> Lizenz: [https://creativecommons.org/licenses/by/4.0/ public domain ] |} | 1 |
| 18:31, 15. Jun. 2026 | Kelp-in-Seeigelwüste.jpg (Datei) |  |
96 KB | Dieter Kasang (Diskussion | Beiträge) | == Beschreibung == Umwandlung von Kelp-Wäldern in Seeigelwüsten durch Marine Hitzewellen und Seeigel-Fraß ==Lizenzhinweis== {| style="border:1px solid #8888aa; background-color:#f7f8ff;padding:5px;font-size:95%;" |Quelle: Roopnarine PD, Banker RMW and Sampson SD (2022) Impact of the extinct megaherbivore Steller's sea cow (Hydrodamalis gigas) on kelp forest resilience. Front. Ecol. Evol. 10:983558, verändert, https://www.frontiersin.org/journals/ecology-and-evolution/articles/10.3389/fevo.2022.… | 1 |
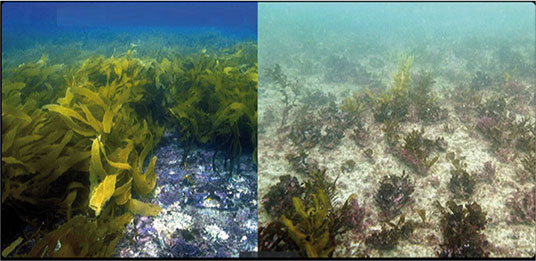
| 18:27, 15. Jun. 2026 | Kelp-lost-heat-wave.jpg (Datei) |  |
47 KB | Dieter Kasang (Diskussion | Beiträge) | == Beschreibung == Links: gesunder Kelp-Wald; rechts: durch Hitzewellen zerstörter Kelp-Wald ==Lizenzhinweis== {| style="border:1px solid #8888aa; background-color:#f7f8ff;padding:5px;font-size:95%;" |Quelle: Beaudin, É., and A. Bracco (2022): How Marine Heatwaves Impact Life in the Ocean. Front. Young Minds. https://kids.frontiersin.org/articles/10.3389/frym.2022.712528/full<br> Lizenz: [https://creativecommons.org/licenses/by/4.0/ CC BY] |} | 1 |
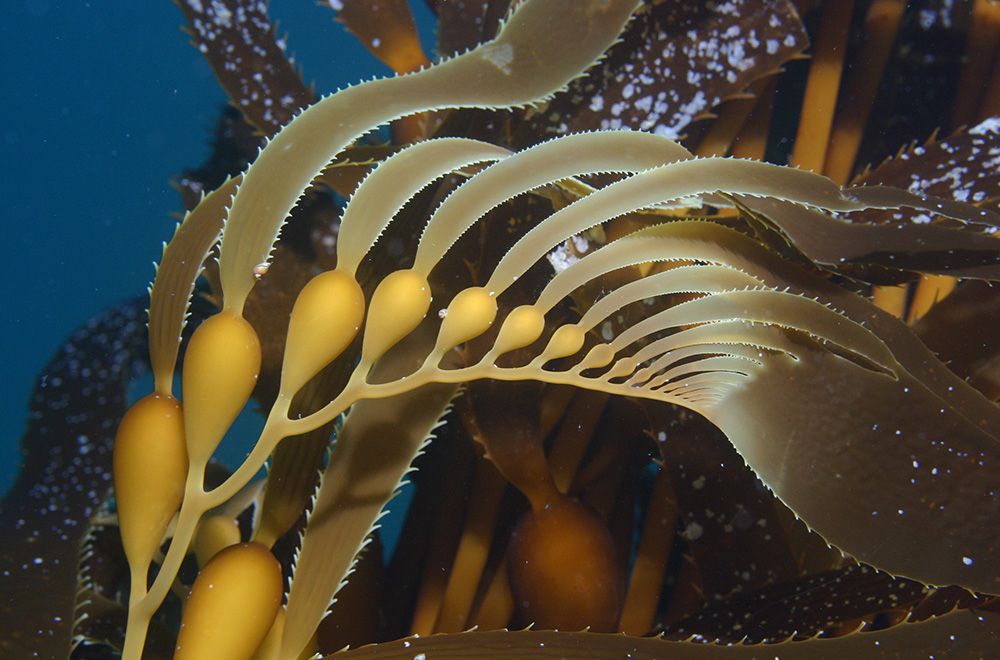
| 16:53, 15. Jun. 2026 | Giant kelp.jpg (Datei) |  |
92 KB | Dieter Kasang (Diskussion | Beiträge) | == Beschreibung == Der Riesentang – die weltweit größte Meeresalgenart – zählt zu den am schnellsten wachsenden Lebewesen der Erde. Er kann an einem einzigen Tag bis zu 60 Zentimeter (zwei Fuß) wachsen und gewaltige Unterwasserwälder bilden, die zahlreichen Meeresbewohnern als Lebensraum dienen. Photo: Steve Lonhart/NOAA ==Lizenzhinweis== {| style="border:1px solid #8888aa; background-color:#f7f8ff;padding:5px;font-size:95%;" |Quelle: NOAA: [https://sanctuaries.noaa.gov/visit/ecosystems/kelpdes… | 1 |
| 16:43, 15. Jun. 2026 | Kelp canopy.jpg (Datei) |  |
306 KB | Dieter Kasang (Diskussion | Beiträge) | Kelp-Wedel mit Stengel und gasgefüllten Blasen NOAA: Kelp Forests, https://sanctuaries.noaa.gov/visit/ecosystems/kelpdesc.html, public domain | 1 |
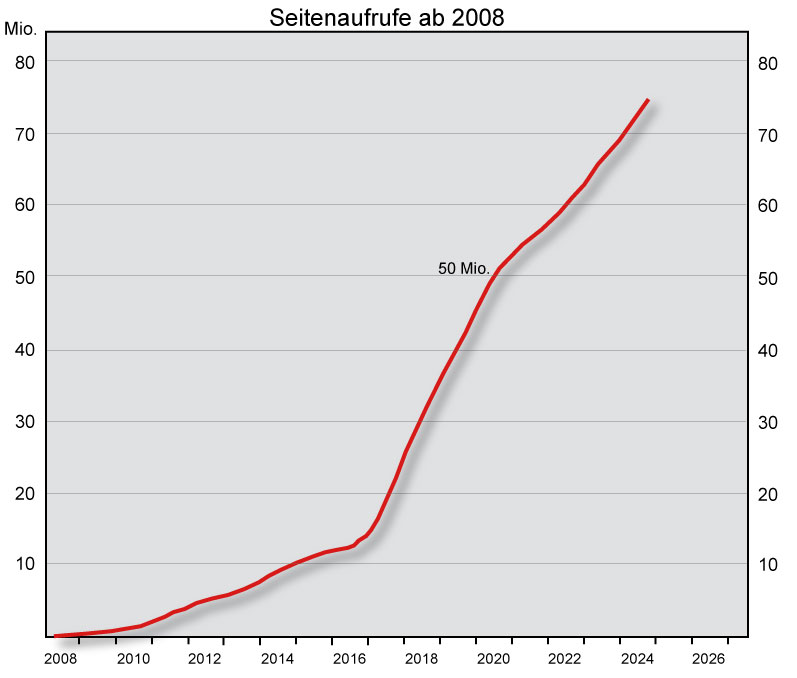
| 10:17, 8. Jun. 2026 | Wiki-Statistik.jpg (Datei) |  |
42 KB | Dieter Kasang (Diskussion | Beiträge) | 4 | |
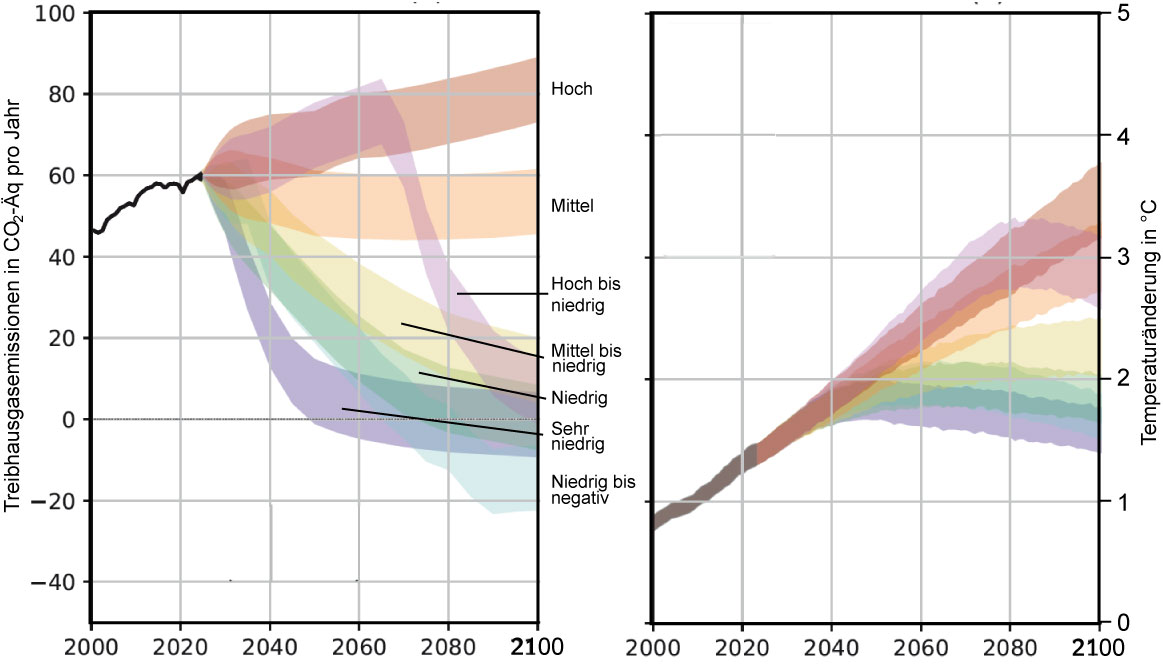
| 19:31, 7. Jun. 2026 | CMIP7-Szenarien.jpg (Datei) |  |
84 KB | Dieter Kasang (Diskussion | Beiträge) | == Beschreibung == Treibhausgasemissionen in CO2-Äquivlante und Temperaturänderungen in °C der Szenarien für den 7. IPCC-Bericht == Lizenzhinweis == {| style="border:1px solid #8888aa; background-color:#f7f8ff;padding:5px;font-size:95%;" | Quelle: van Vuuren, D.P., B.C. O'Neill, C. Tebaldi et al. (2026): The Scenario Model Intercomparison Project for CMIP7 (ScenarioMIP-CMIP7), Geosci. Model Dev., 19, 2627–2656, https://doi.org/10.5194/gmd-19-2627-2026, verändert<br /> Lizenz: CC BY https://cre… | 1 |
| 19:23, 7. Jun. 2026 | RCP8.5-vermieden.jpg (Datei) |  |
146 KB | Dieter Kasang (Diskussion | Beiträge) | Das Schlimmste vermieden - das Ziel verfehlt == Lizenzhinweis == {| style="border:1px solid #8888aa; background-color:#f7f8ff;padding:5px;font-size:95%;" | Quelle: Eigene Darstellung unter Verwendung von Graphiken des Monash Simple Climate Model https://mscm.dkrz.de/ (MSCM), MSCM-Lizenz: CC BY-NC-SA<br /> Lizenz: [http://creativecommons.org/licenses/by/4.0/ CC BY] |} | 1 |
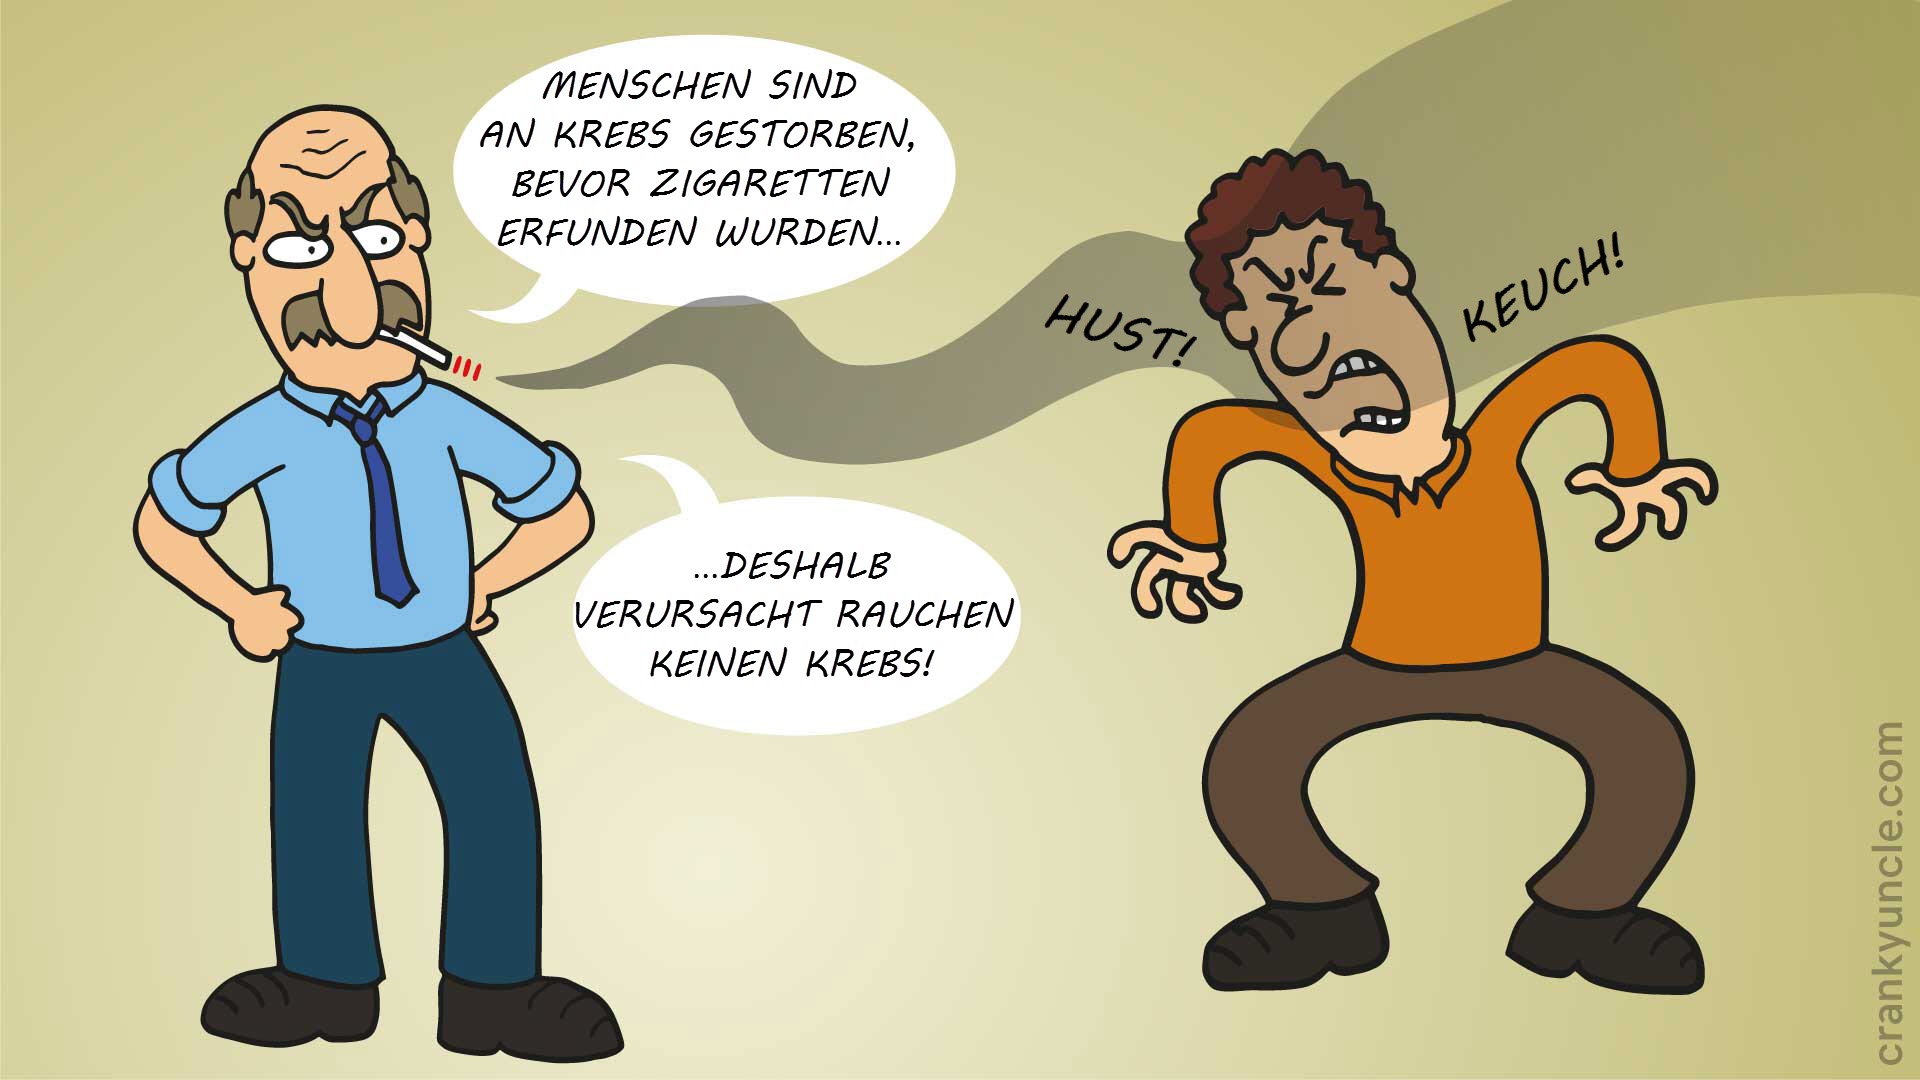
| 18:19, 5. Jun. 2026 | CrankyCartoon-Smoking-DE.jpg (Datei) |  |
170 KB | Dieter Kasang (Diskussion | Beiträge) | == Beschreibung == Dieser Cartoon illustriert den Trugschluss, dass dass sich das Klima durch natürliche Ursachen ändert, weil es sich in der Vergangenheit aus natürlichen Ursachen geändert hat. == Lizenzhinweis == {| style="border:1px solid #8888aa; background-color:#f7f8ff;padding:5px;font-size:95%;" |Quelle: Skeptical Science: Cranky Cartoon (DE) - Alkohol am Steuer, https://skepticalscience.com/graphics.php?g=440<br> Lizenz: CC BY-SA | 1 |
| 18:05, 5. Jun. 2026 | CrankyCartoon-DrunkDriving-DE.jpg (Datei) |  |
253 KB | Dieter Kasang (Diskussion | Beiträge) | == Beschreibung == Dieser Cartoon illustriert den Trugschluss, dass CO2 keine Wirkung hat, weil es nur einen Anteil von 0.04% in der Atmosphäre hat. == Lizenzhinweis == {| style="border:1px solid #8888aa; background-color:#f7f8ff;padding:5px;font-size:95%;" |Quelle: Skeptical Science: Cranky Cartoon (DE) - Alkohol am Steuer https://skepticalscience.com/graphics.php?g=431<br> Lizenz: CC BY-SA | 1 |
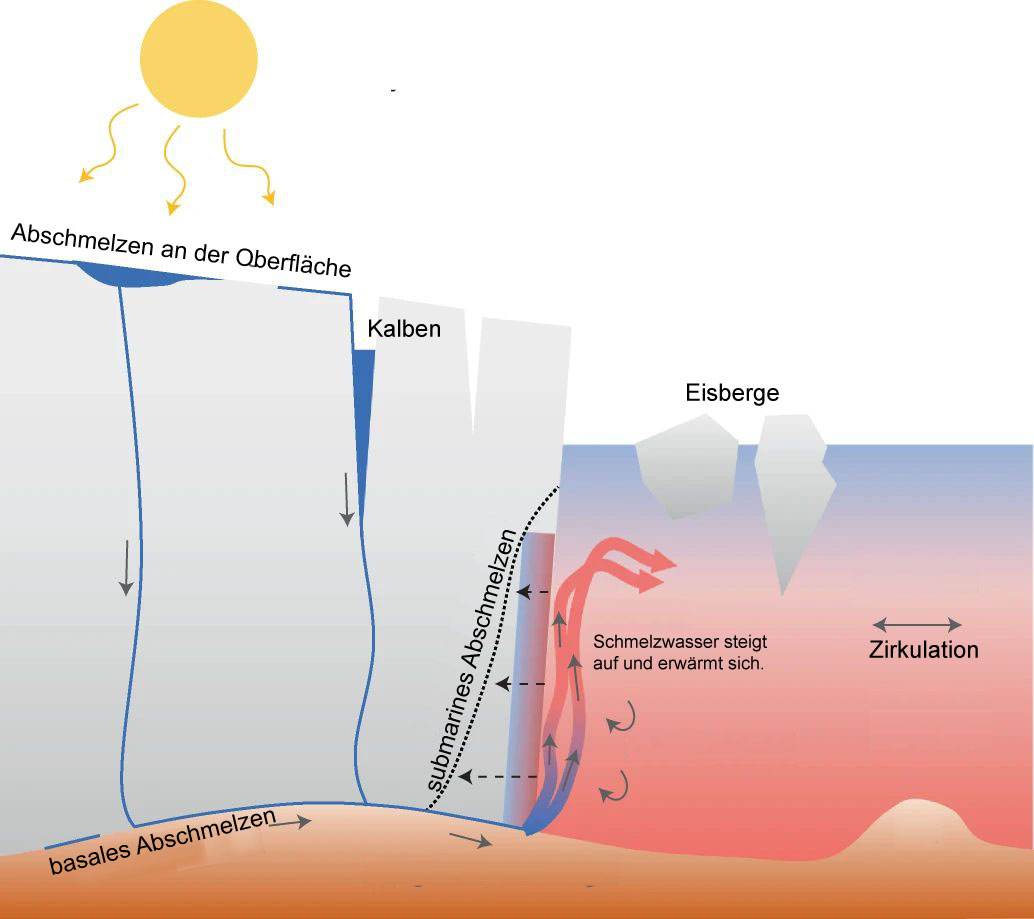
| 18:54, 4. Jun. 2026 | Submarines-Abschmelzen-GIS.jpg (Datei) |  |
70 KB | Dieter Kasang (Diskussion | Beiträge) | == Beschreibung == Abbrechen und Abschmelzen von Eiszungen an der marinen Kante ==Lizenzhinweis== {| style="border:1px solid #8888aa; background-color:#f7f8ff;padding:5px;font-size:95%;" |Quelle: Slater, D.A., F. Straneo (2022): Submarine melting of glaciers in Greenland amplified by atmospheric warming. Nat. Geosci. 15, 794–799, https://doi.org/10.1038/s41561-022-01035-9 <br> Lizenz: [https://creativecommons.org/licenses/by/4.0/ CC BY 4.0] |} | 1 |
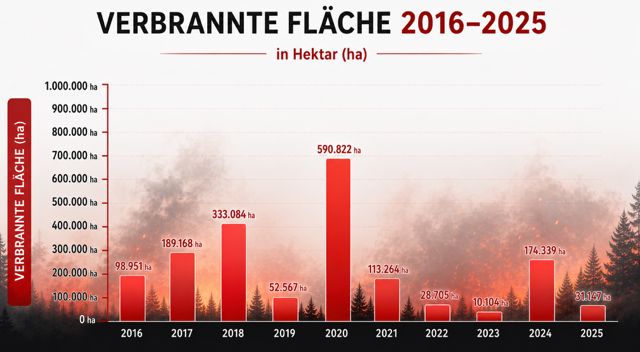
| 09:57, 31. Mai 2026 | Verbrannte Fläche Cal 2016-2025.jpg (Datei) |  |
36 KB | Dieter Kasang (Diskussion | Beiträge) | == Beschreibung == Waldbrandflächen 2016-2025 in Kalifornien in ha ==Lizenzhinweis== {| style="border:1px solid #8888aa; background-color:#f7f8ff;padding:5px;font-size:95%;" | Quelle: CalFire (2025): 2025 Wildfire Activity Statistics, https://www.fire.ca.gov/our-impact/statistics, bearbeitet mit KI: Anja Hermanns <br> Lizenz: public domain |} | 1 |
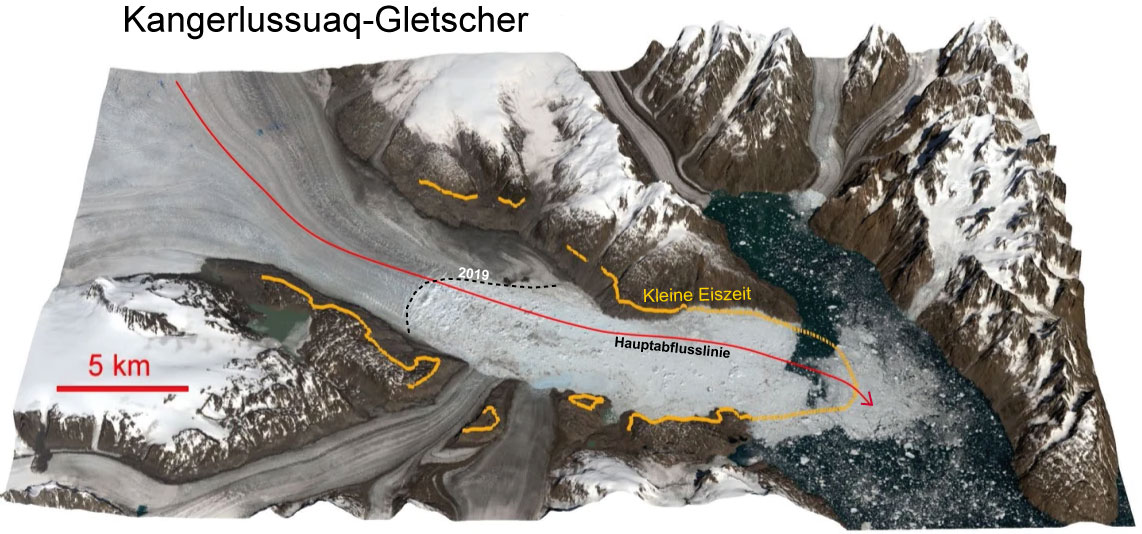
| 20:08, 27. Mai 2026 | Kangerlussuaq.jpg (Datei) |  |
146 KB | Dieter Kasang (Diskussion | Beiträge) | == Beschreibung == Veränderung des Auslassgletschers Kangerlussuaq Glacier zwischen der Kleinen Eiszeit (gelbe Linien) und 2019 (gestrichelte Linie). Die rote Linie zeigt die Hauptfließrichtung an. ==Lizenzhinweis== {| style="border:1px solid #8888aa; background-color:#f7f8ff;padding:5px;font-size:95%;" |Quelle: : Khan, S.A., Bjørk, A.A., Bamber, J.L. et al. Centennial response of Greenland’s three largest outlet glaciers. Nat Commun 11, 5718 (2020). https://doi.org/10.1038/s41467-020-19580-5<b… | 1 |
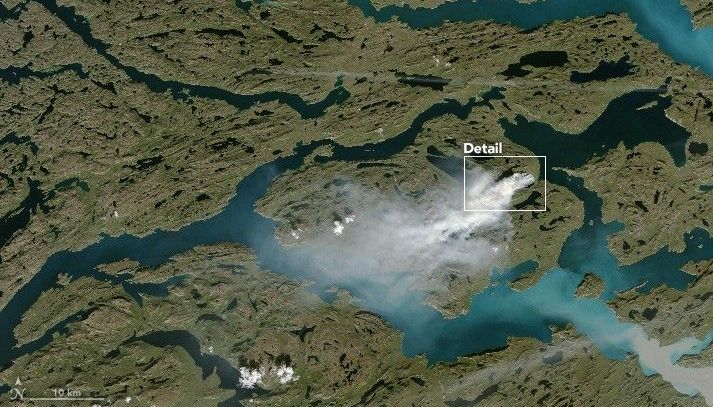
| 19:08, 27. Mai 2026 | W-Greenland fire 3.8.2017.jpg (Datei) |  |
98 KB | Dieter Kasang (Diskussion | Beiträge) | == Beschreibung == Feuer an der Westküste Grönlands am 3. August 2017 ==Lizenzhinweis== {| style="border:1px solid #8888aa; background-color:#f7f8ff;padding:5px;font-size:95%;" |Quelle: NASA Earth Observatory (2027): Fire and Ice in Greenland, https://science.nasa.gov/earth/earth-observatory/fire-and-ice-in-greenland-90709/<br> Lizenz: public domain |} | 1 |
