Dateiliste
Aus Klimawandel
Diese Spezialseite listet alle hochgeladenen Dateien auf.
| Datum | Name | Vorschaubild | Größe | Benutzer | Beschreibung | Versionen |
|---|---|---|---|---|---|---|
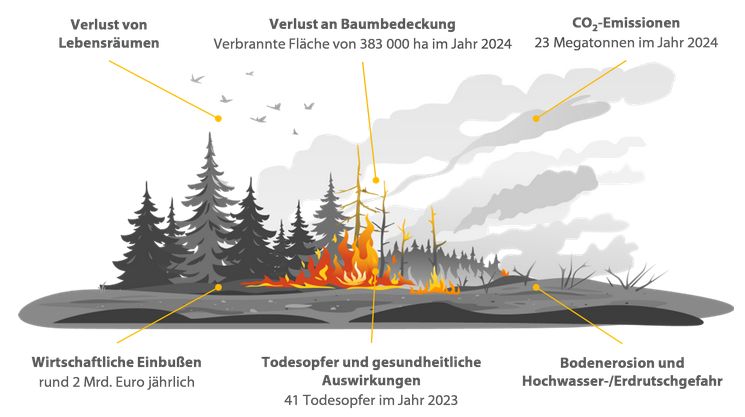
| 19:06, 20. Sep. 2025 | EU Auswirkungen Waldbrände.jpg (Datei) |  |
41 KB | Dieter Kasang (Diskussion | Beiträge) | == Beschreibung == Auswirkungen von Waldbränden in Europa ==Lizenzhinweis== {| style="border:1px solid #8888aa; background-color:#f7f8ff;padding:5px;font-size:95%;" | Quelle: Europäischer Rechnungshof (2025): Sonderbericht 16/2025: EU‑Mittel zur Bekämpfung von Waldbränden – Mehr Präventivmaßnahmen, aber unzureichende Belege für Ergebnisse und deren langfristige Nachhaltigkeit, https://www.eca.europa.eu/de/publications?ref=SR-2025-16 <br> Lizenz: CC BY 4.0 http://creativecommons.org/licenses/by/… | 1 |
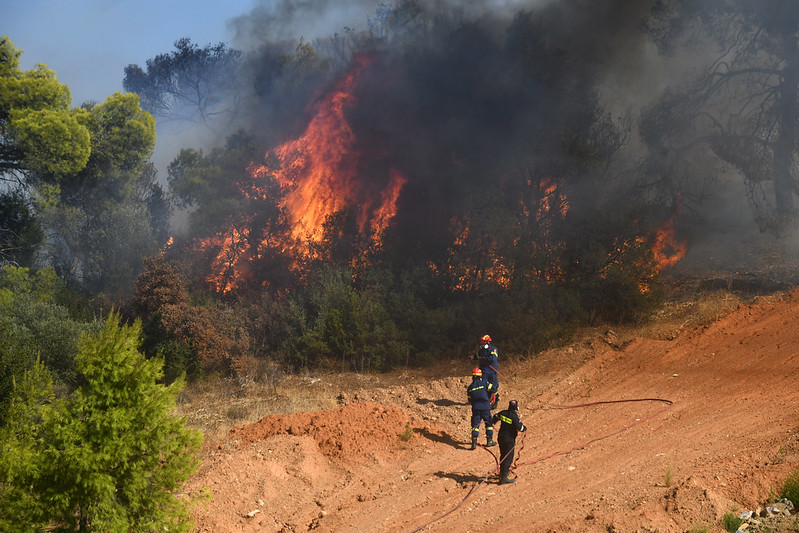
| 18:52, 20. Sep. 2025 | Fire fighting Aug 2025.jpg (Datei) |  |
171 KB | Dieter Kasang (Diskussion | Beiträge) | Kampf gegen das Feuer, 26.8.2025 Flickr (2025): Firefighters on standby: sharing expertise while saving lives, 26.8.2025 https://www.flickr.com/photos/eu_echo/54780045861/in/album-72177720328952615 Lizenz: https://creativecommons.org/licenses/by-nc-nd/4.0/deed.de | 1 |
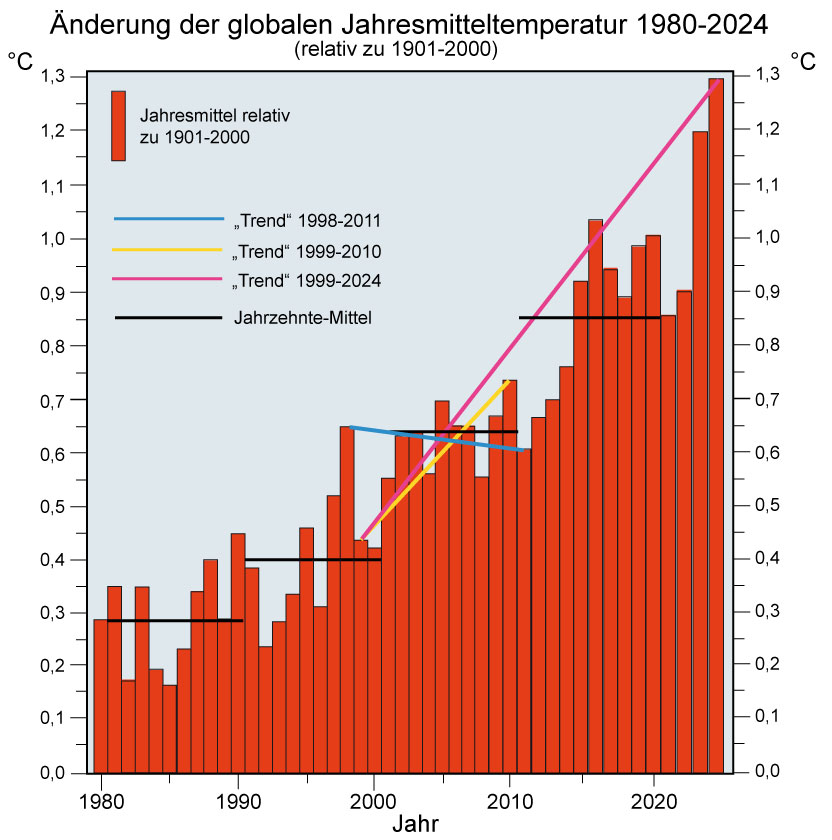
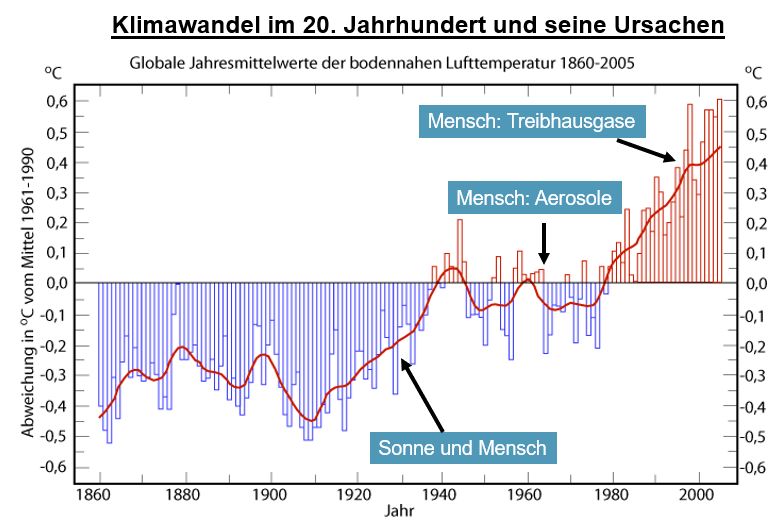
| 14:23, 19. Sep. 2025 | Temp-global-Klimapause.jpg (Datei) |  |
118 KB | Dieter Kasang (Diskussion | Beiträge) | == Beschreibung == Klimaänderungen im 20. Jahrhundert und ihre Ursachen == Lizenzhinweis == {| style="border:1px solid #8888aa; background-color:#f7f8ff;padding:5px;font-size:95%;" |Eigene Darstellung (D. Kasang). Daten nach National Oceanic and Atmospheric Administration: [https://www.ncdc.noaa.gov/cag/global/time-series Global Time Series] <br> Lizenz: CC BY-SA |} | 1 |
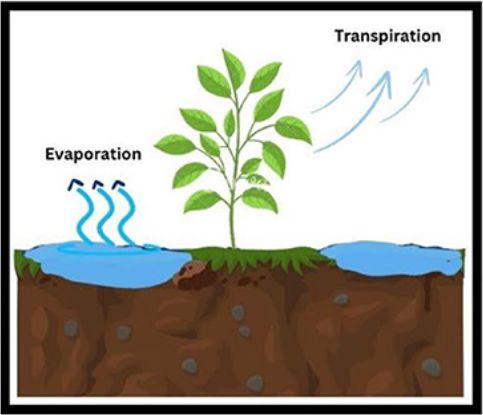
| 13:24, 18. Sep. 2025 | Evaporation-Transpiration.jpg (Datei) | 24 KB | Dieter Kasang (Diskussion | Beiträge) | == Beschreibung == Evapotranspiration bei Wald- und Grasbewuchs == Lizenzhinweis == {| style="border:1px solid #8888aa; background-color:#f7f8ff;padding:5px;font-size:95%;" | Quelle: Wikimedis Commons (2007): Conceptual diagram of near-surface hydrology, showing evapotranspiration, evaporation, transpiration, runoff, and recharge processes. https://commons.wikimedia.org/wiki/File:Surface_water_cycle.svg <br> Lizenz: CC BY |} | 1 | |
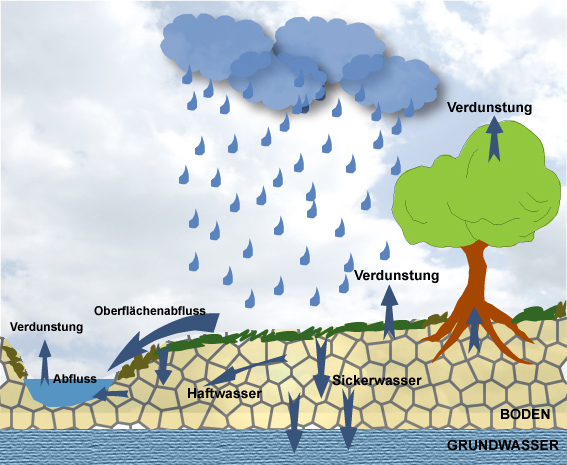
| 13:14, 18. Sep. 2025 | Wasserkreislauf boden.jpg (Datei) |  |
65 KB | Dieter Kasang (Diskussion | Beiträge) | 2 | |
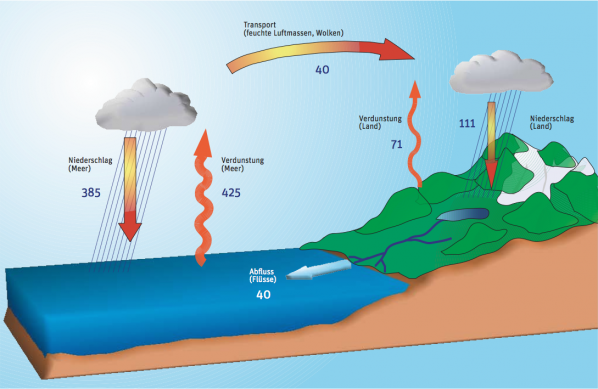
| 12:51, 18. Sep. 2025 | Wasserkreislauf klimafakten.png (Datei) |  |
270 KB | Dieter Kasang (Diskussion | Beiträge) | Der Wasserkreislauf bildet eine der Hauptkomponenten des irdischen Wetter- und Klimasystems. Die Zahlen bezeichnen den Wassertransport in Billionen Kubikmeter pro Jahr. ==Lizenzhinweis== {| style="border:1px solid #8888aa; background-color:#f7f8ff;padding:5px;font-size:95%;" | Quelle: Lemke, P., klimafakten.de (2015): Die Wetter- und Klimamaschine. Eine Einführung, https://www.klimafakten.de/kommunikation/die-wetter-und-klimamaschine-eine-einfuehrung <br> Lizenz: CC BY 4.0 https://creativecommo… | 1 |
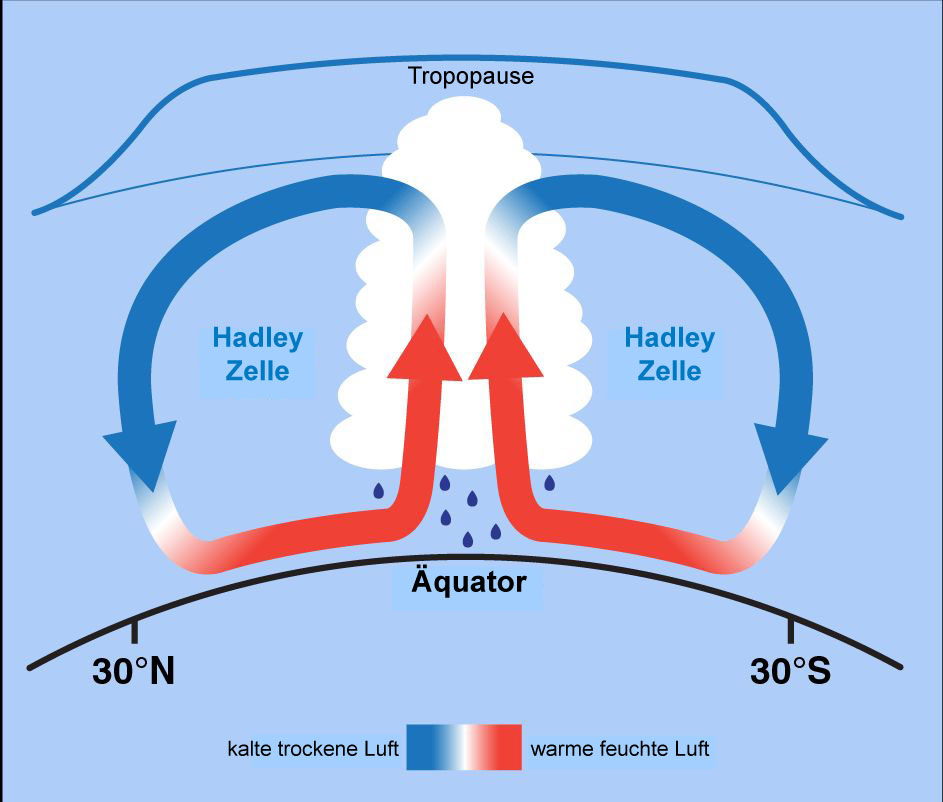
| 12:23, 18. Sep. 2025 | Hadley Zelle.jpg (Datei) |  |
77 KB | Dieter Kasang (Diskussion | Beiträge) | == Beschreibung == Die Hadley-Zelle ==Lizenzhinweis== {| style="border:1px solid #8888aa; background-color:#f7f8ff;padding:5px;font-size:95%;" | Quelle: NOAA SciJinks (o.J.): [https://scijinks.gov/jet-stream/ What Is the Jet Stream?]<br> Lizenz: public domain |} | 1 |
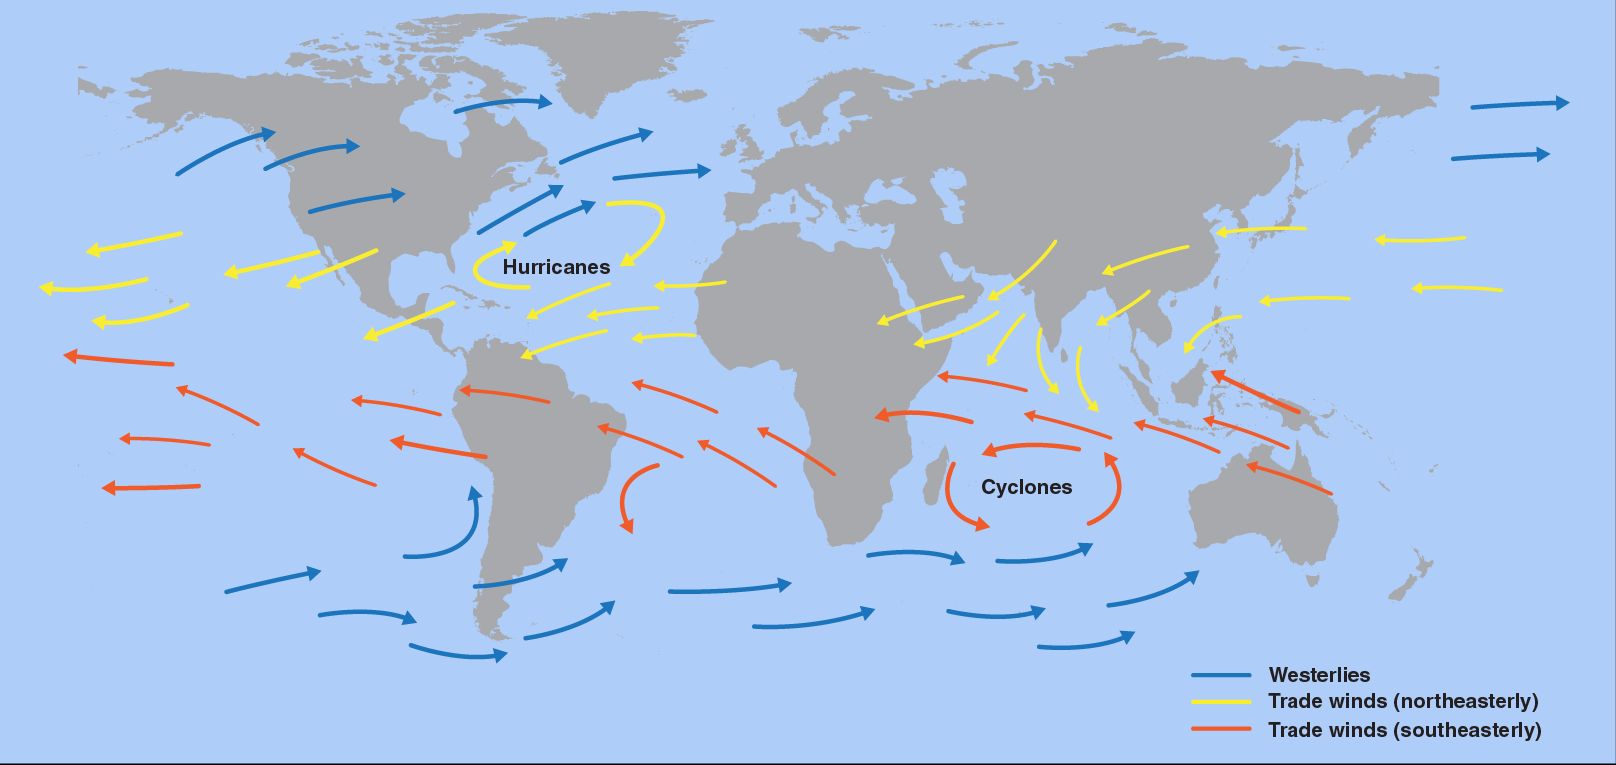
| 12:02, 18. Sep. 2025 | Passat- und Westwinde.jpg (Datei) |  |
83 KB | Dieter Kasang (Diskussion | Beiträge) | == Beschreibung == Wichtige Windsysteme auf der Erde: Passat- und Westwinde ==Lizenzhinweis== {| style="border:1px solid #8888aa; background-color:#f7f8ff;padding:5px;font-size:95%;" | Quelle: NOAA SciJinks (o.J.): Trade Winds https://scijinks.gov/trade-winds/ <br> Lizenz: public domain |} | 1 |
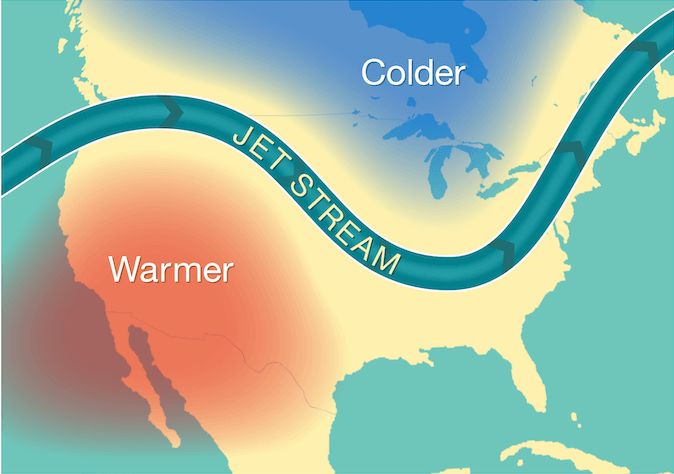
| 11:52, 18. Sep. 2025 | Jetstream over N-America.jpg (Datei) |  |
36 KB | Dieter Kasang (Diskussion | Beiträge) | == Beschreibung == Der Jetstream über Nordamerika ==Lizenzhinweis== {| style="border:1px solid #8888aa; background-color:#f7f8ff;padding:5px;font-size:95%;" | Quelle: NOAA SciJinks (o.J.): What Is the Jet Stream? https://scijinks.gov/jet-stream/<br> Lizenz: public domain |} | 1 |
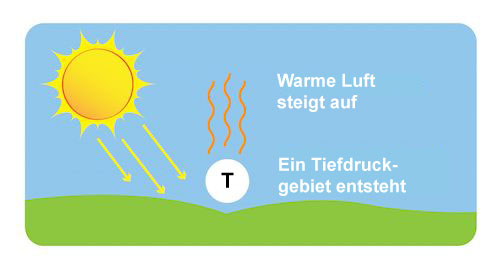
| 11:00, 18. Sep. 2025 | Tiefdruck.jpg (Datei) |  |
19 KB | Dieter Kasang (Diskussion | Beiträge) | 4 | |
| 10:27, 18. Sep. 2025 | Heat-distribution-on-earth.png (Datei) |  |
36 KB | Dieter Kasang (Diskussion | Beiträge) | Die Sonne erwärmt die Erde ungleichmäßig und erzeugt kältere Luftmassen in der Nähe der Pole und wärmere Luftmassen in der Nähe des Äquators. == Lizenzhinweis == {| style="border:1px solid #8888aa; background-color:#f7f8ff;padding:5px;font-size:95%;" |Quelle: NOAA SciJinks (2025): What Is the Jet Stream?, https://scijinks.gov/jet-stream/ (Migration nach: https://www.nesdis.noaa.gov/about/k-12-education/scijinks) <br> Lizenz: CC BY-SA https://creativecommons.org/licenses/by-sa/4.0/deed.en |} | 1 |
| 19:59, 17. Sep. 2025 | Klimawandel 20. Jahrhundert.jpg (Datei) |  |
61 KB | Dieter Kasang (Diskussion | Beiträge) | Klimaänderungen im 20. Jahrhundert und ihre Ursachen == Lizenzhinweis == {| style="border:1px solid #8888aa; background-color:#f7f8ff;padding:5px;font-size:95%;" |Eigene Darstellung (D. Kasang). Daten nach National Oceanic and Atmospheric Administration: [https://www.ncdc.noaa.gov/cag/global/time-series Global Time Series] <br> Lizenz: CC BY-SA |} | 1 |
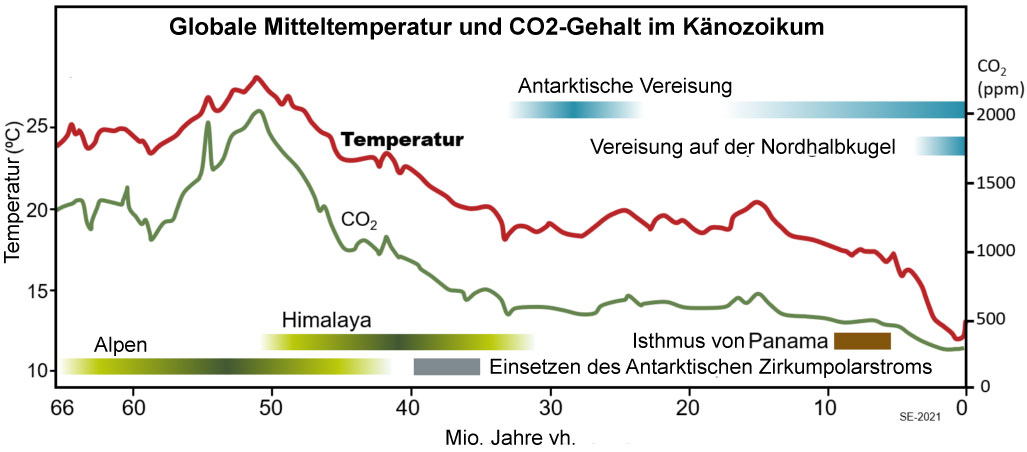
| 09:11, 17. Sep. 2025 | Temp-CO2-Erdneuzeit.jpg (Datei) |  |
69 KB | Dieter Kasang (Diskussion | Beiträge) | == Beschreibung == Änderung de Temperatur und des CO2-Gehalts im Kontext tektonischer Ereignisse. ==Lizenzhinweis== {| style="border:1px solid #8888aa; background-color:#f7f8ff;padding:5px;font-size:95%;" |Quelle: Earle, S.: Plate Tectonics and Climate Change, https://environmental-geol.pressbooks.tru.ca/chapter/plate-tectonics-and-climate-change/ <br> Lizenz: CC BY 4.0 https://creativecommons.org/licenses/by/4.0/ |} | 1 |
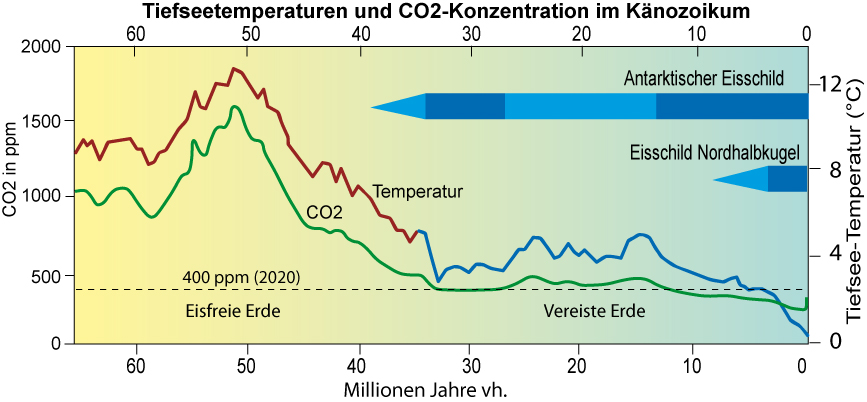
| 16:45, 16. Sep. 2025 | Temp CO2 60mio.jpg (Datei) |  |
144 KB | Dieter Kasang (Diskussion | Beiträge) | Der CO2-Gehalt kontrolliert langfristige Klimaänderungen. Hier ist zum Vergleich mit dem CO2-Gehalt die Tiefseetemperatur sowie die Intensität der Vereisung hoher Breiten auf beiden Erdhälften für die vergangenen etwa 65 Mill. Jahre dargestellt. (eigene Darstellung nach HANSEN et al. 2013, CC BY) ==Lizenzhinweis== {| style="border:1px solid #8888aa; background-color:#f7f8ff;padding:5px;font-size:95%;" |Quelle: Hansen, J., M. Sato, G. Russell, and P. Kharecha (2013): Climate sensitivity, sea lev… | 1 |
| 13:19, 16. Sep. 2025 | Temp-last65-Mio,years.jpg (Datei) |  |
38 KB | Dieter Kasang (Diskussion | Beiträge) | == Beschreibung == Globale Mitteltemperatur in den letzten 65 Mio. Jahren == Lizenzhinweis == {| style="border:1px solid #8888aa; background-color:#f7f8ff;padding:5px;font-size:95%;" |Quelle: NOAA Climate.gov (2025): What’s the hottest Earth’s ever been?, https://archive.ph/uLI64#selection-859.0-859.37 <br> Lizenz: public domain | 1 |
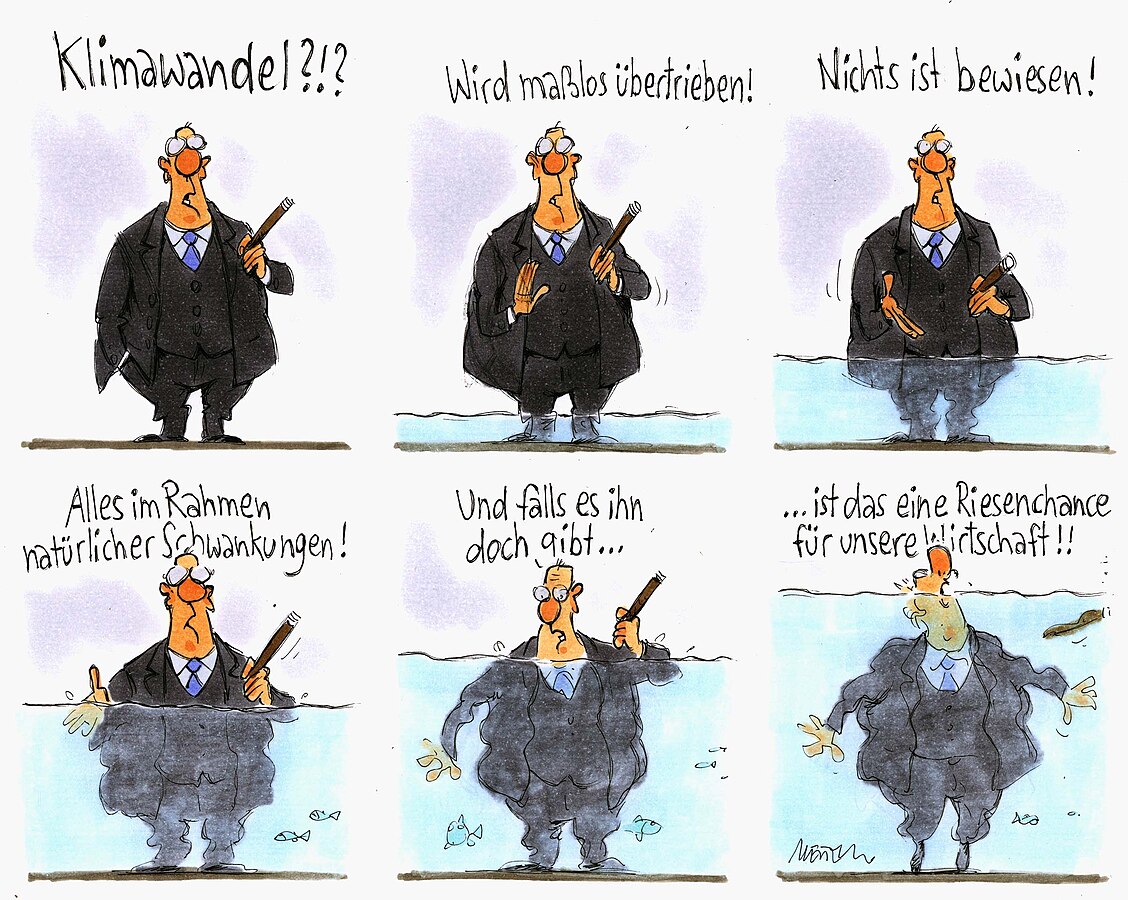
| 20:10, 15. Sep. 2025 | Karikatur Klimaleugnung.jpg (Datei) |  |
258 KB | Dieter Kasang (Diskussion | Beiträge) | == Beschreibung == Ein Klimawandelleugner in Not! == Lizenzhinweis == {| style="border:1px solid #8888aa; background-color:#f7f8ff;padding:5px;font-size:95%;" |Quelle: Wikipedia (2013): Karikatur von Gerhard Mester zum Klimawandel, https://de.wikipedia.org/wiki/Datei:Karikatur_von_Gerhard_Mester_zum_Thema_Klimawandel_gibt_es_nicht_O12816.jpg<br> Lizenz: CC BY-SA https://creativecommons.org/licenses/by-sa/4.0/deed.de Lizenz: [https://creativecommons.org/licenses/by-nc-nd/4.0/deed.de CC BY-NC-ND… | 1 |
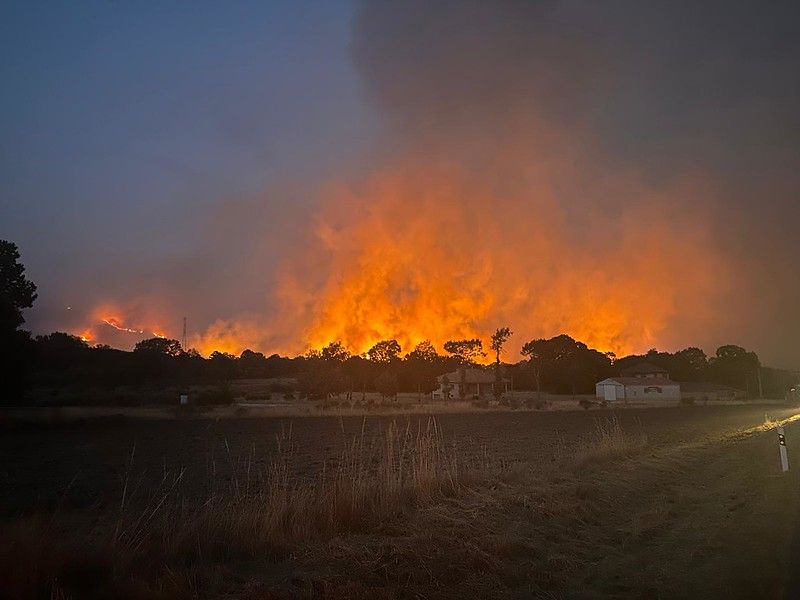
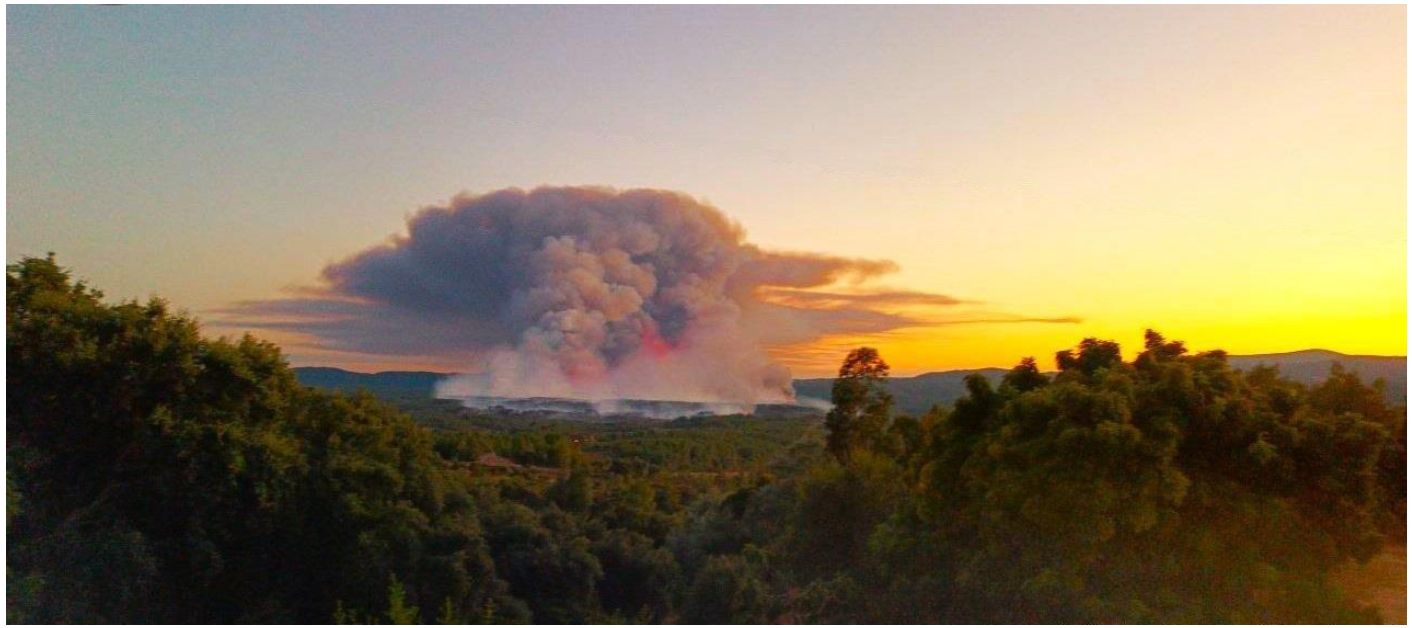
| 11:03, 14. Sep. 2025 | Wildfire NW-Spain August 2025b.jpg (Datei) |  |
44 KB | Dieter Kasang (Diskussion | Beiträge) | == Beschreibung == Waldbrände in Nordwest-Spanien im August 2025 == Lizenzhinweis == {| style="border:1px solid #8888aa; background-color:#f7f8ff;padding:5px;font-size:95%;" |Quelle: Flickr, wckitchen (2025): [https://flickr.com/photos/wckitchen/54719407467/in/album-72177720328343379 WCK Teams Serve in Ourense Province During Wildfires]<br> Lizenz: [https://creativecommons.org/licenses/by/4.0/deed.de CC BY 4.0] |} | 1 |
| 11:01, 14. Sep. 2025 | Wildfire NW-Spain August 2025.jpg (Datei) |  |
69 KB | Dieter Kasang (Diskussion | Beiträge) | == Beschreibung == Waldbrände bedrohen ein Dorf in Nordwest-Spanien im August 2025 == Lizenzhinweis == {| style="border:1px solid #8888aa; background-color:#f7f8ff;padding:5px;font-size:95%;" |Quelle: Flickr, wckitchen (2025): [https://flickr.com/photos/wckitchen/54719408052/in/album-72177720328343379 WCK Teams Serve in Ourense Province During Wildfires]<br> Lizenz: [https://creativecommons.org/licenses/by/4.0/deed.de CC BY 4.0] |} | 1 |
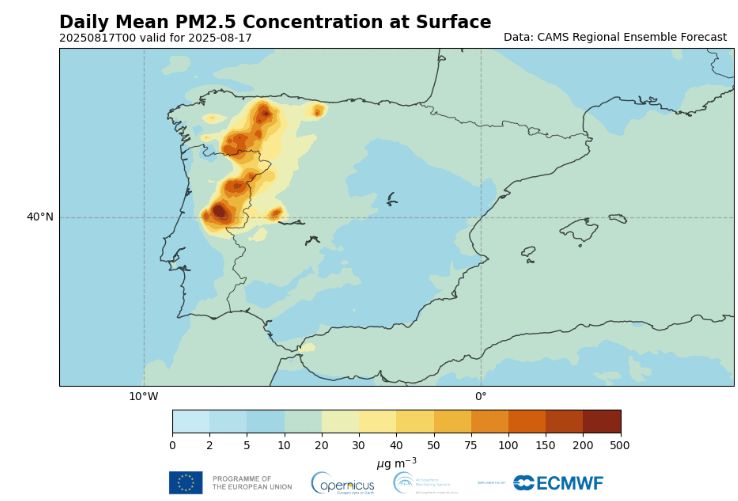
| 10:58, 14. Sep. 2025 | Spain 2025 particulate matter PM2.5.jpg (Datei) |  |
40 KB | Dieter Kasang (Diskussion | Beiträge) | == Beschreibung == Verbreitung der Brände in Nordwest-Spanien und Nord-Portugal am 17.8.2025, gezeigt anhand von Feinstaubpartikeln. == Lizenzhinweis == {| style="border:1px solid #8888aa; background-color:#f7f8ff;padding:5px;font-size:95%;" |Quelle: Flickr, wckitchen (2025): WCK Teams Serve in Ourense Province During Wildfires, https://flickr.com/photos/wckitchen/54719408052/in/album-72177720328343379<br> Lizenz: CC BY 4.0 https://creativecommons.org/licenses/by/4.0/deed.de |} | 1 |
| 10:11, 14. Sep. 2025 | Wildfire-Cyprus-2025b.jpg (Datei) |  |
83 KB | Dieter Kasang (Diskussion | Beiträge) | == Beschreibung == Waldbrände auf Zypern bei Malia in der Provinz Limassol am 24.7.2025. == Lizenzhinweis == {| style="border:1px solid #8888aa; background-color:#f7f8ff;padding:5px;font-size:95%;" |Quelle: Wikimedia Commons (2025): Fire in the Malia area of Limassol, Cyprus at night, https://commons.wikimedia.org/wiki/File:Malia_fire_Limassol_2025.jpg <br> Lizenz: [https://creativecommons.org/licenses/by-sa/4.0/deed.en CC BY-SA] Eimgefügte Karte: Wikipedia: Positionskarte von Zypern, https://e… | 1 |
| 09:27, 14. Sep. 2025 | Waldbrände-Zypern-2006-2025.jpg (Datei) |  |
65 KB | Dieter Kasang (Diskussion | Beiträge) | == Beschreibung == Verbrannte Fläche und Anzahl der Brände auf Zypern 2006-2025. Berücksichtigt sind Brände ab 30 ha. == Lizenzhinweis == {| style="border:1px solid #8888aa; background-color:#f7f8ff;padding:5px;font-size:95%;" |Quelle: EFFIS Annual Statistics (2025): EFFIS Estimates for European Union, Cyprus https://forest-fire.emergency.copernicus.eu/apps/effis.statistics/estimates/<br> Lizenz: [http://creativecommons.org/licenses/by/4.0/ CC BY 4.0] |} | 1 |
| 09:57, 10. Sep. 2025 | Albedo-Oberflächen.jpg (Datei) |  |
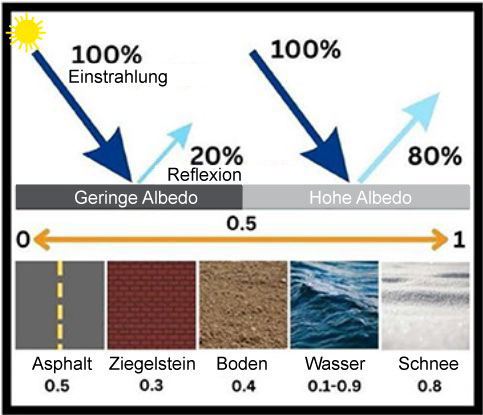
39 KB | Dieter Kasang (Diskussion | Beiträge) | == Beschreibung == Reflektion der Sonneneinstrahlung bei geringer und hoher Albedo (oben) und Albedo von verschiedenen Oberflächen (unten) == Lizenzhinweis == {| style="border:1px solid #8888aa; background-color:#f7f8ff;padding:5px;font-size:95%;" |Quelle: Alzahrani, S., S. Ullah and S.G. Al-Ghamdi (2025): How Can We Cool Warming Cities Using Nature-Based Solutions? Front. Young Minds, https://kids.frontiersin.org/articles/10.3389/frym.2025.1395250<br> Lizenz: [CC BY http://creativecommons.org… | 1 |
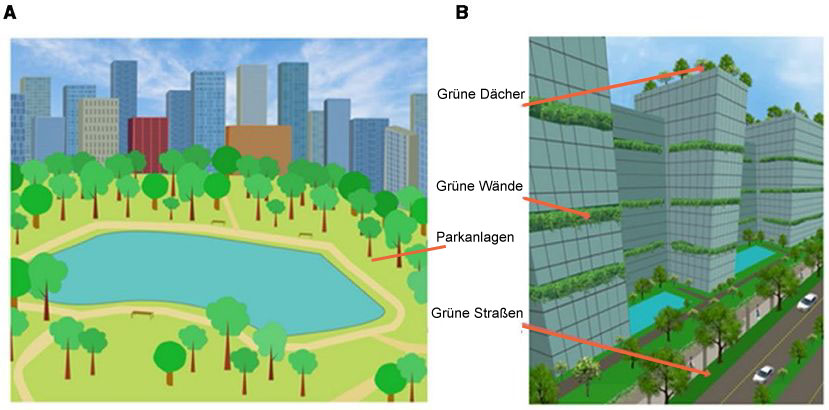
| 09:19, 10. Sep. 2025 | Abkühlung Städte.jpg (Datei) |  |
65 KB | Dieter Kasang (Diskussion | Beiträge) | 2 | |
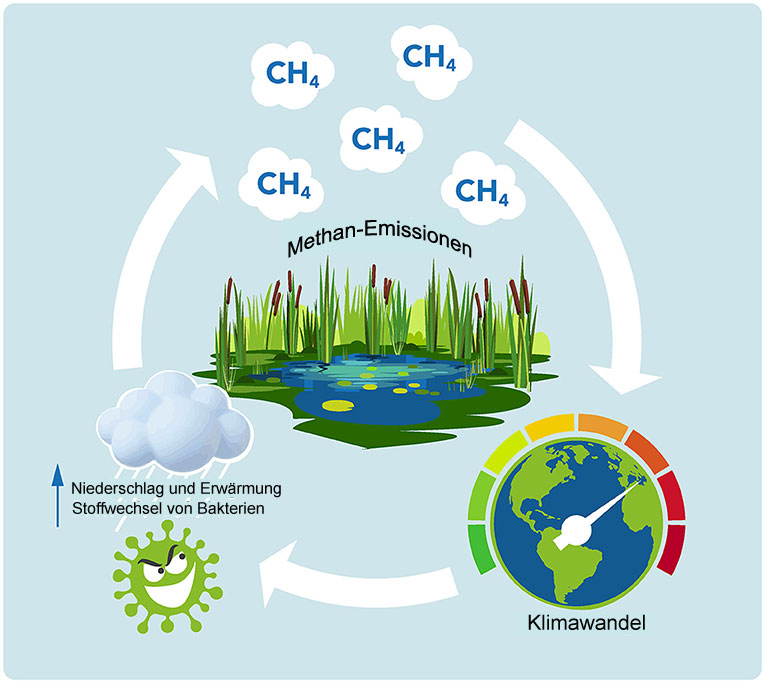
| 17:13, 9. Sep. 2025 | Methan-Emissionen-cc.jpg (Datei) |  |
80 KB | Dieter Kasang (Diskussion | Beiträge) | == Beschreibung == Das Klimasystem und seine Subsysteme: Atmosphäre, Hydrosphäre, Kryosphäre und Lithosphäre ==Lizenzhinweis== {| style="border:1px solid #8888aa; background-color:#f7f8ff;padding:5px;font-size:95%;" | Quelle: Regoto, P., C. Burgard & C. Jones (2022): [https://kids.frontiersin.org/articles/10.3389/frym.2022.671886 What Do We Mean by “Climate” and “Climate Change”?]. Front. Young Minds, übersetzt<br> Lizenz: [https://creativecommons.org/licenses/by/4.0/ CC BY] |} | 1 |
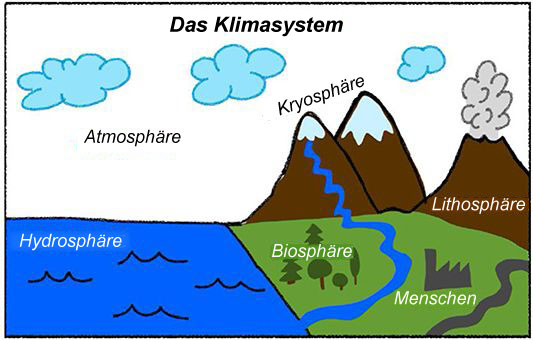
| 13:03, 9. Sep. 2025 | Klimasystem-Subsysteme.jpg (Datei) |  |
42 KB | Dieter Kasang (Diskussion | Beiträge) | == Beschreibung == Das Klimasystem und seine Subsysteme: Atmosphäre, Hydrosphäre, Kryosphäre und Lithospäre ==Lizenzhinweis== {| style="border:1px solid #8888aa; background-color:#f7f8ff;padding:5px;font-size:95%;" | Quelle: Regoto, P., C. Burgard & C. Jones (2022): What Do We Mean by “Climate” and “Climate Change”?. Front. Young Minds. https://kids.frontiersin.org/articles/10.3389/frym.2022.671886<br> Lizenz: [https://creativecommons.org/licenses/by/4.0/ CC BY] |} | 1 |
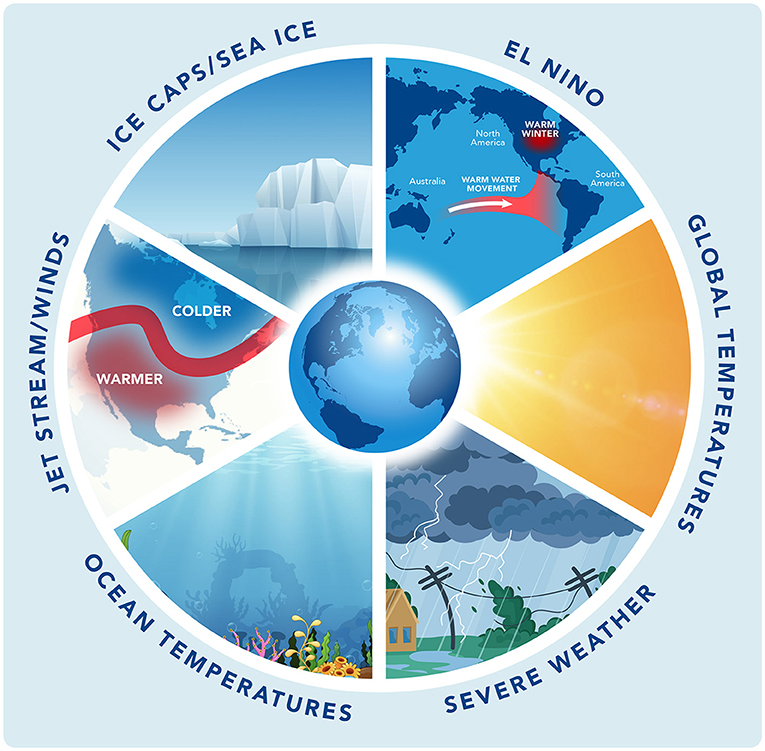
| 10:04, 9. Sep. 2025 | Climate system teleconnections.jpg (Datei) |  |
409 KB | Dieter Kasang (Diskussion | Beiträge) | == Beschreibung == Das Klima der Erde ist äußerst komplex und besteht aus vielen Komponenten, die sich über Fernwirkungen gegenseitig beeinflussen. Ein Beispiel: Riesige Luftströme, sogenannte Jetstreams, werden durch den Temperaturunterschied zwischen dem Äquator (wo es sehr warm ist) und den Polen (wo es sehr kalt ist) beeinflusst. Da die Temperaturen in den Polarregionen durch die globale Erwärmung stärker steigen als anderswo, ändert sich der Temperaturunterschied zwischen den Polen und dem… | 1 |
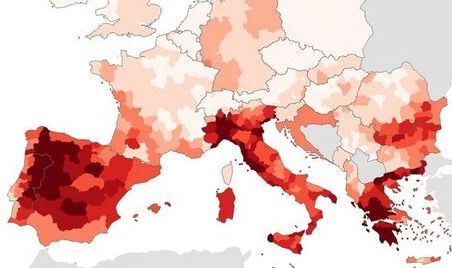
| 15:19, 22. Aug. 2025 | EU Todesfälle Hitze 2022.jpg (Datei) |  |
24 KB | Dieter Kasang (Diskussion | Beiträge) | == Beschreibung == Todesfälle durch Hitze pro Mio. Einwohner im Sommer 2022 ==Lizenzhinweis== {| style="border:1px solid #8888aa; background-color:#f7f8ff;padding:5px;font-size:95%;" | Quelle: Ausschnitt aus: Ballester, J., M. Quijal-Zamorano, R.F. Méndez Turrubiates et al. (2023): Heat-related mortality in Europe during the summer of 2022. Nat Med 29, 1857–1866. https://doi.org/10.1038/s41591-023-02419-z <br> Lizenz: CC BY http://creativecommons.org/licenses/by/4.0/ |} | 1 |
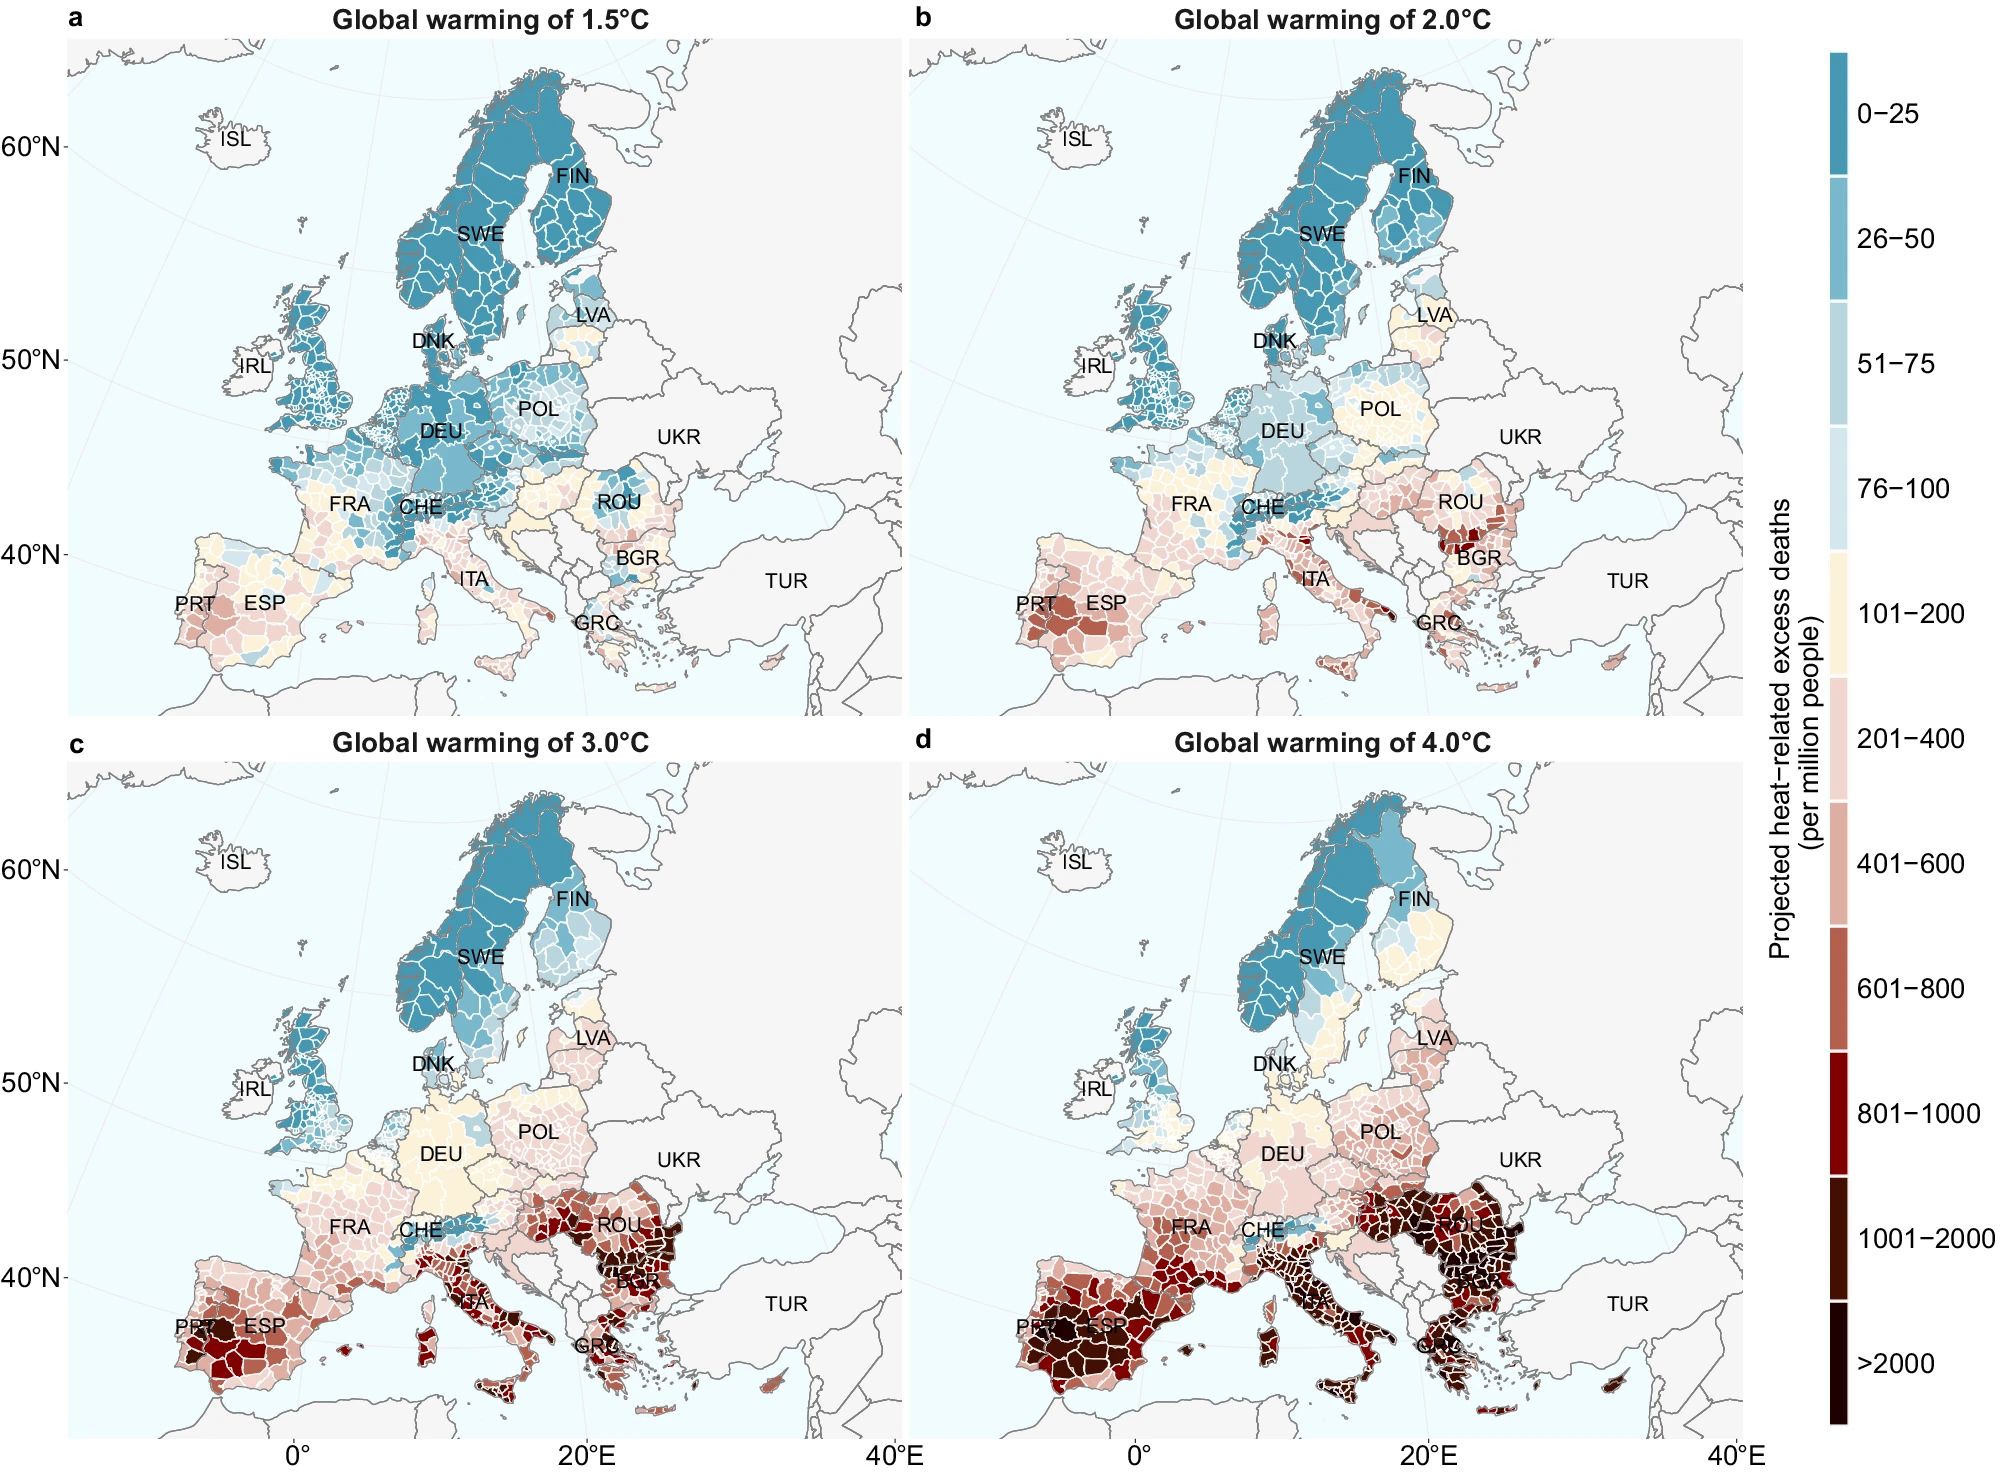
| 18:45, 17. Aug. 2025 | Global Warming Todesfälle EU.jpg (Datei) |  |
398 KB | Dieter Kasang (Diskussion | Beiträge) | == Beschreibung == Hitzebedingte Todesfälle pro Million Einwohner bei einer globalen Erwärmung von (a) 1,5 °C, (b) 2,0 °C, (c) 3,0 °C und (d) 4,0 °C. ==Lizenzhinweis== {| style="border:1px solid #8888aa; background-color:#f7f8ff;padding:5px;font-size:95%;" | Quelle: Wu, X., J. Wang, Y. Ge et al. (2025): Future heat-related mortality in Europe driven by compound day-night heatwaves and demographic shifts. Nat Commun 16, 7420 https://doi.org/10.1038/s41467-025-62871-y <br> Lizenz: CC BY-NC-ND… | 1 |
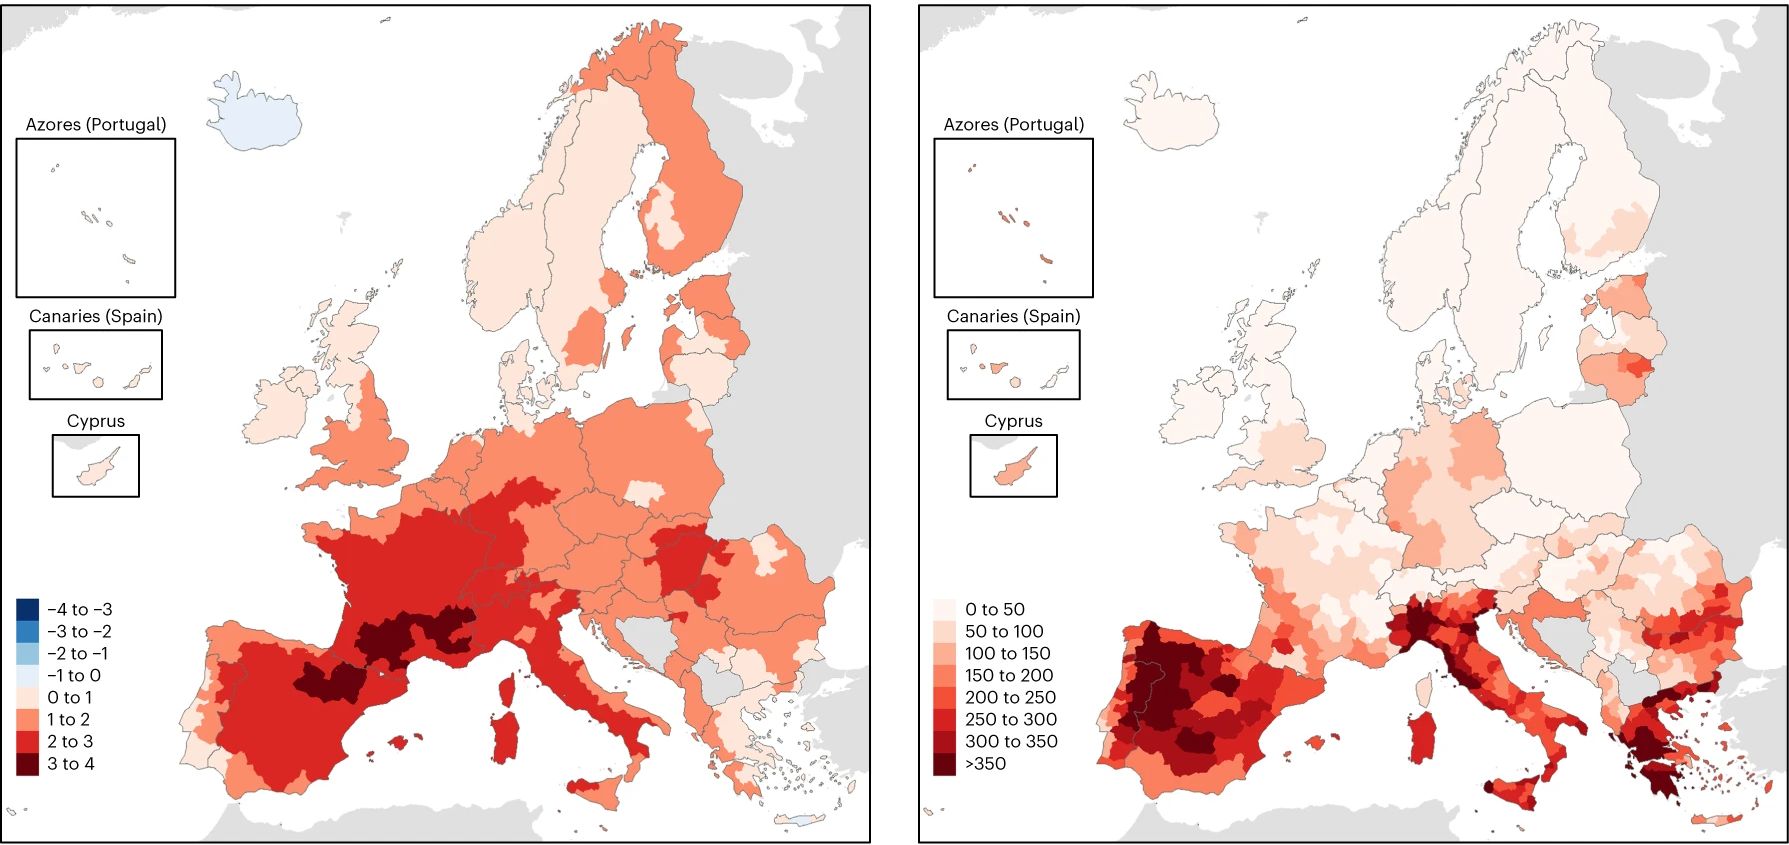
| 18:29, 17. Aug. 2025 | Temp Todesfälle 2022.jpg (Datei) |  |
169 KB | Dieter Kasang (Diskussion | Beiträge) | == Beschreibung == Links: Sommertemperatuen 2022 im Vergleich zum Mittel 1991-2020; rechts: Todesfälle durch Hitze pro Mio. Einwohner im Sommer 2022 ==Lizenzhinweis== {| style="border:1px solid #8888aa; background-color:#f7f8ff;padding:5px;font-size:95%;" | Quelle: Ballester, J., M. Quijal-Zamorano, R.F. Méndez Turrubiates et al. (2023): Heat-related mortality in Europe during the summer of 2022. Nat Med 29, 1857–1866. https://doi.org/10.1038/s41591-023-02419-z <br> Lizenz: CC BY http://cr… | 1 |
| 18:10, 17. Aug. 2025 | Hitzetote Eu 2000-2020.jpg (Datei) |  |
67 KB | Dieter Kasang (Diskussion | Beiträge) | == Beschreibung == Änderung der Sommertemperaturen in Europa relativ zu 1991-2020 ==Lizenzhinweis== {| style="border:1px solid #8888aa; background-color:#f7f8ff;padding:5px;font-size:95%;" | Quelle: Copernicus Climate Change (2024): C3S seasonal lookback: summer 2024, https://climate.copernicus.eu/c3s-seasonal-lookback-summer-2024 <br> Lizenz: [https://climate.copernicus.eu/disclaimer-and-privacy Reproduction of the publically available content of this website is authorised, provided the so… | 1 |
| 17:21, 17. Aug. 2025 | Eu summer temp 1979-2024.jpg (Datei) |  |
66 KB | Dieter Kasang (Diskussion | Beiträge) | == Beschreibung == Änderung der Sommertemperaturen in Europa relativ zu 1991-2020 ==Lizenzhinweis== {| style="border:1px solid #8888aa; background-color:#f7f8ff;padding:5px;font-size:95%;" | Quelle: Copernicus Climate Change (2024): C3S seasonal lookback: summer 2024, https://climate.copernicus.eu/c3s-seasonal-lookback-summer-2024 <br> Lizenz: [https://climate.copernicus.eu/disclaimer-and-privacy Reproduction of the publically available content of this website is authorised, provided the so… | 1 |
| 09:08, 10. Aug. 2025 | Mediterranean forest fires.jpg (Datei) |  |
93 KB | Dieter Kasang (Diskussion | Beiträge) | == Beschreibung == Geographische Verteilung von Brandflächen im Mittelmeerraum 2023 == Lizenzhinweis == {| style="border:1px solid #8888aa; background-color:#f7f8ff;padding:5px;font-size:95%;" |Quelle: San-Miguel-Ayanz, J., T. Durrant, R. Boca (2024): [https://publications.jrc.ec.europa.eu/repository/handle/JRC139704 Forest Fires in Europe, Middle East and North Africa 2023], Publications Office of the European Union, Luxembourg, 2024<br> Lizenz: [http://creativecommons.org/licenses/by/4.0/ CC… | 1 |
| 09:06, 10. Aug. 2025 | EU-Mediterranean fires 1980-2022.jpg (Datei) |  |
58 KB | Dieter Kasang (Diskussion | Beiträge) | == Beschreibung == Anzahl der Brände ab 5 ha in den fünf großen Mediterranen EU-Staaten Portugal, Spanien, Frankreich, Italien und Griechenland 1980-2023. == Lizenzhinweis == {| style="border:1px solid #8888aa; background-color:#f7f8ff;padding:5px;font-size:95%;" |Quelle: San-Miguel-Ayanz, J., T. Durrant, R. Boca (2024): [https://publications.jrc.ec.europa.eu/repository/handle/JRC139704 Forest Fires in Europe, Middle East and North Africa 2023], Publications Office of the European Union, Luxemb… | 1 |
| 08:44, 10. Aug. 2025 | Carrascal fire Portugal Aug 2023.jpg (Datei) |  |
87 KB | Dieter Kasang (Diskussion | Beiträge) | == Beschreibung == Das Carrascal Feuer im August 2023 in Zentral-Portugal. Betroffen war eine Kiefern-, Eukalyptus- und Buschvegetation. == Lizenzhinweis == {| style="border:1px solid #8888aa; background-color:#f7f8ff;padding:5px;font-size:95%;" |Quelle: San-Miguel-Ayanz, J., T. Durrant, R. Boca (2024): Forest Fires in Europe, Middle East and North Africa 2023, Publications Office of the European Union, Luxembourg, 2024, https://publications.jrc.ec.europa.eu/repository/handle/JRC139704 <br> Li… | 1 |
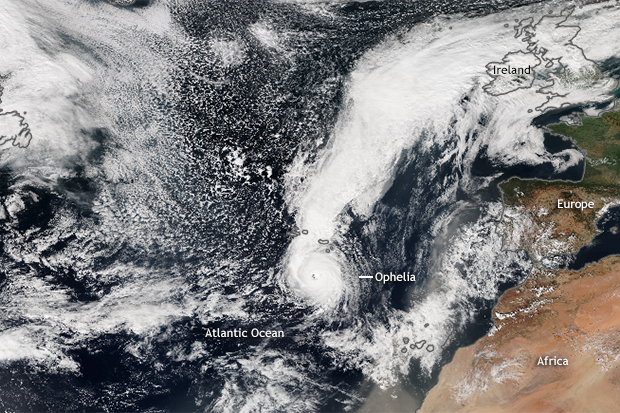
| 09:15, 8. Aug. 2025 | Hurrikan Ophelia E-Atlantik.png (Datei) |  |
671 KB | Dieter Kasang (Diskussion | Beiträge) | == Beschreibung == Ex-Hurrikan Ophelia über Irland am 16.10.2017 ==Lizenzhinweis== {| style="border:1px solid #8888aa; background-color:#f7f8ff;padding:5px;font-size:95%;" | Quelle: Di Liberto, T. (2017): [https://www.climate.gov/news-features/event-tracker/former-hurricane-ophelia-batters-ireland Former hurricane Ophelia batters Ireland]<br> Lizenz: NASA [https://earthobservatory.nasa.gov/ImageUse/ public domain] |} | 1 |
| 09:04, 8. Aug. 2025 | Feuerwetter-Häufigkeit-RCP4.jpg (Datei) | 89 KB | Dieter Kasang (Diskussion | Beiträge) | == Beschreibung == Feuerwetter-Häufigkeit in der Gegenwart 1985-2015 in % und Änderung der Feuerwetter-Häufigkeit nach den Szenarien RCP4.5 und RCP8.5 bis Ende des 21. Jahrhunderts in %. == Lizenzhinweis == {| style="border:1px solid #8888aa; background-color:#f7f8ff;padding:5px;font-size:95%;" |Quelle: Ruffault, J., T. Curt, V. Moronet al. (2020): Increased likelihood of heat-induced large wildfires in the Mediterranean Basin. Sci Rep 10, 13790 https://doi.org/10.1038/s41598-020-70069-z <br>… | 1 | |
| 08:58, 8. Aug. 2025 | Med-Ausdehnung-Feuersaison2.jpg (Datei) |  |
113 KB | Dieter Kasang (Diskussion | Beiträge) | == Beschreibung == Brandfläche der europäischen Mittelmeerländer Portugal, Griechenland, Spanien, Frankreich und Italien 2006-2019 in ha. == Lizenzhinweis == {| style="border:1px solid #8888aa; background-color:#f7f8ff;padding:5px;font-size:95%;" |Quelle: Meier, S., E. Strobl, R.J.R. Elliott & N. Kettridge (2023): [https://doi.org/10.1111/risa.14075 Cross-country risk quantification of extreme wildfires in Mediterranean Europe]. Risk Analysis, 43, 1745–1762<br> Lizenz: [http://creativecommons.o… | 1 |
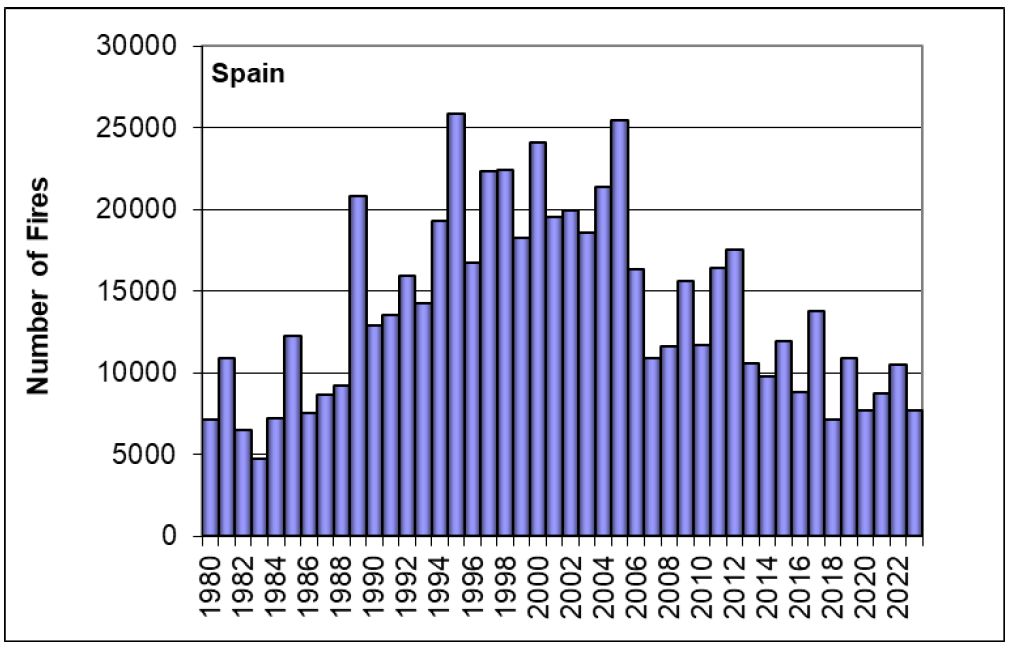
| 10:02, 6. Aug. 2025 | Spain fire number1980-2023.jpg (Datei) |  |
77 KB | Dieter Kasang (Diskussion | Beiträge) | == Beschreibung == Anzahl der Brände 1980-2023 == Lizenzhinweis == {| style="border:1px solid #8888aa; background-color:#f7f8ff;padding:5px;font-size:95%;" |Quelle: San-Miguel-Ayanz, J., T. Durrant, R. Boca (2024): [https://publications.jrc.ec.europa.eu/repository/handle/JRC139704 Forest Fires in Europe, Middle East and North Africa 2023], Publications Office of the European Union, Luxembourg, 2024<br> Lizenz: [http://creativecommons.org/licenses/by/4.0/ CC BY] |} | 1 |
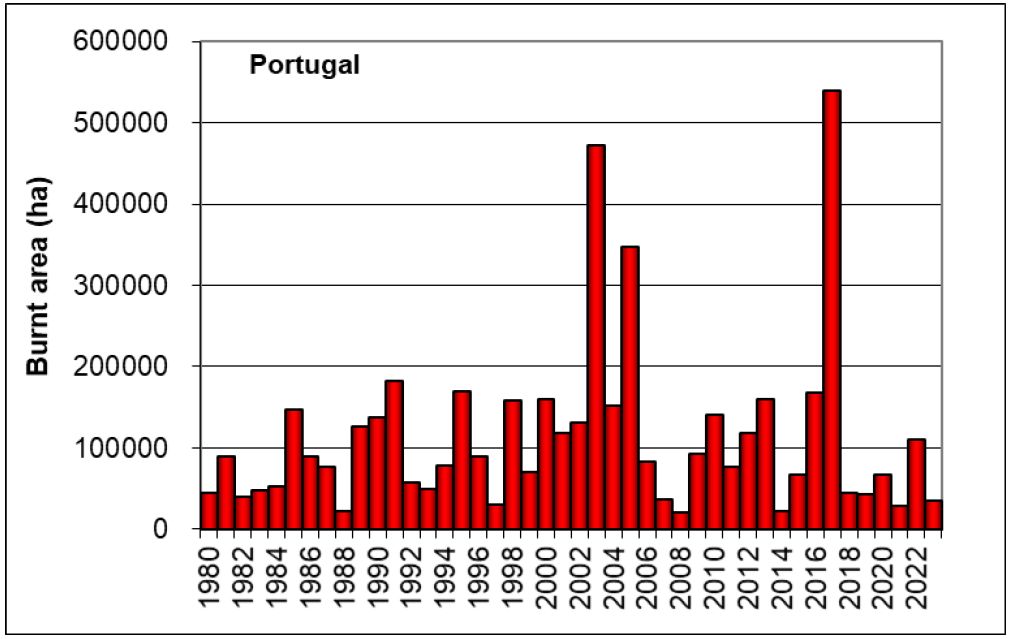
| 09:53, 6. Aug. 2025 | Burnt area Portugal1980-2023.jpg (Datei) |  |
67 KB | Dieter Kasang (Diskussion | Beiträge) | == Beschreibung == Verbrannte Fläche in Portugal 1980-2023 == Lizenzhinweis == {| style="border:1px solid #8888aa; background-color:#f7f8ff;padding:5px;font-size:95%;" |Quelle: San-Miguel-Ayanz, J., T. Durrant, R. Boca (2024): [https://publications.jrc.ec.europa.eu/repository/handle/JRC139704 Forest Fires in Europe, Middle East and North Africa 2023], Publications Office of the European Union, Luxembourg, 2024<br> Lizenz: [http://creativecommons.org/licenses/by/4.0/ CC BY] |} | 1 |
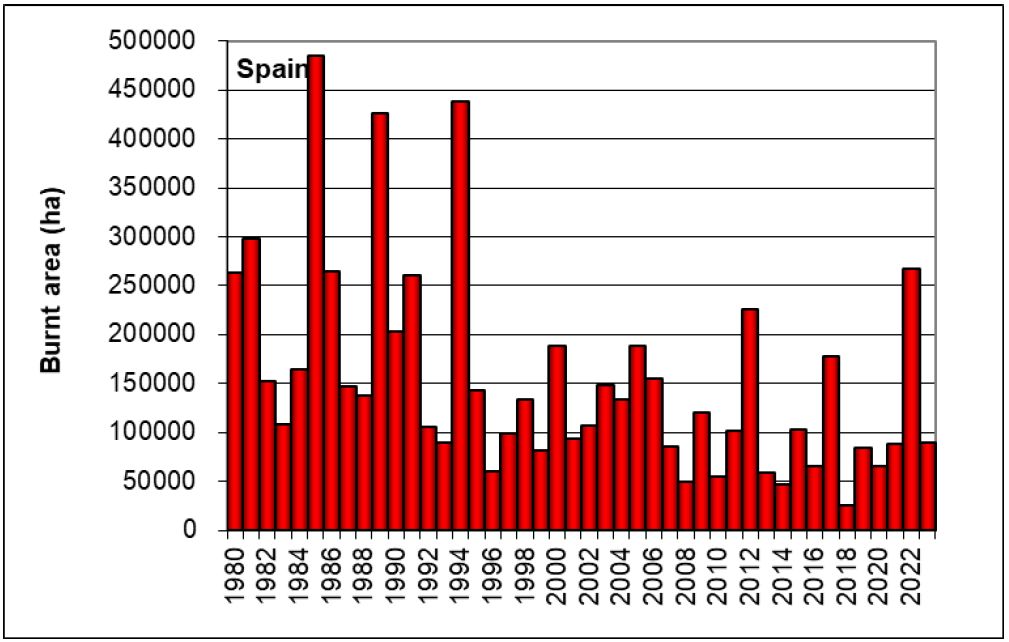
| 09:50, 6. Aug. 2025 | Burnt area Spain1980-2023.jpg (Datei) |  |
76 KB | Dieter Kasang (Diskussion | Beiträge) | == Beschreibung == Verbrannte Fläche in Spanien 1980-2023 == Lizenzhinweis == {| style="border:1px solid #8888aa; background-color:#f7f8ff;padding:5px;font-size:95%;" |Quelle: San-Miguel-Ayanz, J., T. Durrant, R. Boca (2024): [https://publications.jrc.ec.europa.eu/repository/handle/JRC139704 Forest Fires in Europe, Middle East and North Africa 2023], Publications Office of the European Union, Luxembourg, 2024<br> Lizenz: [http://creativecommons.org/licenses/by/4.0/ CC BY] |} | 1 |
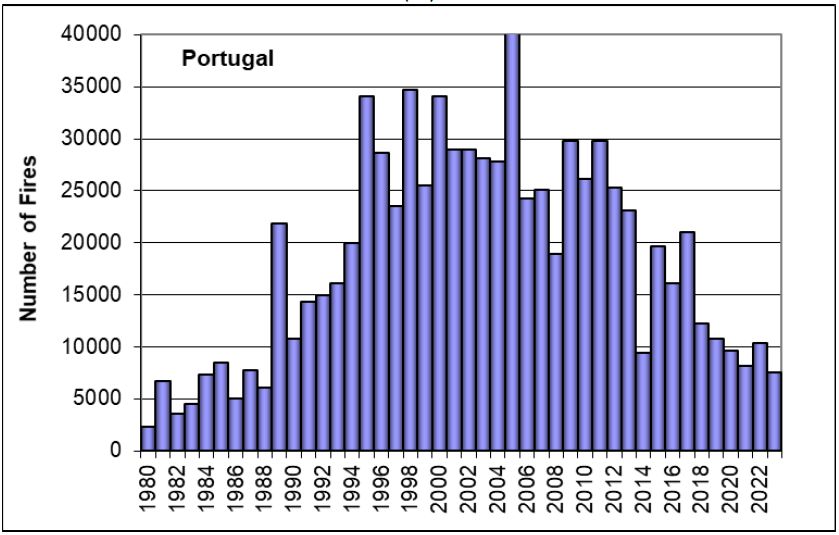
| 09:21, 6. Aug. 2025 | Portugal Anzahl Brände 1980-2023.jpg (Datei) |  |
59 KB | Dieter Kasang (Diskussion | Beiträge) | == Beschreibung == Anzahl der Brände in Portugal 1980-2023 == Lizenzhinweis == {| style="border:1px solid #8888aa; background-color:#f7f8ff;padding:5px;font-size:95%;" |Quelle: San-Miguel-Ayanz, J., T. Durrant, R. Boca (2024): Forest Fires in Europe, Middle East and North Africa 2023, Publications Office of the European Union, Luxembourg, 2024, https://publications.jrc.ec.europa.eu/repository/handle/JRC139704 <br> Lizenz: [http://creativecommons.org/licenses/by/4.0/ CC BY] |} | 1 |
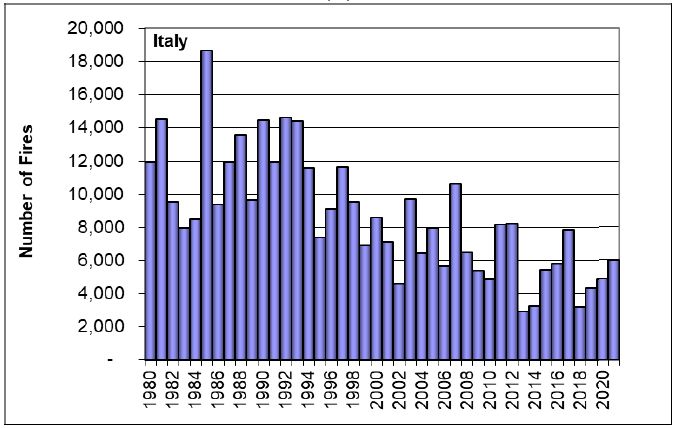
| 09:15, 6. Aug. 2025 | Italy fire number 1980-2021.jpg (Datei) |  |
47 KB | Dieter Kasang (Diskussion | Beiträge) | == Beschreibung == Anzahl der Brände in Italien 1980-2021 == Lizenzhinweis == {| style="border:1px solid #8888aa; background-color:#f7f8ff;padding:5px;font-size:95%;" |Quelle: San-Miguel-Ayanz, J., T. Durrant, R. Boca (2022): Forest Fires in Europe, Middle East and North Africa 2021, Publications Office of the European Union, Luxembourg, 2022, https://publications.jrc.ec.europa.eu/repository/handle/JRC130846 <br> Lizenz: [http://creativecommons.org/licenses/by/4.0/ CC BY] |} | 1 |
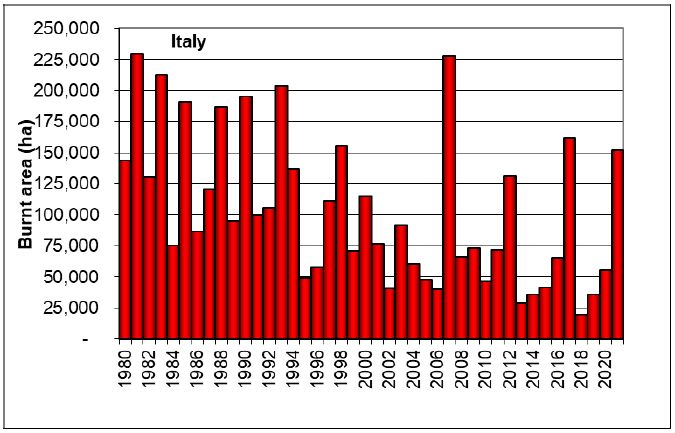
| 09:12, 6. Aug. 2025 | Italy burned area 1980-2021.jpg (Datei) |  |
52 KB | Dieter Kasang (Diskussion | Beiträge) | == Beschreibung == Verbrannte Fläche in Italien 1980-2021 == Lizenzhinweis == {| style="border:1px solid #8888aa; background-color:#f7f8ff;padding:5px;font-size:95%;" |Quelle: San-Miguel-Ayanz, J., T. Durrant, R. Boca (2022): Forest Fires in Europe, Middle East and North Africa 2021, Publications Office of the European Union, Luxembourg, 2022, https://publications.jrc.ec.europa.eu/repository/handle/JRC130846 <br> Lizenz: [http://creativecommons.org/licenses/by/4.0/ CC BY] |} | 1 |
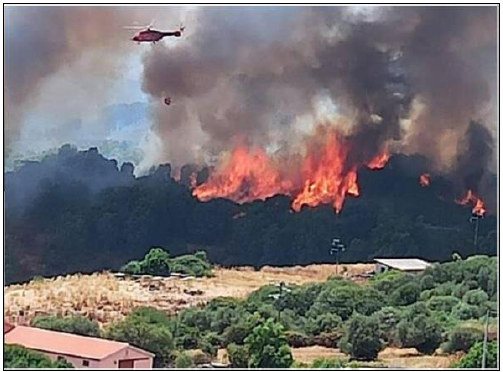
| 09:08, 6. Aug. 2025 | Wildfire 2021 Sardinia.png (Datei) |  |
398 KB | Dieter Kasang (Diskussion | Beiträge) | == Beschreibung == Waldbrände 2021 auf Sardinien == Lizenzhinweis == {| style="border:1px solid #8888aa; background-color:#f7f8ff;padding:5px;font-size:95%;" |Quelle: San-Miguel-Ayanz, J., T. Durrant, R. Boca (2022): Forest Fires in Europe, Middle East and North Africa 2021, Publications Office of the European Union, Luxembourg, 2022, https://publications.jrc.ec.europa.eu/repository/handle/JRC130846<br> Lizenz: [http://creativecommons.org/licenses/by/4.0/ CC BY] |} | 1 |
| 15:58, 5. Aug. 2025 | Brandfläche-Mittelmeerraum.jpg (Datei) |  |
38 KB | Dieter Kasang (Diskussion | Beiträge) | Brandfläche der europäischen Mittelmeerländer Portugal, Griechenland, Spanien, Frankreich und Italien 2006-2019 in ha. == Lizenzhinweis == {| style="border:1px solid #8888aa; background-color:#f7f8ff;padding:5px;font-size:95%;" |Quelle: Meier, S., E. Strobl, R.J.R. Elliott & N. Kettridge (2023): Cross-country risk quantification of extreme wildfires in Mediterranean Europe. Risk Analysis, 43, 1745–1762. https://doi.org/10.1111/risa.14075<br> Lizenz: CC BY http://creativecommons.org/licenses/by/… | 1 |
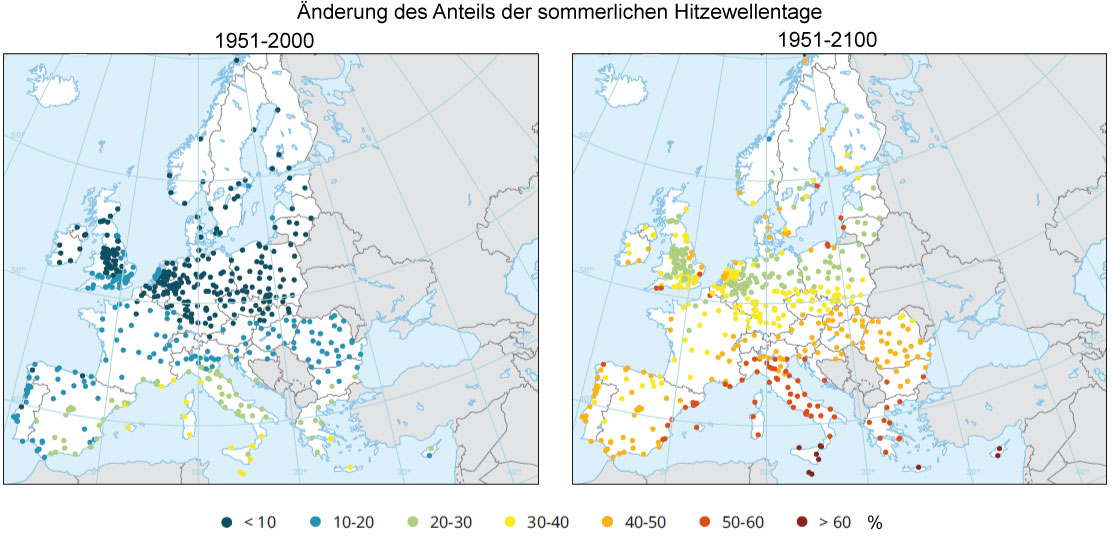
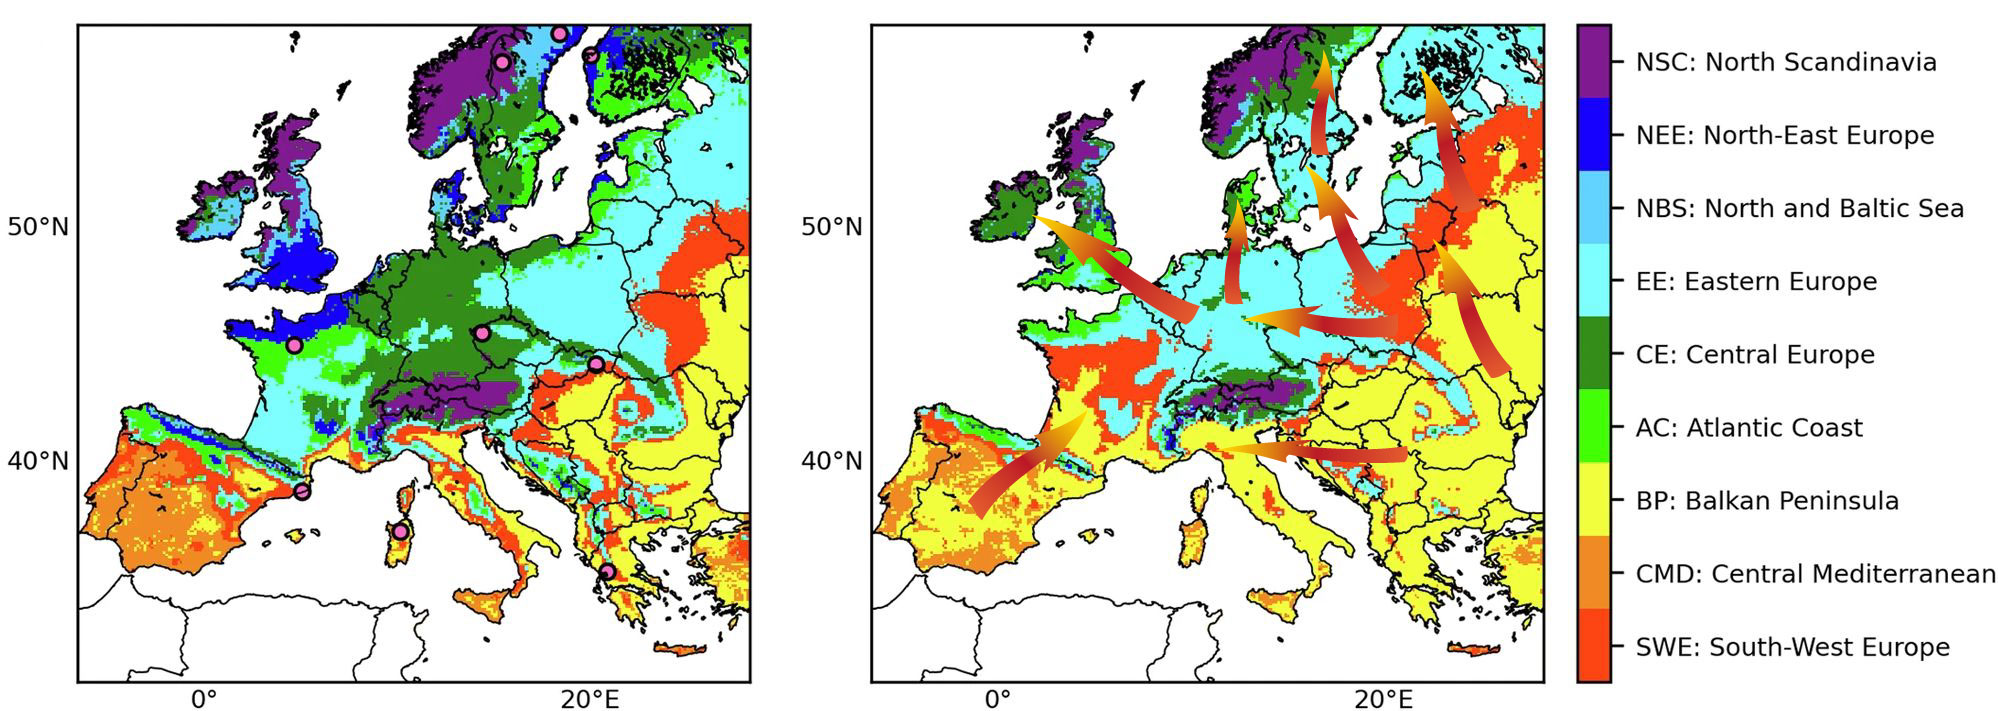
| 11:02, 31. Jul. 2025 | Eu-heatwave-days-2051-2100.jpg (Datei) |  |
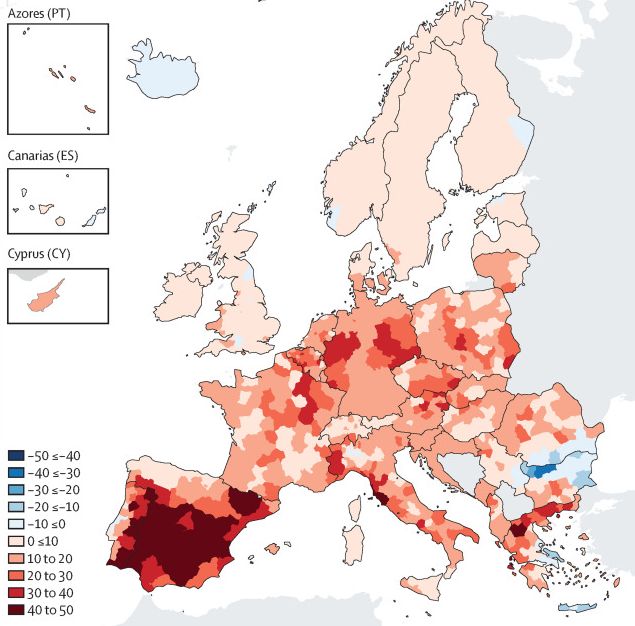
136 KB | Dieter Kasang (Diskussion | Beiträge) | == Beschreibung == Ausdehnung heißer und trockener Sommer bei einer globalen Erwärmung um 3°C (Pfeile hinzugefügt). == Lizenzhinweis == {| style="border:1px solid #8888aa; background-color:#f7f8ff;padding:5px;font-size:95%;" |Quelle: Felsche, E., Böhnisch, A., Poschlod, B. et al. (2024): European hot and dry summers are projected to become more frequent and expand northwards. Commun Earth Environ 5, 410 https://doi.org/10.1038/s43247-024-01575-5<br> Lizenz: [https://creativecommons.org/license… | 1 |
| 09:22, 31. Jul. 2025 | Eu-Hitzewellen-aktuell-GWL3.jpg (Datei) |  |
318 KB | Dieter Kasang (Diskussion | Beiträge) | == Beschreibung == Ausdehnung heißer und trockener Sommer bei einer globalen Erwärmung um 3°C. == Lizenzhinweis == {| style="border:1px solid #8888aa; background-color:#f7f8ff;padding:5px;font-size:95%;" |Quelle: Felsche, E., Böhnisch, A., Poschlod, B. et al. (2024): European hot and dry summers are projected to become more frequent and expand northwards. Commun Earth Environ 5, 410 https://doi.org/10.1038/s43247-024-01575-5<br> Lizenz: [https://creativecommons.org/licenses/by/4.0/ CC BY 4.0]… | 1 |
| 18:59, 28. Jul. 2025 | Dürre-CO2-Wasser.jpg (Datei) |  |
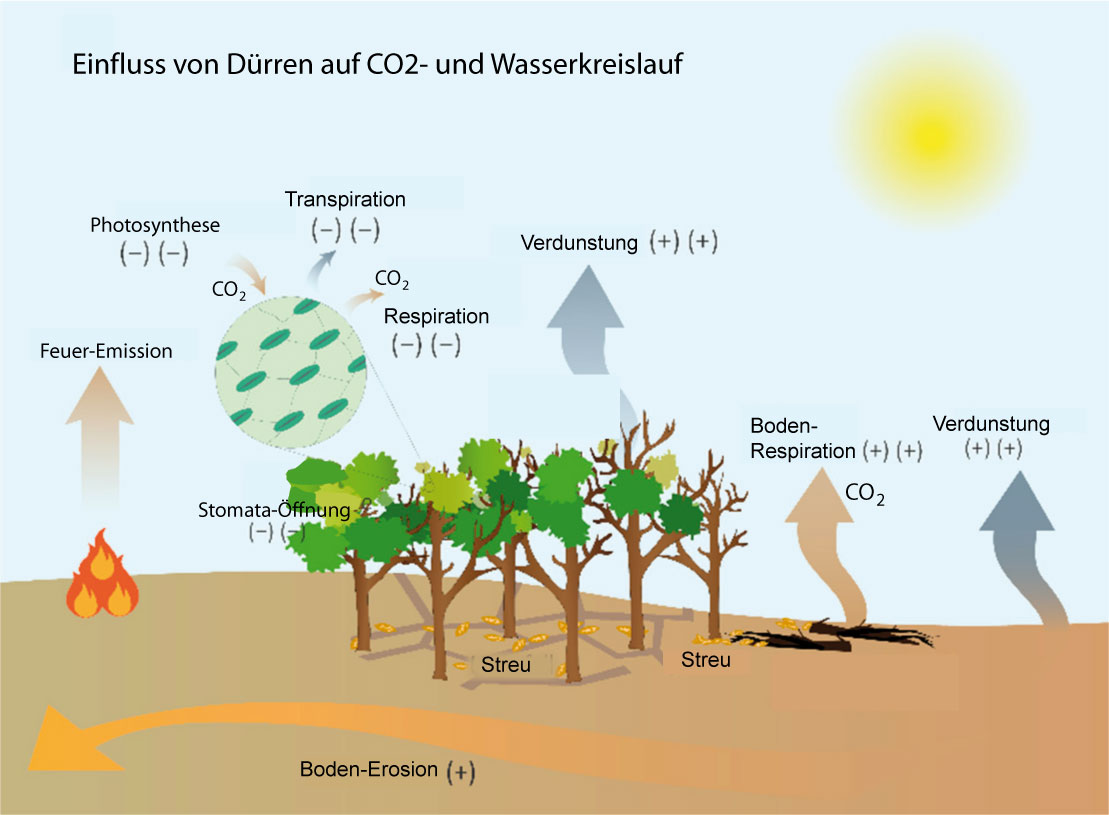
96 KB | Dieter Kasang (Diskussion | Beiträge) | == Beschreibung == Kohlenstoff- und Wasserflüsse bei einer starken Dürre. Orangene Pfeile zeigen den Kohlenstofffluss, blaue Pfeile den Wasserfluss. Die Größe der Pfeile gibt die Größe der Flüsse an. +/- zeigen Zu- und Abnahmen der Flüsse. Die Pflanzenrespiration bezieht sich auf Blätter und den Stamm, die Bodenrespiration auf Wurzeln, Laubfall und organische Bestandteile im Boden. == Lizenzhinweis == {| style="border:1px solid #8888aa; background-color:#f7f8ff;padding:5px;font-size:95%;" | Que… | 1 |
| 18:56, 28. Jul. 2025 | Baumgruppe-CO2-Wasser.jpg (Datei) |  |
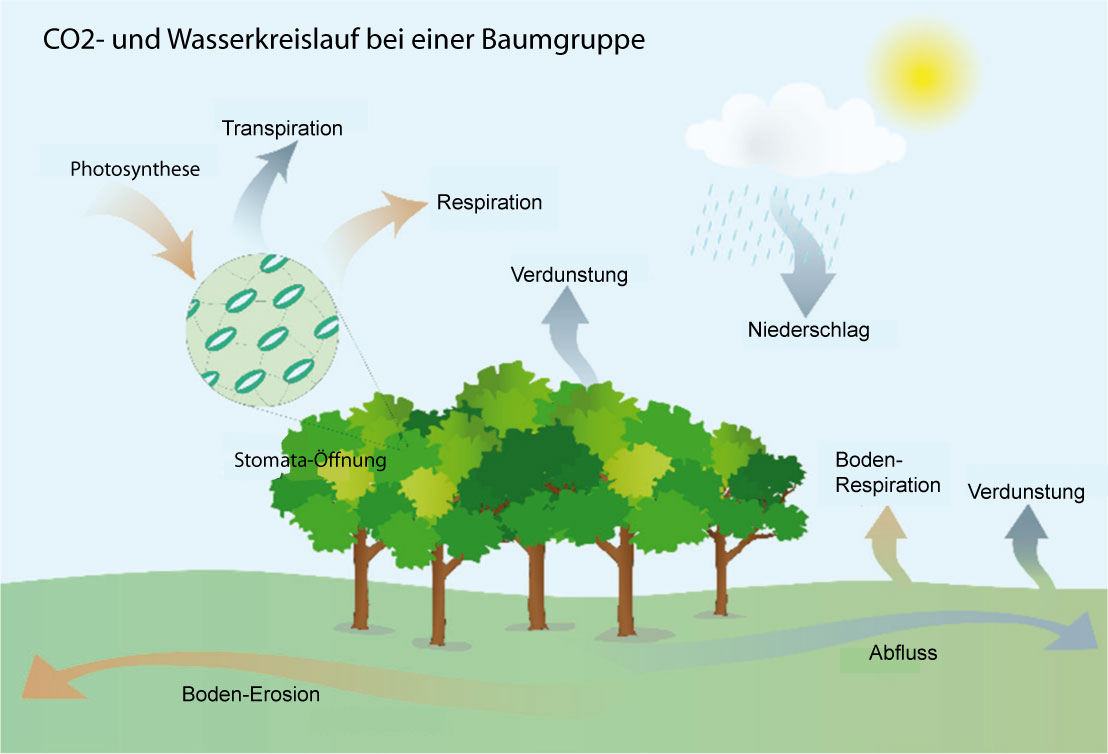
79 KB | Dieter Kasang (Diskussion | Beiträge) | == Beschreibung == Kohlenstoff- und Wasserflüsse vor einem Dürreereignis. Orangene Pfeile zeigen den Kohlenstofffluss, blaue Pfeile den Wasserfluss. Die Größe der Pfeile gibt die Größe der Flüsse an. +/- zeigen Zu- und Abnahmen der Flüsse. Die Pflanzenrespiration bezieht sich auf Blätter und den Stamm, die Bodenrespiration auf Wurzeln, Laubfall und organische Bestandteile im Boden. == Lizenzhinweis == {| style="border:1px solid #8888aa; background-color:#f7f8ff;padding:5px;font-size:95%;" | Que… | 1 |
| 18:41, 28. Jul. 2025 | Dürrefolgen-Pflanzen.jpg (Datei) |  |
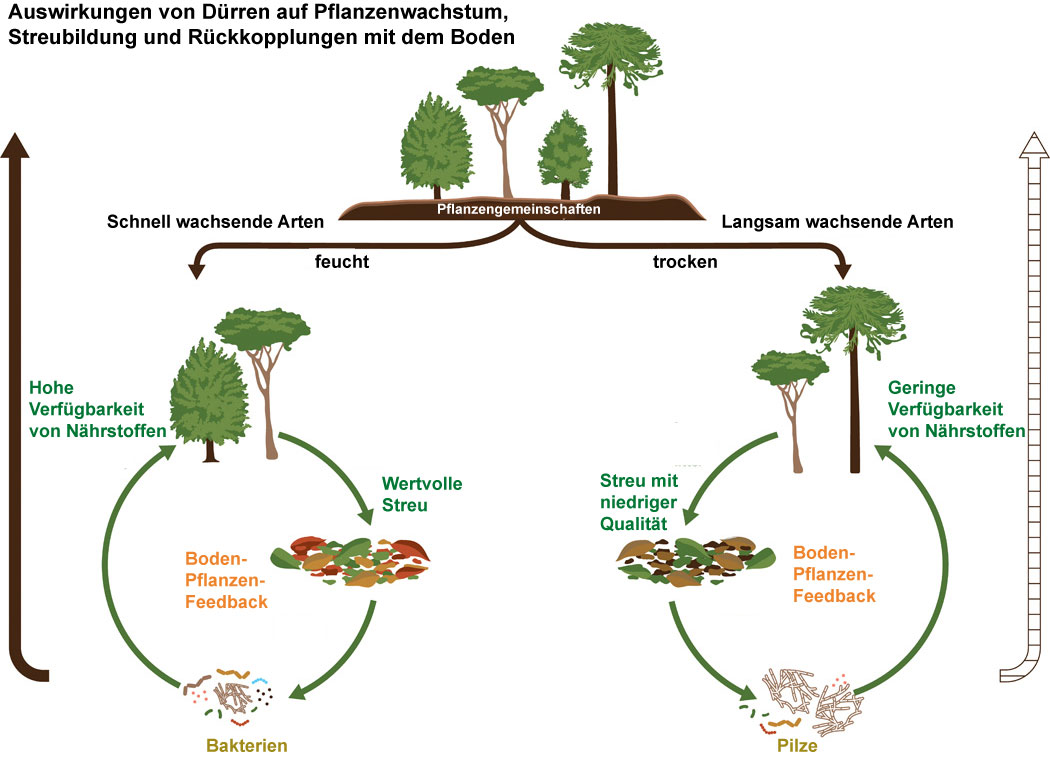
111 KB | Dieter Kasang (Diskussion | Beiträge) | == Beschreibung == Auswirkungen von Dürren auf Pflanzenwachstum, Streubildung und Rückkopplungen mit dem Boden == Lizenzhinweis == {| style="border:1px solid #8888aa; background-color:#f7f8ff;padding:5px;font-size:95%;" | Quelle: Pugnaire, F.I., J.A. Moillo, J. Peñuelas et al. (2019): Climate change effects on plant-soil feedbacks and consequences for biodiversity and functioning of terrestrial ecosystems.Sci. Adv.5, https://www.science.org/doi/10.1126/sciadv.aaz1834<br> Lizenz: CC BY-NC http:/… | 1 |
