Dateiliste
Aus Klimawandel
Diese Spezialseite listet alle hochgeladenen Dateien auf.
| Datum | Name | Vorschaubild | Größe | Benutzer | Beschreibung | Versionen |
|---|---|---|---|---|---|---|
| 19:21, 10. Nov. 2024 | NH summer temp 1600-2000.jpg (Datei) |  |
90 KB | Dieter Kasang (Diskussion | Beiträge) | == Beschreibung == Sommertemperaturen auf der außertropischen Nordhalbkugel als Abweichung vom Mittel 1901-1980 ==Lizenzhinweis== {| style="border:1px solid #8888aa; background-color:#f7f8ff;padding:5px;font-size:95%;" |Quelle: Franke, J., S. Brönnimann, J. Bhend et al. (2027): A monthly global paleo-reanalysis of the atmosphere from 1600 to 2005 for studying past climatic variations. Sci Data 4, 170076 https://doi.org/10.1038/sdata.2017.76<br> Lizenz: [http://creativecommons.org/licenses/by/4.… | 1 |
| 19:15, 10. Nov. 2024 | Temp-1200.jpg (Datei) |  |
50 KB | Dieter Kasang (Diskussion | Beiträge) | == Beschreibung == Temperaturänderungen der letzten 2000 Jahre ==Lizenzhinweis== {| style="border:1px solid #8888aa; background-color:#f7f8ff;padding:5px;font-size:95%;" |Quelle: Wikimedia Commons (Autor: DeWikiMan) : [https://commons.wikimedia.org/wiki/File:Temp_anomalies_2000yrs_pages2k-de.svg Temperaturanomalien der letzten 2000 Jahre], basierend auf Daten und Berechnungen von Pages2K (2019), doi:10.1038/s41561-019-0400-0, in Anlehnung an Abb. 1a<br> Lizenz: [https://creativecommons.org/lice… | 1 |
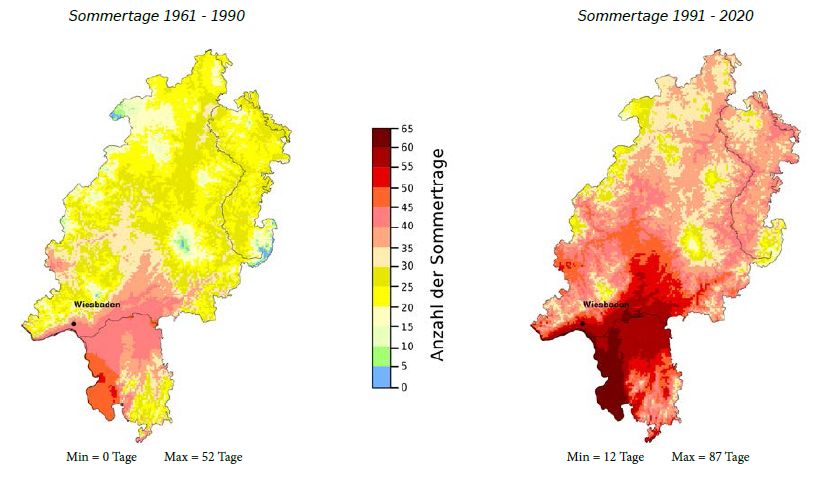
| 19:32, 4. Nov. 2024 | Hessen Sommertage 1961-2020.jpg (Datei) |  |
53 KB | Dieter Kasang (Diskussion | Beiträge) | == Beschreibung == Jahresmitteltemperatur in Frankfurt am Main. Die Werte vor 1949 sind um den Effekt der städtischen Wärmenínsel berreinigt. Danach befand sich der Messtndort am Flughafen. ==Lizenzhinweis== {| style="border:1px solid #8888aa; background-color:#f7f8ff;padding:5px;font-size:95%;" | Quelle: DWD und HLNUG (2024): [https://www.dwd.de/DE/leistungen/klimareports/klimareport%20he%202024%20download.html Klimareport Hessen]; Deutscher Wetterdienst, Offenbach am Main und Hessisches Lande… | 1 |
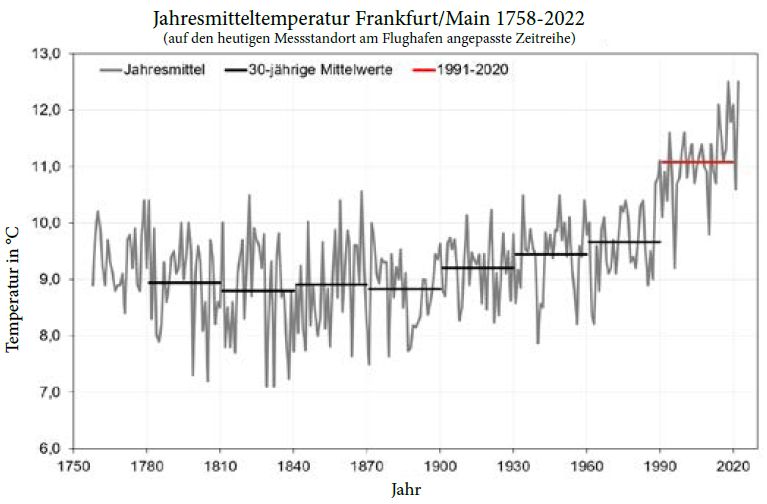
| 19:31, 4. Nov. 2024 | Temp Frankfurt a.M. 1758-2022.jpg (Datei) |  |
45 KB | Dieter Kasang (Diskussion | Beiträge) | == Beschreibung == Jahresmitteltemperatur in Frankfurt am Main. Die Werte vor 1949 sind um den Effekt der städtischen Wärmenínsel berreinigt. Danach befand sich der Messtndort am Flughafen. ==Lizenzhinweis== {| style="border:1px solid #8888aa; background-color:#f7f8ff;padding:5px;font-size:95%;" | Quelle: DWD und HLNUG (2024): [https://www.dwd.de/DE/leistungen/klimareports/klimareport%20he%202024%20download.html Klimareport Hessen]; Deutscher Wetterdienst, Offenbach am Main und Hessisches Lande… | 1 |
| 16:58, 2. Nov. 2024 | Global circulation.jpg (Datei) |  |
43 KB | Dieter Kasang (Diskussion | Beiträge) | == Beschreibung == Hadley-Zelle mit globaler Zirkulation ==Lizenzhinweis== {| style="border:1px solid #8888aa; background-color:#f7f8ff;padding:5px;font-size:95%;" | Quelle: Terzi, L., G. Wotawa, M. Schoeppner et al. (2020): [https://doi.org/10.1038/s41598-020-66541-5 Radioisotopes demonstrate changes in global atmospheric circulation possibly caused by global warming]. Sci Rep 10, 10695<br> Lizenz: [http://creativecommons.org/licenses/by/4.0/ CC BY] |} | 1 |
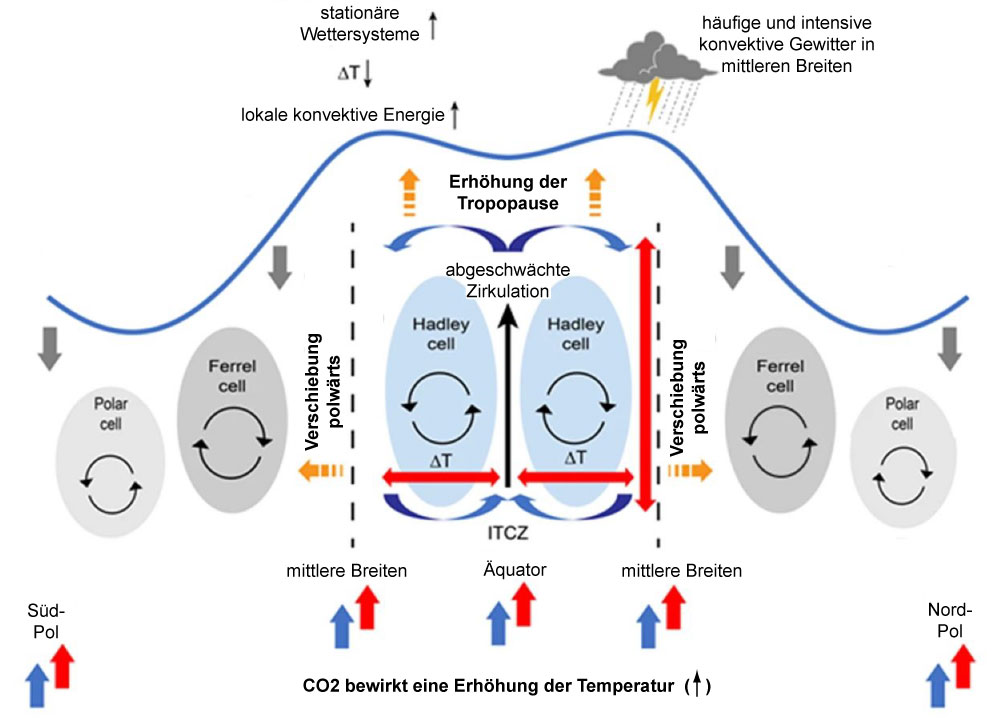
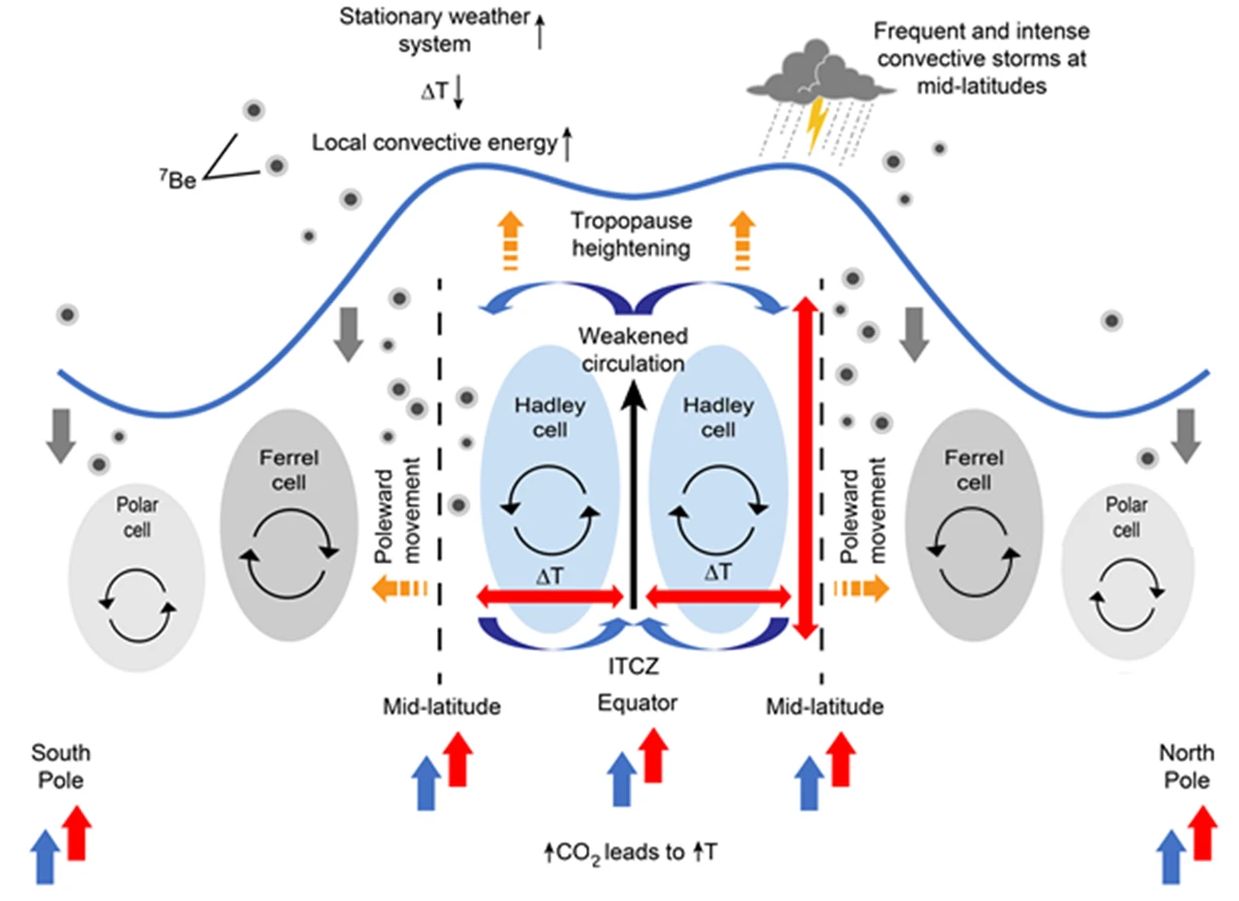
| 16:44, 2. Nov. 2024 | Global-circulation-cc-dt.jpg (Datei) |  |
86 KB | Dieter Kasang (Diskussion | Beiträge) | == Beschreibung == Änderung der globalen Zirkulation durch den Klimawandel ==Lizenzhinweis== {| style="border:1px solid #8888aa; background-color:#f7f8ff;padding:5px;font-size:95%;" | Quelle: Terzi, L., G. Wotawa, M. Schoeppner et al. (2020): [https://doi.org/10.1038/s41598-020-66541-5 Radioisotopes demonstrate changes in global atmospheric circulation possibly caused by global warming]. Sci Rep 10, 10695<br> Lizenz: [http://creativecommons.org/licenses/by/4.0/ CC BY] |} | 1 |
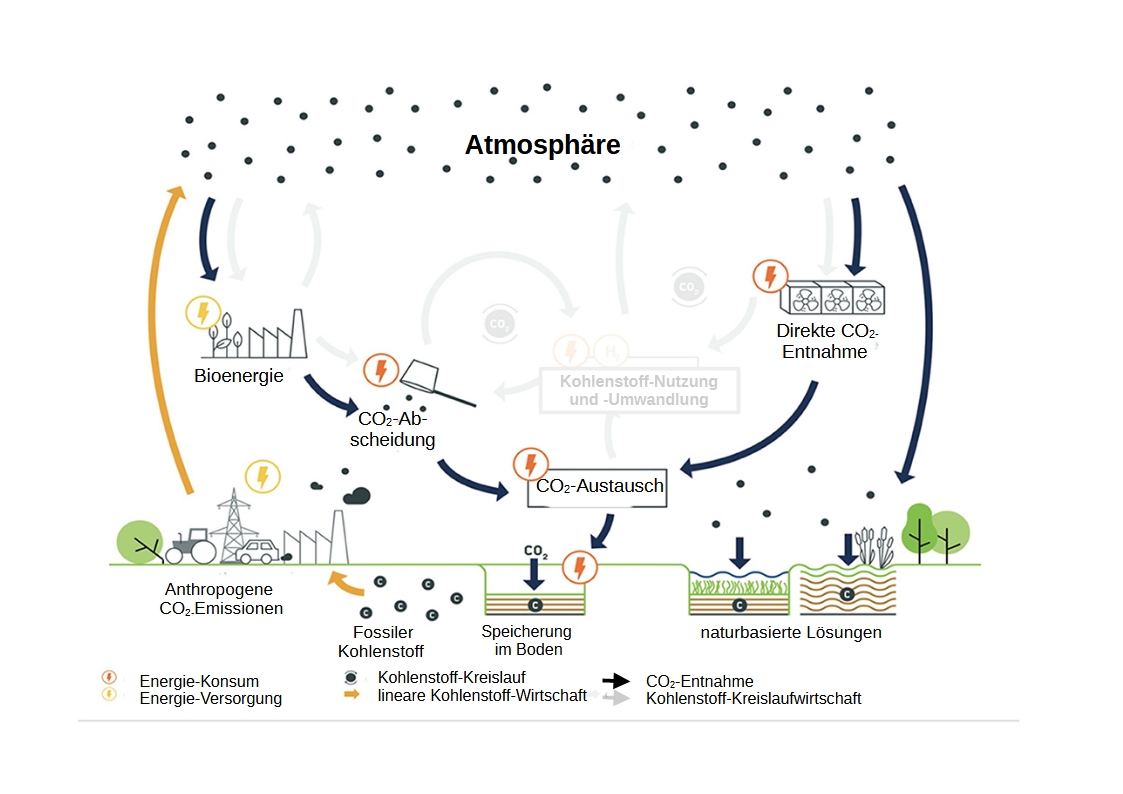
| 20:15, 29. Okt. 2024 | Carbon dioxide removal circ economy dt.jpg (Datei) |  |
205 KB | Dieter Kasang (Diskussion | Beiträge) | == Beschreibung == Historische Verbrennung von fossilem Kohlenstoff (orangene Pfeile) und CDR (schwarze Pfeile) == Lizenzhinweis == {| style="border:1px solid #8888aa; background-color:#f7f8ff;padding:5px;font-size:95%;" |Quelle: Förster, J., S. Beck. M. Borchers et al. (2022): Framework for Assessing the Feasibility of Carbon Dioxide Removal Options Within the National Context of Germany. Front. Clim. 4:758628. doi: 10.3389/fclim.2022.758628; Bildquelle: Helmholtz Climate Initiative // Tanja H… | 1 |
| 19:56, 29. Okt. 2024 | Carbon Capture Storage dt.jpg (Datei) |  |
108 KB | Dieter Kasang (Diskussion | Beiträge) | == Beschreibung == Abscheidung sowie terrestrische und geologische Speicherung von Kohlendioxid == Lizenzhinweis == {| style="border:1px solid #8888aa; background-color:#f7f8ff;padding:5px;font-size:95%;" |Quelle: Wikimedia Commons (2009): Schematic showing both terrestrial and geological sequestration of carbon dioxide emissions from a biomass or fossil fuel power station. Author: LeJean Hardin and Jamie Payne ; https://commons.wikimedia.org/wiki/File:Carbon_sequestration-2009-10-07.svg Liz… | 1 |
| 16:29, 25. Okt. 2024 | Global circulation change cc.jpg (Datei) |  |
80 KB | Dieter Kasang (Diskussion | Beiträge) | == Beschreibung == Änderung der globalen Zirkulation durch den Klimawandel ==Lizenzhinweis== {| style="border:1px solid #8888aa; background-color:#f7f8ff;padding:5px;font-size:95%;" | Quelle: Terzi, L., G. Wotawa, M. Schoeppner et al. (2020): Radioisotopes demonstrate changes in global atmospheric circulation possibly caused by global warming. Sci Rep 10, 10695, https://doi.org/10.1038/s41598-020-66541-5 <br> Lizenz: [http://creativecommons.org/licenses/by/4.0/ CC BY] |} | 1 |
| 18:47, 22. Okt. 2024 | Dams surface water change.jpg (Datei) |  |
121 KB | Dieter Kasang (Diskussion | Beiträge) | == Beschreibung == Änderung des Oberflächenwassers durch Studämme 1984-2018 nach Ländern. Die gelben Kreise zeigen die Anzahl der Staudämme pro Land an, die blauen Farbabstufungen die Änderungen der Wasserobefläche durch die Errichtung von Staudämmen. ==Lizenzhinweis== {| style="border:1px solid #8888aa; background-color:#f7f8ff;padding:5px;font-size:95%;" | Quelle: Zhang, A.T., & V.X. Gu (2023): Global Dam Tracker: A database of more than 35,000 dams with location, catchment, and attribute inf… | 1 |
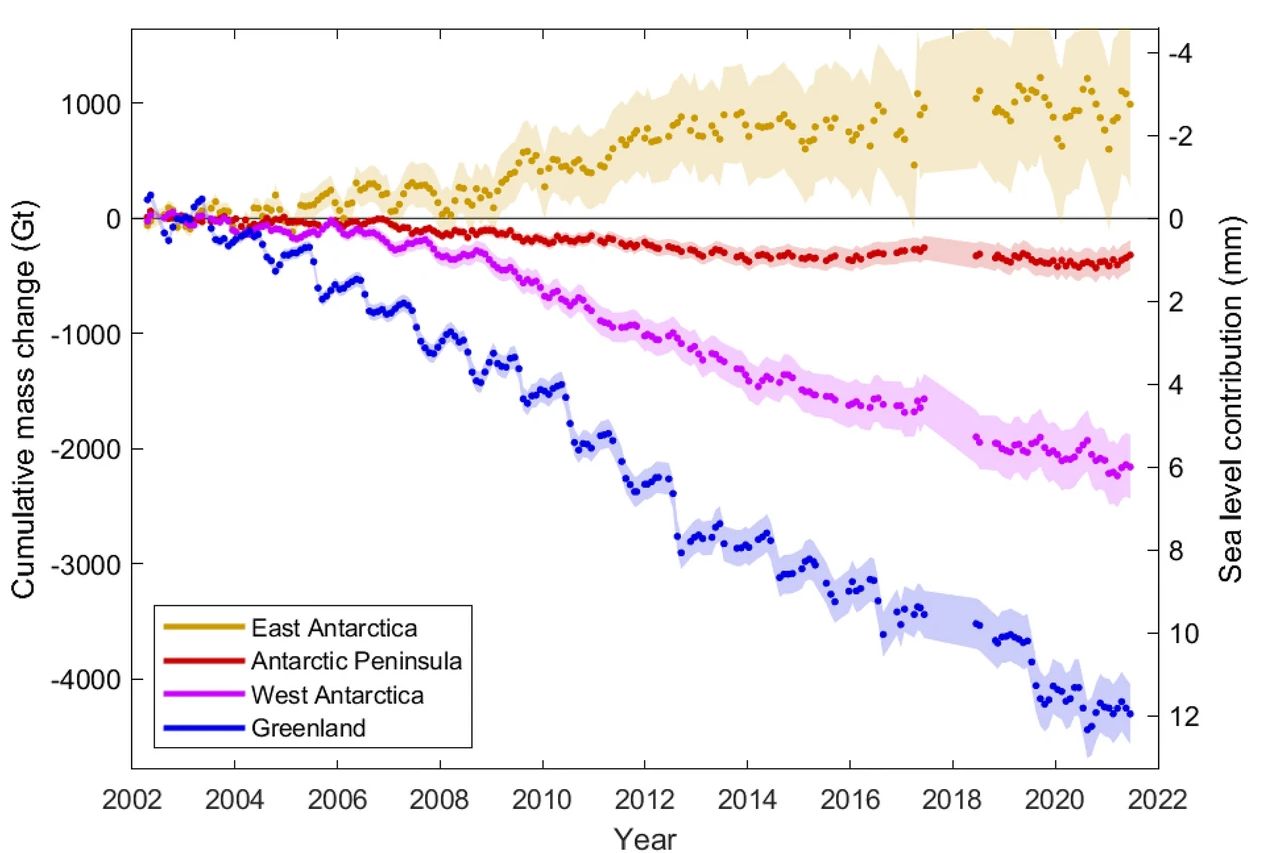
| 14:05, 19. Okt. 2024 | Antarctica Greenland MB SLR.jpg (Datei) |  |
97 KB | Dieter Kasang (Diskussion | Beiträge) | == Beschreibung == Massenbilanz und Beitrag zum Meeresspiegelanstieg des Grönländischen Eisschilds und der einzelnen Antarktischen Eisschilde 2002-2021 ==Lizenzhinweis== {| style="border:1px solid #8888aa; background-color:#f7f8ff;padding:5px;font-size:95%;" | Quelle: Otosaka, I.N., M. Horwath, R. Mottram et al. (2023): Mass Balances of the Antarctic and Greenland Ice Sheets Monitored from Space. Surv Geophys 44, 1615–1652, https://doi.org/10.1007/s10712-023-09795-8<br> Lizenz: [https://creativ… | 1 |
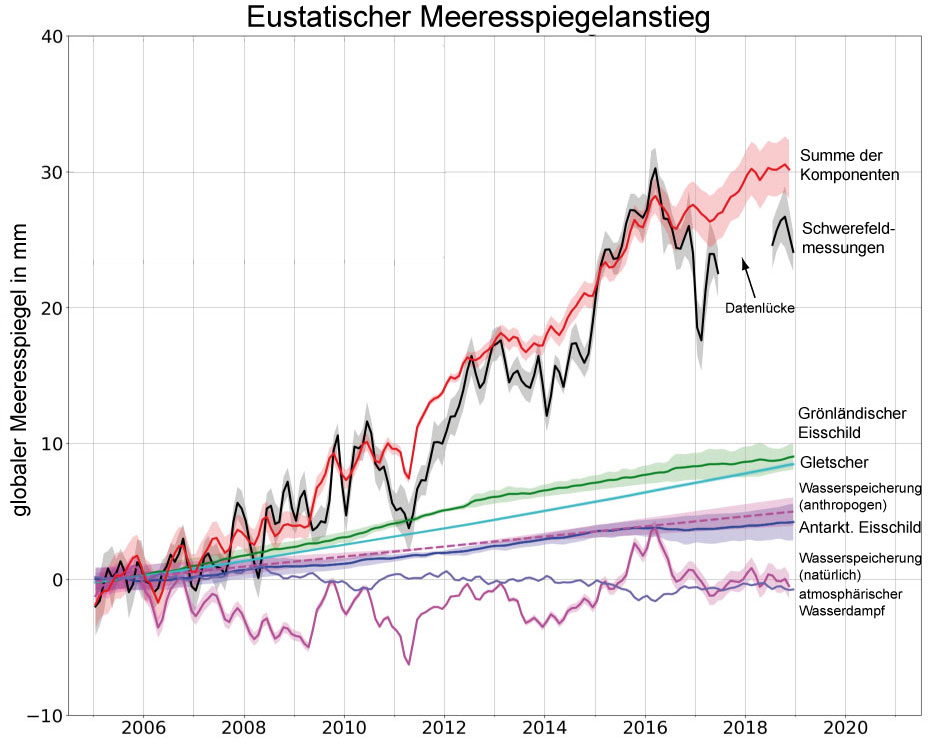
| 10:24, 18. Okt. 2024 | Ocean-MB-2005-2019dt.jpg (Datei) |  |
103 KB | Dieter Kasang (Diskussion | Beiträge) | == Beschreibung == Eustatischer Meeresspiegelanstieg nach Summe der Komponenten und Schwerefeldmessungen (GRACE) sowie Änderung durch einzelne Komponenten. ==Lizenzhinweis== {| style="border:1px solid #8888aa; background-color:#f7f8ff;padding:5px;font-size:95%;" | Barnoud, A., J. Pfeffer, A. Cazenave et al. (2023): [https://doi.org/10.5194/os-19-321-2023 Revisiting the global mean ocean mass budget over 2005–2020], Ocean Sci., 19, 321–334<br> Lizenz: [https://creativecommons.org/licenses/by/4.0… | 1 |
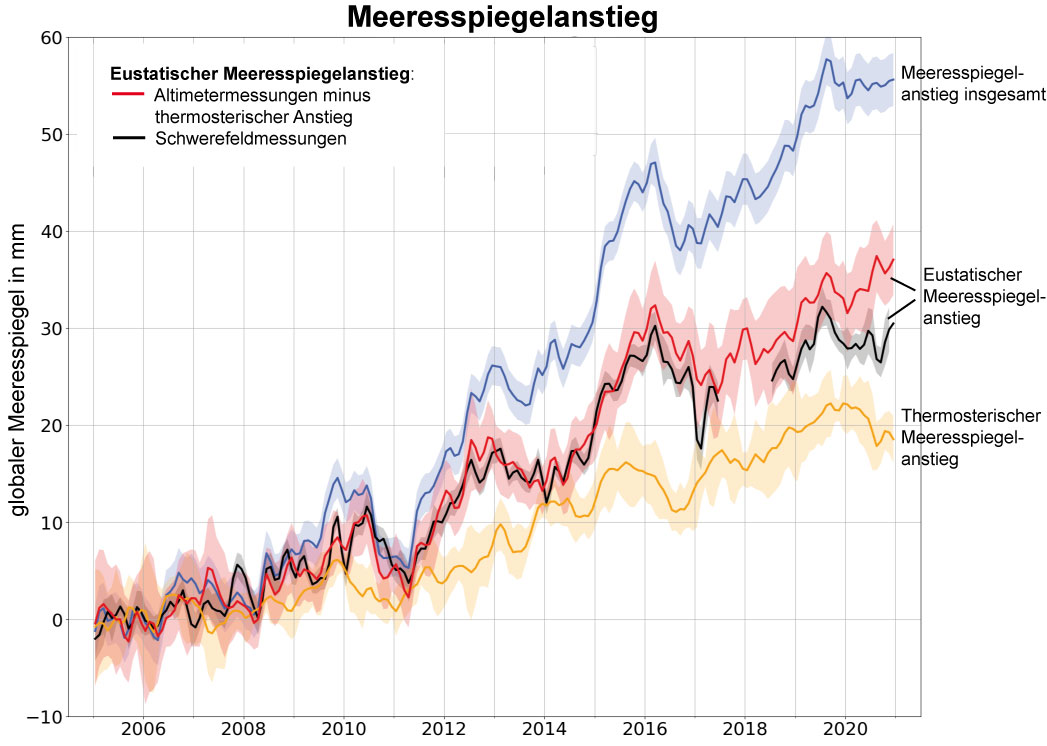
| 10:19, 18. Okt. 2024 | Global-SLR-2005-2021dt.jpg (Datei) |  |
116 KB | Dieter Kasang (Diskussion | Beiträge) | == Beschreibung == Eustatischer und thermosterischer Meeresspiegelanstieg 2005-2021 ==Lizenzhinweis== {| style="border:1px solid #8888aa; background-color:#f7f8ff;padding:5px;font-size:95%;" | Barnoud, A., Pfeffer, J., Cazenave, A., Fraudeau, R., Rousseau, V., and Ablain, M.: Revisiting the global mean ocean mass budget over 2005–2020, Ocean Sci., 19, 321–334, https://doi.org/10.5194/os-19-321-2023<br> Lizenz: CC BY https://creativecommons.org/licenses/by/4.0/ |} | 1 |
| 15:56, 14. Okt. 2024 | Decadal ocean heat uptake.jpg (Datei) |  |
58 KB | Dieter Kasang (Diskussion | Beiträge) | == Beschreibung == Wärmeaufnahme in den oberen 2000 m des Ozeans 1955-2020 nach Jahrzehnten in 1022 Joule bezogen auf das Mittel von 2016-2020 nach verschiedenen Datensätzen. Rot: Wärmegehalt des Ozeans, vertikale Balken: Unsicherheitsbereich. ==Lizenzhinweis== {| style="border:1px solid #8888aa; background-color:#f7f8ff;padding:5px;font-size:95%;" | Quelle: Li, Z., M.H. England & S. Groeskamp (2023): Recent acceleration in global ocean heat accumulation by mode and intermediate waters. Nat Com… | 1 |
| 15:44, 14. Okt. 2024 | Steric sea level 1993-2017.jpg (Datei) |  |
331 KB | Dieter Kasang (Diskussion | Beiträge) | Sterischer Meeresspiegelanstieg 1993-2017 ==Lizenzhinweis== {| style="border:1px solid #8888aa; background-color:#f7f8ff;padding:5px;font-size:95%;" | Camargo, C.M.L., R.E.M. Riva, T.H.J. Hermans, A.B.A. Slangen (2020): Exploring sources of uncertainty in steric Sea-level change estimates. J. Geophys. Res. Oceans 125, 1–18. https://doi.org/10.1029/2020JC016551 Lizenz: CC BY http://creativecommons.org/licenses/by/4.0/ |} | 1 |
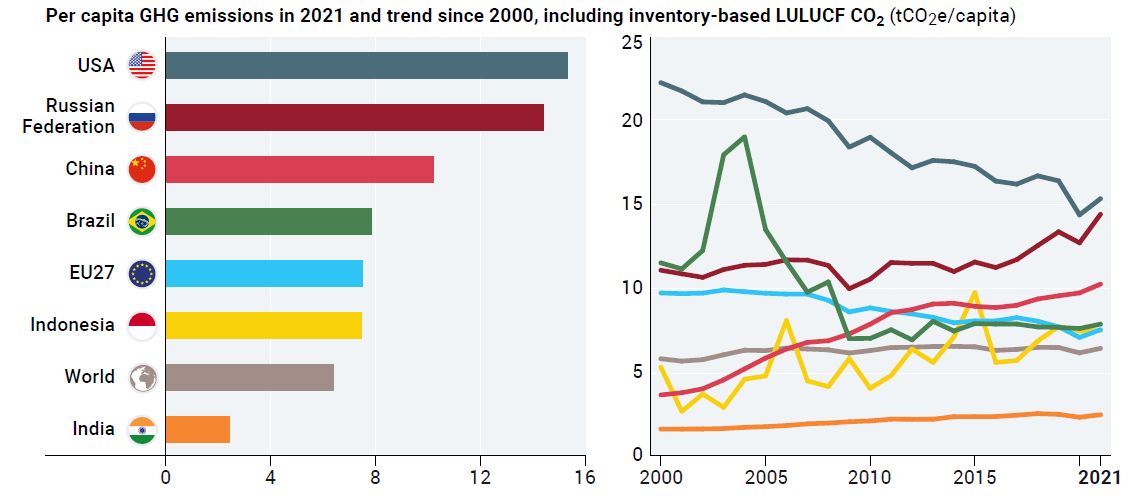
| 10:42, 14. Okt. 2024 | GHG-per-capita-emission2021.jpg (Datei) |  |
62 KB | Dieter Kasang (Diskussion | Beiträge) | == Beschreibung == Treibhausgasemissionen pro Kopf 2021 und Trend seit 2000 nach Staaten in GtCO2-Äquivalente (mit Landnutzung) ==Lizenzhinweis== {| style="border:1px solid #8888aa; background-color:#f7f8ff;padding:5px;font-size:95%;" | Quelle: UNEP, United Nations Environment Programme (2023): [https://doi.org/10.59117/20.500.11822/43922 Emissions Gap Report 2023: Broken Record – Temperatures hit new highs, yet world fails to cut emissions (again)]. Nairobi<br> Lizenz: This publication may be… | 1 |
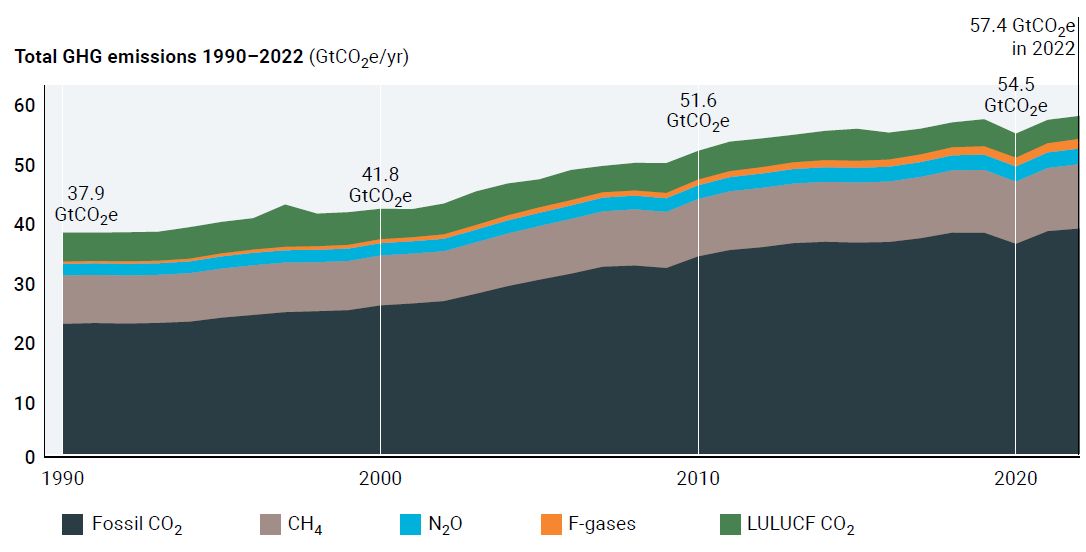
| 10:22, 14. Okt. 2024 | THG emission 1990-2022.jpg (Datei) |  |
44 KB | Dieter Kasang (Diskussion | Beiträge) | == Beschreibung == Treibhausgasemissionen 1990-2022 ==Lizenzhinweis== {| style="border:1px solid #8888aa; background-color:#f7f8ff;padding:5px;font-size:95%;" | Quelle:UNEP, United Nations Environment Programme (2023): Emissions Gap Report 2023: Broken Record – Temperatures hit new highs, yet world fails to cut emissions (again). Nairobi<br> Lizenz: This publication may be reproduced in whole or in part and in any form for educational or non-profit services without special permission from th… | 1 |
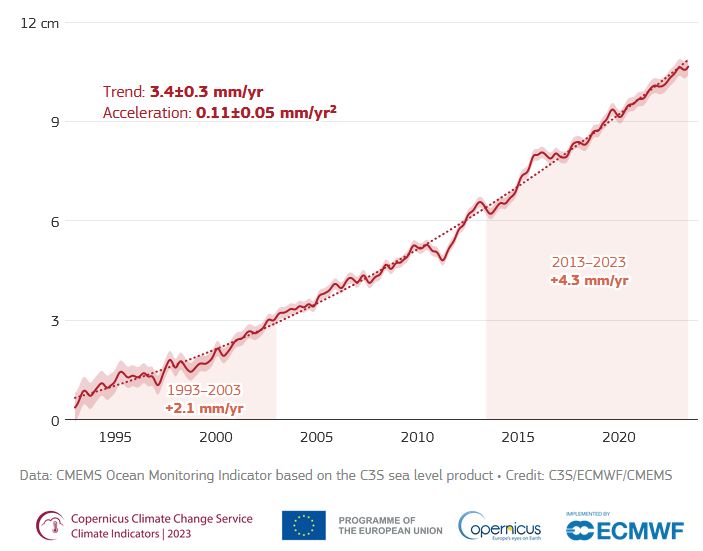
| 13:18, 11. Okt. 2024 | Global SLR 1993-2023.jpg (Datei) |  |
36 KB | Dieter Kasang (Diskussion | Beiträge) | Globaler Meeresspiegelanstieg 1993-2023 ==Lizenzhinweis== {| style="border:1px solid #8888aa; background-color:#f7f8ff;padding:5px;font-size:95%;" | Quelle: Copernicus Climate Change (2023): Global Mean Sea Level, https://sealevel.nasa.gov/understanding-sea-level/key-indicators/global-mean-sea-level/<br> Lizenz: Reproduction of the publicly available content of this website is authorised, provided the source is acknowledged, save where otherwise stated. https://climate.copernicus.eu/data-pro… | 1 |
| 13:14, 11. Okt. 2024 | TOPEX-JasonSeries2008.jpg (Datei) |  |
225 KB | Dieter Kasang (Diskussion | Beiträge) | == Beschreibung == TOPEX/Poseidon und die Nachfolge-Satelliten der Jason-Serie ==Lizenzhinweis== {| style="border:1px solid #8888aa; background-color:#f7f8ff;padding:5px;font-size:95%;" | Quelle: Wikimedia Commons (2008): [https://commons.wikimedia.org/wiki/File:TOPEX-JasonSeries2008.jpg Artist's rendering of the TOPEX/Poseidon satellite and its follow-on Jason series of satellites] Lizenz: public domain (usprgl. NOAA) |} | 1 |
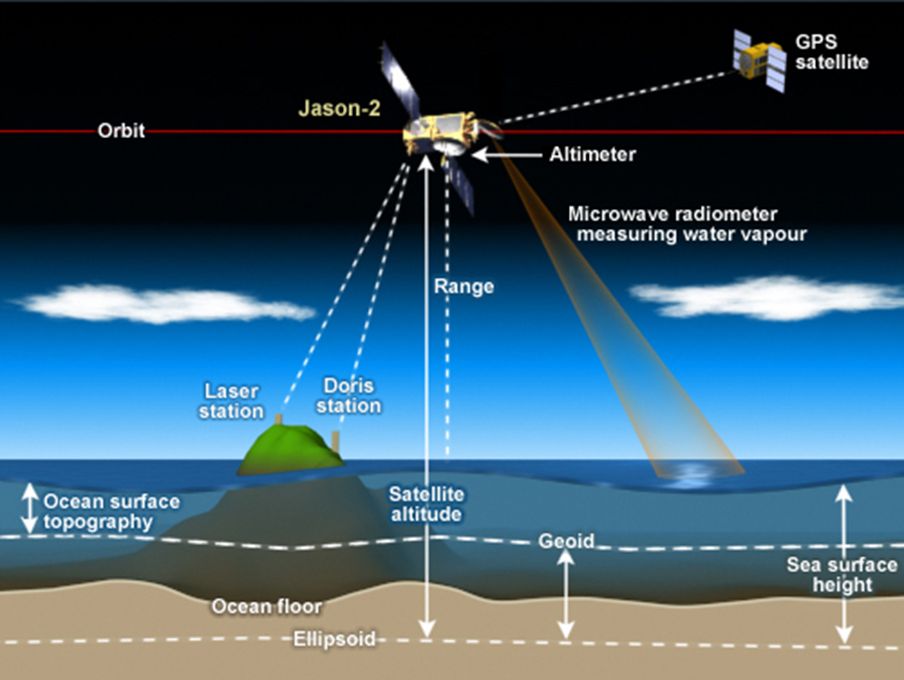
| 13:10, 11. Okt. 2024 | Satellite altimetry measurement.jpg (Datei) |  |
55 KB | Dieter Kasang (Diskussion | Beiträge) | Satellitenbasierte Höhenmessung des Meeresspiegels. Geoid: theoretische Bezugsfläche des Schwerefelds der Erde, die dem mittleren Meeresspiegel entpricht. Ellipsoid: geometrische Figur der Erde. ==Lizenzhinweis== {| style="border:1px solid #8888aa; background-color:#f7f8ff;padding:5px;font-size:95%;" | Quelle: Wikimedia Commons (2015): Satellite radar altimeters measure the ocean surface height, https://commons.wikimedia.org/wiki/File:How_satellite_radar_altimetry_works_%2816980176380%29.png L… | 1 |
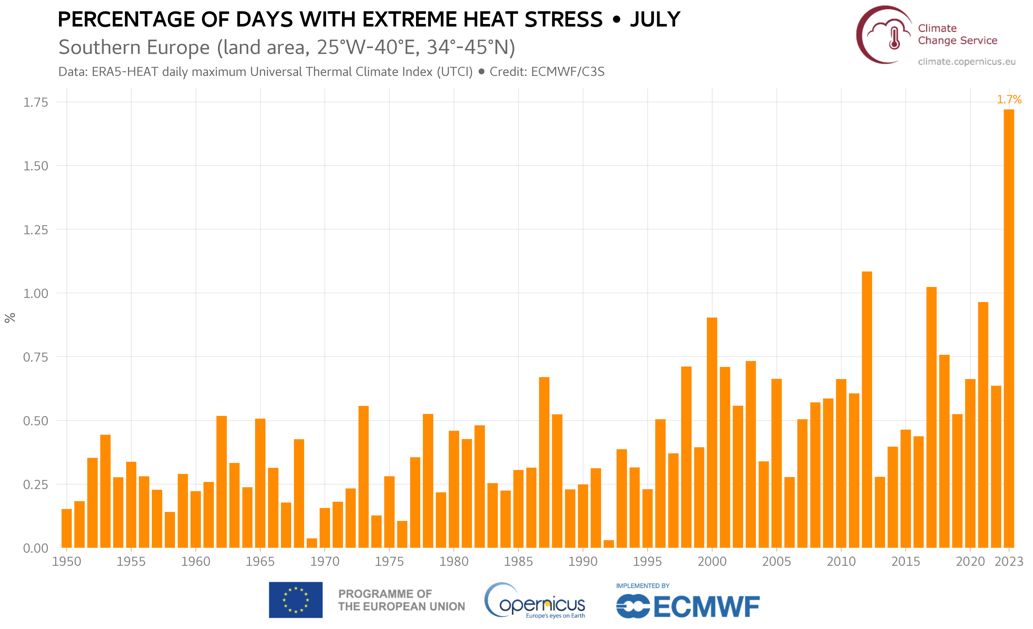
| 10:17, 10. Okt. 2024 | S-Europe extreme heat stress Juli2023.jpg (Datei) |  |
69 KB | Dieter Kasang (Diskussion | Beiträge) | == Beschreibung == Anteil der Tage mit extremem Hitzestress (>46 °C gefühlte Temperatur, Universal Thermal Climate Index (UTCI)) an allen Tagen im Juli 1950-2023 in Südeuropa. ==Lizenzhinweis== {| style="border:1px solid #8888aa; background-color:#f7f8ff;padding:5px;font-size:95%;" | Quelle: Copernicus (2024): Surface air temperature for July 2023, https://climate.copernicus.eu/surface-air-temperature-july-2023 <br> Lizenz: [https://climate.copernicus.eu/disclaimer-and-privacy Reproducti… | 1 |
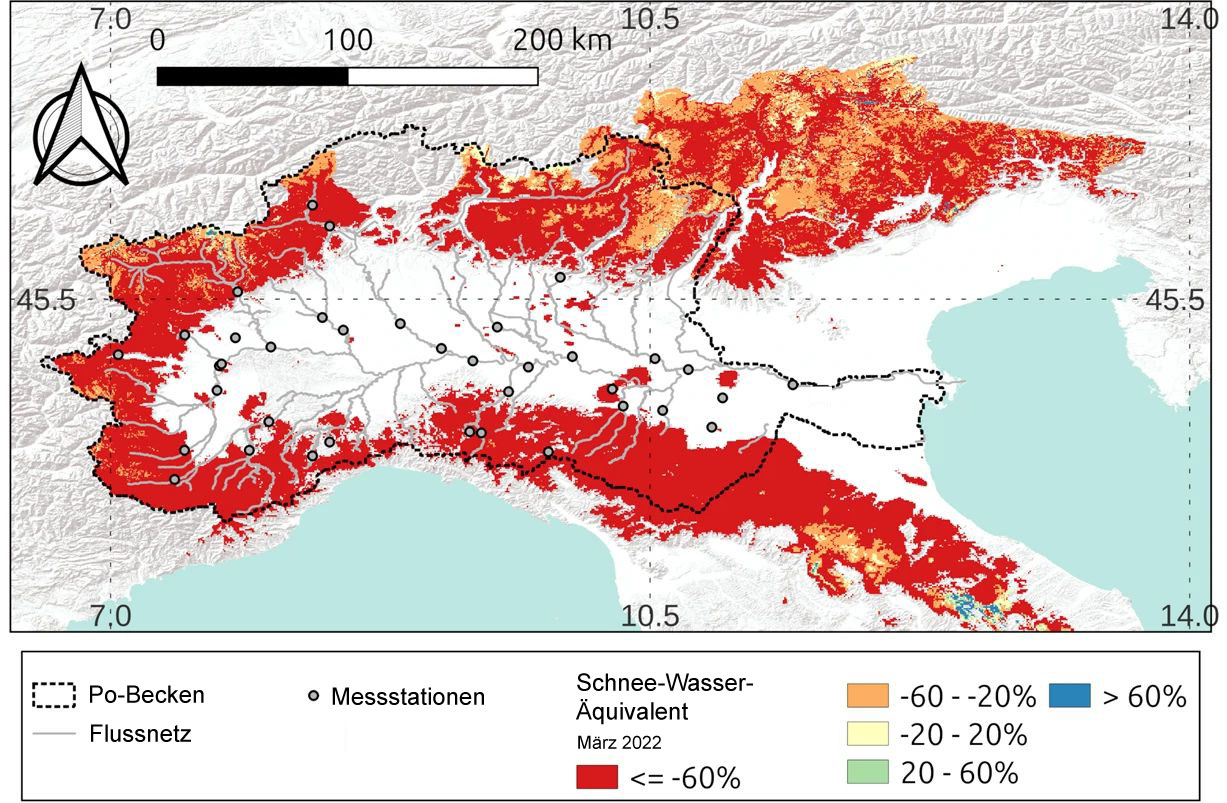
| 10:54, 9. Okt. 2024 | Po-Basin-SWE-March-2022dt.jpg (Datei) |  |
266 KB | Dieter Kasang (Diskussion | Beiträge) | == Beschreibung == Schnee-Wasser-Equivalent im Po-Becken im März 2022, verändert, übersetzt. ==Lizenzhinweis== {| style="border:1px solid #8888aa; background-color:#f7f8ff;padding:5px;font-size:95%;" | Quelle: Avanzi, F., F. Munerol, M. Milelli et al. (2022): Winter snow deficit was a harbinger of summer 2022 socio-hydrologic drought in the Po Basin, Italy. Commun Earth Environ 5, 64 (2024). https://doi.org/10.1038/s43247-024-01222-z <br> Lizenz: [https://creativecommons.org/licenses/by/4.0/… | 1 |
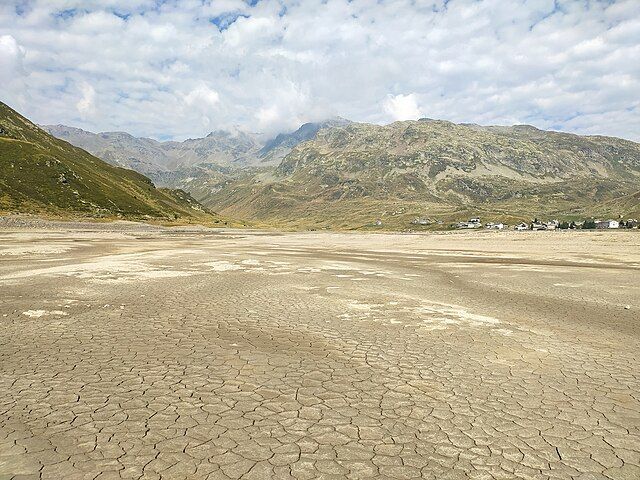
| 10:51, 9. Okt. 2024 | Lago di Montespluga2022.jpg (Datei) |  |
91 KB | Dieter Kasang (Diskussion | Beiträge) | == Beschreibung == Der italienische Stausee Lago di Montespluga während der Po-Dürre 2022 ==Lizenzhinweis== {| style="border:1px solid #8888aa; background-color:#f7f8ff;padding:5px;font-size:95%;" | Quelle: Wikipedia (2024): [https://commons.wikimedia.org/wiki/File:Siccit%C3%A0_a_Montespluga_nel_2022_(C).jpg Siccità a Montespluga nel 2022] <br> Lizenz: [https://creativecommons.org/licenses/by/4.0/ CC BY] |} | 1 |
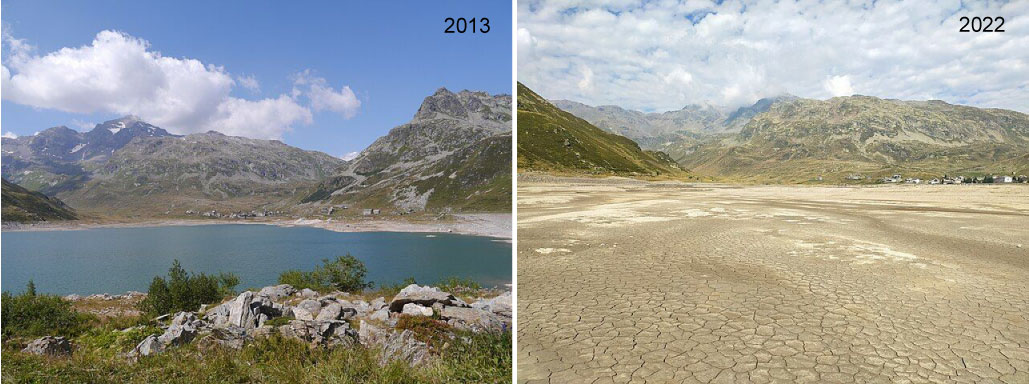
| 10:38, 9. Okt. 2024 | Lago-di-Montespluga2013-22.jpg (Datei) |  |
113 KB | Dieter Kasang (Diskussion | Beiträge) | == Beschreibung == Der italienische Stausee Lago di Montespluga 2013 und während der Po-Dürre 2022 ==Lizenzhinweis== {| style="border:1px solid #8888aa; background-color:#f7f8ff;padding:5px;font-size:95%;" | Quelle: Wikipedia (2014): Splügenpass, Italy, https://it.wikipedia.org/wiki/File:Graubünden_Splügenpass_3.JPG (links) und Wikipedia (2024): Siccità a Montespluga nel 2022, https://commons.wikimedia.org/wiki/File:Siccit%C3%A0_a_Montespluga_nel_2022_(C).jpg (rechts) <br> Lizenz: [https://cr… | 1 |
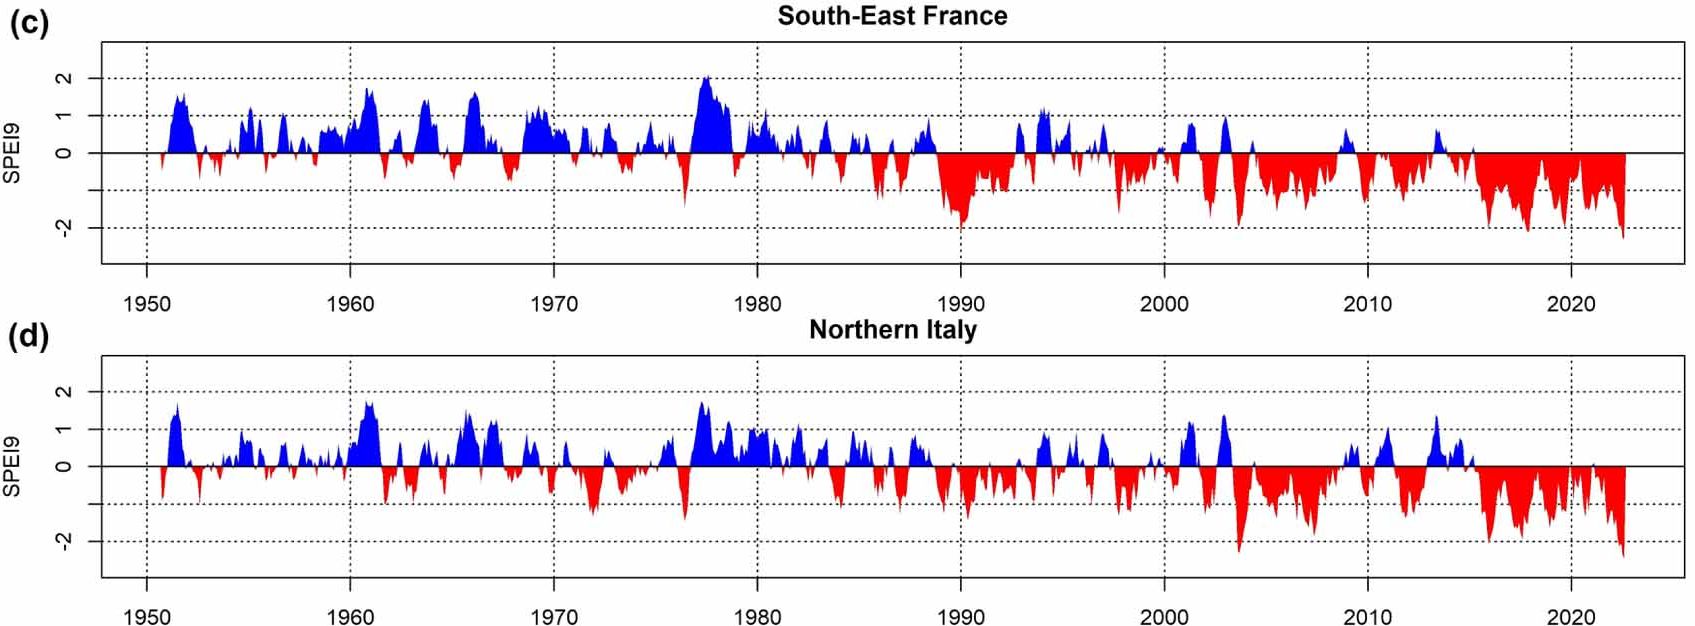
| 19:24, 8. Okt. 2024 | SPEI1950-2022 SE-France M-Italy.jpg (Datei) |  |
141 KB | Dieter Kasang (Diskussion | Beiträge) | == Beschreibung == SPEI-Index 1950 bis 2022 in SO-Frankreich und N-Italien ==Lizenzhinweis== {| style="border:1px solid #8888aa; background-color:#f7f8ff;padding:5px;font-size:95%;" | Quelle: Faranda, D. and S. Pascale and B. Bulut (2023): Persistent anticyclonic conditions and climate change exacerbated the exceptional 2022 European-Mediterranean drought, Environmental Research Letters 18, 3, https://dx.doi.org/10.1088/1748-9326/acbc37 <br> Lizenz: [https://creativecommons.org/licenses/by/4.… | 1 |
| 19:05, 4. Okt. 2024 | Mediterranean-temp-CMIP6.jpg (Datei) |  |
65 KB | Dieter Kasang (Diskussion | Beiträge) | == Beschreibung == Änderung der Sommer-Temperatur im Mittelmeerraum bis Ende des 21. Jahrhunderts im Vergleich zu 1986-2005 nach dem Szenario SSP5-8.5. ==Lizenzhinweis== {| style="border:1px solid #8888aa; background-color:#f7f8ff;padding:5px;font-size:95%;" | Quelle: Cos, J., F. Doblas-Reyes, M. Jury et al. (2022): The Mediterranean climate change hotspot in the CMIP5 and CMIP6 projections, Earth Syst. Dynam., 13, 321–340, https://doi.org/10.5194/esd-13-321-2022<br> Lizenz: CC BY https://cr… | 1 |
| 14:02, 25. Sep. 2024 | Europe rankink temp 2022.jpg (Datei) |  |
109 KB | Dieter Kasang (Diskussion | Beiträge) | == Beschreibung == Rangordnung der mittleren Tagestemperaturen 2022 für die Periode 1950 bis 2022 in Europa. 1 = Die Temperaturen waren in dem Gebiet die höchsten seit 1950. ==Lizenzhinweis== {| style="border:1px solid #8888aa; background-color:#f7f8ff;padding:5px;font-size:95%;" | Quelle: Copernicus Climate Change Service, ESOTEC 2022 (2022): Extreme heat, https://climate.copernicus.eu/esotc/2022/extreme-heat<br> Lizenz: Reproduction of the publically available content of this website is aut… | 1 |
| 13:57, 25. Sep. 2024 | Greece heat wave 2021 stations.jpg (Datei) |  |
441 KB | Dieter Kasang (Diskussion | Beiträge) | == Beschreibung == Höchsttemperaturen während der Hitzewelle Ende Juli/Anfang August 2021 in Griechenland. ==Lizenzhinweis== {| style="border:1px solid #8888aa; background-color:#f7f8ff;padding:5px;font-size:95%;" | Quelle: Founda, D., G. Katavoutas, F. Pierros & N. Mihalopoulos (2022): The extreme heat wave of summer 2021 in Athens (Greece): cumulative heat and exposure to heat stress. Sustainability, 14, 7766, https://doi.org/10.3390/su14137766<br> Lizenz: https://doi.org/10.3390/su14137766… | 1 |
| 13:43, 25. Sep. 2024 | Number of warm nights 2021.jpg (Datei) |  |
136 KB | Dieter Kasang (Diskussion | Beiträge) | == Beschreibung == Anzahl warmer Nächte im Sommer 2021 im zentralen Mittelmeerraum relativ zum Mittel der Referenzperiode 1991-2020. ==Lizenzhinweis== {| style="border:1px solid #8888aa; background-color:#f7f8ff;padding:5px;font-size:95%;" | Quelle: Copernicus Climate Service, ESOTEC 2021: Mediterranean summer extremes, https://climate.copernicus.eu/esotc/2021/mediterranean-summer-extremes<br> Lizenz: [http://climate.copernicus.eu/disclaimer-privacy Reproduction of the publically available co… | 1 |
| 13:20, 25. Sep. 2024 | TXX 25-29 June 2019.jpg (Datei) |  |
108 KB | Dieter Kasang (Diskussion | Beiträge) | == Beschreibung == Maximumtemperaturen während 25.-29. Juni ==Lizenzhinweis== {| style="border:1px solid #8888aa; background-color:#f7f8ff;padding:5px;font-size:95%;" | Quelle: Copernicus Climate Change Service (2019): Exceptionally warm weather in 2019 https://climate.copernicus.eu/ESOTC/2019/winter-warm-spell-and-summer-heatwaves <br> Lizenz: Reproduction of the publically available content of this website is authorised, provided the source is acknowledged, save where otherwise stated. htt… | 1 |
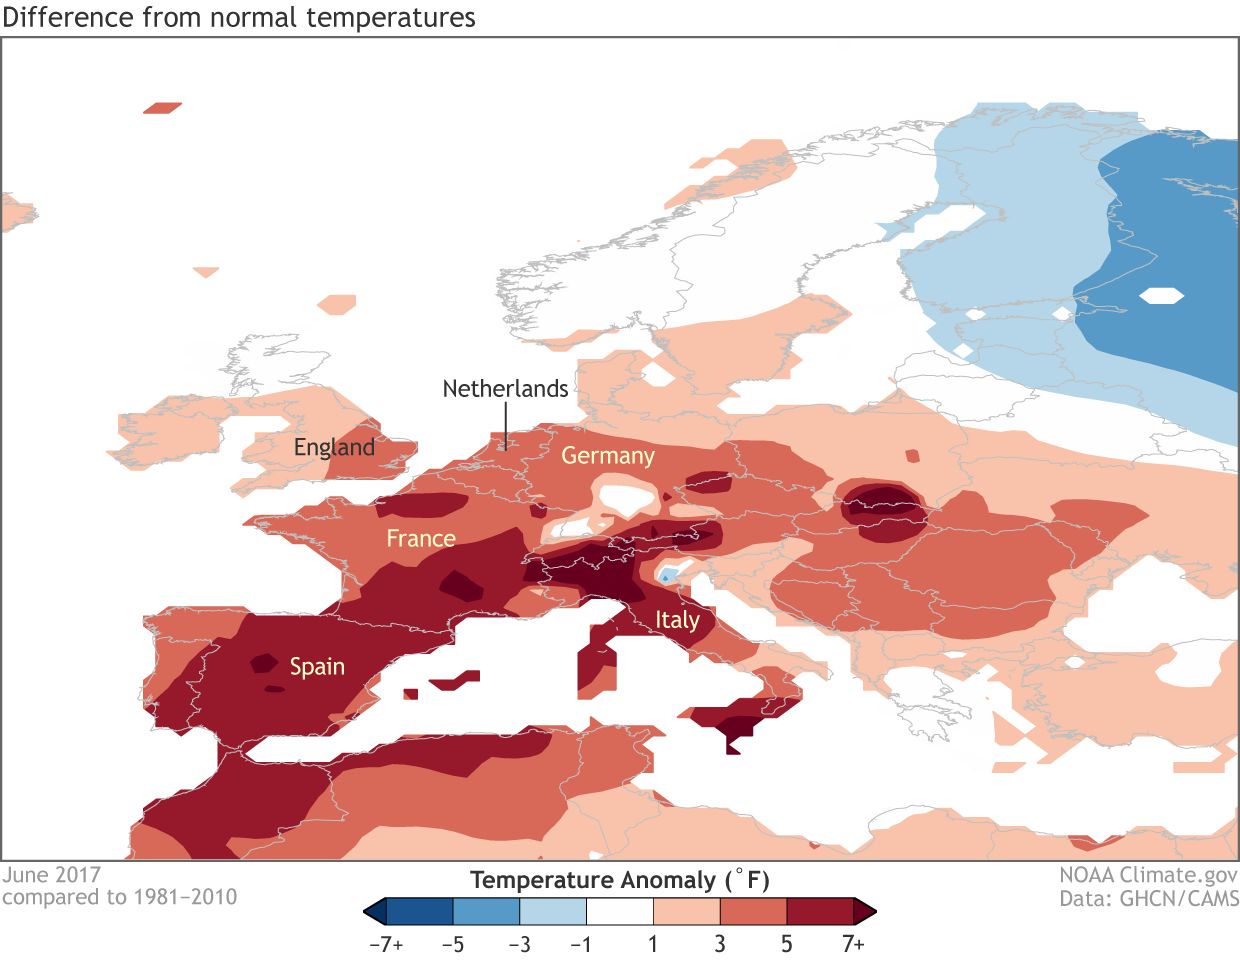
| 13:14, 25. Sep. 2024 | June 2017 heatwave.jpg (Datei) |  |
111 KB | Dieter Kasang (Diskussion | Beiträge) | == Beschreibung == Abweichung der Mitteltemperatur vom Durchschnitt im Juni 2017 in Europa. ==Lizenzhinweis== {| style="border:1px solid #8888aa; background-color:#f7f8ff;padding:5px;font-size:95%;" | Quelle: Wikimedia Commons (2017): Average temperature anomalies during June 2017 across Europe, https://commons.wikimedia.org/wiki/File:June_2017_heat_wave_temperature_anomalies_in_Europe.png <br> Lizenz: public domain, ursprgl. NOAA |} | 1 |
| 13:10, 25. Sep. 2024 | Europe Tx July 2015.jpg (Datei) |  |
75 KB | Dieter Kasang (Diskussion | Beiträge) | == Beschreibung == Rang der Tagesmaximumtemperaturen im Juli 2015 bezogen auf 1950-2015 ==Lizenzhinweis== {| style="border:1px solid #8888aa; background-color:#f7f8ff;padding:5px;font-size:95%;" | Quelle: Ionita, M., L.M. Tallaksen, D.G. Kingston, J.H. Stagge, G. Laaha, H.A.J. Van Lanen, P. Scholz, S.M. Chelcea, and K. Haslinger (2017): The European 2015 drought from a climatological perspective, Hydrology and Earth System Science 21, 1397–1419, https://hess.copernicus.org/articles/21/1397/201… | 1 |
| 12:56, 25. Sep. 2024 | Mediterranean Region map.jpg (Datei) |  |
434 KB | Dieter Kasang (Diskussion | Beiträge) | == Beschreibung == Topographische Karte des Mittelmeerraums ==Lizenzhinweis== {| style="border:1px solid #8888aa; background-color:#f7f8ff;padding:5px;font-size:95%;" | Quelle: Zellou, B., N. El Moçayd, E.H. Bergou (2023): Review article: Towards improved drought prediction in the Mediterranean region – modeling approaches and future directions, Nat. Hazards Earth Syst. Sci., 23, 3543–3583, https://doi.org/10.5194/nhess-23-3543-2023 <br> Lizenz: CC BY https://creativecommons.org/licenses/by/… | 1 |
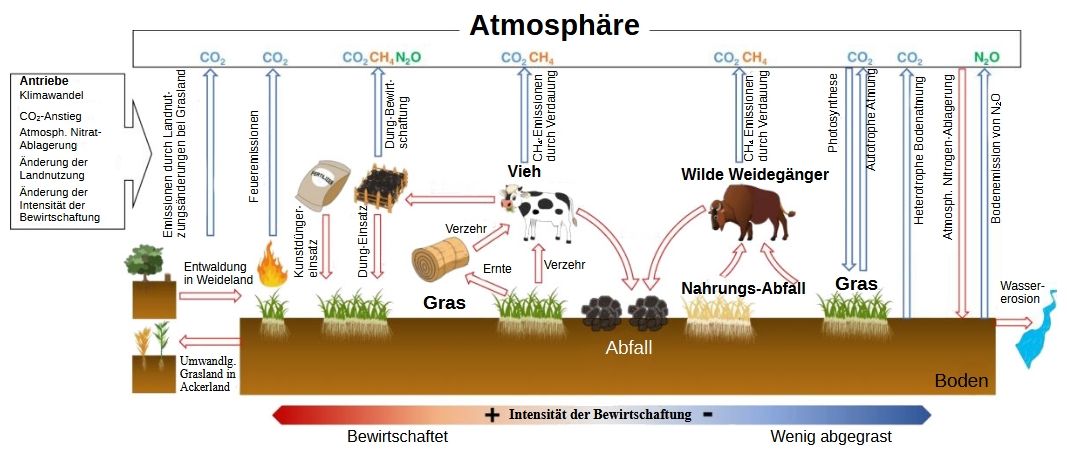
| 09:08, 16. Sep. 2024 | Grasslands GHG fluxes dt.jpg (Datei) |  |
78 KB | Dieter Kasang (Diskussion | Beiträge) | 3 | |
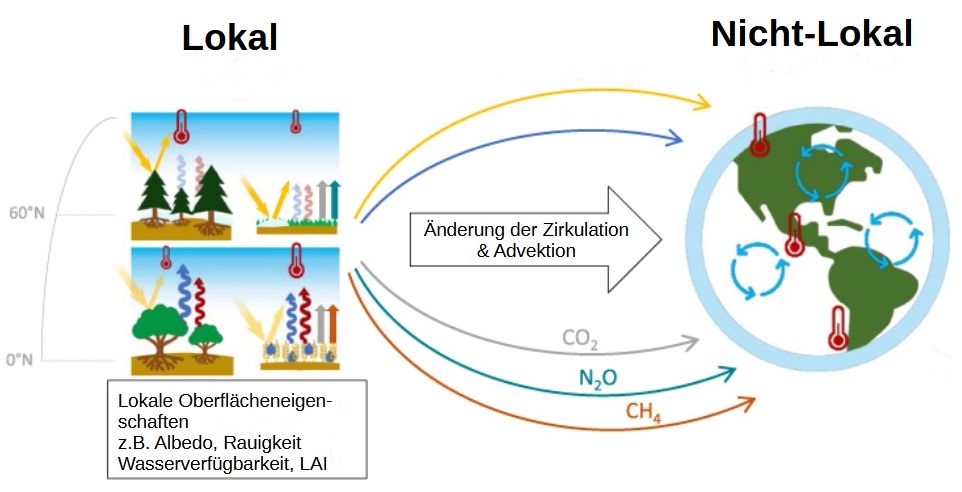
| 09:01, 16. Sep. 2024 | Land-Use-Effects-on-Climat dt.jpg (Datei) |  |
53 KB | Dieter Kasang (Diskussion | Beiträge) | 2 | |
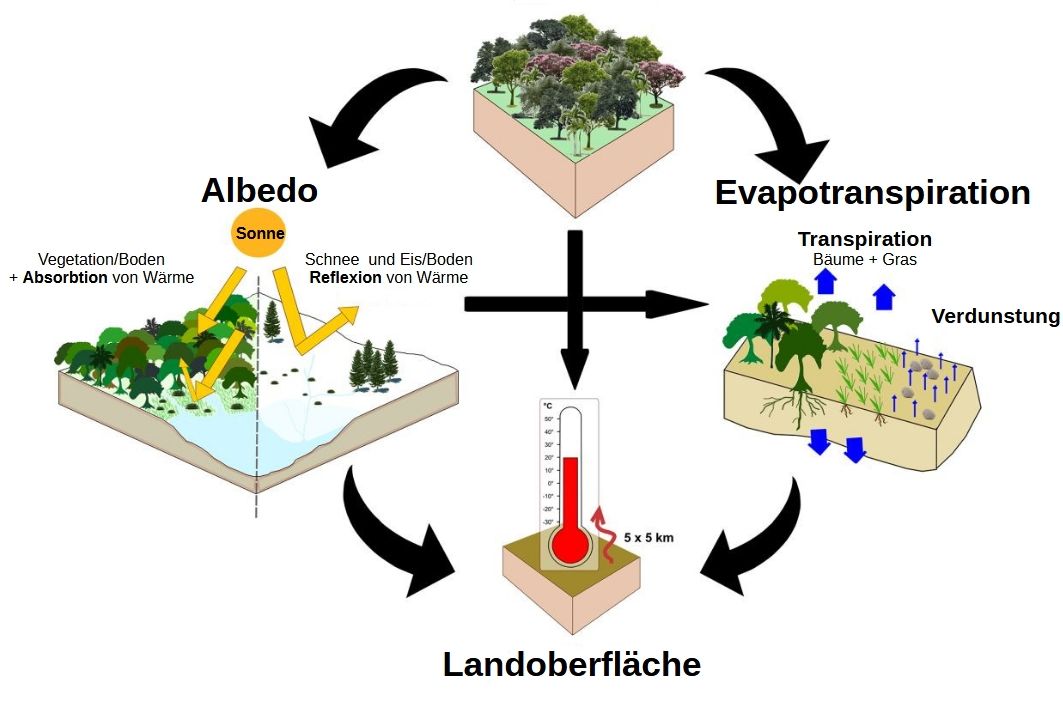
| 19:19, 15. Sep. 2024 | Forestcover albedo ET temp dt.jpg (Datei) |  |
77 KB | Dieter Kasang (Diskussion | Beiträge) | == Beschreibung == Einfluss der Waldbedeckung auf Albedo, Evapotranspiration und Temperatur ==Lizenzhinweis== {| style="border:1px solid #8888aa; background-color:#f7f8ff;padding:5px;font-size:95%;" | Quelle: Prevedello, J.A., G.R. Winck, W.M. Weber, E. Nichols, B. Sinervo (2019): [https://doi.org/10.1371/journal.pone.0213368 Impacts of forestation and deforestation on local temperature across the globe.] PLoS ONE 14(3): e0213368.<br> Lizenz: [http://creativecommons.org/licenses/by/4.0/ CC… | 3 |
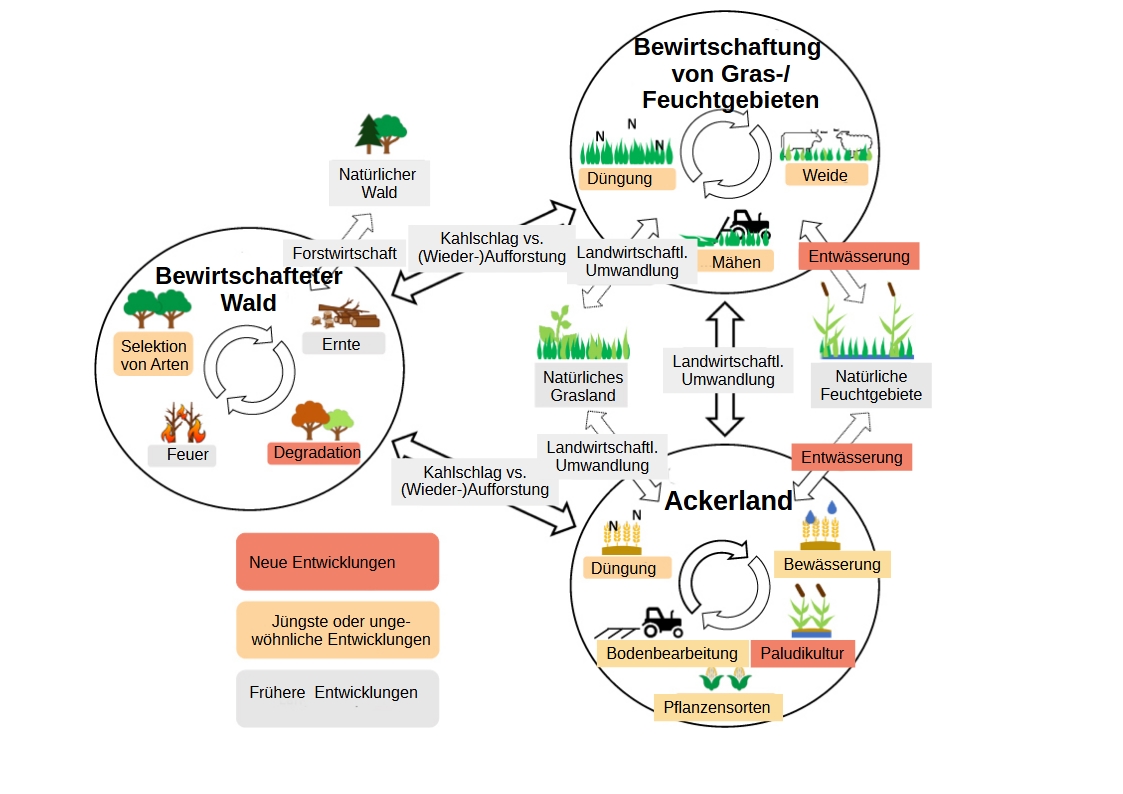
| 15:15, 13. Sep. 2024 | Managemant forests croplands dt.jpg (Datei) |  |
254 KB | Dieter Kasang (Diskussion | Beiträge) | == Beschreibung == Landnutzungspraktiken verschiedener Nutzungsformen und deren Umwandlung in andere Formen. Gestrichelte Pfeile: mögliche Rückumwandlung in natürliche Nutzung. Die Entwicklungsstadien (farbige Balken) beziehen sich auf die Darstellung in Modellen, nicht auf die Landnutzungspraktiken selbst. ==Lizenzhinweis== {| style="border:1px solid #8888aa; background-color:#f7f8ff;padding:5px;font-size:95%;" | Quelle: Pongratz, J., C. Schwingshackl, S. Bultan et al. (2021): [https://doi.or… | 1 |
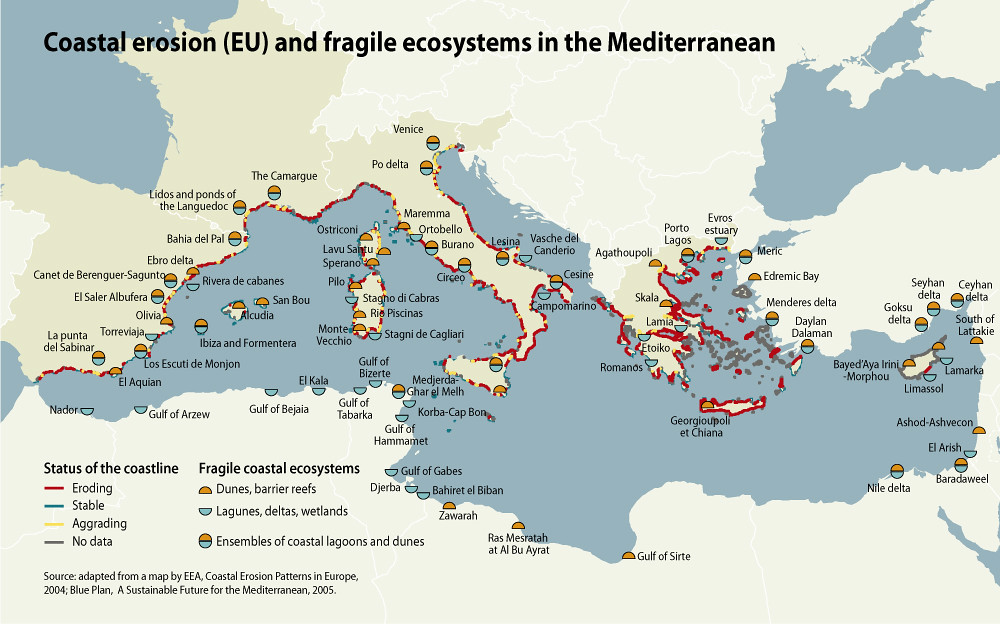
| 19:50, 12. Sep. 2024 | Mediterranean coastal erosion.jpg (Datei) |  |
169 KB | Dieter Kasang (Diskussion | Beiträge) | == Beschreibung == Küstenerosion (EU) und fragile Ökosysteme ==Lizenzhinweis== {| style="border:1px solid #8888aa; background-color:#f7f8ff;padding:5px;font-size:95%;" | Quelle: Flickr (2017): Coastal erosion (EU) and fragile ecosystems in the Mediterranean, https://www.flickr.com/photos/gridarendal/31551359223/ <br> Lizenz: CC NC-SA |} | 1 |
| 19:41, 12. Sep. 2024 | Wassernutzung-Mittelmeerrau.jpg (Datei) |  |
126 KB | Dieter Kasang (Diskussion | Beiträge) | == Beschreibung == Wasserprobleme im Mittelmeerraum: Wassernutzung und Entsalzung (übersetzt) ==Lizenzhinweis== {| style="border:1px solid #8888aa; background-color:#f7f8ff;padding:5px;font-size:95%;" | Quelle: Flickr (2017): Water stress in the Mediterranean basin, https://www.flickr.com/photos/gridarendal/32242486521/ <br> Lizenz: CC NC-SA |} | 1 |
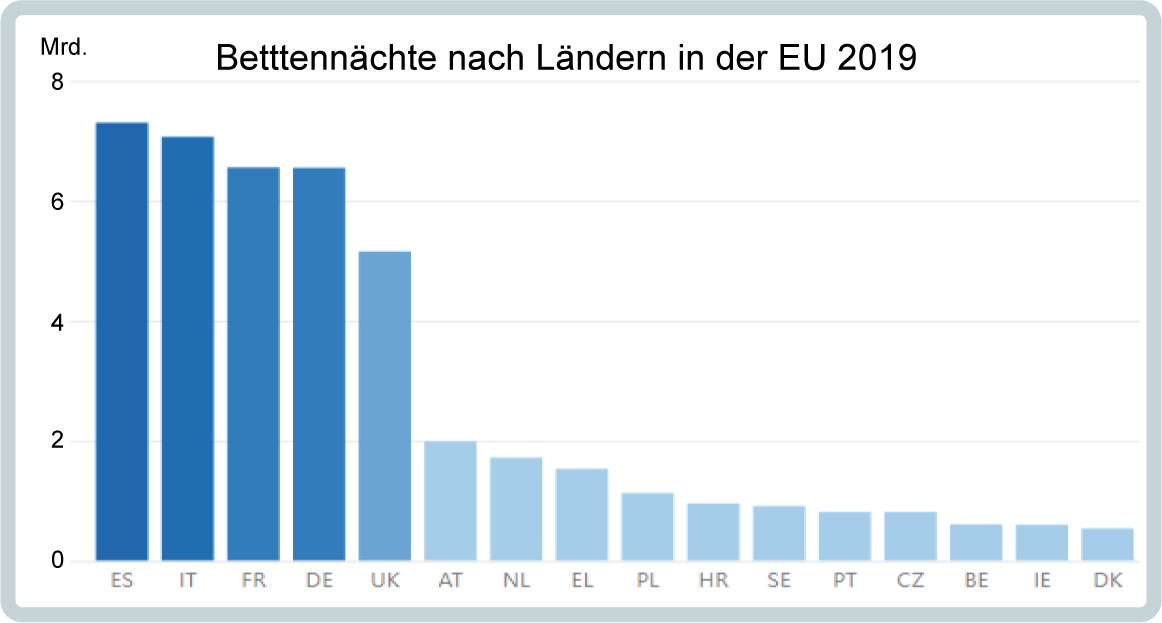
| 19:09, 12. Sep. 2024 | Bettennächte-EU-2019.jpg (Datei) |  |
54 KB | Dieter Kasang (Diskussion | Beiträge) | == Beschreibung == Bettennächte in den Ländern der EU 2019 ==Lizenzhinweis== {| style="border:1px solid #8888aa; background-color:#f7f8ff;padding:5px;font-size:95%;" | Quelle: Matei, N.A., D. García-León, A. Dosio et al. (2023): [https://publications.jrc.ec.europa.eu/repository/handle/JRC131508 Regional impact of climate change on European tourism demand], Publications Office of the European Union, Luxembourg <br> Lizenz: [https://creativecommons.org/licenses/by/4.0/ CC BY] |} | 1 |
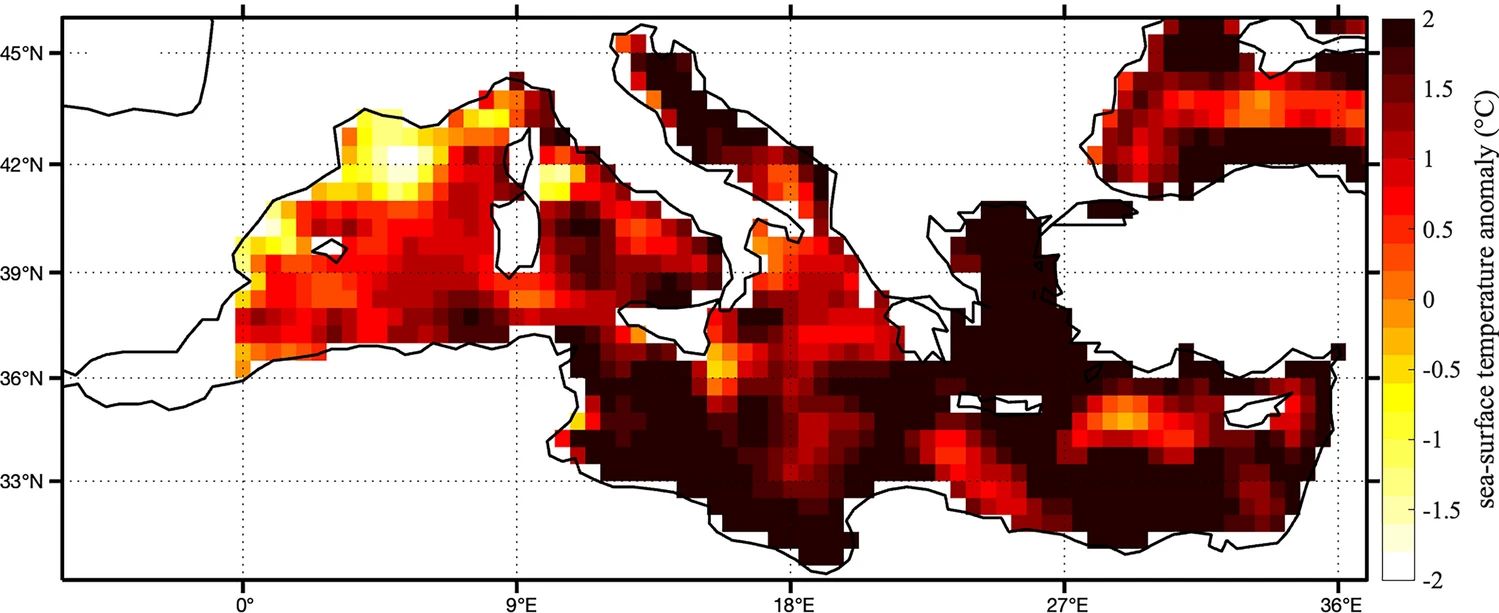
| 19:00, 12. Sep. 2024 | Mediterranen SST 1993-2020.jpg (Datei) |  |
116 KB | Dieter Kasang (Diskussion | Beiträge) | == Beschreibung == Änderung der Meeresoberflächentemperatur 1993-2020 in °C ==Lizenzhinweis== {| style="border:1px solid #8888aa; background-color:#f7f8ff;padding:5px;font-size:95%;" | Quelle: Anzidei, M., T. Alberti, A. Vecchio (2024): Sea level rise and extreme events along the Mediterranean coasts: the case of Venice and the awareness of local population, stakeholders and policy makers. Rend. Fis. Acc. Lincei 35, 359–370 (2024). https://doi.org/10.1007/s12210-024-01236-x <br> Lizenz: [ht… | 1 |
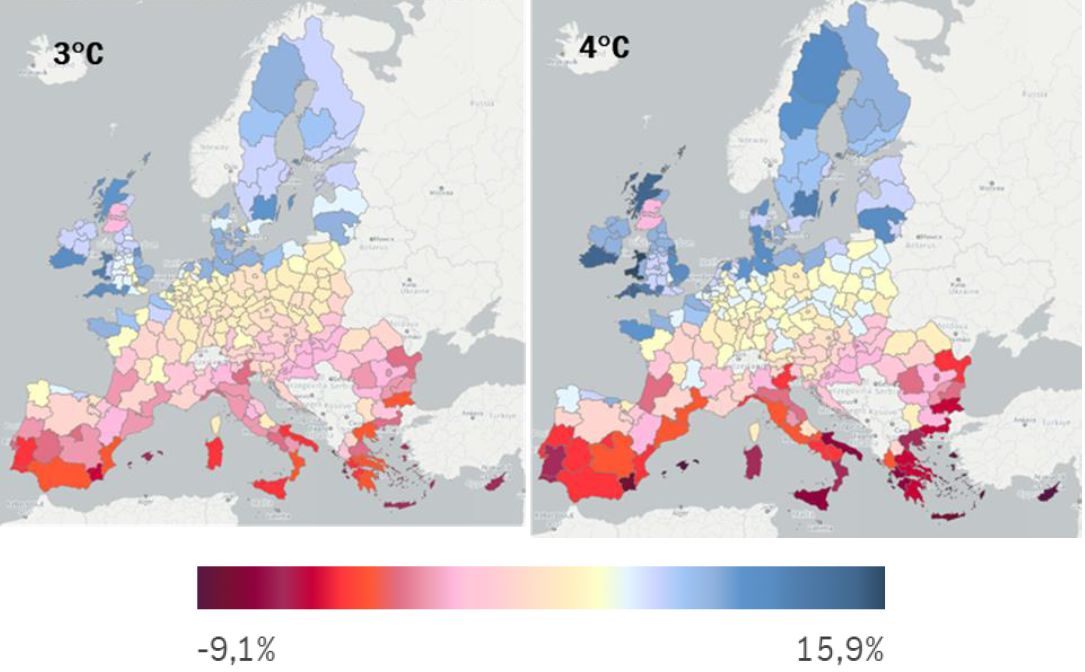
| 17:06, 12. Sep. 2024 | EU tourism evolution 21st.jpg (Datei) |  |
78 KB | Dieter Kasang (Diskussion | Beiträge) | == Beschreibung == Änderung der touristischen Nachfrage in Europa bis 2100 bei einer globalen Erwärmung von 3 °C und 4 °C ==Lizenzhinweis== {| style="border:1px solid #8888aa; background-color:#f7f8ff;padding:5px;font-size:95%;" | Quelle: Matei, N.A., D. García-León, A. Dosio et al. (2023): Regional impact of climate change on European tourism demand, Publications Office of the European Union, Luxembourg, https://publications.jrc.ec.europa.eu/repository/handle/JRC131508 <br> Lizenz: CC BY http… | 1 |
| 17:05, 12. Sep. 2024 | EU tpurism evolution 21st.jpg (Datei) |  |
78 KB | Dieter Kasang (Diskussion | Beiträge) | == Beschreibung == Änderung der touristischen Nachfrage in Europa bis 2100 bei einer globalen Erwärmung von 3 °C und 4 °C ==Lizenzhinweis== {| style="border:1px solid #8888aa; background-color:#f7f8ff;padding:5px;font-size:95%;" | Quelle: Matei, N.A., D. García-León, A. Dosio et al. (2023): Regional impact of climate change on European tourism demand, Publications Office of the European Union, Luxembourg, https://publications.jrc.ec.europa.eu/repository/handle/JRC131508 <br> Lizenz: CC BY http… | 1 |
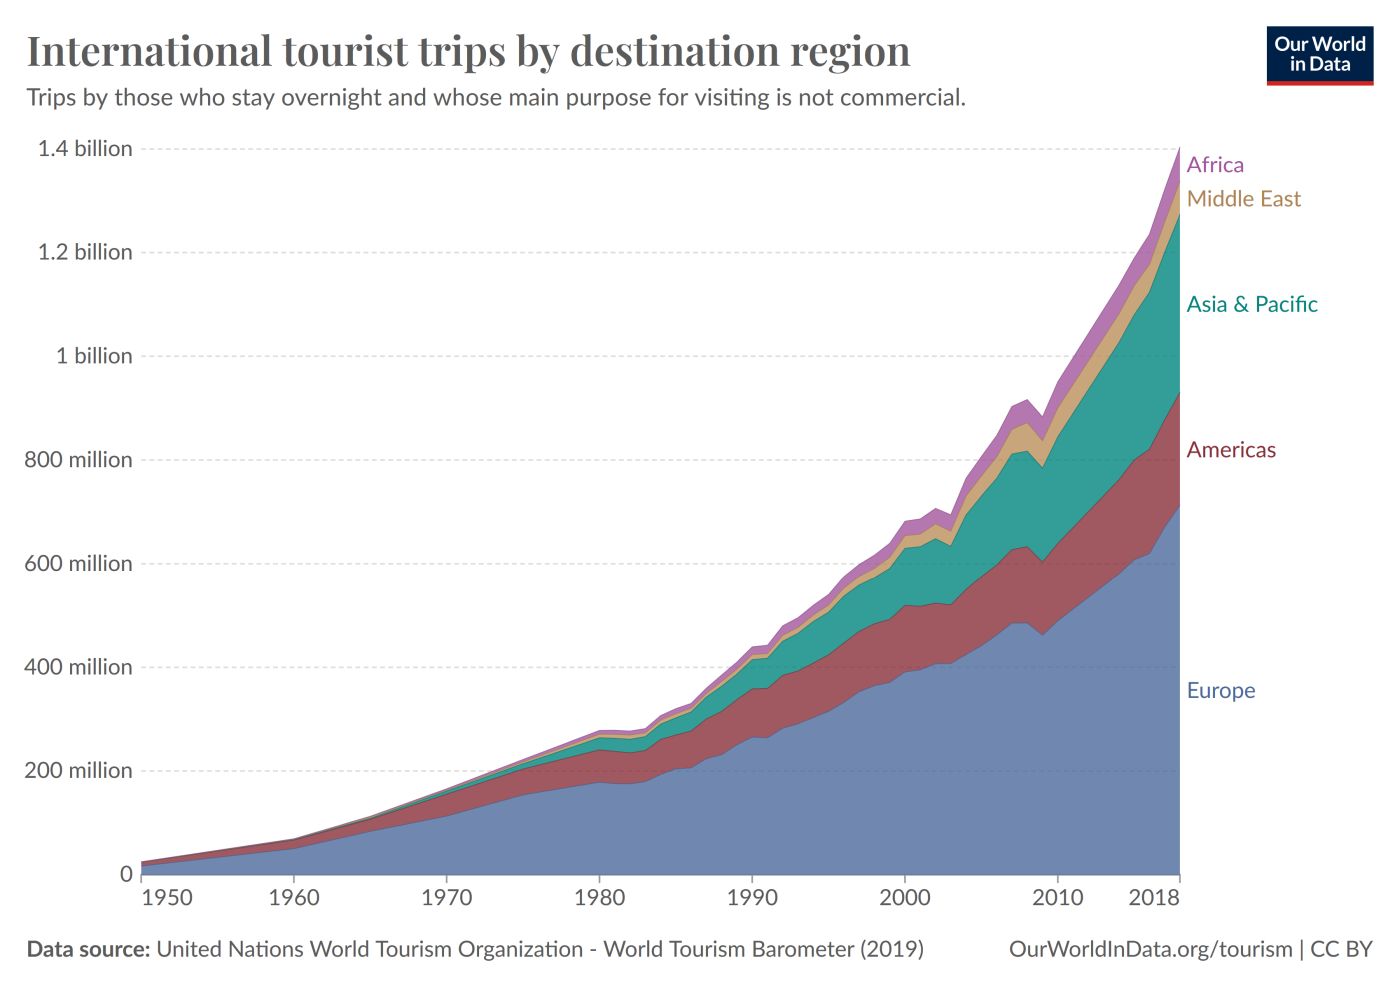
| 11:06, 12. Sep. 2024 | International-tourist-trips-by-destination-region.jpg (Datei) |  |
85 KB | Dieter Kasang (Diskussion | Beiträge) | == Beschreibung == Internationale Touristenankünfte nach Zielregionen 1950-2018 ==Lizenzhinweis== {| style="border:1px solid #8888aa; background-color:#f7f8ff;padding:5px;font-size:95%;" | Quelle: Herre, B., & V. Samborska (2024): Tourism, OurWorldInData.org. [https://ourworldindata.org/tourism International tourist arrivals by region of origin] <br> Lizenz: [https://creativecommons.org/licenses/by/4.0/ CC BY] |} | 1 |
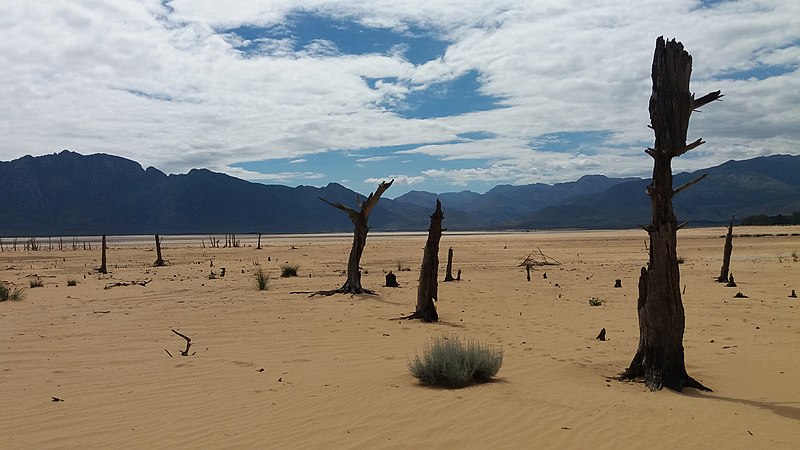
| 10:53, 12. Sep. 2024 | Theewaterskloof sandscape 2018.jpg (Datei) |  |
78 KB | Dieter Kasang (Diskussion | Beiträge) | == Beschreibung == Kapstadts größtes Wasserreservoir, Theewaterskloof, besaß im März 2018 nur noch 11 % seiner Speicherkapazität. ==Lizenzhinweis== {| style="border:1px solid #8888aa; background-color:#f7f8ff;padding:5px;font-size:95%;" | Quelle: Wikimedia Commons, Zaian (2028): A portion of Theewaterskloof dam, close to empty in 2018, showing tree stumps and sand usually submerged by the water of the dam, https://commons.wikimedia.org/wiki/File:Theewaterskloof_sandscape_2018-03-11.jpg <br> Li… | 1 |
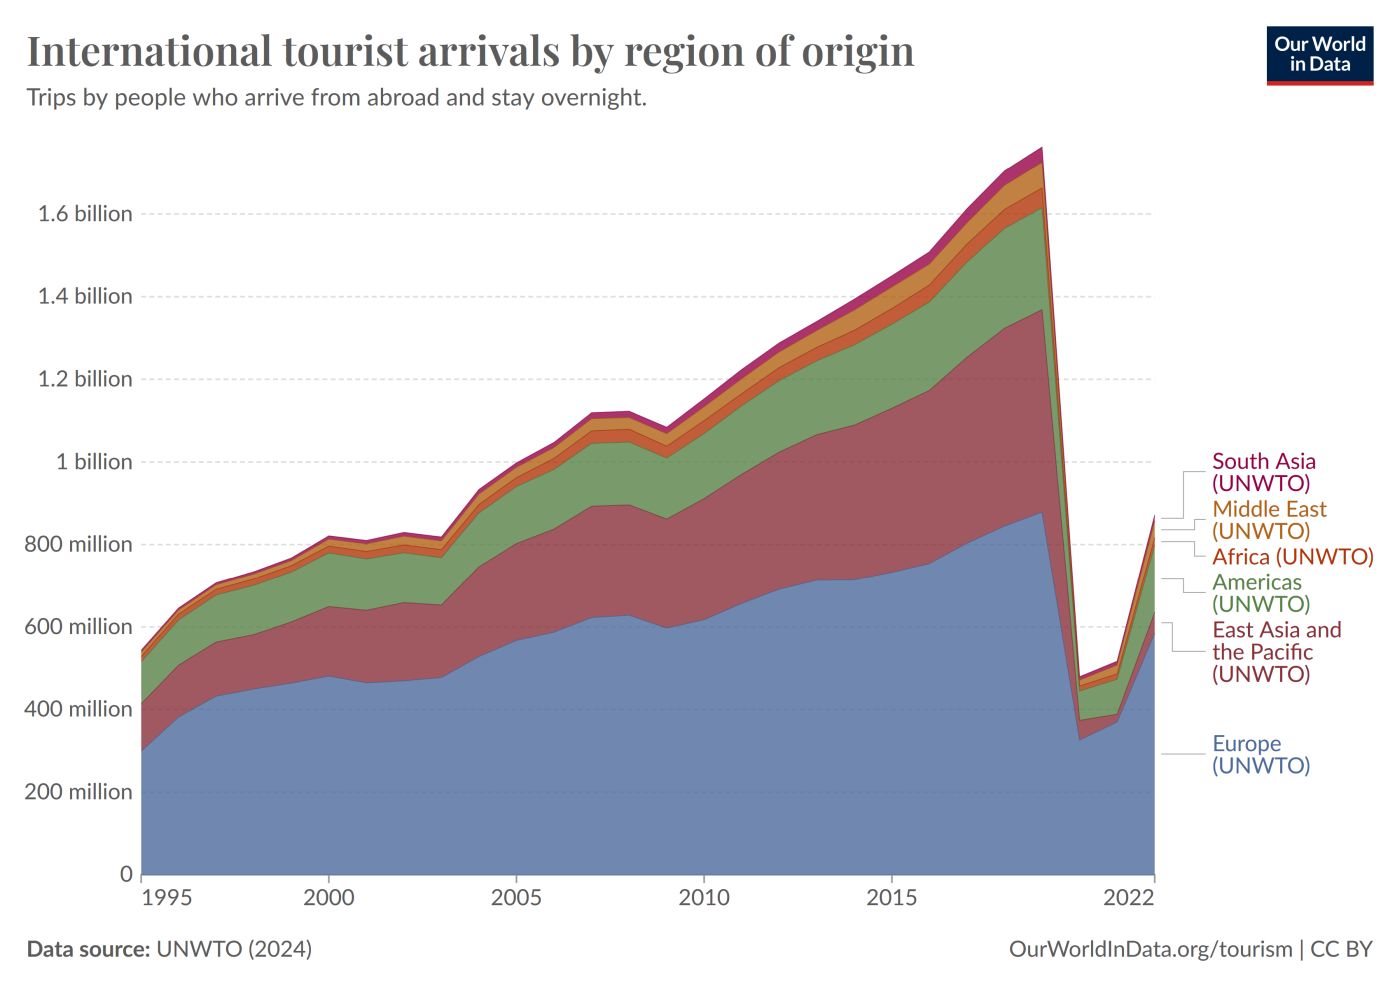
| 14:43, 11. Sep. 2024 | International-tourist-arrivals-by-region.jpg (Datei) |  |
90 KB | Dieter Kasang (Diskussion | Beiträge) | == Beschreibung == Internationale Touristenankünfte nach Herkunftsregionen 1995-2022 ==Lizenzhinweis== {| style="border:1px solid #8888aa; background-color:#f7f8ff;padding:5px;font-size:95%;" | Quelle: Herre, B., & V. Samborska (2024): Tourism, OurWorldInData.org. International tourist arrivals by region of origin, https://ourworldindata.org/tourism Lizenz: CC BY https://creativecommons.org/licenses/by/4.0/ |} | 1 |
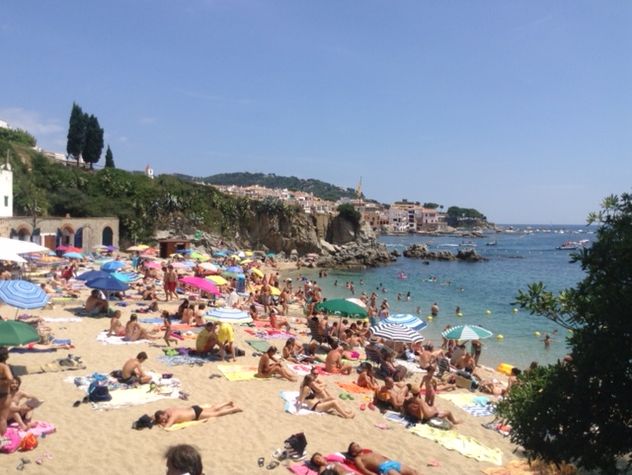
| 14:29, 11. Sep. 2024 | Strand Palafrugell 3.jpg (Datei) |  |
54 KB | Dieter Kasang (Diskussion | Beiträge) | Strandtourismus in Palafrugell, Katalanien Foto: Dieter Kasang, 27.7.2014 | 1 |
| 10:32, 18. Aug. 2024 | GHG emission countries 2021.jpg (Datei) |  |
43 KB | Dieter Kasang (Diskussion | Beiträge) | == Beschreibung == Treibhausgasemissionen 2021 und der Trend seit 2000 nach Staaten in GtCO<sub>2</sub>-Äquivalent (einschließlich Landnutzung bei CO<sub>2</sub>: LULUCF) ==Lizenzhinweis== {| style="border:1px solid #8888aa; background-color:#f7f8ff;padding:5px;font-size:95%;" | Quelle: UNEP, United Nations Environment Programme (2023): [https://doi.org/10.59117/20.500.11822/43922 Emissions Gap Report 2023: Broken Record – Temperatures hit new highs, yet world fails to cut emissions (again)].… | 1 |
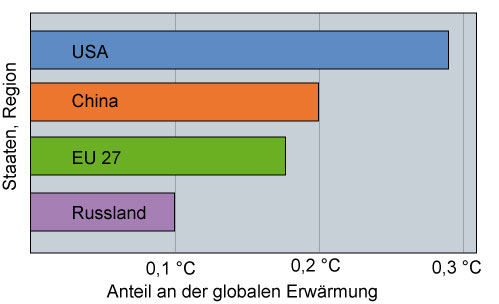
| 19:10, 15. Aug. 2024 | Hist-Staaten-globale-Erwärm.jpg (Datei) |  |
20 KB | Dieter Kasang (Diskussion | Beiträge) | == Beschreibung == Historisch kumulativer Anteil von drei Staaten und einer Staatengruppe (EU 27) an der globalen Erwärmung in °C ==Lizenzhinweis== {| style="border:1px solid #8888aa; background-color:#f7f8ff;padding:5px;font-size:95%;" | Quelle: eigene Darstellung, Daten nach: Jones, M.W., G.P. Peters, T. Gasser et al. (2023): National contributions to climate change due to historical emissions of carbon dioxide, methane, and nitrous oxide since 1850. Sci Data 10, 155 https://doi.org/10.1038/… | 1 |
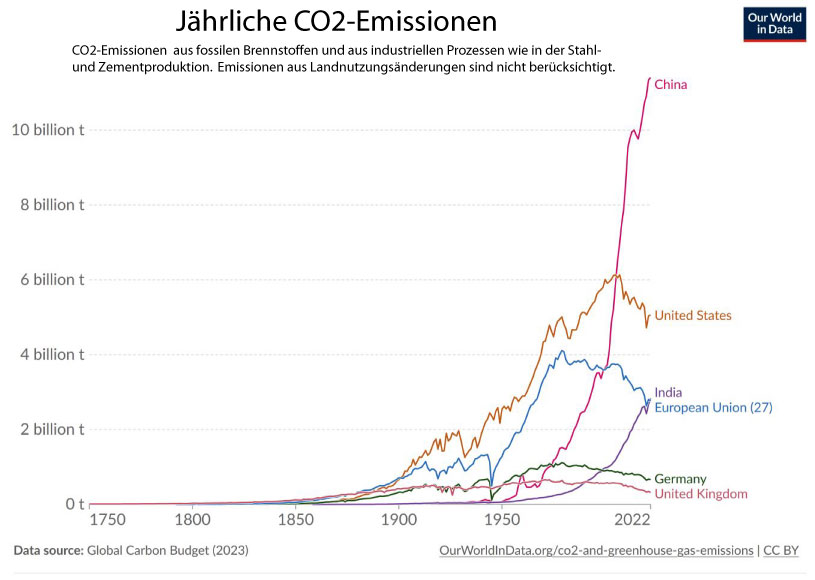
| 15:26, 14. Aug. 2024 | CO2-emissions-countries1750.jpg (Datei) |  |
55 KB | Dieter Kasang (Diskussion | Beiträge) | == Beschreibung == Historische CO2-Emissionen nach wichtigen Ländern und der EU 1750-2022 ==Lizenzhinweis== {| style="border:1px solid #8888aa; background-color:#f7f8ff;padding:5px;font-size:95%;" | Quelle: Richie, H., P. Rosado and M. Roser – Our World in Data (2023): [https://ourworldindata.org/co2-emissions-metrics Per capita, national, historical: how do countries compare on CO2 metrics?] <br> Lizenz: [http://creativecommons.org/licenses/by/4.0 CC BY] |} | 1 |