Dateiliste
Aus Klimawandel
Diese Spezialseite listet alle hochgeladenen Dateien auf.
| Datum | Name | Vorschaubild | Größe | Benutzer | Beschreibung | Versionen |
|---|---|---|---|---|---|---|
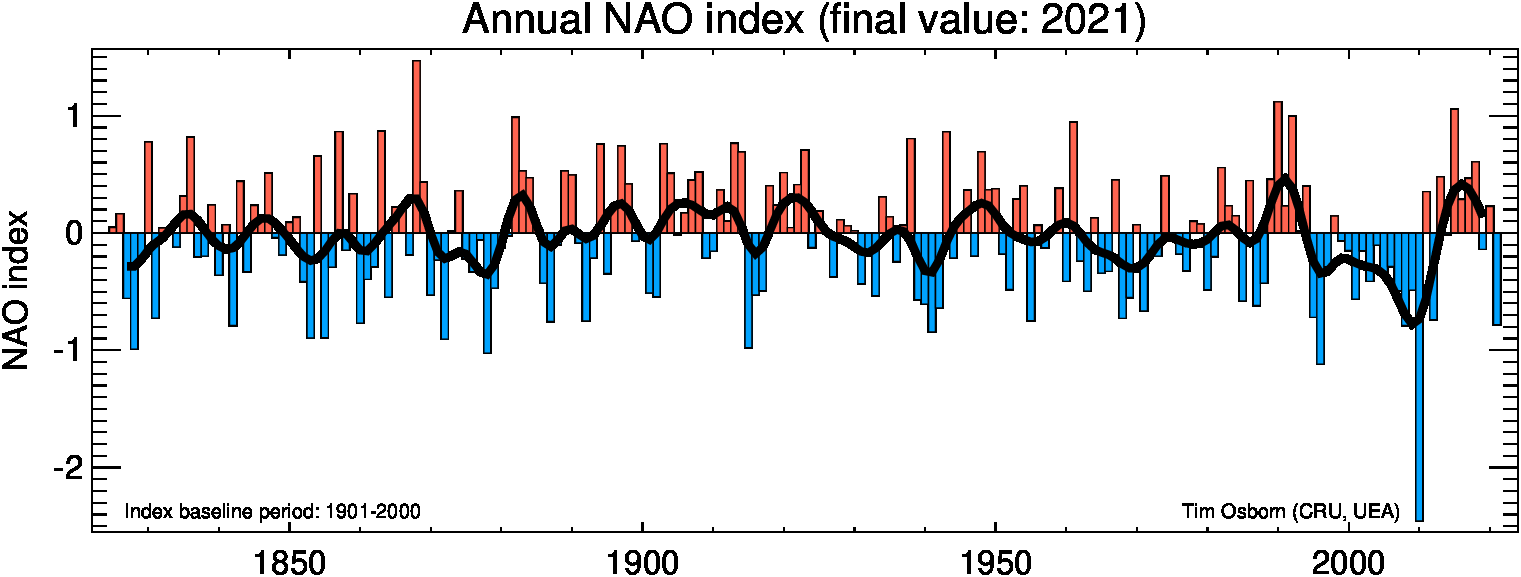
| 13:06, 12. Apr. 2023 | NAO 1825-2021.png (Datei) |  |
24 KB | Dieter Kasang (Diskussion | Beiträge) | Änderung des NAO-Index 1825-2021 im Vergleich zu 1901-2000 == Lizenzhinweis == {| style="border:1px solid #8888aa; background-color:#f7f8ff;padding:5px;font-size:95%;" |Quelle: Climatic Research Unit (2022): North Atlantic Oscillation (NAO) https://crudata.uea.ac.uk/cru/data/nao/viz.htm Lizenz: ~ CC BY-SA https://opendatacommons.org/licenses/odbl/summary/ |} | 1 |
| 10:33, 12. Apr. 2023 | CE-Struktur.gif (Datei) |  |
50 KB | Dieter Kasang (Diskussion | Beiträge) | 4 | |
| 09:33, 12. Apr. 2023 | Seagrass-SLR.gif (Datei) |  |
68 KB | Dieter Kasang (Diskussion | Beiträge) | == Beschreibung == Gefährdung von Feuchtgebieten an Küsten durch den Meeresspiegelanstieg == Lizenzhinweis == {| style="border:1px solid #8888aa; background-color:#f7f8ff;padding:5px;font-size:95%;" |Quelle: Buchanan, M.K., S. Kulp, B. Strauss (2022): Resilience of U.S. coastal wetlands to accelerating sea level rise, Environmental Research Communications, 10.1088/2515-7620/ac6eef, 4, 6, (061001), eigene Bearbeitung, übersetzt<br> Lizenz: [https://creativecommons.org/licenses/by/3.0/ CC BY 3.0] | 1 |
| 08:54, 12. Apr. 2023 | Blue-carbon-exchange2.dt.jpg (Datei) |  |
336 KB | Dieter Kasang (Diskussion | Beiträge) | == Beschreibung == Schematische Darstellung von Kohlenstoff-Austausch in blue carbon Ökosystemen == Lizenzhinweis == {| style="border:1px solid #8888aa; background-color:#f7f8ff;padding:5px;font-size:95%;" |Quelle: Suhaib A. Bandh, S.A., F.A. Malla, I. Qayoom et al. (2023): Importance of Blue Carbon in Mitigating Climate Change and Plastic/Microplastic Pollution and Promoting Circular Economy, Sustainability, 10.3390/su15032682, 15, 3, (2682), übersetzt<br> Lizenz: [https://creativecommons.org… | 1 |
| 08:41, 12. Apr. 2023 | Küsten-Ökosysteme.jpg (Datei) |  |
327 KB | Dieter Kasang (Diskussion | Beiträge) | == Beschreibung == Küstenökosysteme: Salzmarschen, Seegraswiesen, Tang- und Mangrovenwälder == Lizenzhinweis == {| style="border:1px solid #8888aa; background-color:#f7f8ff;padding:5px;font-size:95%;" |Quelle: CDRmare (2022): Verstärkte Kohlenstoff-Speicherung durch die Ausweitung der Wiesen und Wälder des Meeres, https://cdrmare.de/wp-content/uploads/2022/09/CDRmare_Kuestenoekosysteme_factsheet_220902.pdf<br> Lizenz: CC BY 4.0 https://creativecommons.org/licenses/by/4.0/ | 1 |
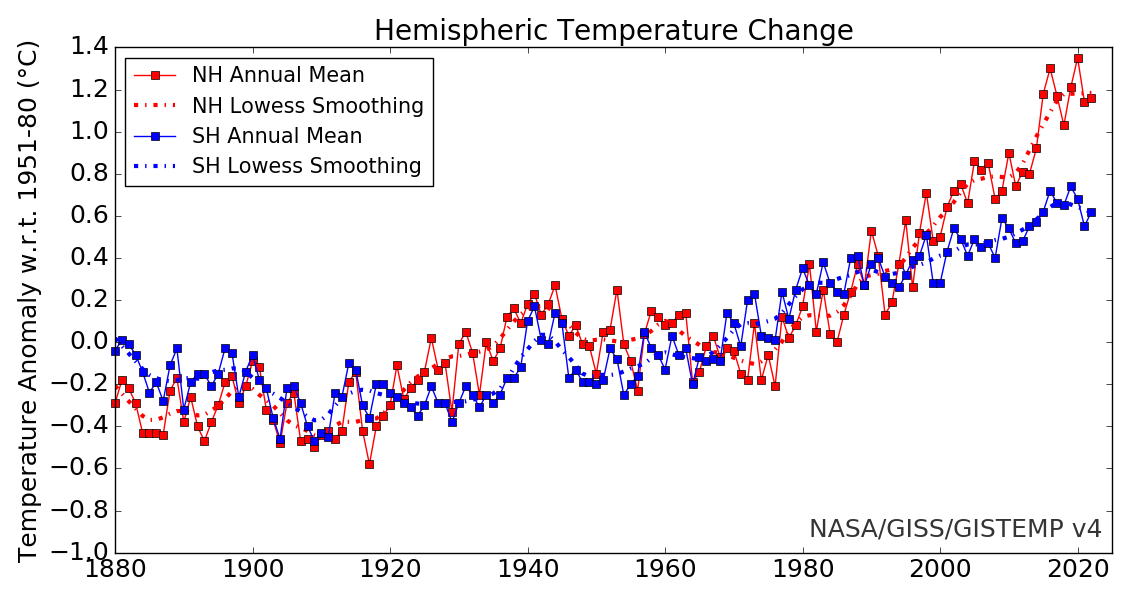
| 10:51, 10. Apr. 2023 | Hemispheric temp 1880-2022.png (Datei) |  |
117 KB | Dieter Kasang (Diskussion | Beiträge) | Änderung der Temperatur der Nord- und Südhemisphäre 1880 bis 2022: Jahresmittel und 5-Jahresglättung, , Abweichung von 1951-2022 ==Lizenzhinweis== {| style="border:1px solid #8888aa; background-color:#f7f8ff;padding:5px;font-size:95%;" | Quelle: NOAA (2017): NASA GISS (2018): [https://data.giss.nasa.gov/gistemp/graphs/ Surface Temperature Analysis]<br> Lizenz: public domain |} | 1 |
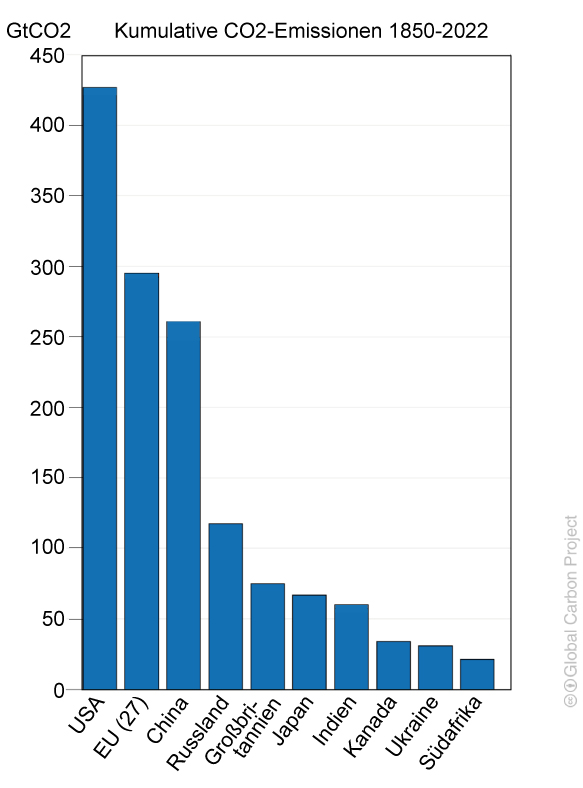
| 14:23, 5. Apr. 2023 | CO2-kumulative-Emissionen-1850-2022.jpg (Datei) |  |
77 KB | Dieter Kasang (Diskussion | Beiträge) | == Beschreibung == Historische kumulative Anteil CO2-Emissionen nach Staaten bzw. Regionen. Verändert, übersetzt. == Lizenzhinweis == {| style="border:1px solid #8888aa; background-color:#f7f8ff;padding:5px;font-size:95%;" |Quelle: Andrew, R. (2022): [https://robbieandrew.github.io/GCB2022/index.html Figures from the Global Carbon Budget 2022]<br> Lizenz: [http://creativecommons.org/licenses/by/4.0/ CC BY] |} | 1 |
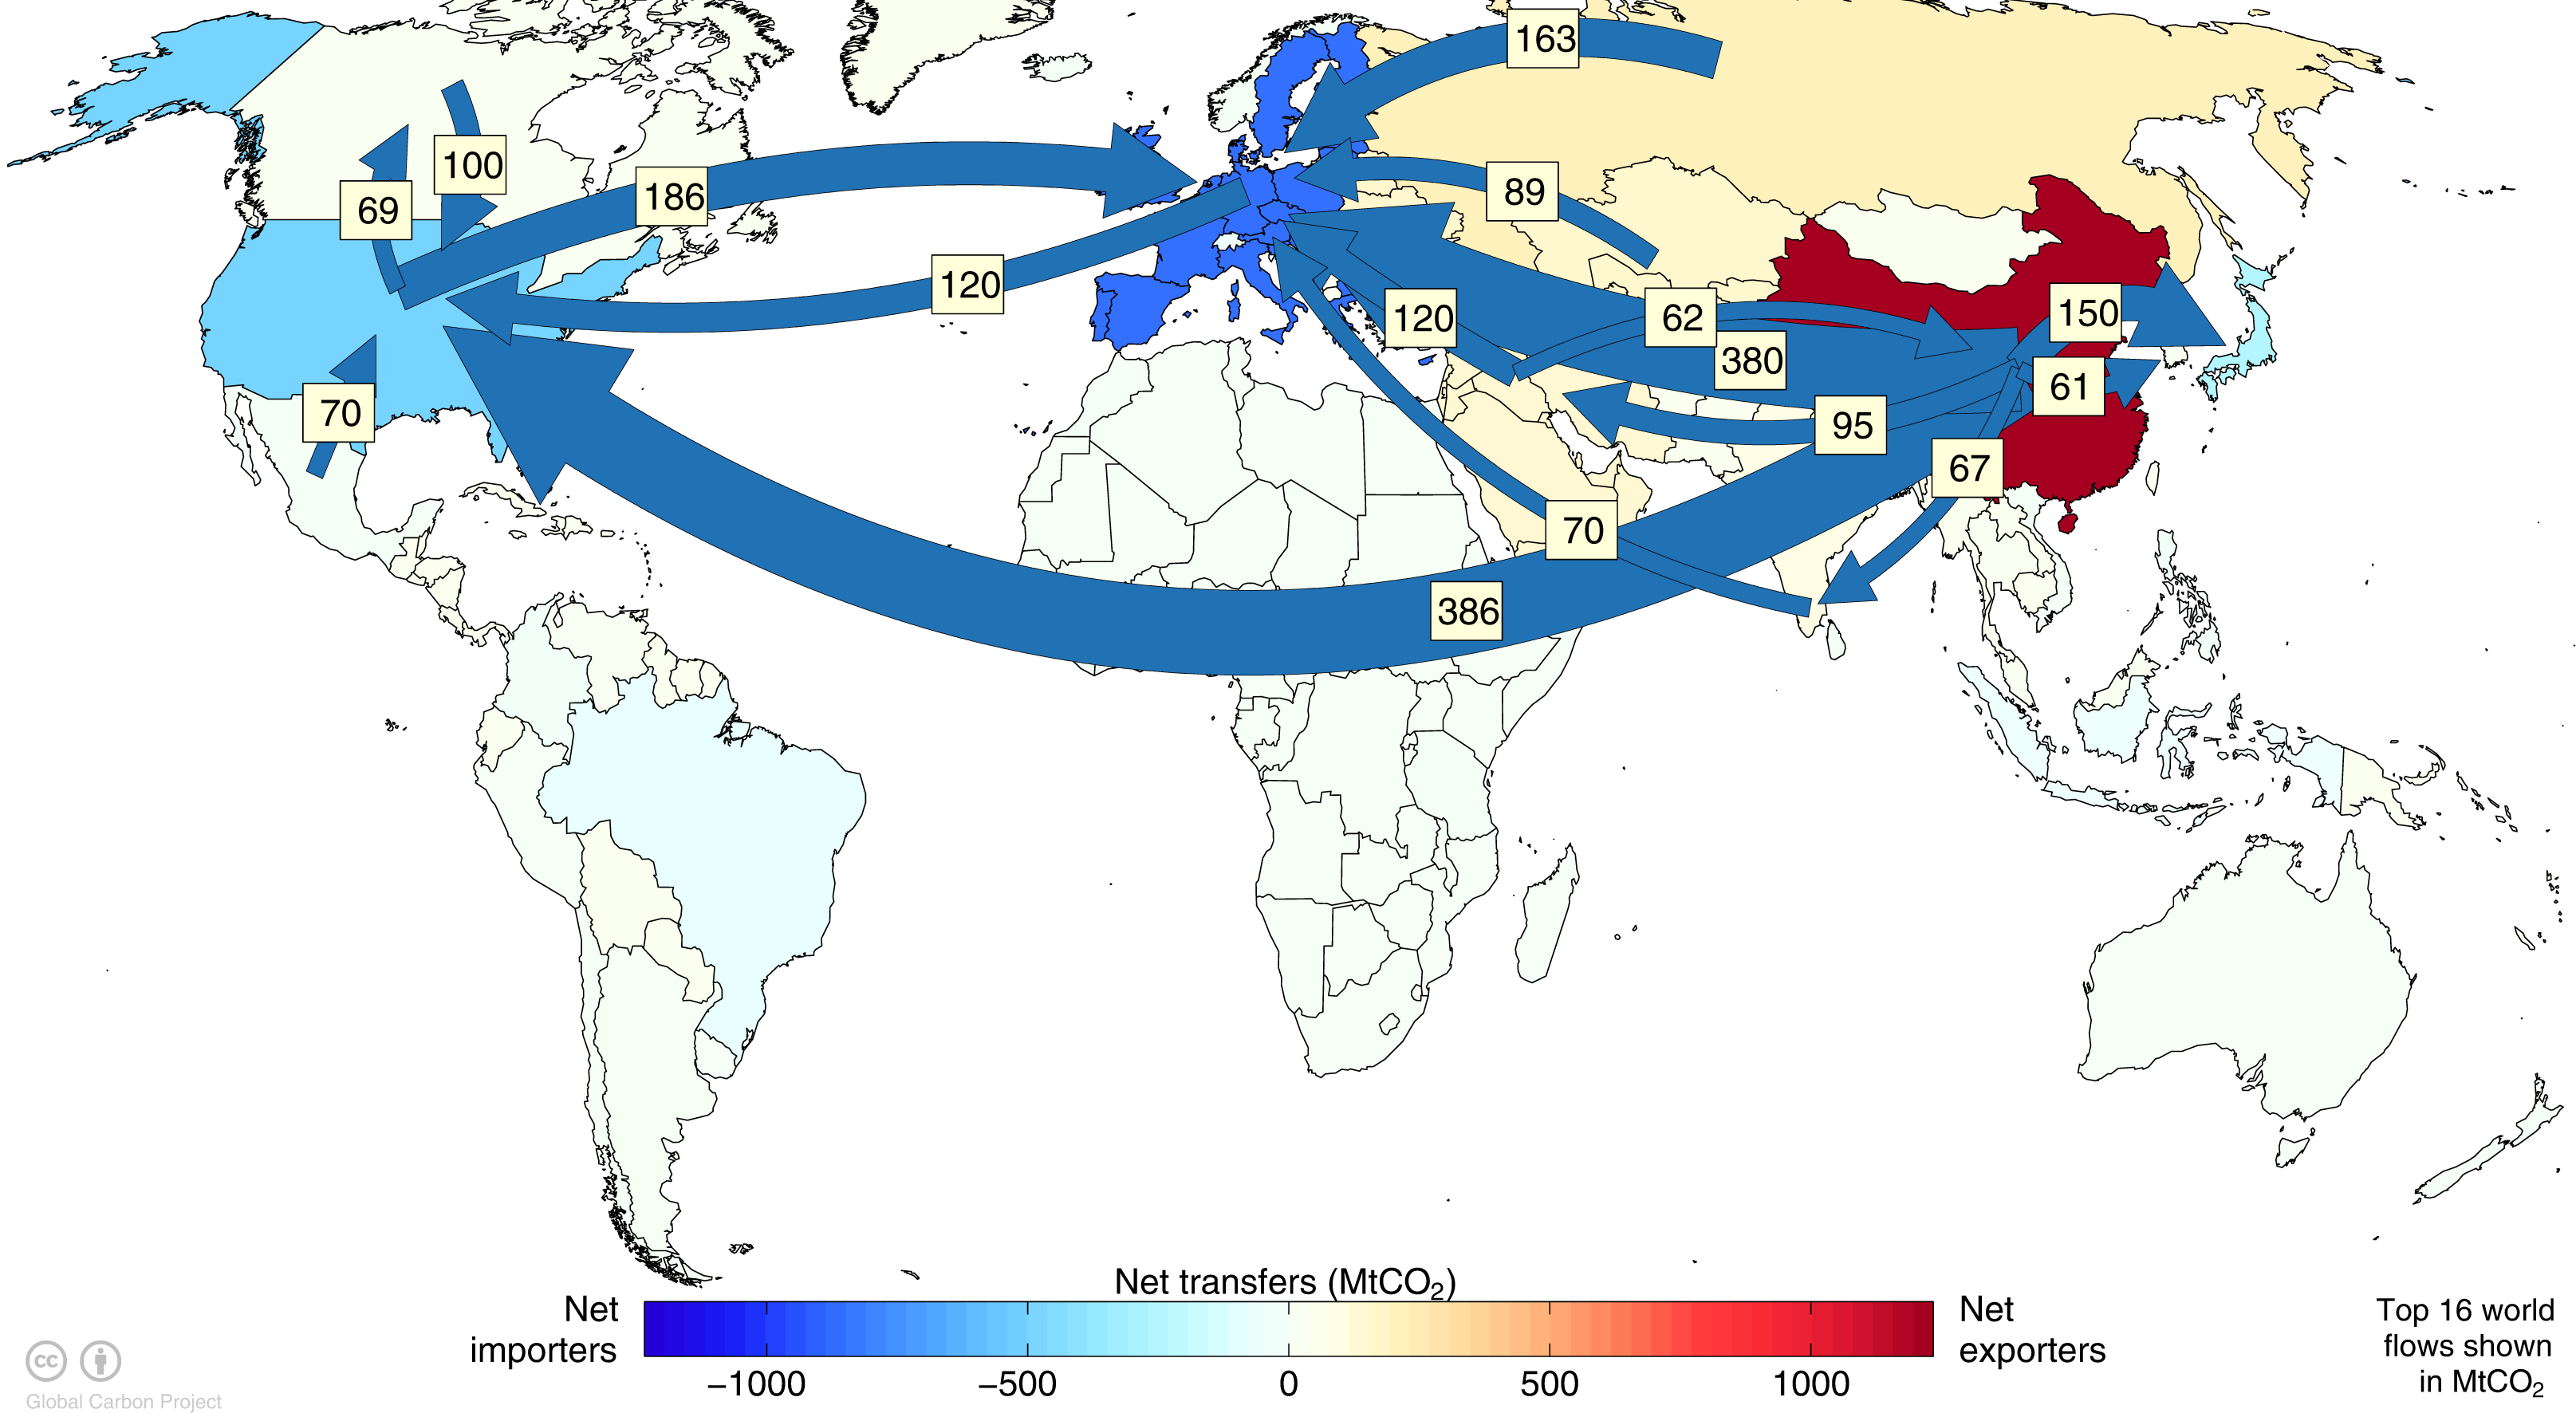
| 11:31, 5. Apr. 2023 | CO2-emissions production consumption.png (Datei) |  |
620 KB | Dieter Kasang (Diskussion | Beiträge) | == Beschreibung == Netto-Transfer von CO2-Emissionen aus den Produktions- in die Konsum-Länder. Gezeigt sind die 16 größten Emissions-Transfers in MtGtCO2/Jahr. Die Einfärbung der einzelnen Staaten zeigt den Netto-Export (rot) und Netto-Import von CO2-Emissionen (blau) in Mio. t. == Lizenzhinweis == {| style="border:1px solid #8888aa; background-color:#f7f8ff;padding:5px;font-size:95%;" |Quelle: Andrew, R. (2022): [https://robbieandrew.github.io/GCB2022/index.html Figures from the Global Car… | 1 |
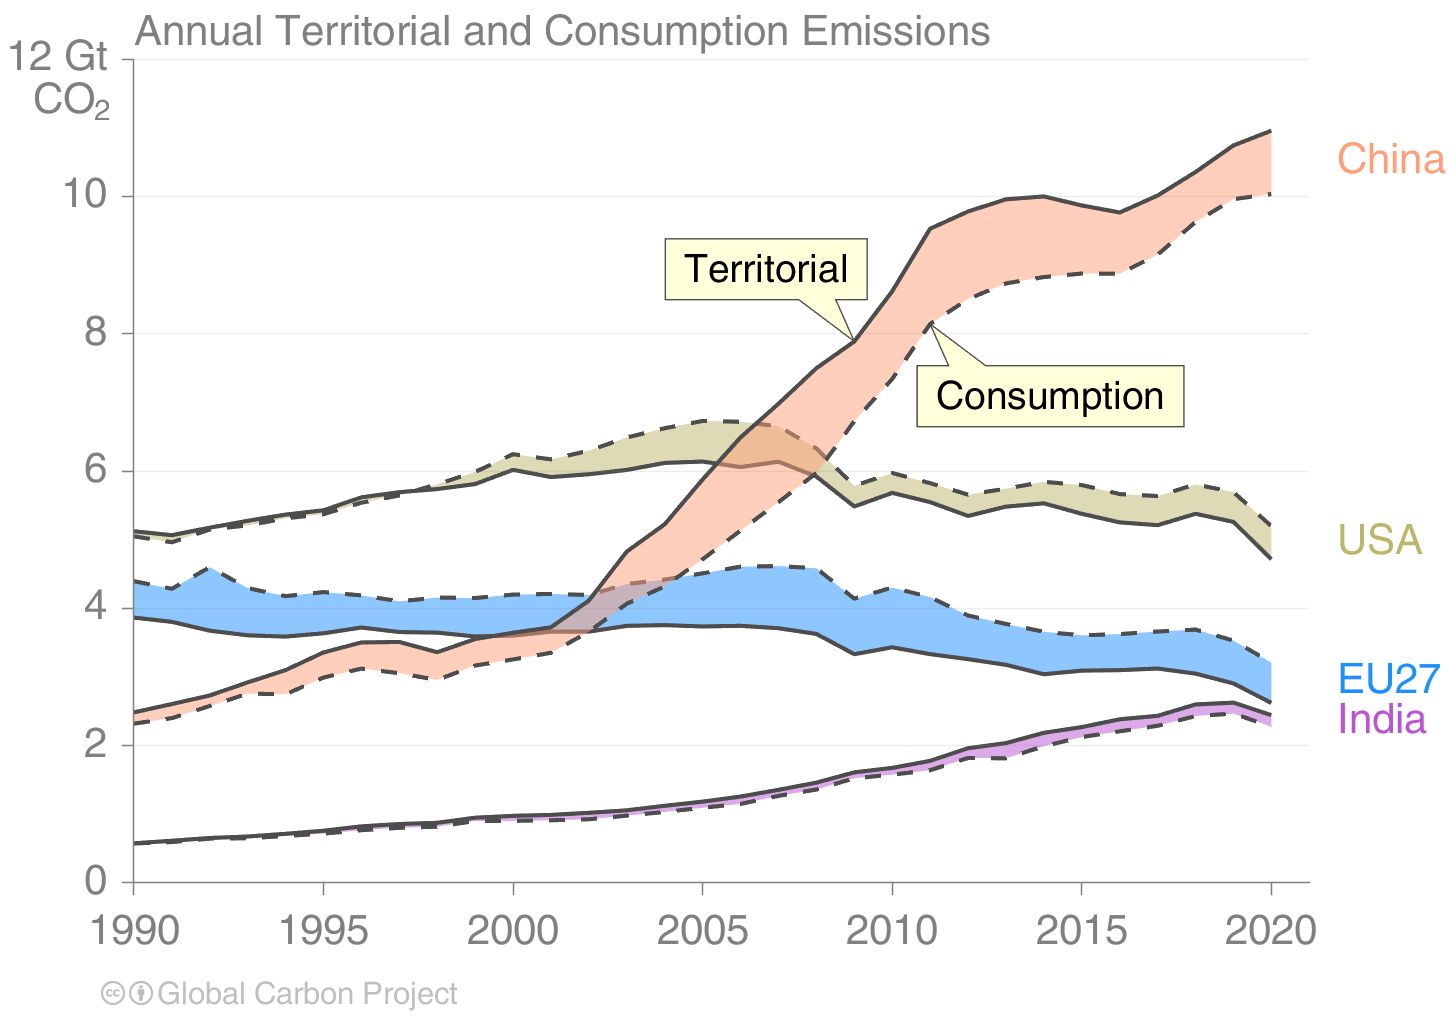
| 10:19, 4. Apr. 2023 | CO2 consumption territorial2.jpg (Datei) |  |
98 KB | Dieter Kasang (Diskussion | Beiträge) | CO2-Emissionen durch Produktion und durch Konsum ==Lizenzhinweis== {| style="border:1px solid #8888aa; background-color:#f7f8ff;padding:5px;font-size:95%;" | Quelle: Andrew, R. (2022): Figures from the Global Carbon Budget 2022, https://robbieandrew.github.io/GCB2022/index.html <br> Lizenz: CC BY http://creativecommons.org/licenses/by/4.0/ |} | 1 |
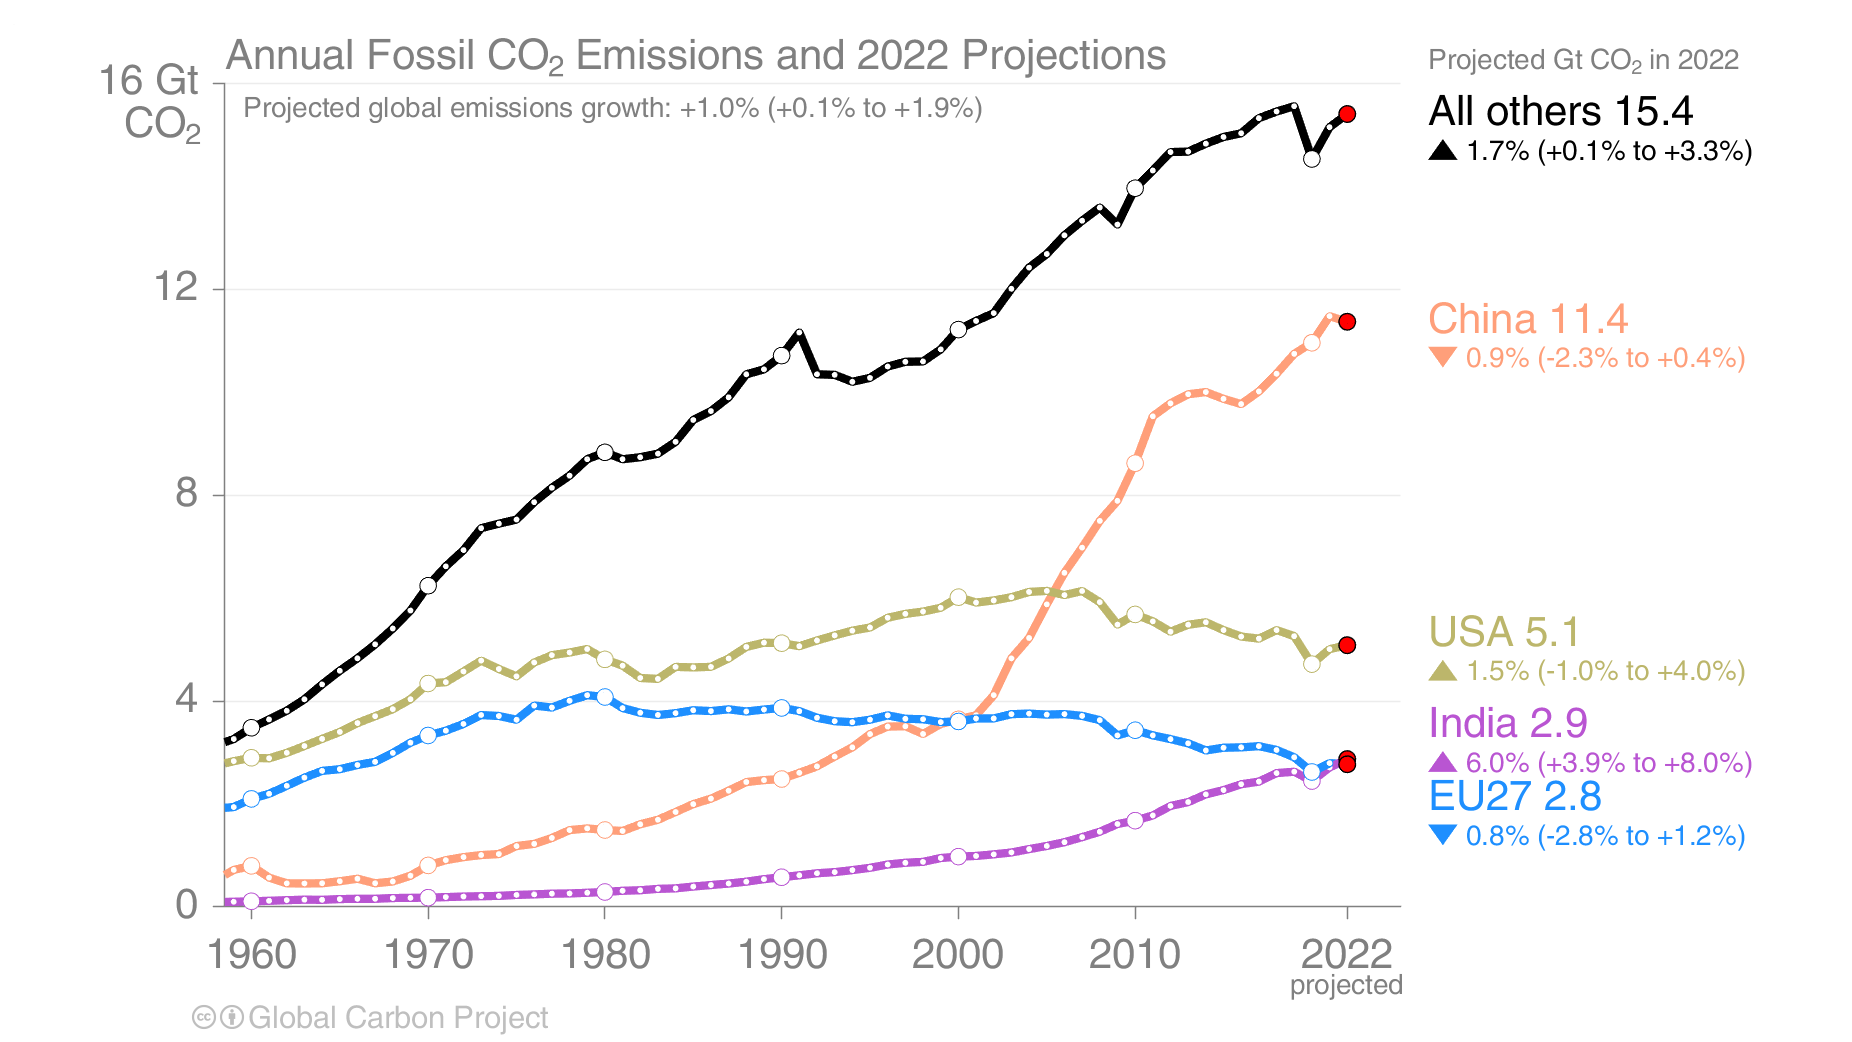
| 19:18, 31. Mär. 2023 | CO2-emissions regions 1960-2022.png (Datei) |  |
149 KB | Dieter Kasang (Diskussion | Beiträge) | Jährliche fossile CO2-Emissionen (2022: Projektion) nach Ländern == Lizenzhinweis == {| style="border:1px solid #8888aa; background-color:#f7f8ff;padding:5px;font-size:95%;" |Quelle: Andrew, R. (2022): Figures from the Global Carbon Budget 2022, https://robbieandrew.github.io/GCB2022/index.html Lizenz: CC BY http://creativecommons.org/licenses/by/4.0/ |} | 1 |
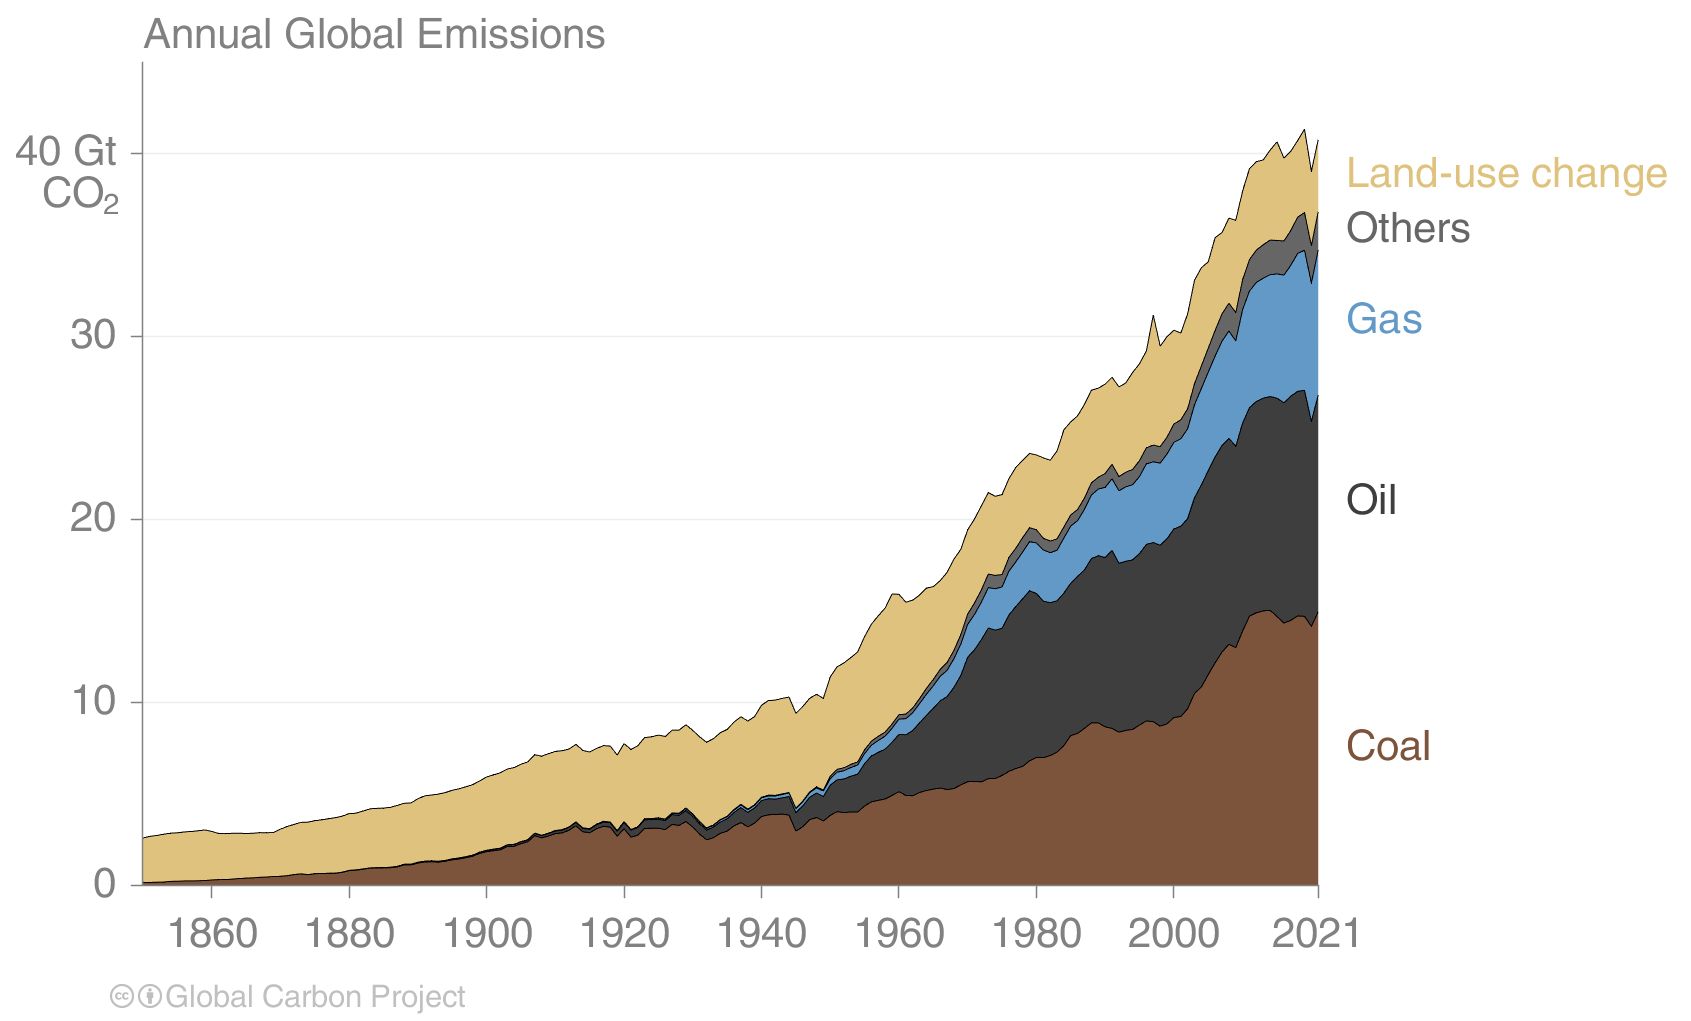
| 18:55, 30. Mär. 2023 | CO2-Emissionen-Senken 1850-2022.jpg (Datei) |  |
42 KB | Dieter Kasang (Diskussion | Beiträge) | == Beschreibung == Globale anthropogene CO2-Emissionen nach Quellen 1850-2021 == Lizenzhinweis == {| style="border:1px solid #8888aa; background-color:#f7f8ff;padding:5px;font-size:95%;" |Quelle: Andrew, R. (2022): [https://robbieandrew.github.io/GCB2022/index.html Figures from the Global Carbon Budget 2022]<br> Lizenz: [http://creativecommons.org/licenses/by/4.0/ CC BY] |} | 1 |
| 18:45, 30. Mär. 2023 | C-emissions1850-2021.jpg (Datei) |  |
77 KB | Dieter Kasang (Diskussion | Beiträge) | == Beschreibung == Globale anthropogene CO2-Emissionen nach Quellen 1850-2021 == Lizenzhinweis == {| style="border:1px solid #8888aa; background-color:#f7f8ff;padding:5px;font-size:95%;" |Quelle: Andrew, R. (2022): [https://robbieandrew.github.io/GCB2022/index.html Figures from the Global Carbon Budget 2022]<br> Lizenz: [http://creativecommons.org/licenses/by/4.0/ CC BY] |} | 1 |
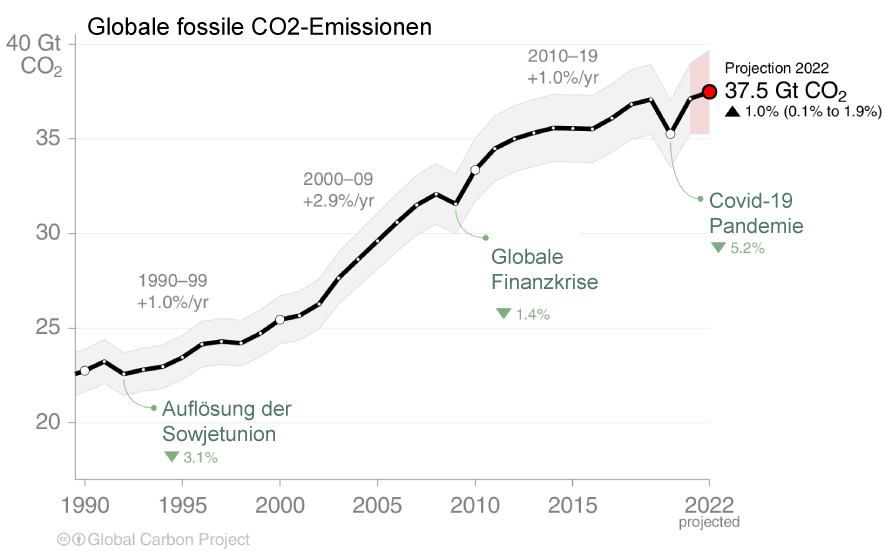
| 18:19, 30. Mär. 2023 | CO2 emissions 1990-2022.jpg (Datei) |  |
93 KB | Dieter Kasang (Diskussion | Beiträge) | Globale CO2-Emissionen aus fossilen Brennstoffen 1990-2022 == Lizenzhinweis == {| style="border:1px solid #8888aa; background-color:#f7f8ff;padding:5px;font-size:95%;" |Quelle: Andrew, R. (2022): Figures from the Global Carbon Budget 2022, https://robbieandrew.github.io/GCB2022/index.html Lizenz: CC BY http://creativecommons.org/licenses/by/4.0/ |} | 1 |
| 19:24, 23. Mär. 2023 | CO2-Entnahme Tab.2.jpg (Datei) |  |
54 KB | Dieter Kasang (Diskussion | Beiträge) | == Beschreibung == Tab. 2: Technisches und ökonomisches Potential landbasierter CO2-Speicherung für 2050 == Lizenzhinweis == {| style="border:1px solid #8888aa; background-color:#f7f8ff;padding:5px;font-size:95%;" |Quelle: IPCC AR6, WGIII, Table 7.3 und 7.4.2.2<br> Lizenz: eigene Darstellung; CC BY-SA | 1 |
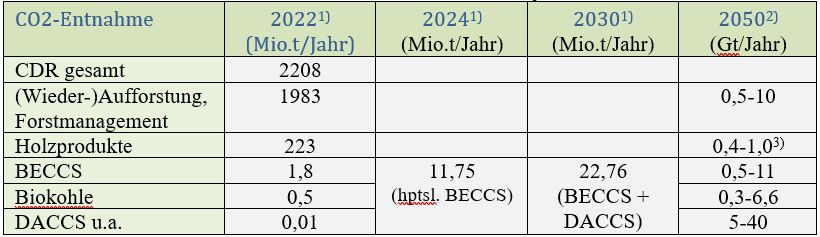
| 11:19, 19. Mär. 2023 | CO2-Entnahme Tab.jpg (Datei) |  |
40 KB | Dieter Kasang (Diskussion | Beiträge) | == Beschreibung == Aktuelle und zukünftige CO2-Entnahme durch CDR-Methoden == Lizenzhinweis == {| style="border:1px solid #8888aa; background-color:#f7f8ff;padding:5px;font-size:95%;" |Quelle: Werte nach 1) Powis R.C.M., M.S. Smith, J.C. Minx J., T. Gasser (2023): Quantifying global carbon dioxide removal deployment. Environ. Res. Lett. 18 (2023) 024022, https://doi.org/10.1088/1748-9326/acb450; 2) IPCC AR6, WGIII, Table TS.7, 3) IPCC AR6, WGIII, 7.4.5.3<br> Lizenz: eigene Darstellung; CC BY-SA | 1 |
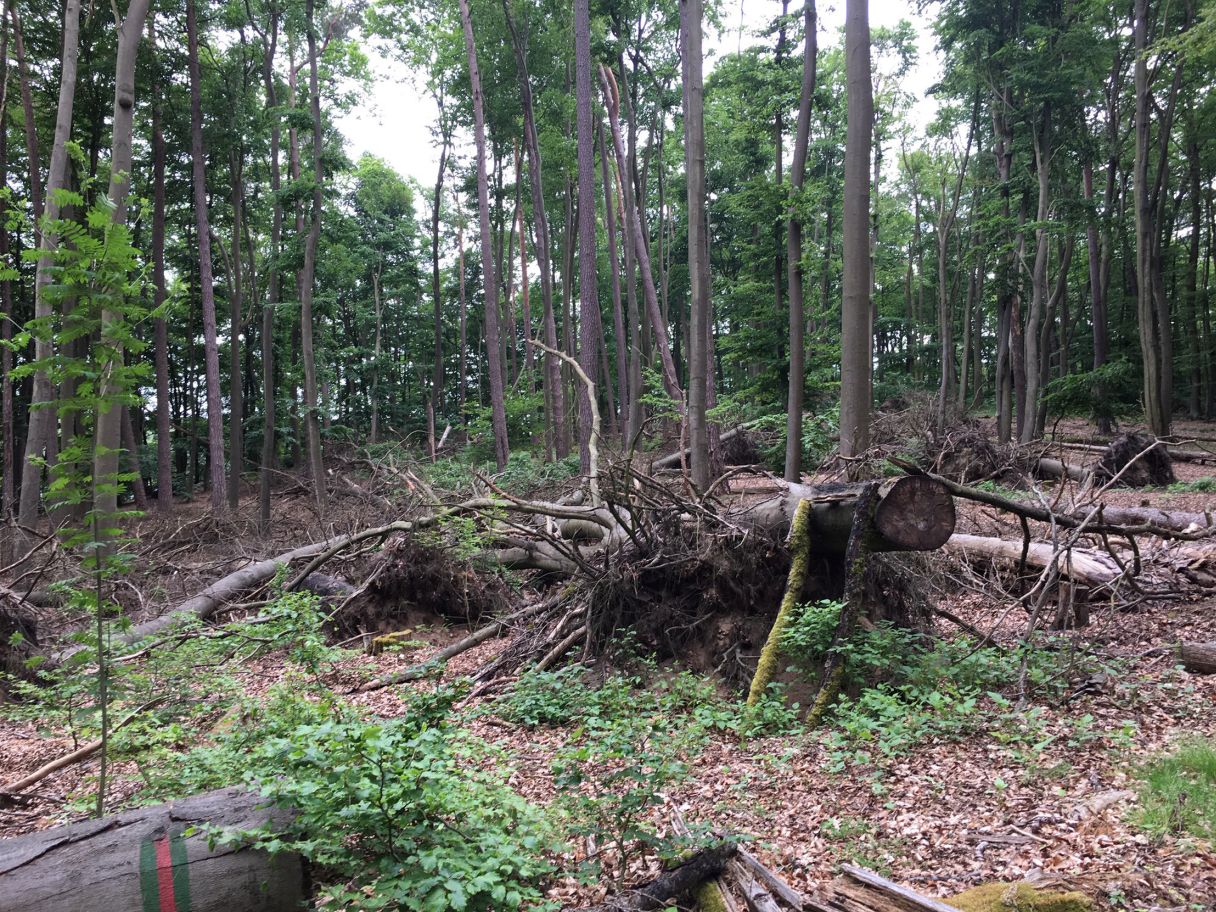
| 20:16, 13. Mär. 2023 | Windwurf im Mischwald.jpg (Datei) |  |
411 KB | Dieter Kasang (Diskussion | Beiträge) | == Beschreibung == Totholz im Laubwald == Lizenzhinweis == {| style="border:1px solid #8888aa; background-color:#f7f8ff;padding:5px;font-size:95%;" |Quelle: Fachagentur Nachwachsende Rohstoffe e.V. (FNR) (2022): Totholz im Wald https://bilderpool.fnr.de/picture.php?/1150/category/113&metadata <br> Lizenz: CC BY | 1 |
| 12:19, 13. Mär. 2023 | Moorböden Klimawirkung.jpg (Datei) |  |
1,73 MB | Dieter Kasang (Diskussion | Beiträge) | == Beschreibung == Klimawirkung von Moorböden: Durch landwirtschaftliche Nutzung werden Moore zu starken Quellen von CO2-Emissionen. == Lizenzhinweis == {| style="border:1px solid #8888aa; background-color:#f7f8ff;padding:5px;font-size:95%;" |Quelle: Fachagentur Nachwachsende Rohstoffe e.V., FNR (2022): Klimawirkung von Moorböden, https://mediathek.fnr.de/grafiken/daten-und-fakten/moor-torf/klimawirkung-von-moorboden-grafik.html<br> Lizenz: Die Verwendung der angebotenen Grafiken und Fotos ist… | 1 |
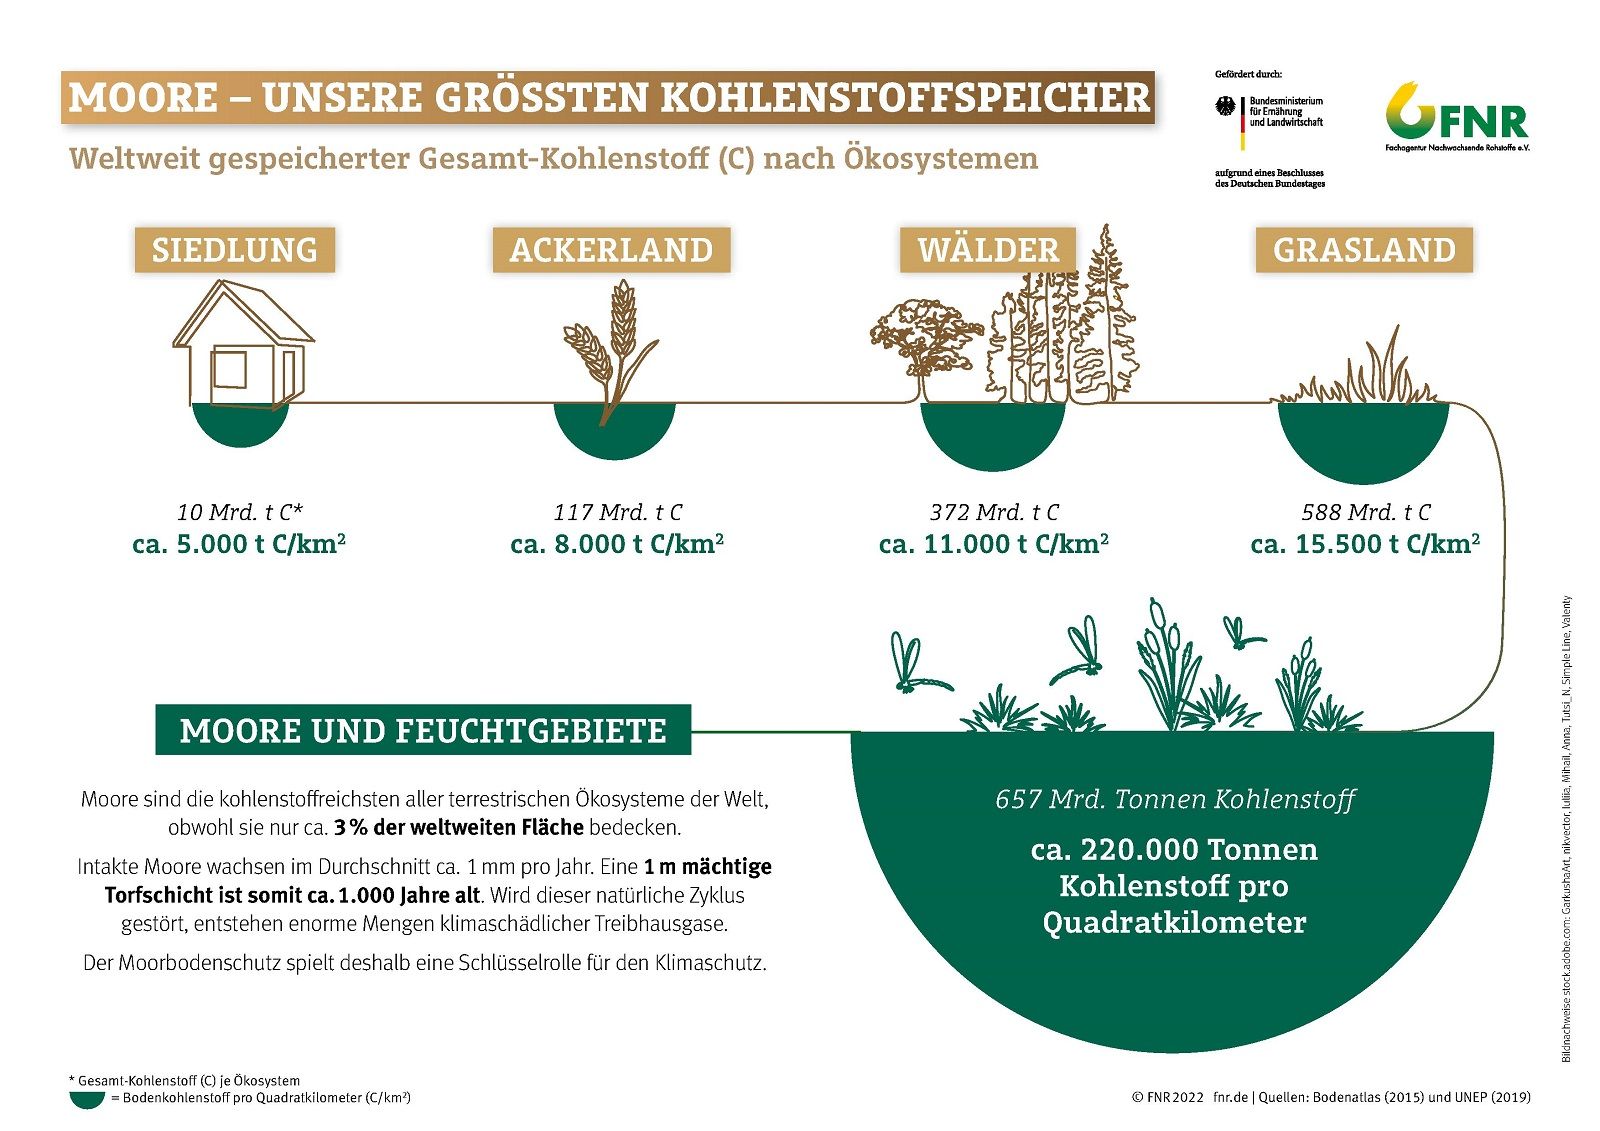
| 12:14, 13. Mär. 2023 | Moore als Kohlenstoffspeicher.jpg (Datei) |  |
218 KB | Dieter Kasang (Diskussion | Beiträge) | == Beschreibung == Moore als Kohlenstoffspeicher: Die Moore der Erde speichern fast doppelt so viel Kohlenstoff wie alle Wälder. == Lizenzhinweis == {| style="border:1px solid #8888aa; background-color:#f7f8ff;padding:5px;font-size:95%;" |Quelle: Fachagentur Nachwachsende Rohstoffe e.V., FNR (2022): Moore – unsere größten Kohlenstoffspeicher, https://mediathek.fnr.de/moore-unsere-groessten-kohlenstoffspeicher.html<br> Lizenz: Die Verwendung der angebotenen Grafiken und Fotos ist für redaktione… | 1 |
| 12:07, 13. Mär. 2023 | Kohlenstoffspeicher wald holz .jpg (Datei) |  |
392 KB | Dieter Kasang (Diskussion | Beiträge) | == Beschreibung == Kohlenstoffspeicher von Wald und Holz: Bäume entziehen der Atmosphäre das Treibhausgas Kohlenstoffdioxid (CO2) und binden den enthaltenen Kohlenstoff (C) in der Biomasse. Die nachhaltige Nutzung von Holz verstärkt diese Klimaleistung und kann zudem emissionsstärkere Rohstoffe ersetzen. Bei der Verbrennung oder Zersetzung von Holz gelangt das CO2 wieder in die Atmosphäre == Lizenzhinweis == {| style="border:1px solid #8888aa; background-color:#f7f8ff;padding:5px;font-size:95%… | 1 |
| 11:07, 13. Mär. 2023 | Aufforstung-Klima.jpg (Datei) |  |
221 KB | Dieter Kasang (Diskussion | Beiträge) | == Beschreibung == Klimawirkungen von Aufforstung und Wiederaufforstung == Lizenzhinweis == {| style="border:1px solid #8888aa; background-color:#f7f8ff;padding:5px;font-size:95%;" |Quelle: Eigene Darstellung, Idee nach : B. Gordon, Bonan (2008): Forests and climate change: forcings, feedbacks, and the climate benefits of forests, Science 320 (Issue 5882) 1444–1449<br> Lizenz: CC BY-SA | 1 |
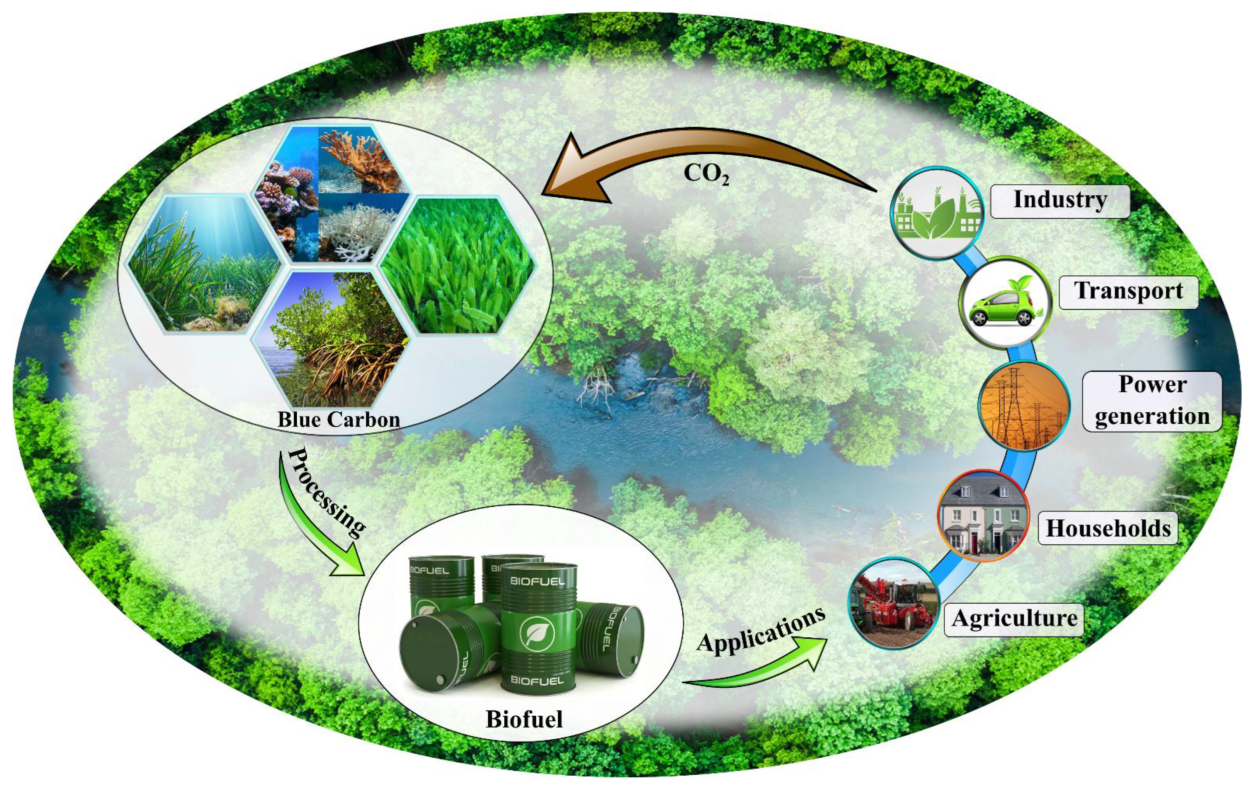
| 20:26, 9. Mär. 2023 | Blue carbon exchange.png (Datei) |  |
1,45 MB | Dieter Kasang (Diskussion | Beiträge) | == Beschreibung == Die Bedeutung von blue carbon als CO<sub>2</sub>-Speicher und in einer Kreislaufwirtschaft == Lizenzhinweis == {| style="border:1px solid #8888aa; background-color:#f7f8ff;padding:5px;font-size:95%;" |Quelle: Suhaib A. Bandh, S.A., F.A. Malla, I. Qayoom et al. (2023): Importance of Blue Carbon in Mitigating Climate Change and Plastic/Microplastic Pollution and Promoting Circular Economy, Sustainability, 10.3390/su15032682, 15, 3, (2682)<br> Lizenz: [https://www.iea.org/terms/… | 1 |
| 20:23, 9. Mär. 2023 | Blue carbon mitigation cc.png (Datei) |  |
1,29 MB | Dieter Kasang (Diskussion | Beiträge) | == Beschreibung == Die Bedeutung von blue carbon als CO2-Speicher und in einer Kreislaufwirtschaft == Lizenzhinweis == {| style="border:1px solid #8888aa; background-color:#f7f8ff;padding:5px;font-size:95%;" |Quelle: Suhaib A. Bandh, S.A., F.A. Malla, I. Qayoom et al. (2023): Importance of Blue Carbon in Mitigating Climate Change and Plastic/Microplastic Pollution and Promoting Circular Economy, Sustainability, 10.3390/su15032682, 15, 3, (2682)<br> Lizenz: [https://www.iea.org/terms/creative-co… | 1 |
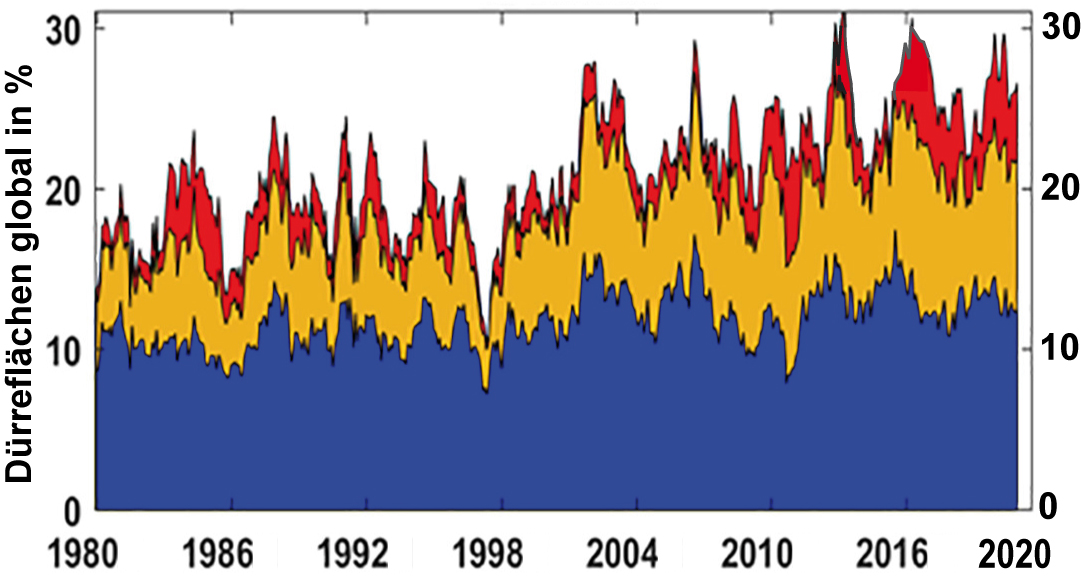
| 19:50, 20. Feb. 2023 | Drought-area-1980-2020.jpg (Datei) |  |
235 KB | Dieter Kasang (Diskussion | Beiträge) | Anteil sehr trockener Gebiete an der globalen Landoberfläche ==Lizenzhinweis== {| style="border:1px solid #8888aa; background-color:#f7f8ff;padding:5px;font-size:95%;" | Bild neu gezeichnet nach Dai A., K.E. Trenberth, and T. Qian, 2004: A global data set of Palmer Drought Severity Index for 1870-2002: Relationship with soil moisture and effects of surface warming. J. Hydrometeorol., 5, 1117-1130 |} | 1 |
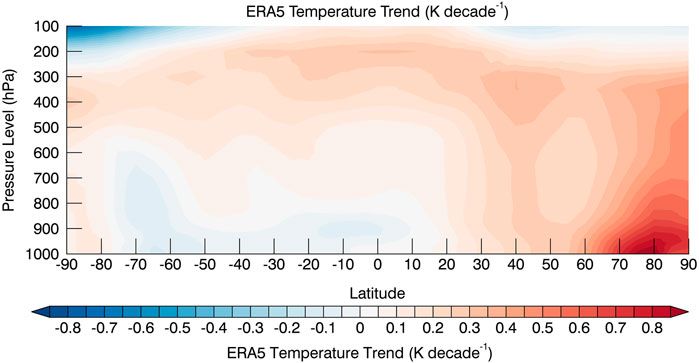
| 20:18, 6. Feb. 2023 | Warming troposphere.jpg (Datei) |  |
34 KB | Dieter Kasang (Diskussion | Beiträge) | == Beschreibung == Erwärmung der Troposphäre 1979 bis 2020 ==Lizenzhinweis== {| style="border:1px solid #8888aa; background-color:#f7f8ff;padding:5px;font-size:95%;" | Quelle: Taylor P.C., R.C. Boeke, L.N. Boisvert et al. (2022): Process Drivers, Inter-Model Spread, and the Path Forward: A Review of Amplified Arctic Warming. Front. Earth Sci. 9:758361. doi: 10.3389/feart.2021.758361 <br> Lizenz: CC BY http://creativecommons.org/licenses/by/4.0/ |} | 1 |
| 10:28, 4. Feb. 2023 | Glacier MB regions 1950-2021.jpg (Datei) |  |
120 KB | Dieter Kasang (Diskussion | Beiträge) | 3 | |
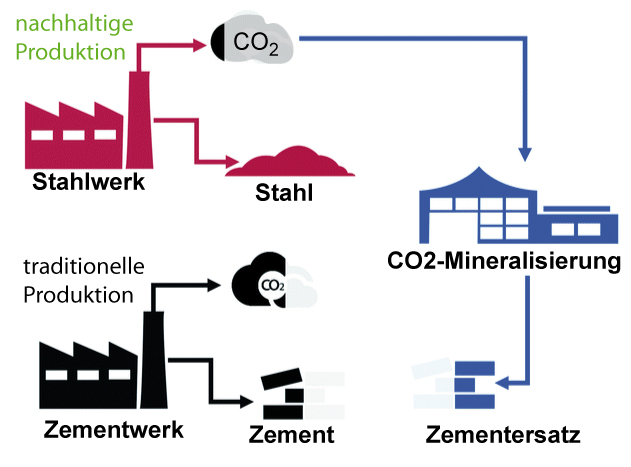
| 20:00, 3. Feb. 2023 | CO2 Mineralisierung.jpg (Datei) |  |
96 KB | Dieter Kasang (Diskussion | Beiträge) | 2 | |
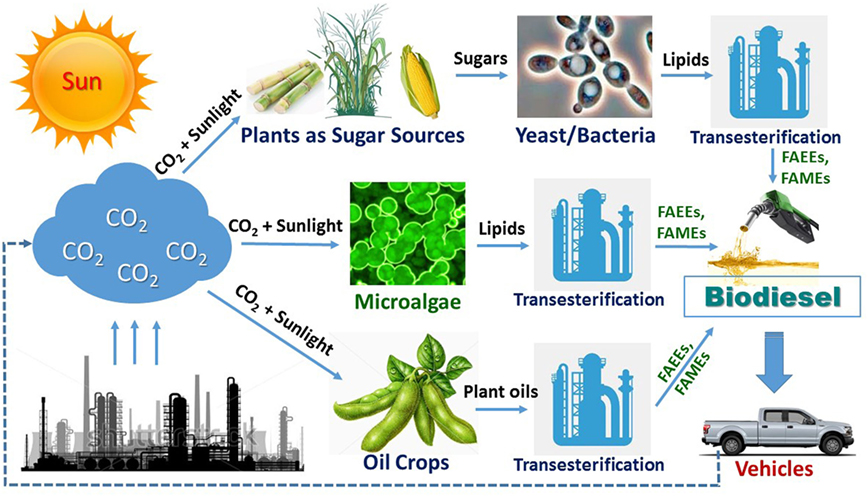
| 19:37, 3. Feb. 2023 | Microalgae biodiesel production.jpg (Datei) |  |
329 KB | Dieter Kasang (Diskussion | Beiträge) | == Beschreibung == Biologische Produktion von Biodiesel mit CO2 == Lizenzhinweis == {| style="border:1px solid #8888aa; background-color:#f7f8ff;padding:5px;font-size:95%;" |Quelle: Xie D (2017) Integrating Cellular and Bioprocess Engineering in the Non-Conventional Yeast Yarrowia lipolytica for Biodiesel Production: A Review. Front. Bioeng. Biotechnol. 5:65. doi: 10.3389/fbioe.2017.00065 https://www.frontiersin.org/articles/10.3389/fbioe.2017.00065/full <br> Lizenz: [https://creativecommons.o… | 1 |
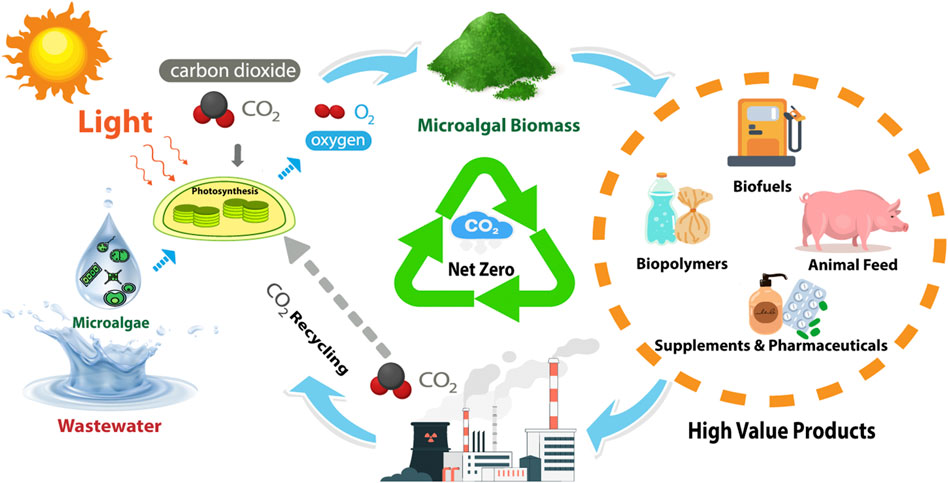
| 19:21, 3. Feb. 2023 | CO2 und Mikroalgen.jpg (Datei) |  |
83 KB | Dieter Kasang (Diskussion | Beiträge) | == Beschreibung == Produkte aus Abwasser, Mikroalgen und CO2 == Lizenzhinweis == {| style="border:1px solid #8888aa; background-color:#f7f8ff;padding:5px;font-size:95%;" |Quelle: Srimongkol P, Sangtanoo P, Songserm P, Watsuntorn W and Karnchanatat A (2022) Microalgae-based wastewater treatment for developing economic and environmental sustainability: Current status and future prospects. Front. Bioeng. Biotechnol. 10:904046. doi: 10.3389/fbioe.2022.904046 https://www.frontiersin.org/articles/10.… | 1 |
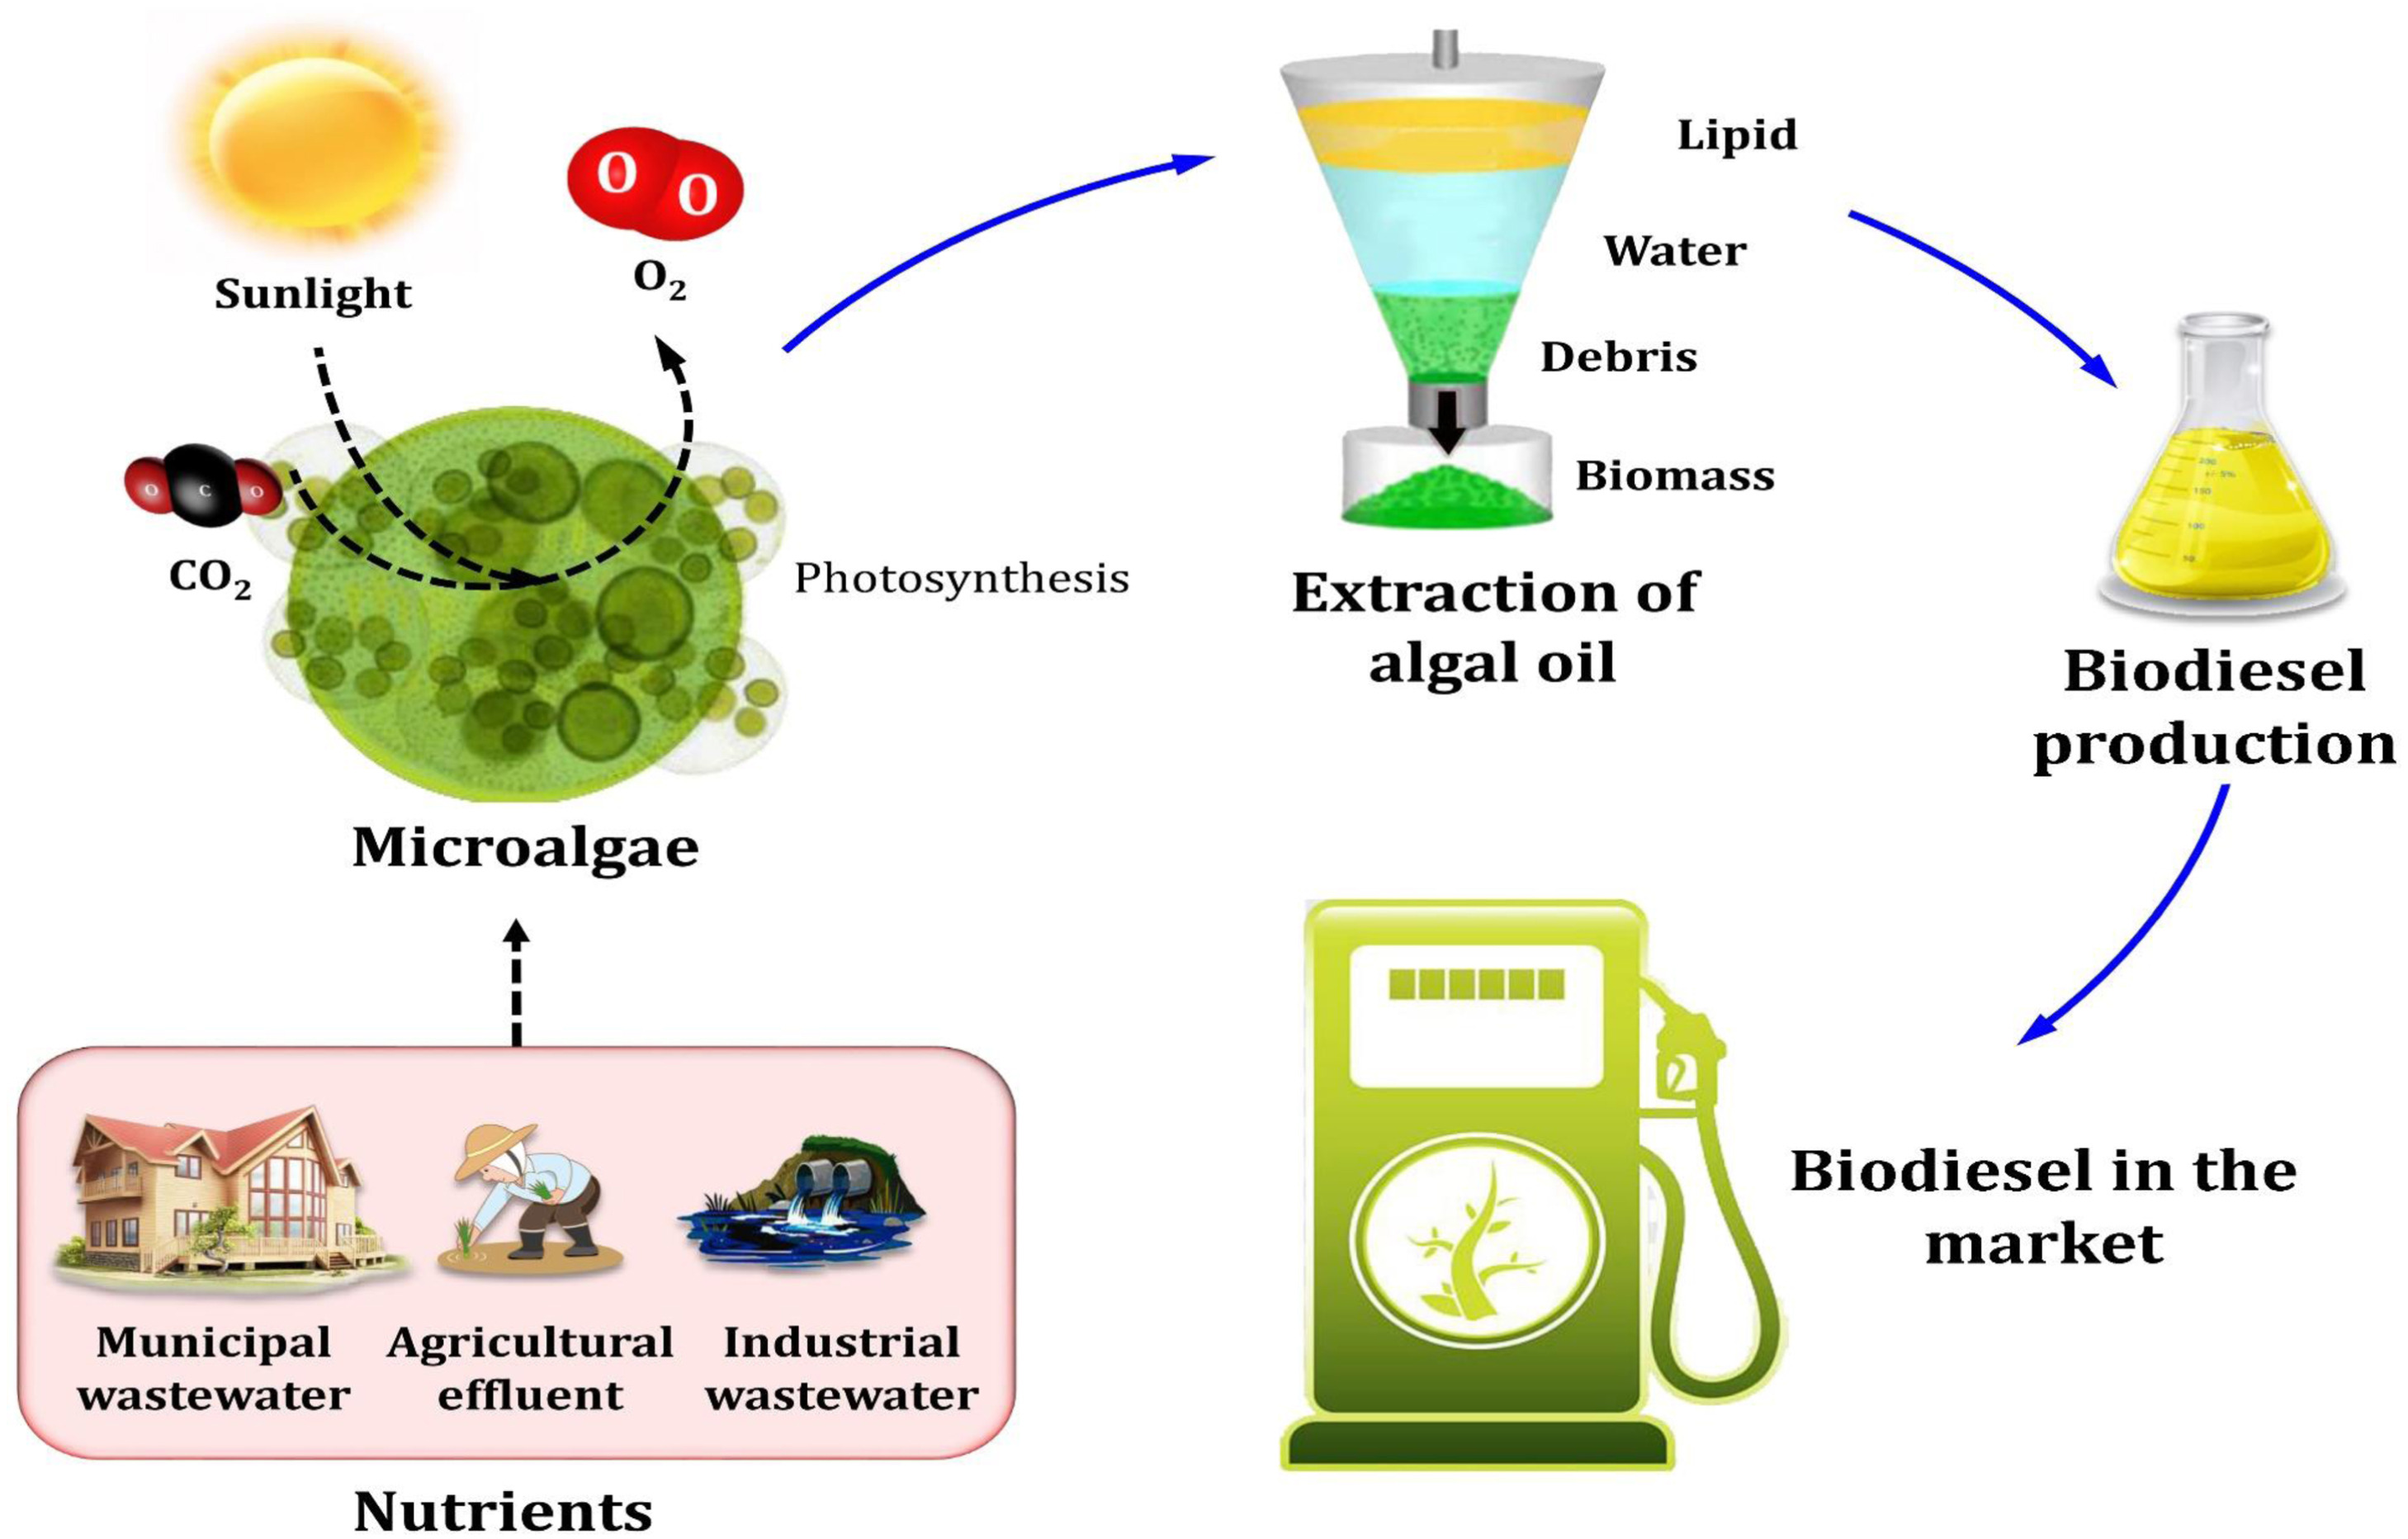
| 19:13, 3. Feb. 2023 | Biodiesel from microalgae.jpg (Datei) |  |
528 KB | Dieter Kasang (Diskussion | Beiträge) | == Beschreibung == Biodiesel aus der Biomasse von Mikroalgen == Lizenzhinweis == {| style="border:1px solid #8888aa; background-color:#f7f8ff;padding:5px;font-size:95%;" |Quelle: Ali, S.S., S.G. Mastropetros, M. Schagerl et al. (2022): Recent advances in wastewater microalgae-based biofuels production: A state-of-the-art review, Energy Reports 8, 13253-13280, https://www.sciencedirect.com/science/article/pii/S2352484722018674 <br> Lizenz: CC BY-NC-ND, https://creativecommons.org/licenses/by-nc-… | 1 |
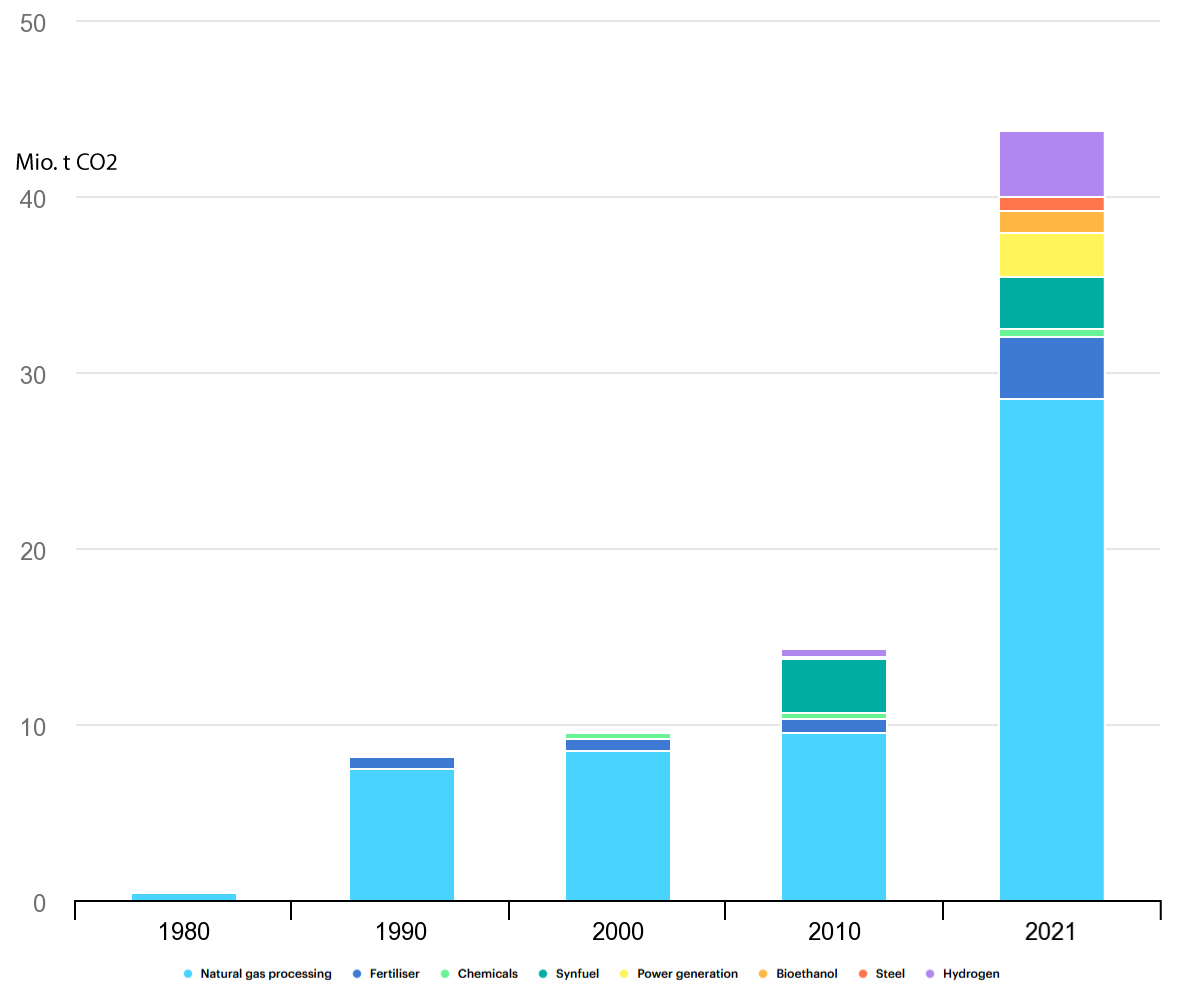
| 19:05, 3. Feb. 2023 | Ccus-facilities-1980-2021.png (Datei) |  |
48 KB | Dieter Kasang (Diskussion | Beiträge) | 2 | |
| 16:43, 3. Feb. 2023 | CO2 separation utilisation.gif (Datei) |  |
244 KB | Dieter Kasang (Diskussion | Beiträge) | 2 | |
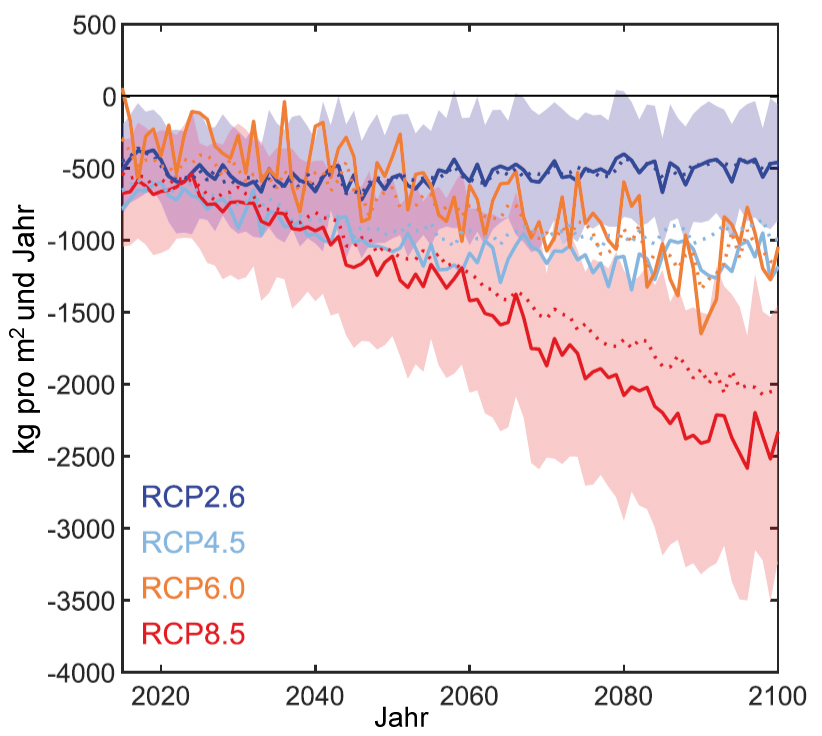
| 19:20, 1. Feb. 2023 | Global glaciers mass-change-2050-2022.jpg (Datei) |  |
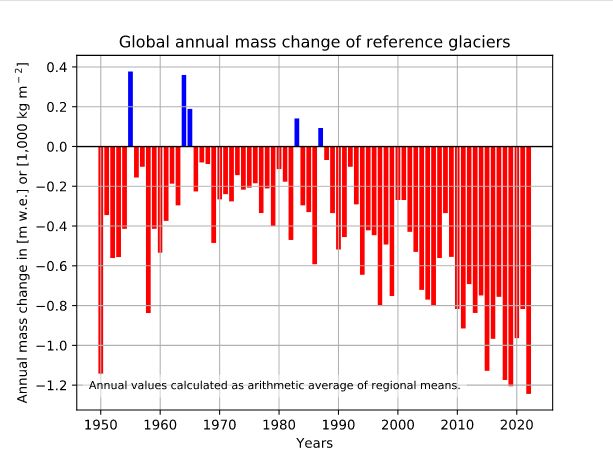
43 KB | Dieter Kasang (Diskussion | Beiträge) | == Beschreibung == Jährliche globale Massenbilanz von [https://wgms.ch/products_ref_glaciers/ Referenzgletschern] mit mindestens 30 Jahren Gletscherbeobachtung in verschiedenen Gletscherregionen der Erde 1950-2021/22 in m Wasseräquivalent bzw, 1000 kg/m2. ==Lizenzhinweis== {| style="border:1px solid #8888aa; background-color:#f7f8ff;padding:5px;font-size:95%;" | Quelle: WGMS, World Glacier Monitoring Service (2023): [https://wgms.ch/global-glacier-state/ global glacier state]<br> Lizenz: [http… | 1 |
| 11:43, 1. Feb. 2023 | Glaciers-mass-balance-rate.jpg (Datei) |  |
220 KB | Dieter Kasang (Diskussion | Beiträge) | == Beschreibung == Globale Gletscher-Gebiete (dunkelblau). Hellblaue Kreise zeigen die Größe der Gletscherfläche in den Regionen an. Die Ziffern geben den jährlichen Massenverlust der Gletscherregionen zwischen 2000 und 2019 in Gt pro Jahr an. ==Lizenzhinweis== {| style="border:1px solid #8888aa; background-color:#f7f8ff;padding:5px;font-size:95%;" | Quelle: Marzeion, B., R. Hock, B. Anderson, A. Bliss et al. (2020): Partitioning the uncertainty of ensemble projections of global glacier mass ch… | 1 |
| 16:44, 31. Jan. 2023 | Global glaciers mass-change-2000-2019.jpg (Datei) |  |
418 KB | Dieter Kasang (Diskussion | Beiträge) | Globale Gletscher-Gebiete (dunkelblau). Hellblaue Kreise zeigen die Größe der Gletscherfläche in den Regionen an. ==Lizenzhinweis== {| style="border:1px solid #8888aa; background-color:#f7f8ff;padding:5px;font-size:95%;" | Quelle: Hock, R., A. Bliss, B. Marzeion, et al., 2019: GlacierMIP - A model intercomparison of global-scale glacier mass-balance models and projections. Journal of Glaciology, 1, 1-15, doi:10.1017/jog.2019.22.<br> Lizenz: [http://creativecommons.org/licenses/by/4.0/ CC BY 4.0… | 1 |
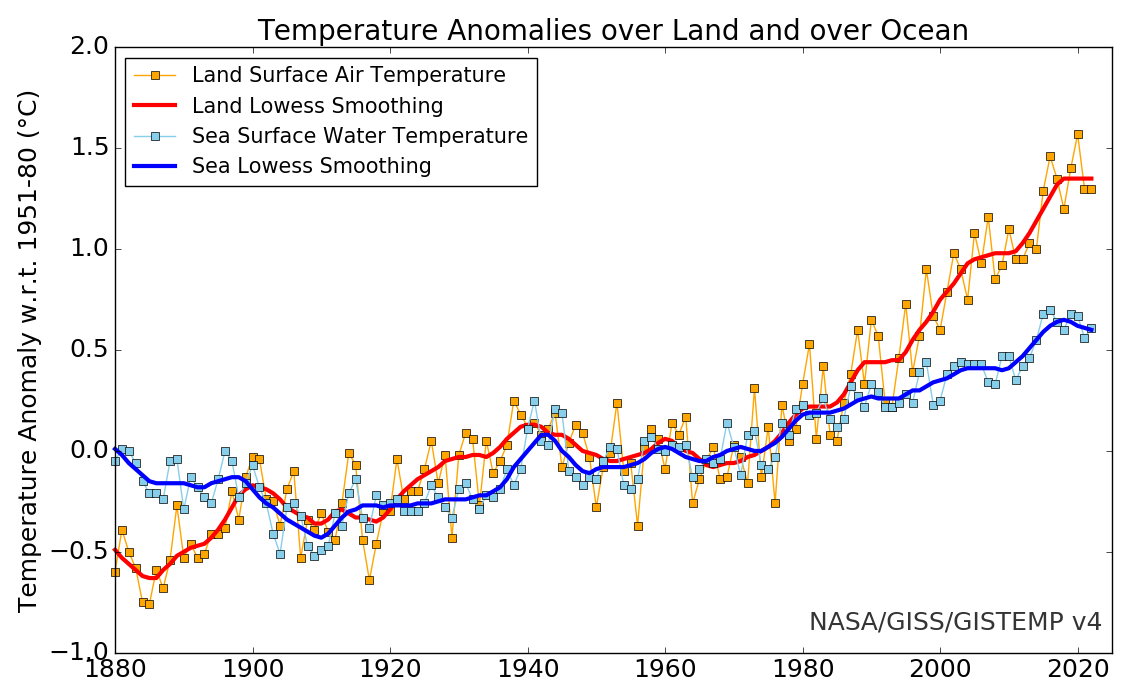
| 18:57, 27. Jan. 2023 | Temp land ocean1880-present.png (Datei) |  |
133 KB | Dieter Kasang (Diskussion | Beiträge) | Veränderung der globalen Oberflächentemperatur über dem Land (rot) und der Meeresoberflächentemperatur (blau) 1880-2022 im Vergleich zur Basis 1951-1980. ==Lizenzhinweis== {| style="border:1px solid #8888aa; background-color:#f7f8ff;padding:5px;font-size:95%;" | Quelle: NASA (2023): [https://data.giss.nasa.gov/gistemp/graphs_v4/ GISS Surface Temperature Analysis (v4)] <br> Lizenz: public domain |} | 1 |
| 17:44, 25. Jan. 2023 | Chemical products.jpg (Datei) |  |
157 KB | Dieter Kasang (Diskussion | Beiträge) | == Beschreibung == Wir leben in einer Welt voller chemischer Produkte. == Lizenzhinweis == {| style="border:1px solid #8888aa; background-color:#f7f8ff;padding:5px;font-size:95%;" |Quelle: IEA (2018): The Future of Petrochemicals. https://www.iea.org/reports/the-future-of-petrochemicals <br> Lizenz: [https://www.iea.org/terms/creative-commons-cc-licenses CC BY 4.0] | 1 |
| 15:06, 13. Jan. 2023 | Africa-prec-aug-dec.jpg (Datei) |  |
157 KB | Dieter Kasang (Diskussion | Beiträge) | == Beschreibung == Änderung der Sommertage in Afrika 1980 bis 2018 in Tage pro Jahrzehnt ==Lizenzhinweis== {| style="border:1px solid #8888aa; background-color:#f7f8ff;padding:5px;font-size:95%;" | Quelle: Alahacoon, N., M. Edirisinghe, M. Simwanda, E. Perera, V.R. Nyirenda, M. Ranagalage (2022): Rainfall Variability and Trends over the African Continent Using TAMSAT Data (1983–2020): Towards Climate Change Resilience and Adaptation. Remote Sens. 2022, 14, 96. https://doi.org/10.3390/rs14010096… | 1 |
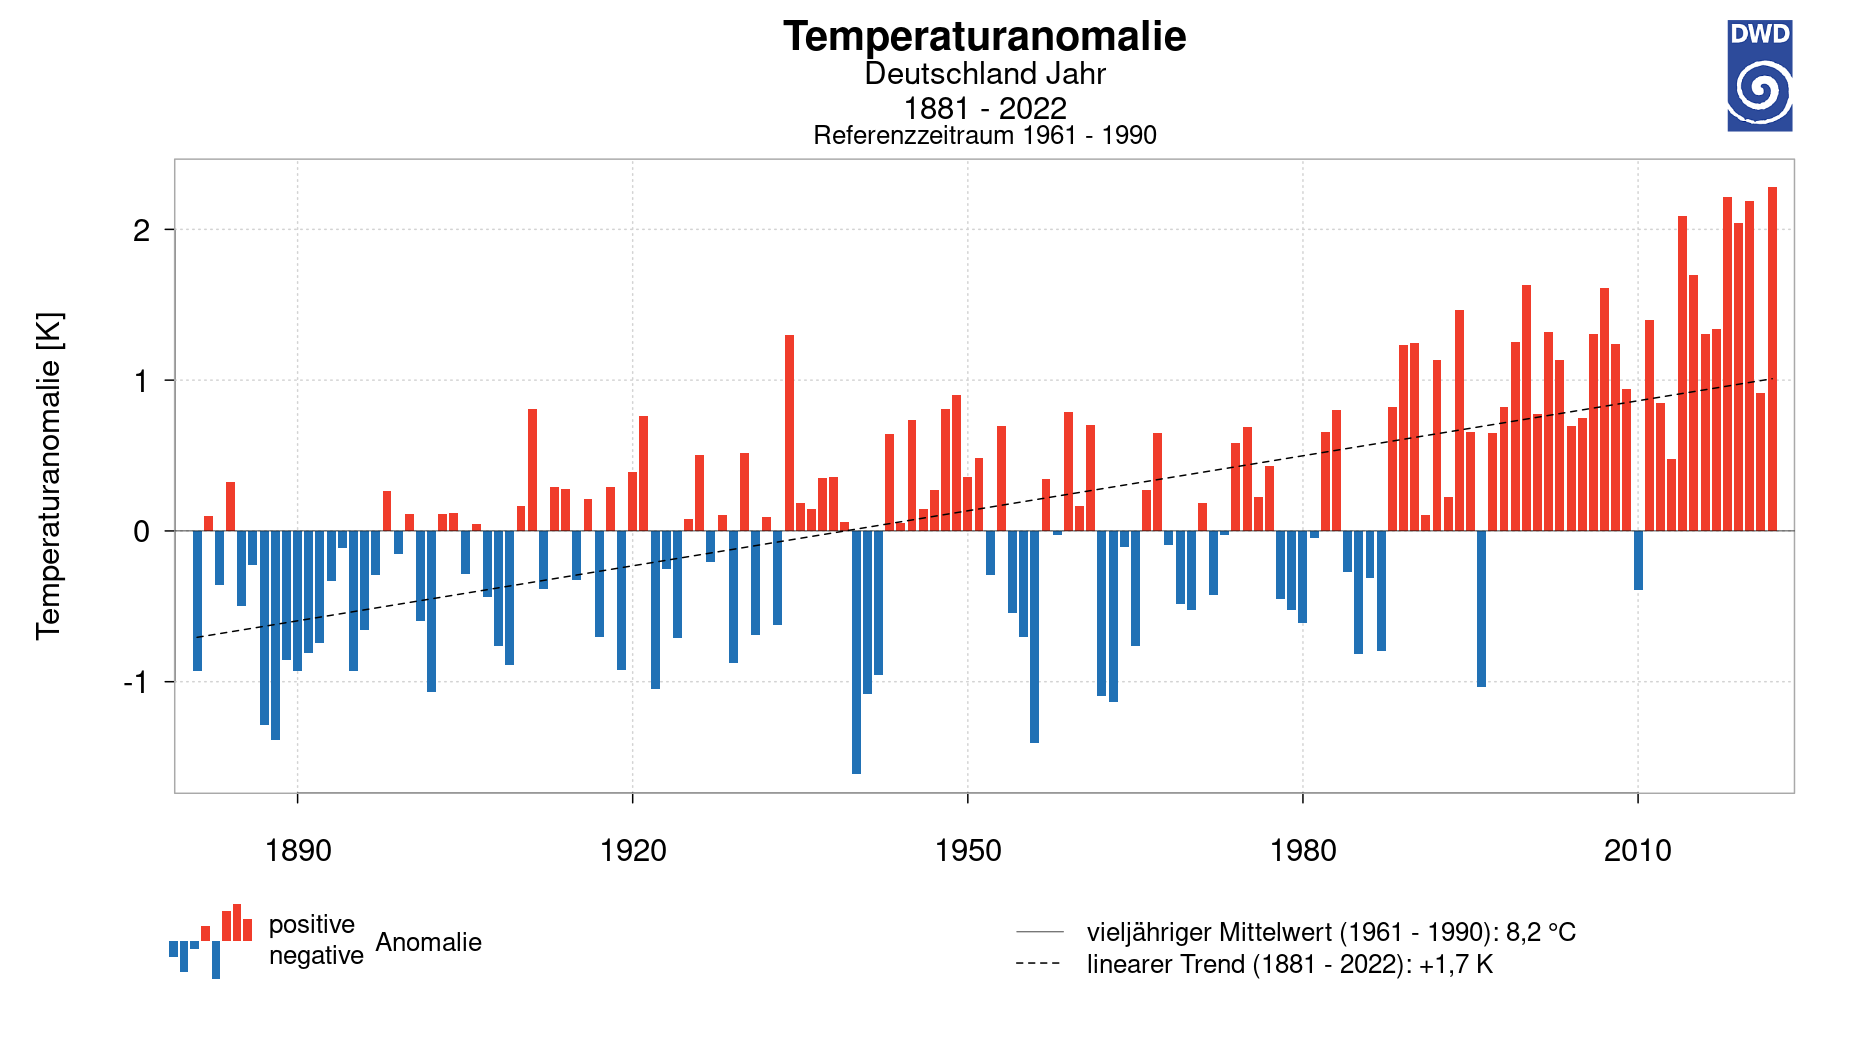
| 07:20, 3. Jan. 2023 | D temp 1881-2020.png (Datei) |  |
93 KB | Anja (Diskussion | Beiträge) | bis 2022 | 2 |
| 10:48, 26. Dez. 2022 | THG-Emissionen-CO2-Entnahme-2100.jpg (Datei) |  |
182 KB | Dieter Kasang (Diskussion | Beiträge) | 3 | |
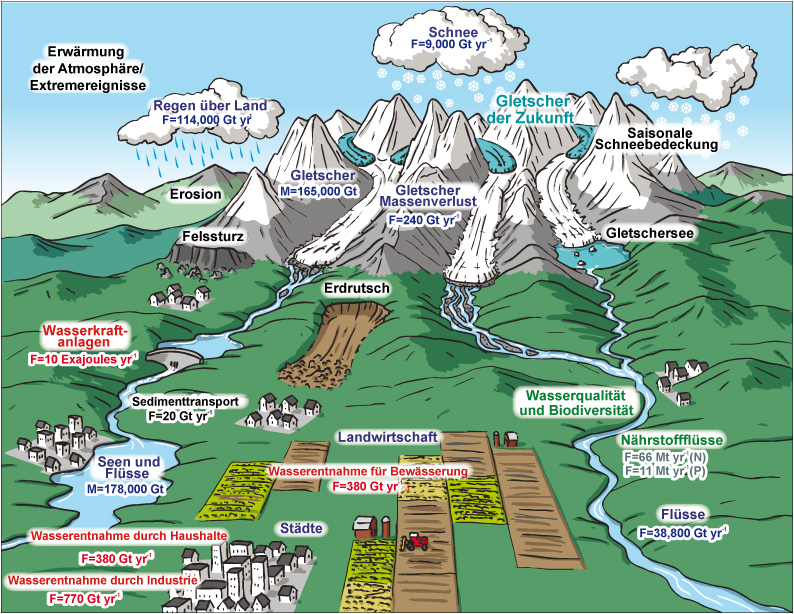
| 10:36, 22. Dez. 2022 | Hochgebirge dt.jpg (Datei) |  |
472 KB | Dieter Kasang (Diskussion | Beiträge) | Schematische Darstellung von Hochgebirgsregionen und ihrer Beziehung zum Umland. M: Masse in Gt, F: Massenflüsse in Gigatonnen (Gt) pro Jahr == Lizenzhinweis == {| style="border:1px solid #8888aa; background-color:#f7f8ff;padding:5px;font-size:95%;" | Quelle: Huss, M., B. Bookhagen, C. Huggel, D. Jacobsen et al. (2017): [https://doi.org/10.1002/2016ef000514 Toward mountains without permanent snow and ice]. Earth’s Future 5:418–435; übersetzt Lizenz: [https://creativecommons.org/licenses/by-nc-… | 1 |
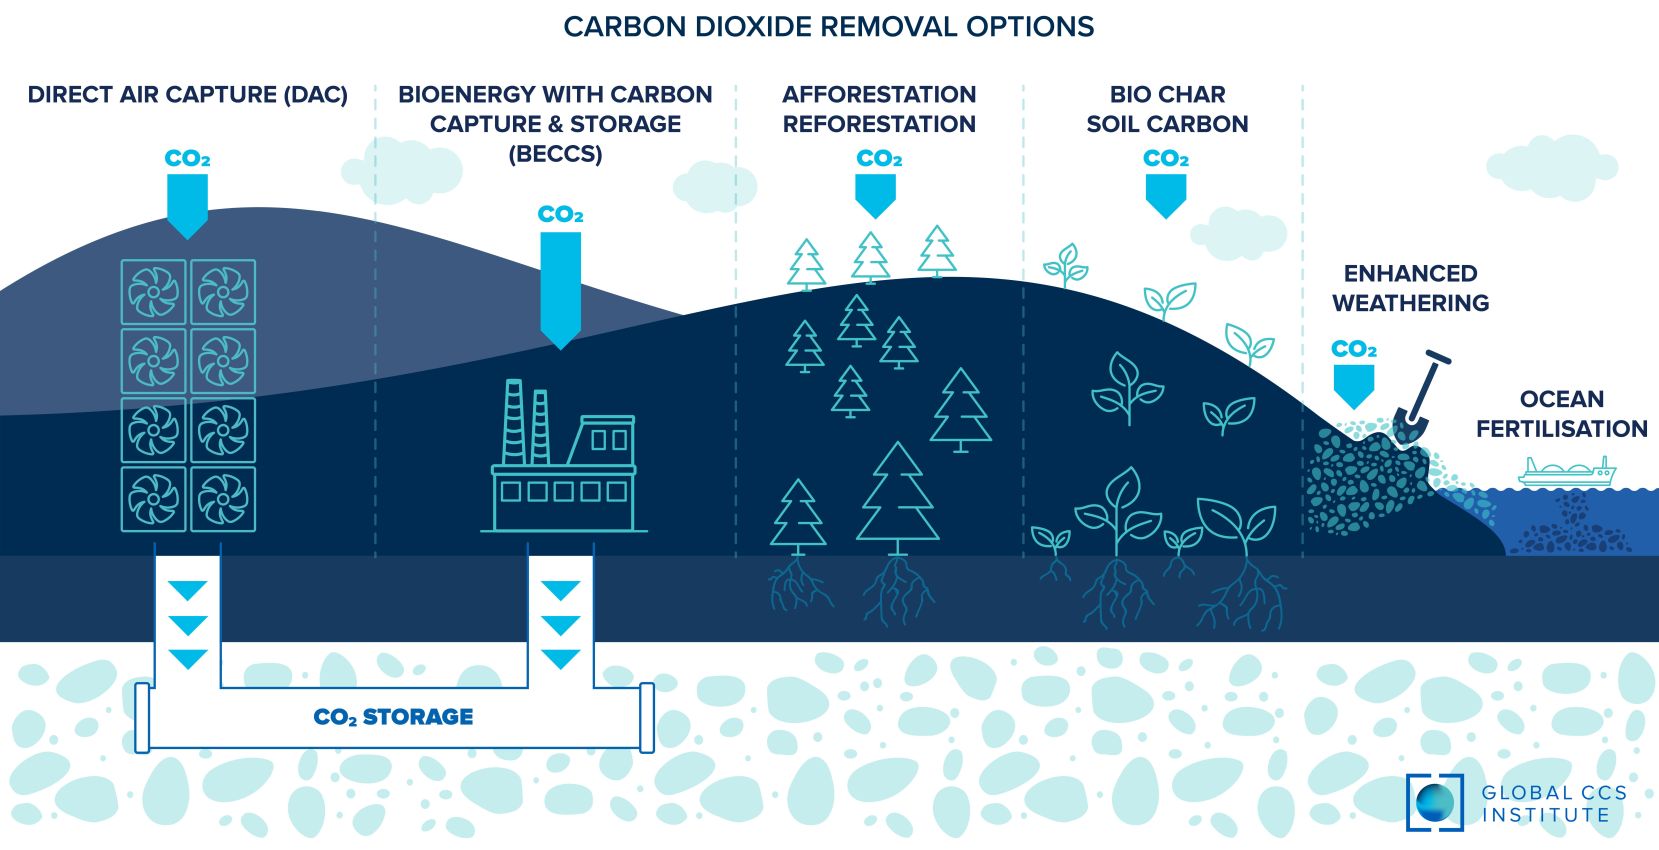
| 19:59, 20. Dez. 2022 | Carbon-removal-approaches sm.jpg (Datei) |  |
160 KB | Dieter Kasang (Diskussion | Beiträge) | == Beschreibung == Methoden der CO2-Abscheidung == Lizenzhinweis == {| style="border:1px solid #8888aa; background-color:#f7f8ff;padding:5px;font-size:95%;" |Quelle: Global CCS Institute: Carbon capture and storage images, https://www.globalccsinstitute.com/resources/ccs-image-library/ Lizenz: We encourage you to download these images and use them whenever and wherever appropriate. When using these images, please retain the 'Provided by Global CCS Institute' watermark or credit the Institute… | 1 |
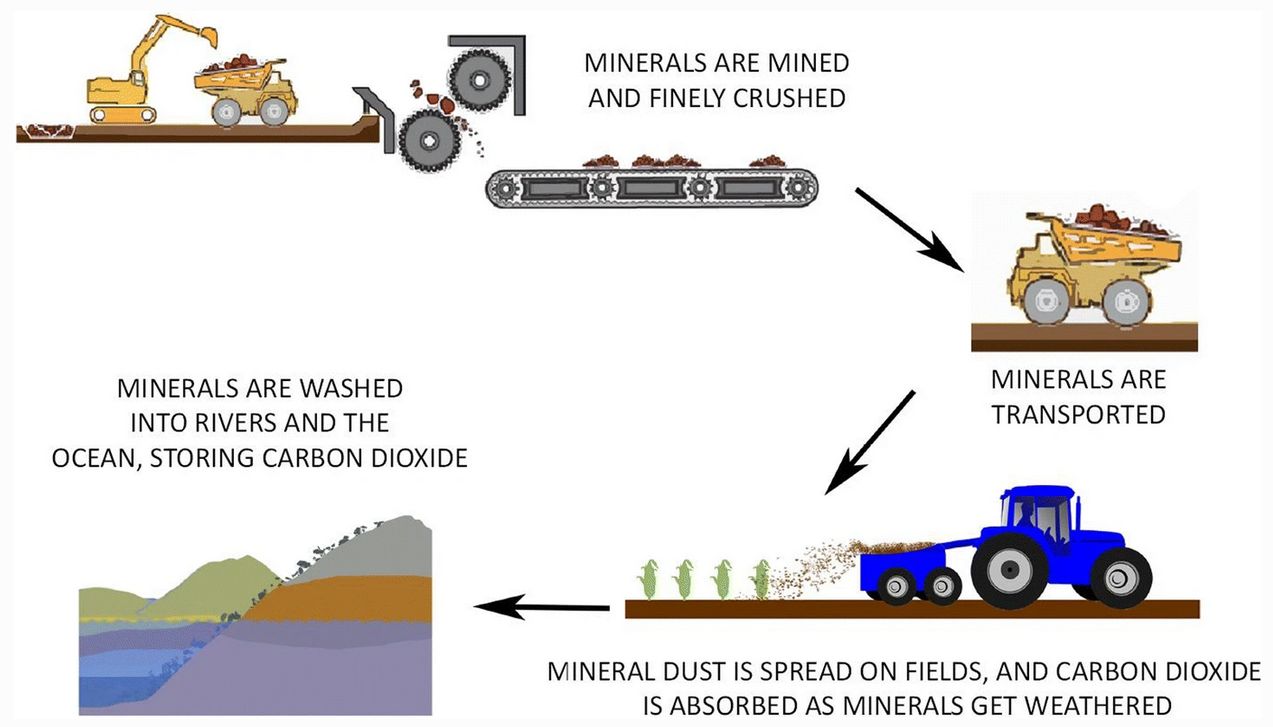
| 19:48, 20. Dez. 2022 | Enhanced Weathering.gif (Datei) |  |
126 KB | Dieter Kasang (Diskussion | Beiträge) | == Beschreibung == Verstärkte Verwitterung 2 == Lizenzhinweis == {| style="border:1px solid #8888aa; background-color:#f7f8ff;padding:5px;font-size:95%;" |Quelle: Chiquier, S., P. Patrizio, M. Bui et al. (2022): A comparative analysis of the efficiency, timing, and permanence of CO2 removal pathways, Energy Environ. Sci. 10, 4389-4403, http://dx.doi.org/10.1039/D2EE01021F <br> Lizenz: [http://creativecommons.org/licenses/by/3.0/ CC BY 3.0] |} | 1 |
| 19:43, 20. Dez. 2022 | Enhanced weathering land.jpg (Datei) |  |
88 KB | Dieter Kasang (Diskussion | Beiträge) | == Beschreibung == Verstärkte Verwitterung == Lizenzhinweis == {| style="border:1px solid #8888aa; background-color:#f7f8ff;padding:5px;font-size:95%;" |Quelle: Spence, E., Cox, E. & Pidgeon, N. Exploring cross-national public support for the use of enhanced weathering as a land-based carbon dioxide removal strategy. Climatic Change 165, 23 (2021). https://doi.org/10.1007/s10584-021-03050-y<br> Lizenz: [http://creativecommons.org/licenses/by/4.0/ CC BY 4.0] |} | 1 |
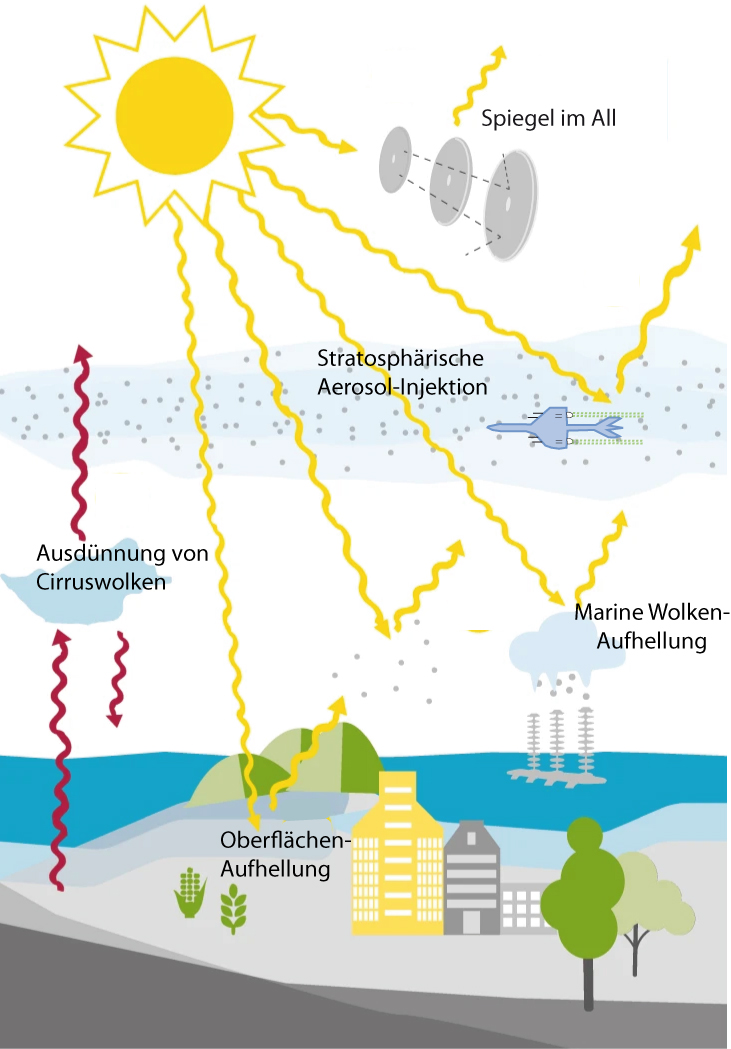
| 19:27, 20. Dez. 2022 | Principle SRM technic.jpg (Datei) |  |
762 KB | Dieter Kasang (Diskussion | Beiträge) | == Beschreibung == Grundlegende SRM-Techniken == Lizenzhinweis == {| style="border:1px solid #8888aa; background-color:#f7f8ff;padding:5px;font-size:95%;" |Quelle: Ming, T., R. de_Richter, W. Liu, S. Caillol (2014): Fighting global warming by climate engineering: Is the Earth radiation management and the solar radiation management any option for fighting climate change?, Renewable and Sustainable Energy Reviews 31, 792-834 https://doi.org/10.1016/j.rser.2013.12.032 <br> Lizenz: [http://creative… | 1 |
| 19:23, 20. Dez. 2022 | RM-Methoden.jpg (Datei) |  |
245 KB | Dieter Kasang (Diskussion | Beiträge) | == Beschreibung == Methoden des Solar Radiation Managements == Lizenzhinweis == {| style="border:1px solid #8888aa; background-color:#f7f8ff;padding:5px;font-size:95%;" |Quelle: Lawrence, M.G., Schäfer, S., Muri, H. et al. (2018): Evaluating climate geoengineering proposals in the context of the Paris Agreement temperature goals. Nat Commun 9, 3734 https://doi.org/10.1038/s41467-018-05938-3<br> Lizenz: [http://creativecommons.org/licenses/by/4.0/ CC BY 4.0] |} | 1 |
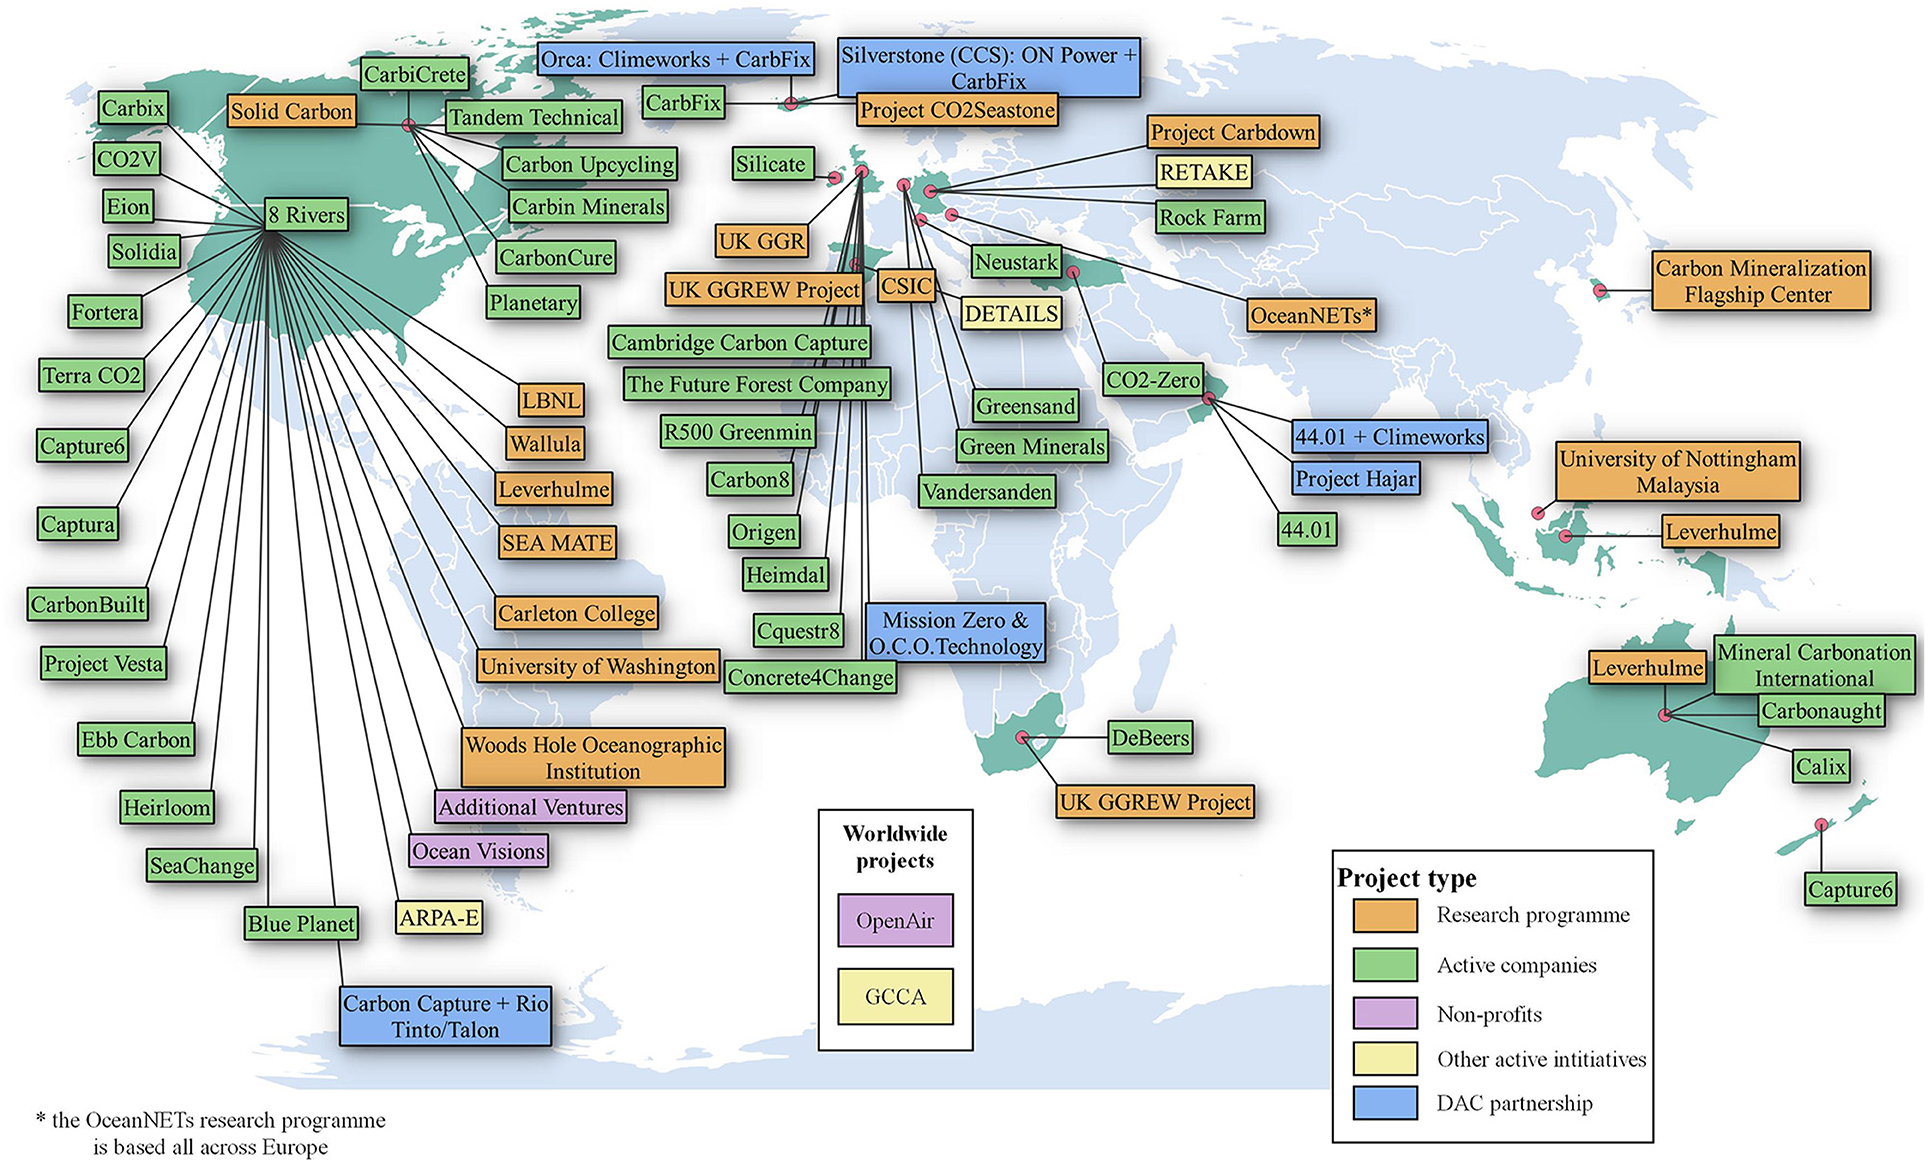
| 19:15, 20. Dez. 2022 | Global map of NET.jpg (Datei) |  |
1,25 MB | Dieter Kasang (Diskussion | Beiträge) | == Beschreibung == Weltkarte über geochemische NET-Firmen, -Projekte, -Initiativen == Lizenzhinweis == {| style="border:1px solid #8888aa; background-color:#f7f8ff;padding:5px;font-size:95%;" |Quelle: Campbell JS, Foteinis S, Furey V, Hawrot O, Pike D, Aeschlimann S, Maesano CN, Reginato PL, Goodwin DR, Looger LL, Boyden ES and Renforth P (2022) Geochemical Negative Emissions Technologies: Part I. Review. Front. Clim. 4:879133. doi: 10.3389/fclim.2022.879133 https://www.frontiersin.org/articles… | 1 |
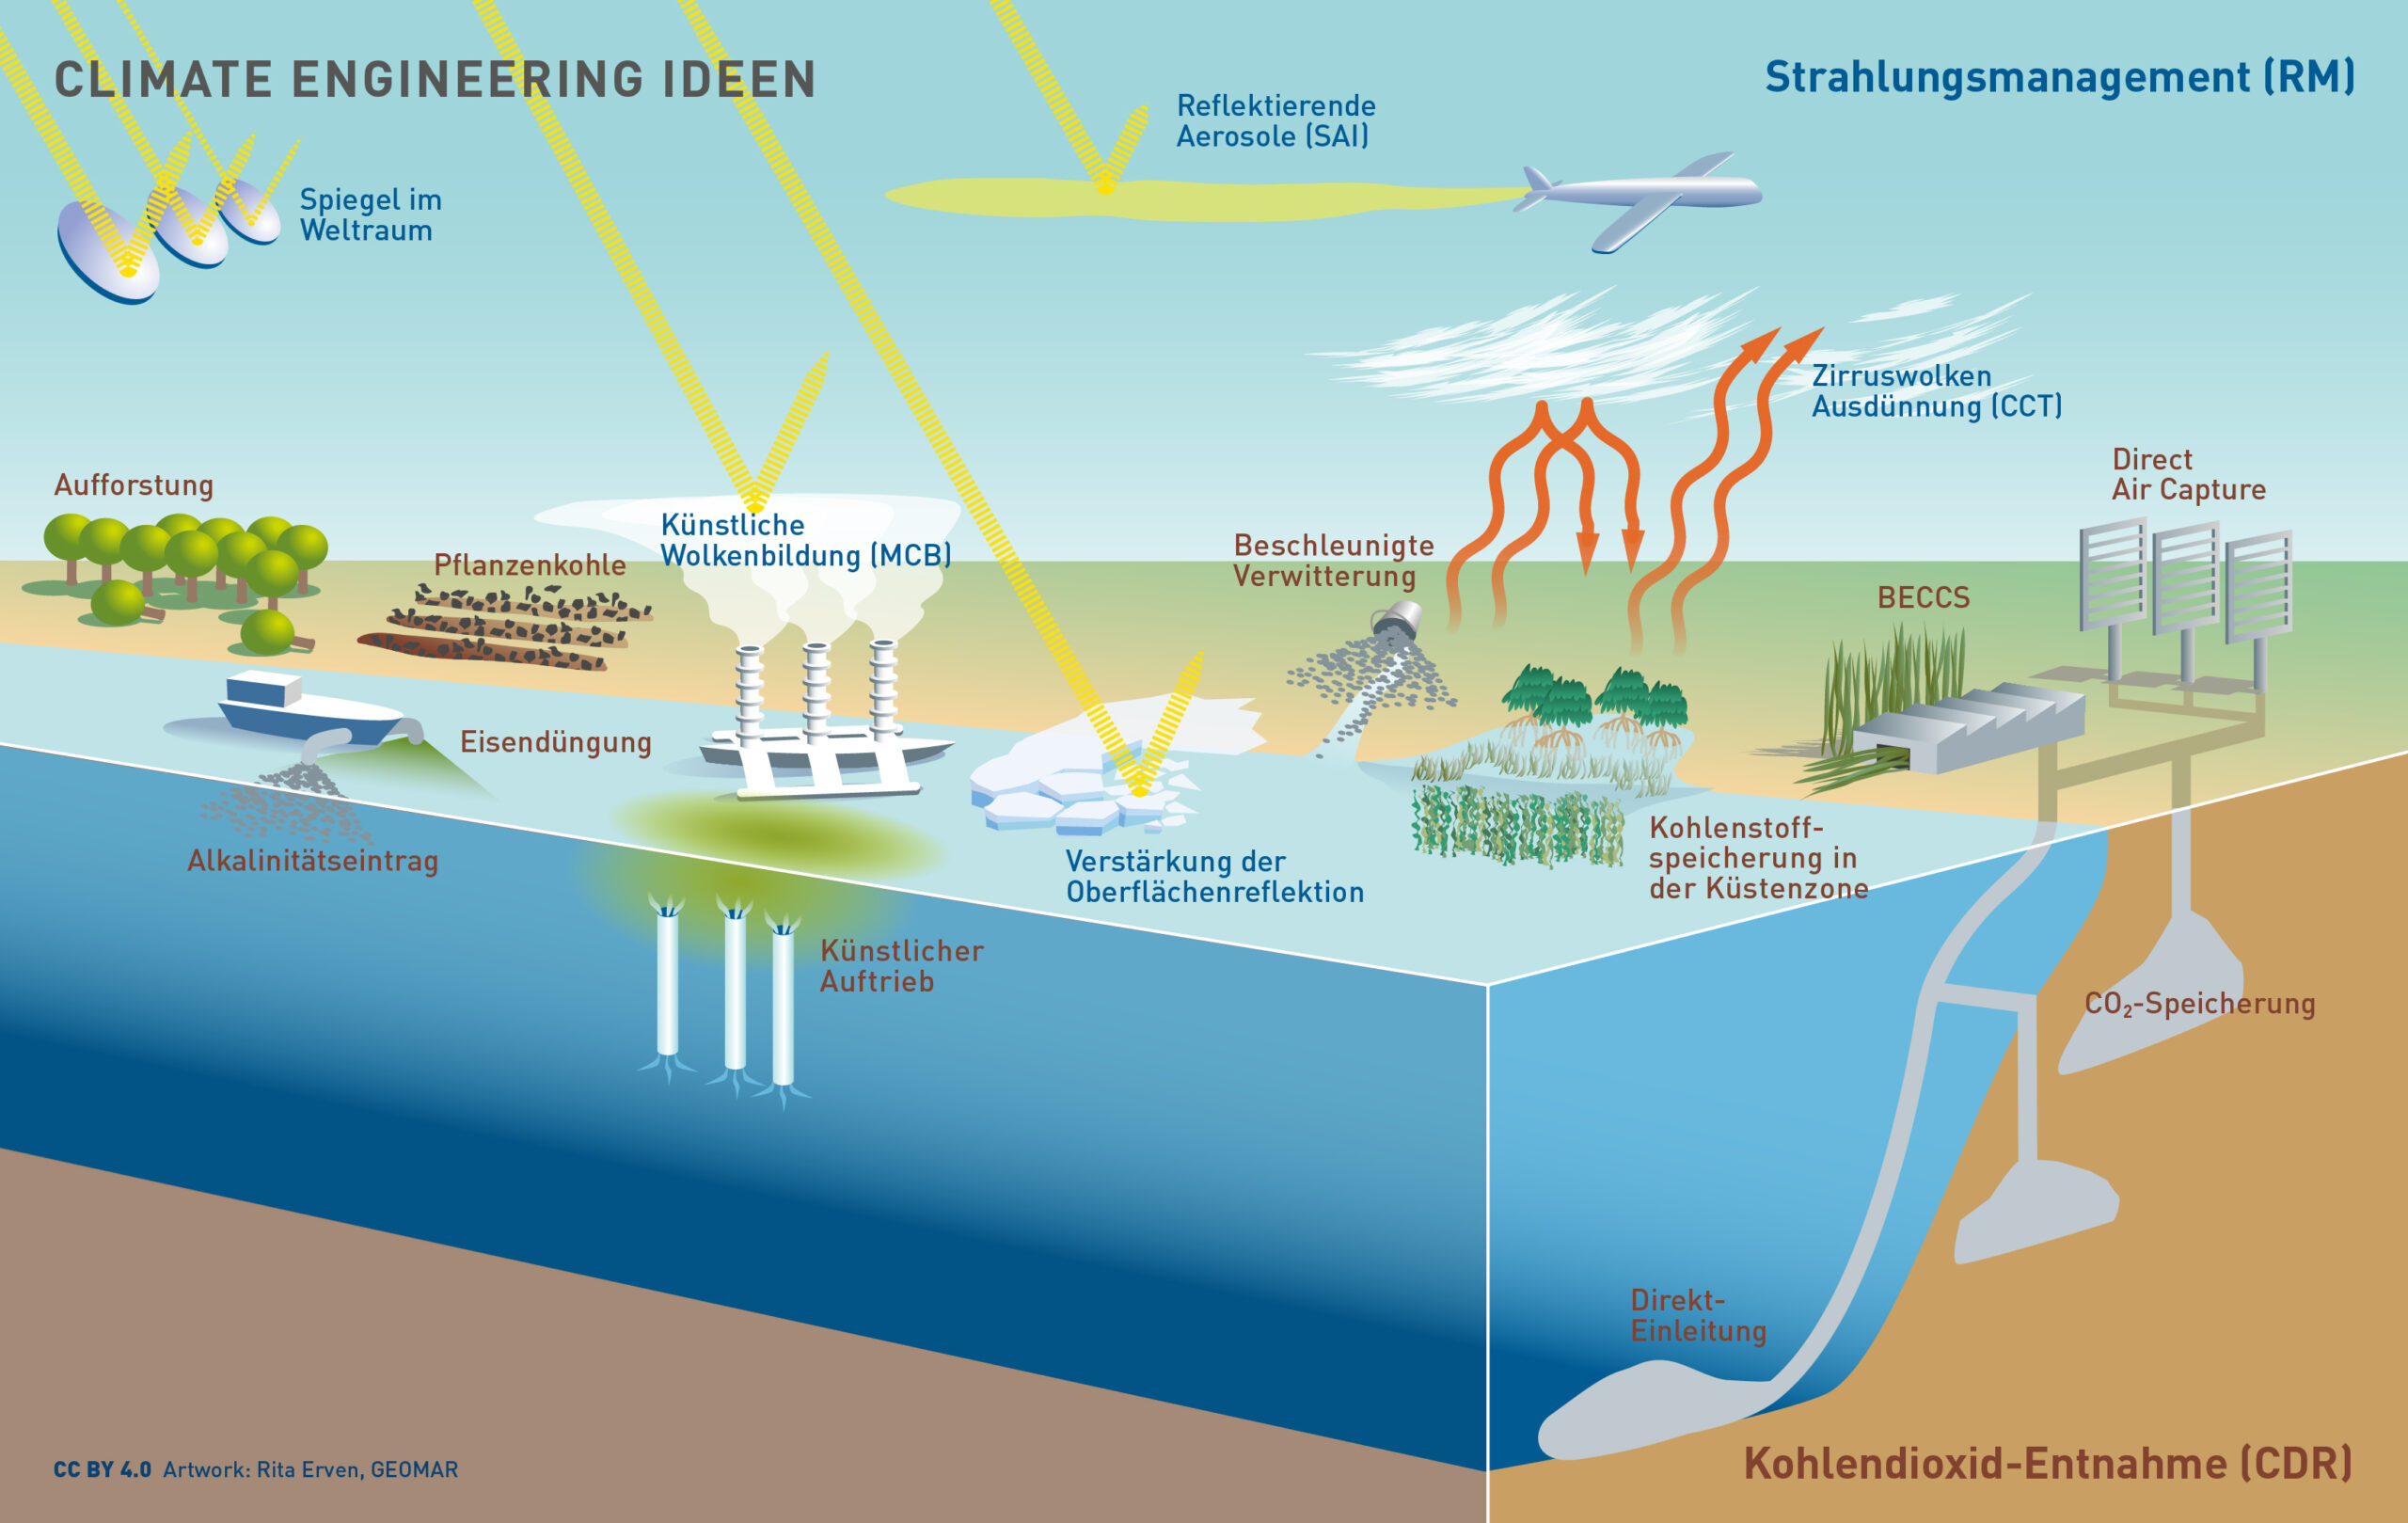
| 19:11, 20. Dez. 2022 | CE CDR und RM.jpg (Datei) |  |
422 KB | Dieter Kasang (Diskussion | Beiträge) | == Beschreibung == Strahlungsmanagement und Kohlendioxid-Entnahme == Lizenzhinweis == {| style="border:1px solid #8888aa; background-color:#f7f8ff;padding:5px;font-size:95%;" |Quelle: Carbone Dioxide Removal: Media und Informationen https://carbondioxide-removal.eu/materialien/ Lizenz: [http://creativecommons.org/licenses/by/4.0/ CC BY 4.0] |} | 1 |
| 19:33, 1. Dez. 2022 | CO2 mitigation curves 2° dt.jpg (Datei) |  |
315 KB | Dieter Kasang (Diskussion | Beiträge) | == Beschreibung == CO2-Reduktionspfade zur Erreichung des 2-Grad-Ziels, übersetzt ==Lizenzhinweis== {| style="border:1px solid #8888aa; background-color:#f7f8ff;padding:5px;font-size:95%;" | Quelle: Andrew, R. (2020): It's getting harder and harder to limit ourselves to 2°C, https://folk.universitetetioslo.no/roberan/t/global_mitigation_curves.shtml<br> Lizenz: [http://creativecommons.org/licenses/by/4.0/ CC BY] @robbie_andrew |} | 1 |
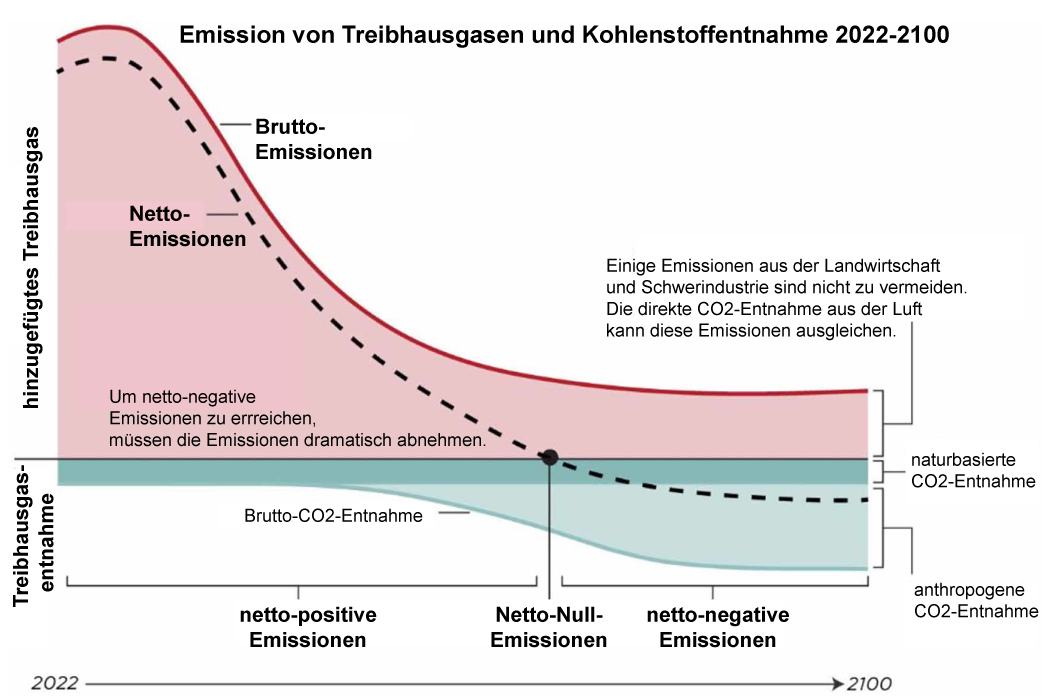
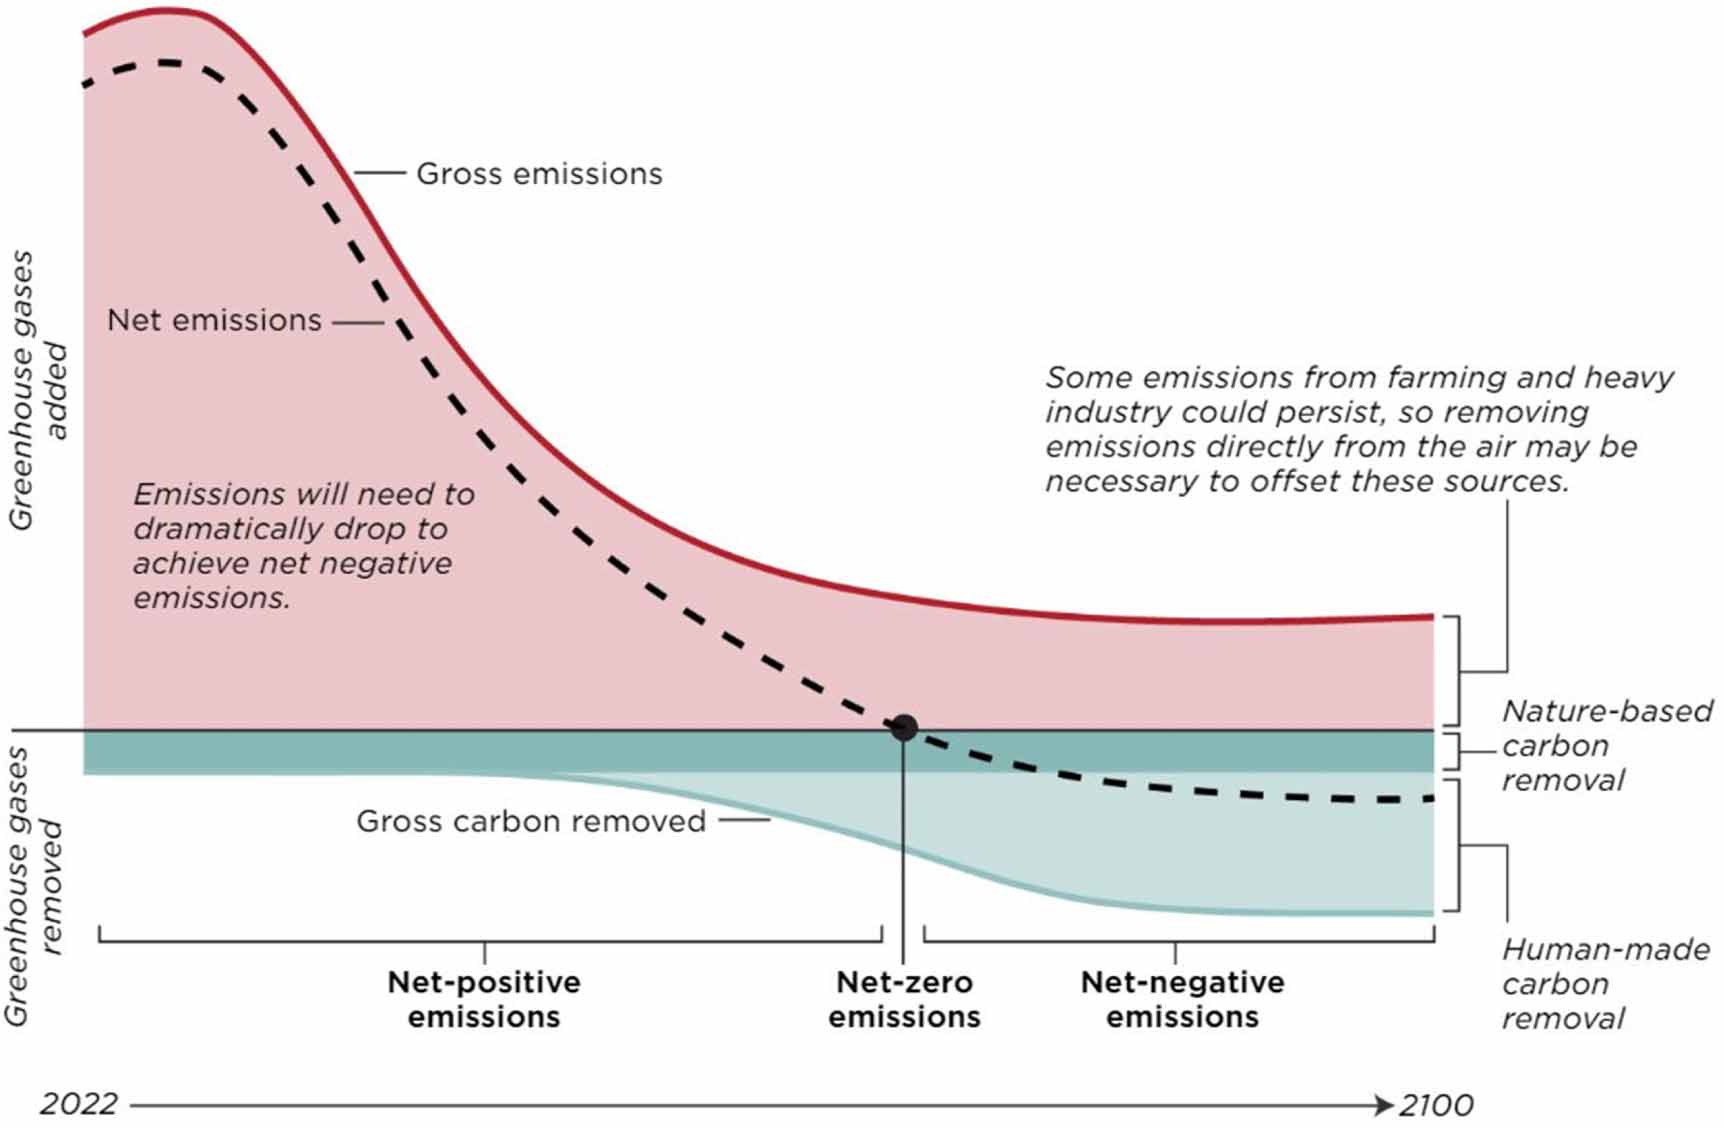
| 19:15, 1. Dez. 2022 | Netto null emissionen.jpg (Datei) |  |
98 KB | Dieter Kasang (Diskussion | Beiträge) | == Beschreibung == Emissionen von Treibhausgasen und Kohlenstoffentnahme 2022-2100 ==Lizenzhinweis== {| style="border:1px solid #8888aa; background-color:#f7f8ff;padding:5px;font-size:95%;" | Quelle: Sovacool, B.K., C.M. Baum, S. Low, C. Roberts & J. Steinhauser (2022): Climate policy for a net-zero future: ten recommendations for Direct Air Capture, Environ. Res. Lett. 17 074014 DOI 10.1088/1748-9326/ac77a4<br> Lizenz: CC BY http://creativecommons.org/licenses/by/4.0/ |} | 1 |
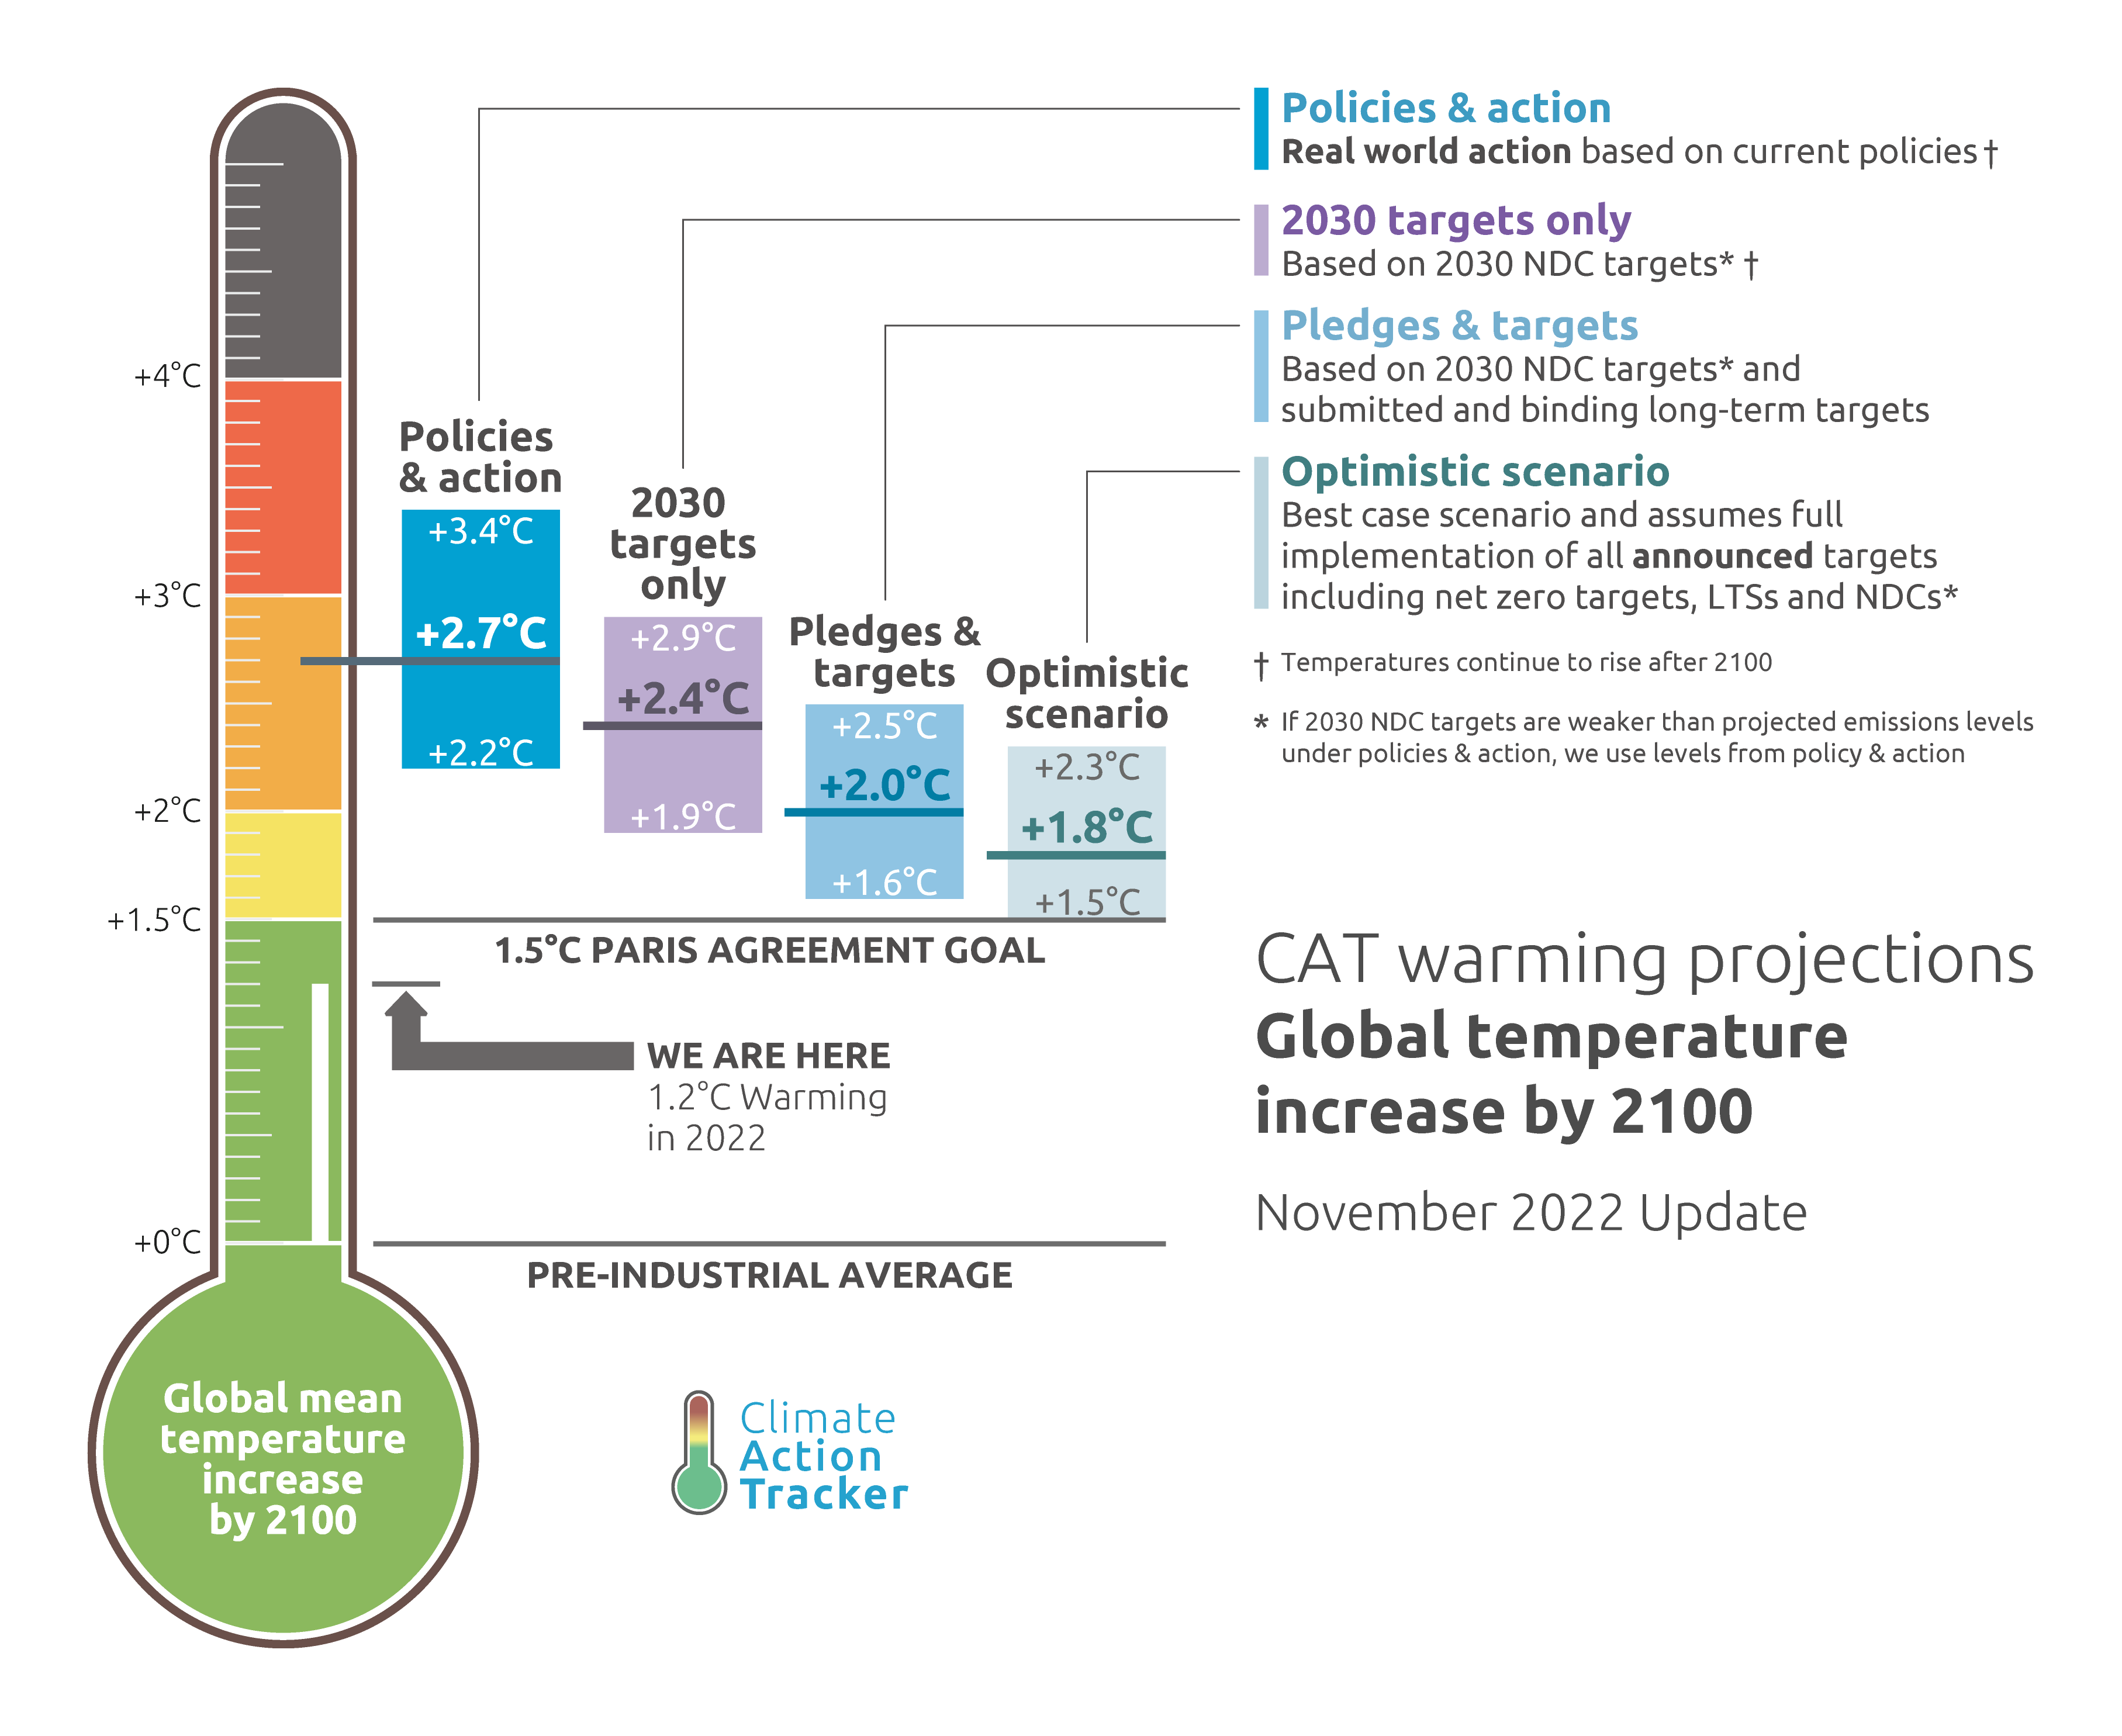
| 12:44, 30. Nov. 2022 | CAT-Thermometer2100.png (Datei) |  |
234 KB | Dieter Kasang (Diskussion | Beiträge) | 3 |