Dateiliste
Aus Klimawandel
Diese Spezialseite listet alle hochgeladenen Dateien auf.
| Datum | Name | Vorschaubild | Größe | Benutzer | Beschreibung | Versionen |
|---|---|---|---|---|---|---|
| 10:28, 4. Feb. 2023 | Glacier MB regions 1950-2021.jpg (Datei) |  |
120 KB | Dieter Kasang (Diskussion | Beiträge) | 3 | |
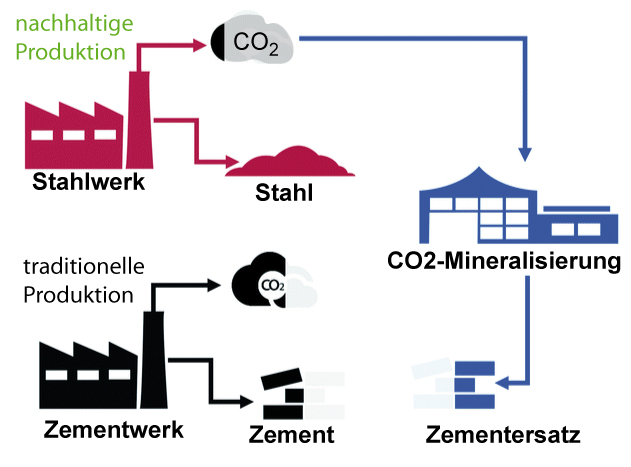
| 20:00, 3. Feb. 2023 | CO2 Mineralisierung.jpg (Datei) |  |
96 KB | Dieter Kasang (Diskussion | Beiträge) | 2 | |
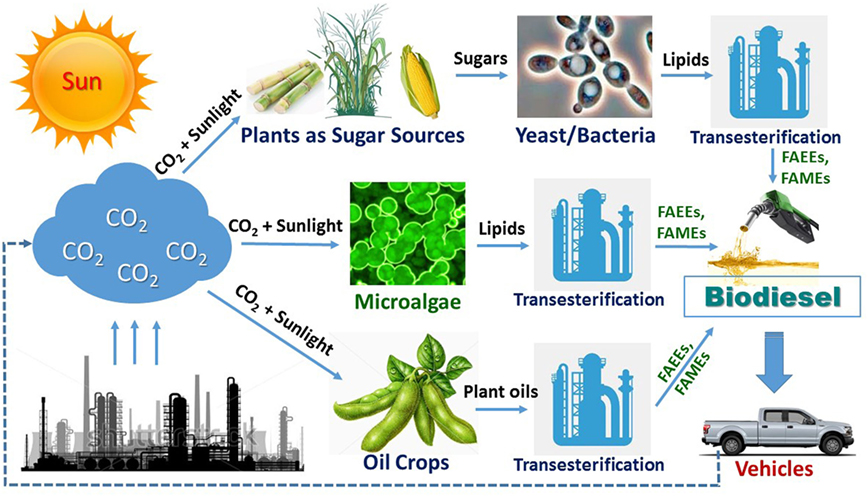
| 19:37, 3. Feb. 2023 | Microalgae biodiesel production.jpg (Datei) |  |
329 KB | Dieter Kasang (Diskussion | Beiträge) | == Beschreibung == Biologische Produktion von Biodiesel mit CO2 == Lizenzhinweis == {| style="border:1px solid #8888aa; background-color:#f7f8ff;padding:5px;font-size:95%;" |Quelle: Xie D (2017) Integrating Cellular and Bioprocess Engineering in the Non-Conventional Yeast Yarrowia lipolytica for Biodiesel Production: A Review. Front. Bioeng. Biotechnol. 5:65. doi: 10.3389/fbioe.2017.00065 https://www.frontiersin.org/articles/10.3389/fbioe.2017.00065/full <br> Lizenz: [https://creativecommons.o… | 1 |
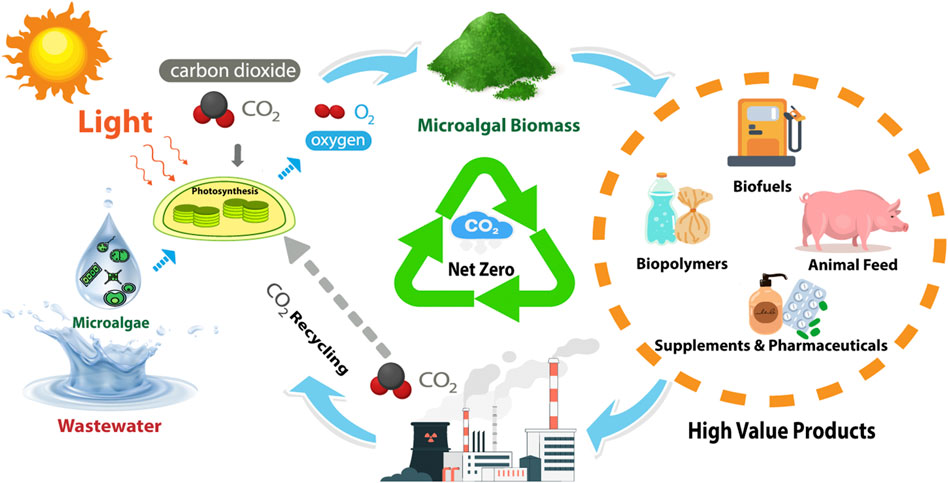
| 19:21, 3. Feb. 2023 | CO2 und Mikroalgen.jpg (Datei) |  |
83 KB | Dieter Kasang (Diskussion | Beiträge) | == Beschreibung == Produkte aus Abwasser, Mikroalgen und CO2 == Lizenzhinweis == {| style="border:1px solid #8888aa; background-color:#f7f8ff;padding:5px;font-size:95%;" |Quelle: Srimongkol P, Sangtanoo P, Songserm P, Watsuntorn W and Karnchanatat A (2022) Microalgae-based wastewater treatment for developing economic and environmental sustainability: Current status and future prospects. Front. Bioeng. Biotechnol. 10:904046. doi: 10.3389/fbioe.2022.904046 https://www.frontiersin.org/articles/10.… | 1 |
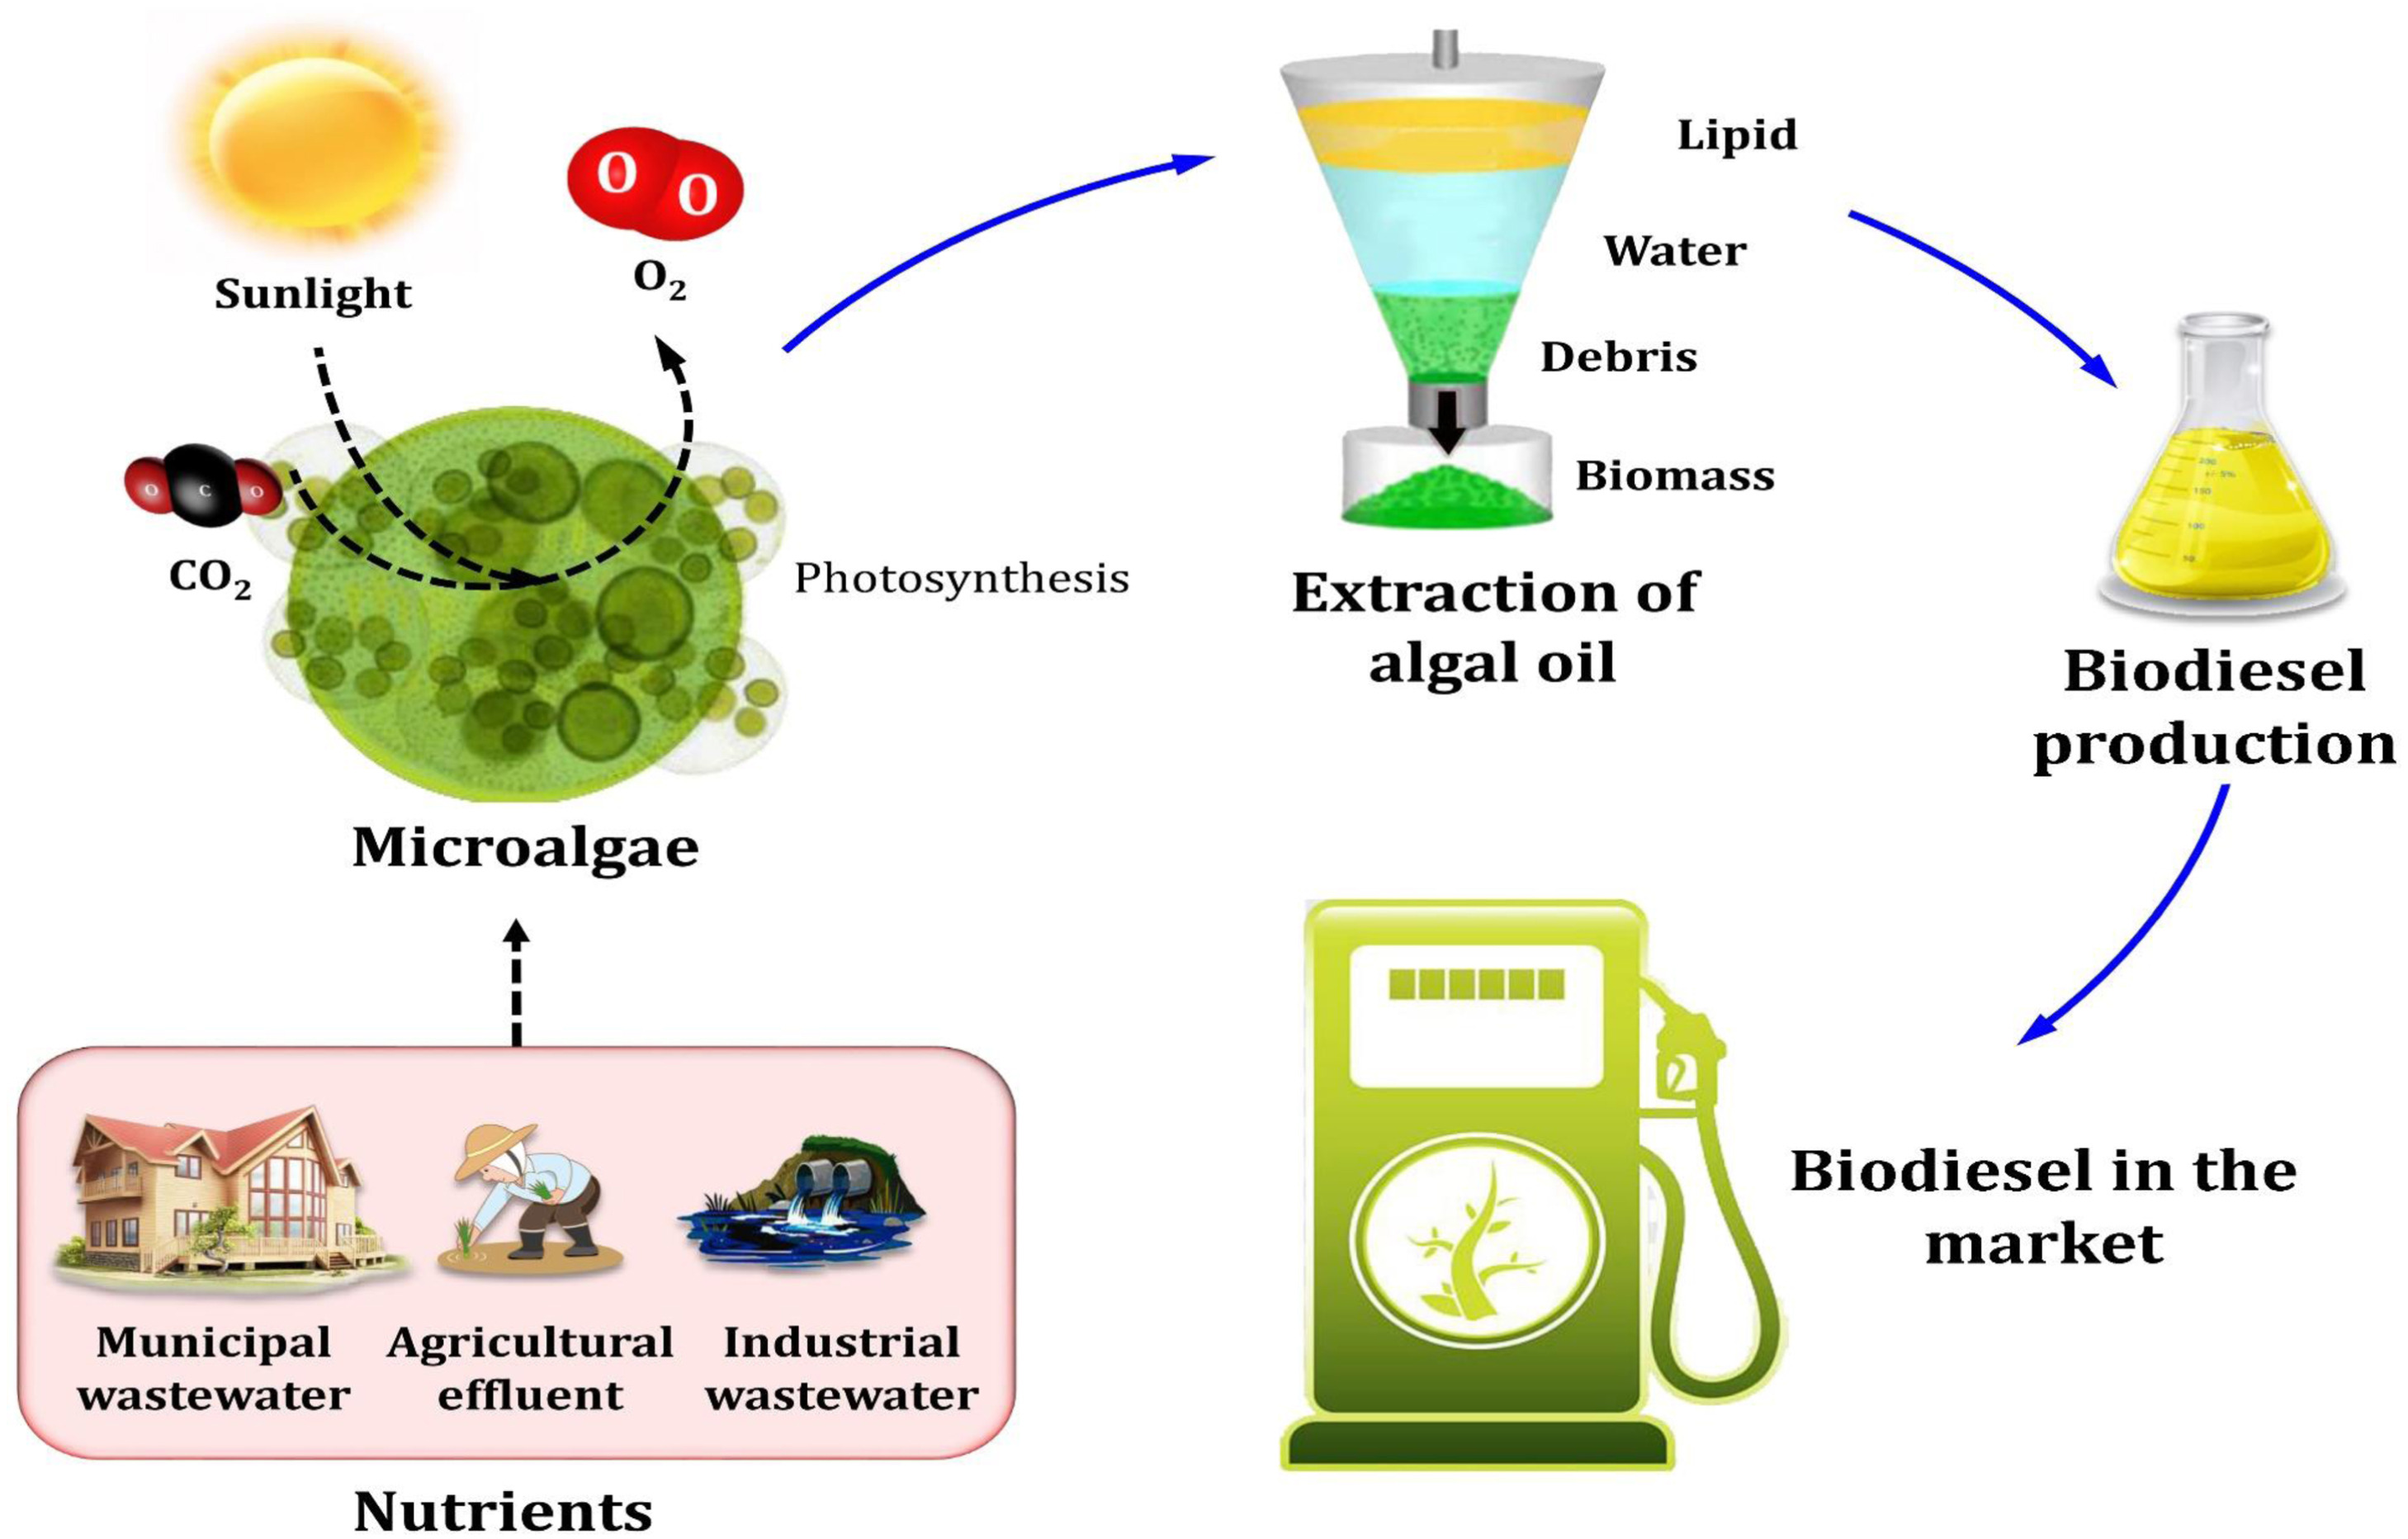
| 19:13, 3. Feb. 2023 | Biodiesel from microalgae.jpg (Datei) |  |
528 KB | Dieter Kasang (Diskussion | Beiträge) | == Beschreibung == Biodiesel aus der Biomasse von Mikroalgen == Lizenzhinweis == {| style="border:1px solid #8888aa; background-color:#f7f8ff;padding:5px;font-size:95%;" |Quelle: Ali, S.S., S.G. Mastropetros, M. Schagerl et al. (2022): Recent advances in wastewater microalgae-based biofuels production: A state-of-the-art review, Energy Reports 8, 13253-13280, https://www.sciencedirect.com/science/article/pii/S2352484722018674 <br> Lizenz: CC BY-NC-ND, https://creativecommons.org/licenses/by-nc-… | 1 |
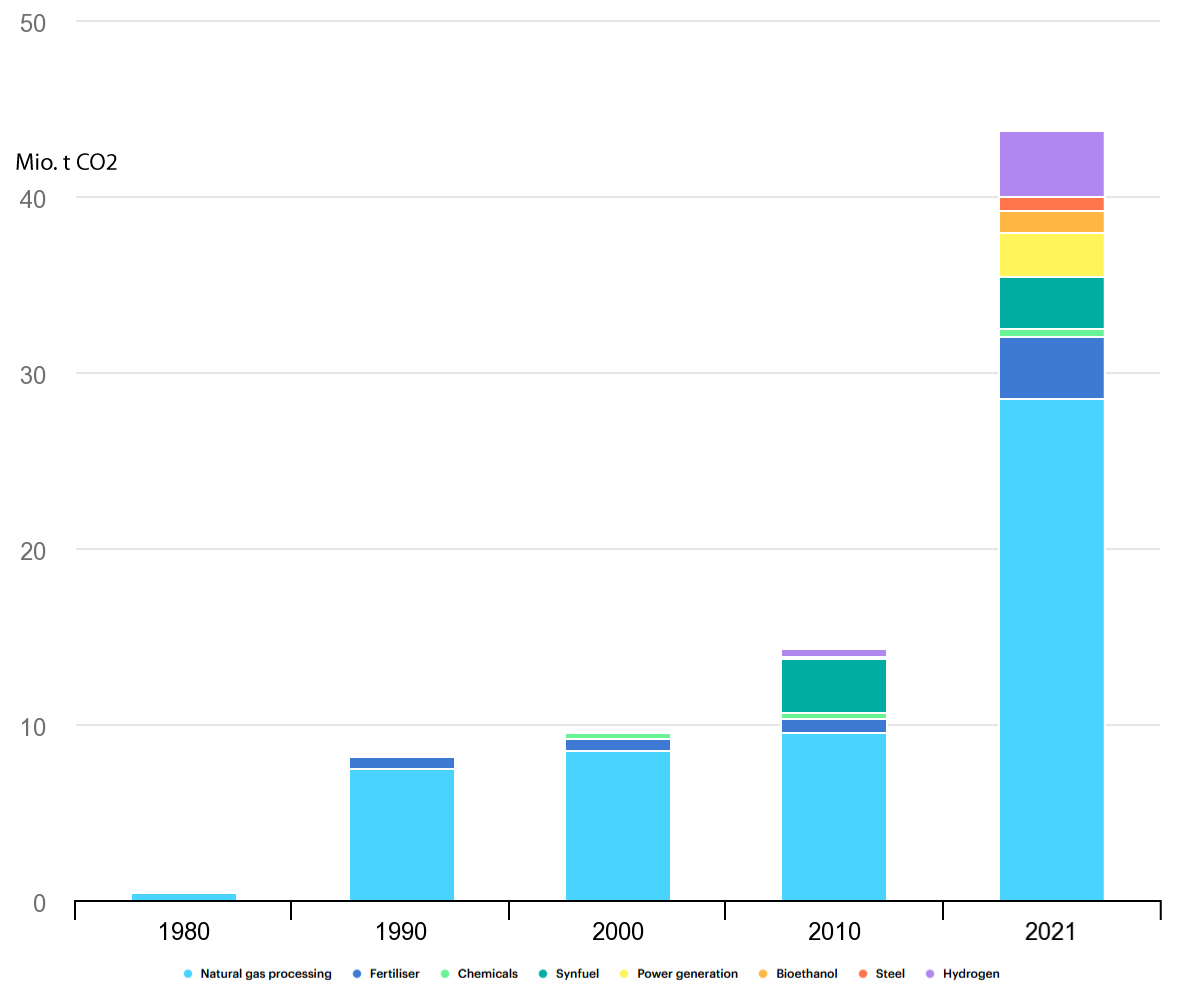
| 19:05, 3. Feb. 2023 | Ccus-facilities-1980-2021.png (Datei) |  |
48 KB | Dieter Kasang (Diskussion | Beiträge) | 2 | |
| 16:43, 3. Feb. 2023 | CO2 separation utilisation.gif (Datei) |  |
244 KB | Dieter Kasang (Diskussion | Beiträge) | 2 | |
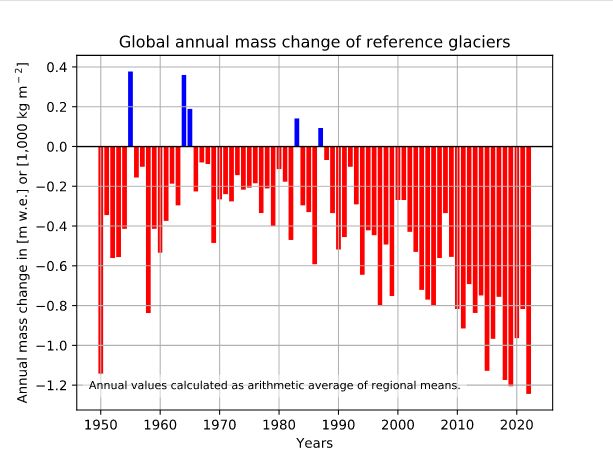
| 19:20, 1. Feb. 2023 | Global glaciers mass-change-2050-2022.jpg (Datei) |  |
43 KB | Dieter Kasang (Diskussion | Beiträge) | == Beschreibung == Jährliche globale Massenbilanz von [https://wgms.ch/products_ref_glaciers/ Referenzgletschern] mit mindestens 30 Jahren Gletscherbeobachtung in verschiedenen Gletscherregionen der Erde 1950-2021/22 in m Wasseräquivalent bzw, 1000 kg/m2. ==Lizenzhinweis== {| style="border:1px solid #8888aa; background-color:#f7f8ff;padding:5px;font-size:95%;" | Quelle: WGMS, World Glacier Monitoring Service (2023): [https://wgms.ch/global-glacier-state/ global glacier state]<br> Lizenz: [http… | 1 |
| 11:43, 1. Feb. 2023 | Glaciers-mass-balance-rate.jpg (Datei) |  |
220 KB | Dieter Kasang (Diskussion | Beiträge) | == Beschreibung == Globale Gletscher-Gebiete (dunkelblau). Hellblaue Kreise zeigen die Größe der Gletscherfläche in den Regionen an. Die Ziffern geben den jährlichen Massenverlust der Gletscherregionen zwischen 2000 und 2019 in Gt pro Jahr an. ==Lizenzhinweis== {| style="border:1px solid #8888aa; background-color:#f7f8ff;padding:5px;font-size:95%;" | Quelle: Marzeion, B., R. Hock, B. Anderson, A. Bliss et al. (2020): Partitioning the uncertainty of ensemble projections of global glacier mass ch… | 1 |
| 16:44, 31. Jan. 2023 | Global glaciers mass-change-2000-2019.jpg (Datei) |  |
418 KB | Dieter Kasang (Diskussion | Beiträge) | Globale Gletscher-Gebiete (dunkelblau). Hellblaue Kreise zeigen die Größe der Gletscherfläche in den Regionen an. ==Lizenzhinweis== {| style="border:1px solid #8888aa; background-color:#f7f8ff;padding:5px;font-size:95%;" | Quelle: Hock, R., A. Bliss, B. Marzeion, et al., 2019: GlacierMIP - A model intercomparison of global-scale glacier mass-balance models and projections. Journal of Glaciology, 1, 1-15, doi:10.1017/jog.2019.22.<br> Lizenz: [http://creativecommons.org/licenses/by/4.0/ CC BY 4.0… | 1 |
| 18:57, 27. Jan. 2023 | Temp land ocean1880-present.png (Datei) |  |
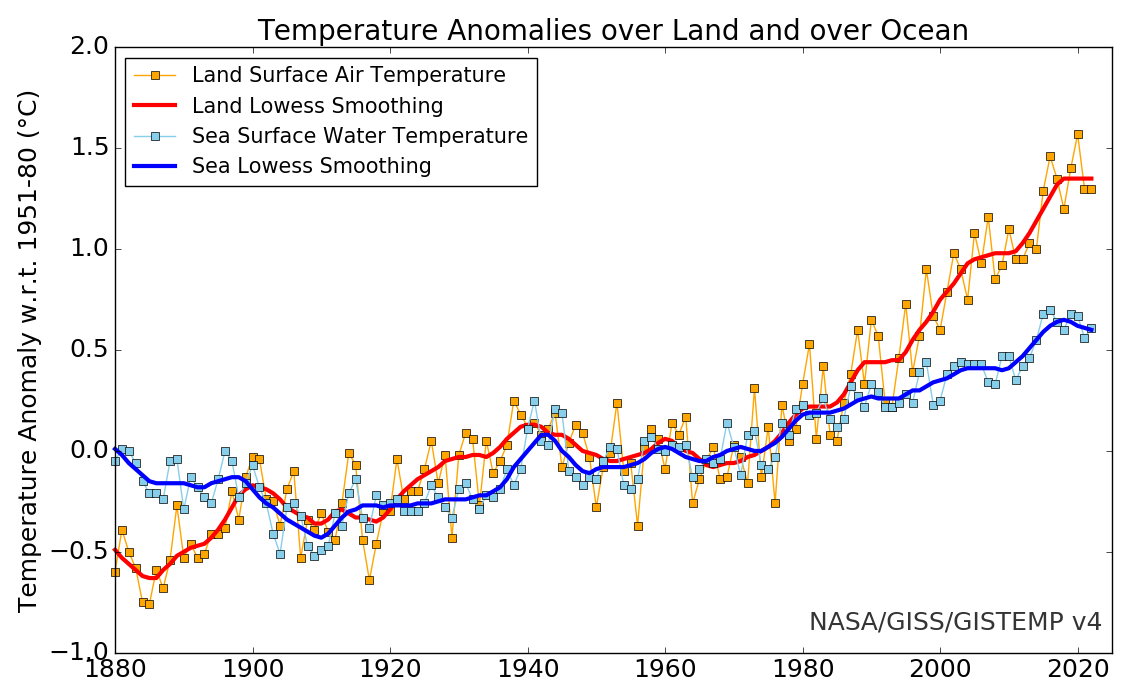
133 KB | Dieter Kasang (Diskussion | Beiträge) | Veränderung der globalen Oberflächentemperatur über dem Land (rot) und der Meeresoberflächentemperatur (blau) 1880-2022 im Vergleich zur Basis 1951-1980. ==Lizenzhinweis== {| style="border:1px solid #8888aa; background-color:#f7f8ff;padding:5px;font-size:95%;" | Quelle: NASA (2023): [https://data.giss.nasa.gov/gistemp/graphs_v4/ GISS Surface Temperature Analysis (v4)] <br> Lizenz: public domain |} | 1 |
| 17:44, 25. Jan. 2023 | Chemical products.jpg (Datei) |  |
157 KB | Dieter Kasang (Diskussion | Beiträge) | == Beschreibung == Wir leben in einer Welt voller chemischer Produkte. == Lizenzhinweis == {| style="border:1px solid #8888aa; background-color:#f7f8ff;padding:5px;font-size:95%;" |Quelle: IEA (2018): The Future of Petrochemicals. https://www.iea.org/reports/the-future-of-petrochemicals <br> Lizenz: [https://www.iea.org/terms/creative-commons-cc-licenses CC BY 4.0] | 1 |
| 15:06, 13. Jan. 2023 | Africa-prec-aug-dec.jpg (Datei) |  |
157 KB | Dieter Kasang (Diskussion | Beiträge) | == Beschreibung == Änderung der Sommertage in Afrika 1980 bis 2018 in Tage pro Jahrzehnt ==Lizenzhinweis== {| style="border:1px solid #8888aa; background-color:#f7f8ff;padding:5px;font-size:95%;" | Quelle: Alahacoon, N., M. Edirisinghe, M. Simwanda, E. Perera, V.R. Nyirenda, M. Ranagalage (2022): Rainfall Variability and Trends over the African Continent Using TAMSAT Data (1983–2020): Towards Climate Change Resilience and Adaptation. Remote Sens. 2022, 14, 96. https://doi.org/10.3390/rs14010096… | 1 |
| 07:20, 3. Jan. 2023 | D temp 1881-2020.png (Datei) |  |
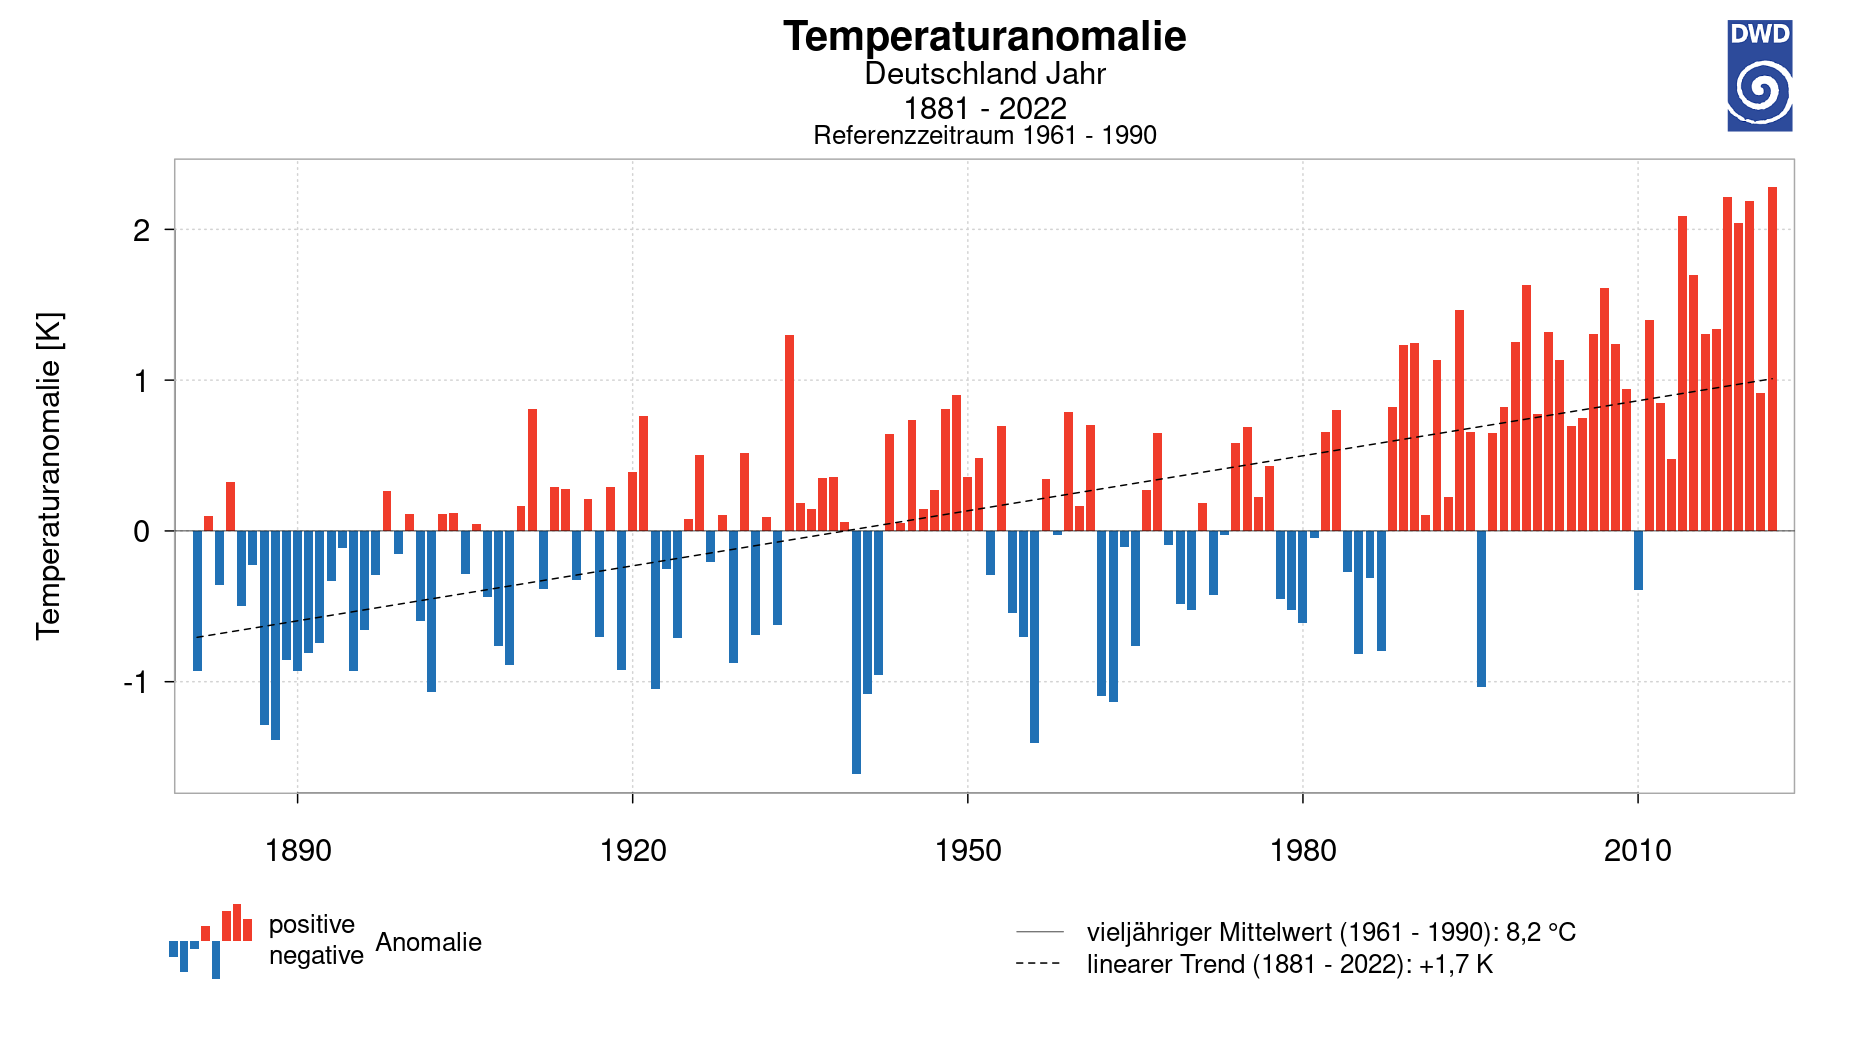
93 KB | Anja (Diskussion | Beiträge) | bis 2022 | 2 |
| 10:48, 26. Dez. 2022 | THG-Emissionen-CO2-Entnahme-2100.jpg (Datei) |  |
182 KB | Dieter Kasang (Diskussion | Beiträge) | 3 | |
| 10:36, 22. Dez. 2022 | Hochgebirge dt.jpg (Datei) |  |
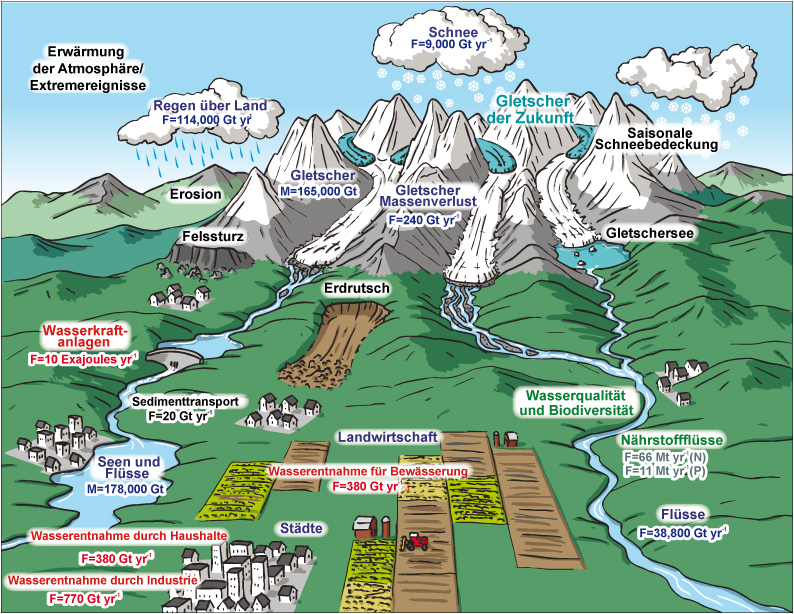
472 KB | Dieter Kasang (Diskussion | Beiträge) | Schematische Darstellung von Hochgebirgsregionen und ihrer Beziehung zum Umland. M: Masse in Gt, F: Massenflüsse in Gigatonnen (Gt) pro Jahr == Lizenzhinweis == {| style="border:1px solid #8888aa; background-color:#f7f8ff;padding:5px;font-size:95%;" | Quelle: Huss, M., B. Bookhagen, C. Huggel, D. Jacobsen et al. (2017): [https://doi.org/10.1002/2016ef000514 Toward mountains without permanent snow and ice]. Earth’s Future 5:418–435; übersetzt Lizenz: [https://creativecommons.org/licenses/by-nc-… | 1 |
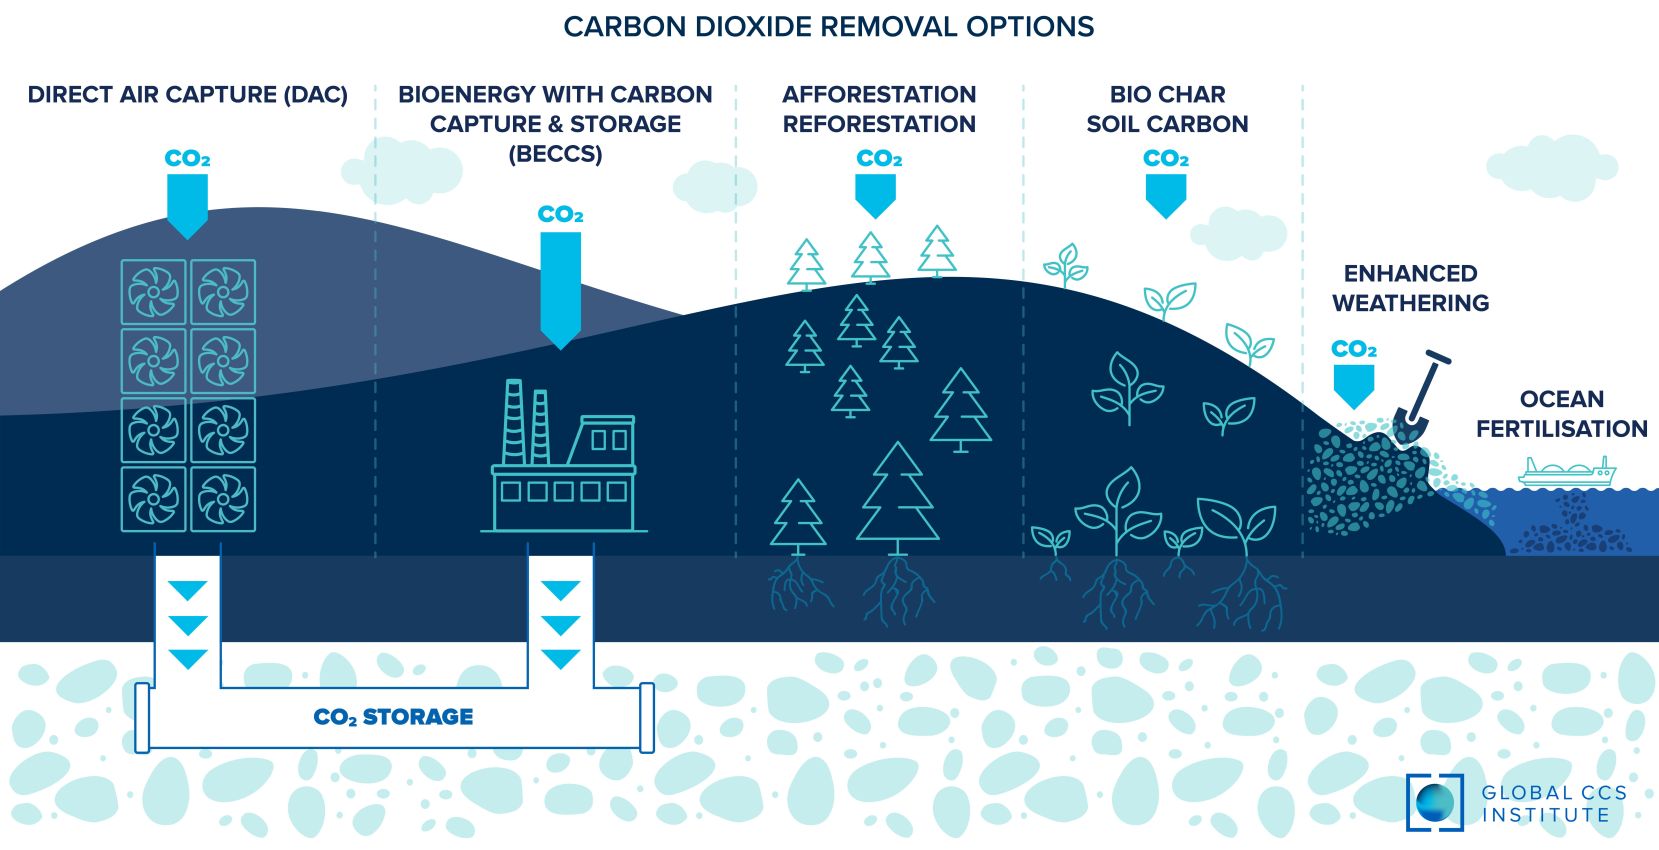
| 19:59, 20. Dez. 2022 | Carbon-removal-approaches sm.jpg (Datei) |  |
160 KB | Dieter Kasang (Diskussion | Beiträge) | == Beschreibung == Methoden der CO2-Abscheidung == Lizenzhinweis == {| style="border:1px solid #8888aa; background-color:#f7f8ff;padding:5px;font-size:95%;" |Quelle: Global CCS Institute: Carbon capture and storage images, https://www.globalccsinstitute.com/resources/ccs-image-library/ Lizenz: We encourage you to download these images and use them whenever and wherever appropriate. When using these images, please retain the 'Provided by Global CCS Institute' watermark or credit the Institute… | 1 |
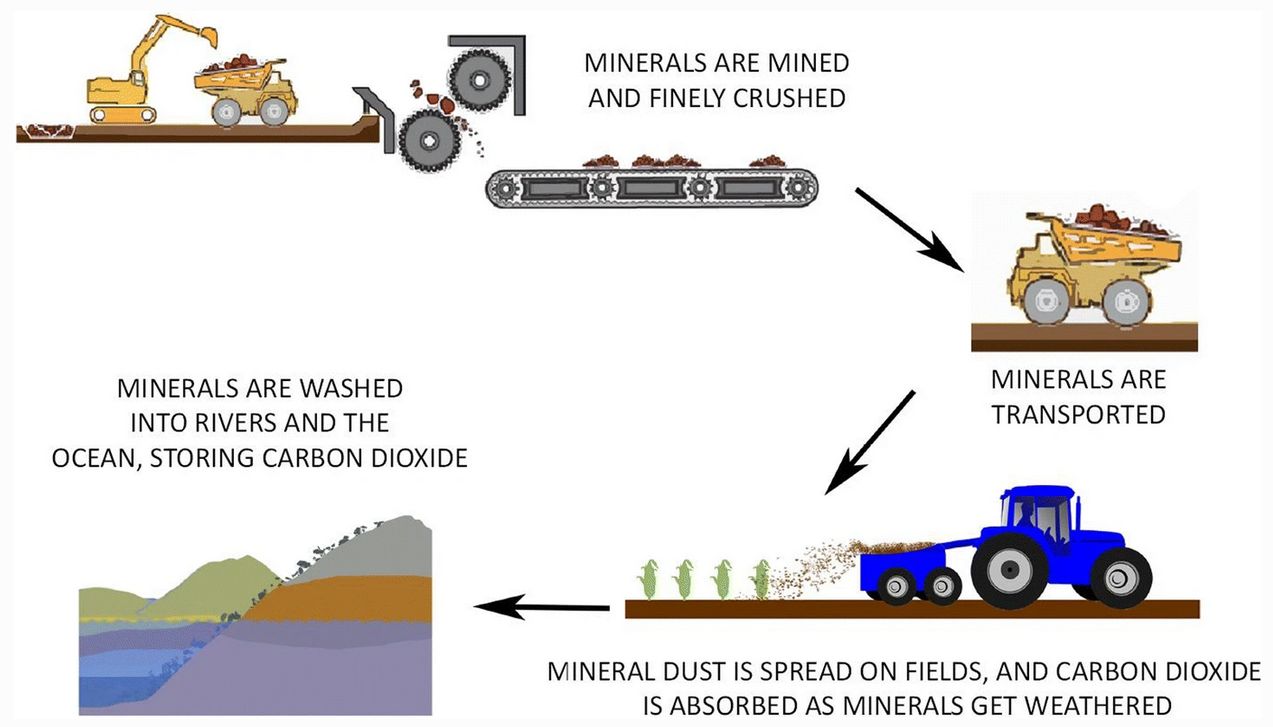
| 19:48, 20. Dez. 2022 | Enhanced Weathering.gif (Datei) |  |
126 KB | Dieter Kasang (Diskussion | Beiträge) | == Beschreibung == Verstärkte Verwitterung 2 == Lizenzhinweis == {| style="border:1px solid #8888aa; background-color:#f7f8ff;padding:5px;font-size:95%;" |Quelle: Chiquier, S., P. Patrizio, M. Bui et al. (2022): A comparative analysis of the efficiency, timing, and permanence of CO2 removal pathways, Energy Environ. Sci. 10, 4389-4403, http://dx.doi.org/10.1039/D2EE01021F <br> Lizenz: [http://creativecommons.org/licenses/by/3.0/ CC BY 3.0] |} | 1 |
| 19:43, 20. Dez. 2022 | Enhanced weathering land.jpg (Datei) |  |
88 KB | Dieter Kasang (Diskussion | Beiträge) | == Beschreibung == Verstärkte Verwitterung == Lizenzhinweis == {| style="border:1px solid #8888aa; background-color:#f7f8ff;padding:5px;font-size:95%;" |Quelle: Spence, E., Cox, E. & Pidgeon, N. Exploring cross-national public support for the use of enhanced weathering as a land-based carbon dioxide removal strategy. Climatic Change 165, 23 (2021). https://doi.org/10.1007/s10584-021-03050-y<br> Lizenz: [http://creativecommons.org/licenses/by/4.0/ CC BY 4.0] |} | 1 |
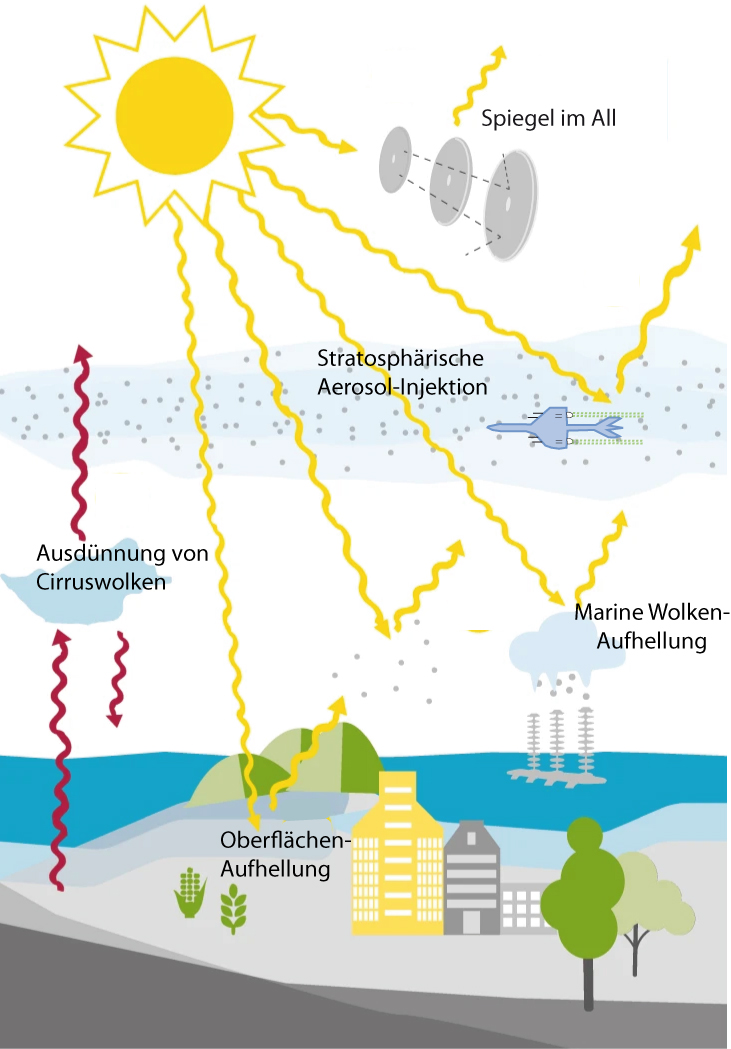
| 19:27, 20. Dez. 2022 | Principle SRM technic.jpg (Datei) |  |
762 KB | Dieter Kasang (Diskussion | Beiträge) | == Beschreibung == Grundlegende SRM-Techniken == Lizenzhinweis == {| style="border:1px solid #8888aa; background-color:#f7f8ff;padding:5px;font-size:95%;" |Quelle: Ming, T., R. de_Richter, W. Liu, S. Caillol (2014): Fighting global warming by climate engineering: Is the Earth radiation management and the solar radiation management any option for fighting climate change?, Renewable and Sustainable Energy Reviews 31, 792-834 https://doi.org/10.1016/j.rser.2013.12.032 <br> Lizenz: [http://creative… | 1 |
| 19:23, 20. Dez. 2022 | RM-Methoden.jpg (Datei) |  |
245 KB | Dieter Kasang (Diskussion | Beiträge) | == Beschreibung == Methoden des Solar Radiation Managements == Lizenzhinweis == {| style="border:1px solid #8888aa; background-color:#f7f8ff;padding:5px;font-size:95%;" |Quelle: Lawrence, M.G., Schäfer, S., Muri, H. et al. (2018): Evaluating climate geoengineering proposals in the context of the Paris Agreement temperature goals. Nat Commun 9, 3734 https://doi.org/10.1038/s41467-018-05938-3<br> Lizenz: [http://creativecommons.org/licenses/by/4.0/ CC BY 4.0] |} | 1 |
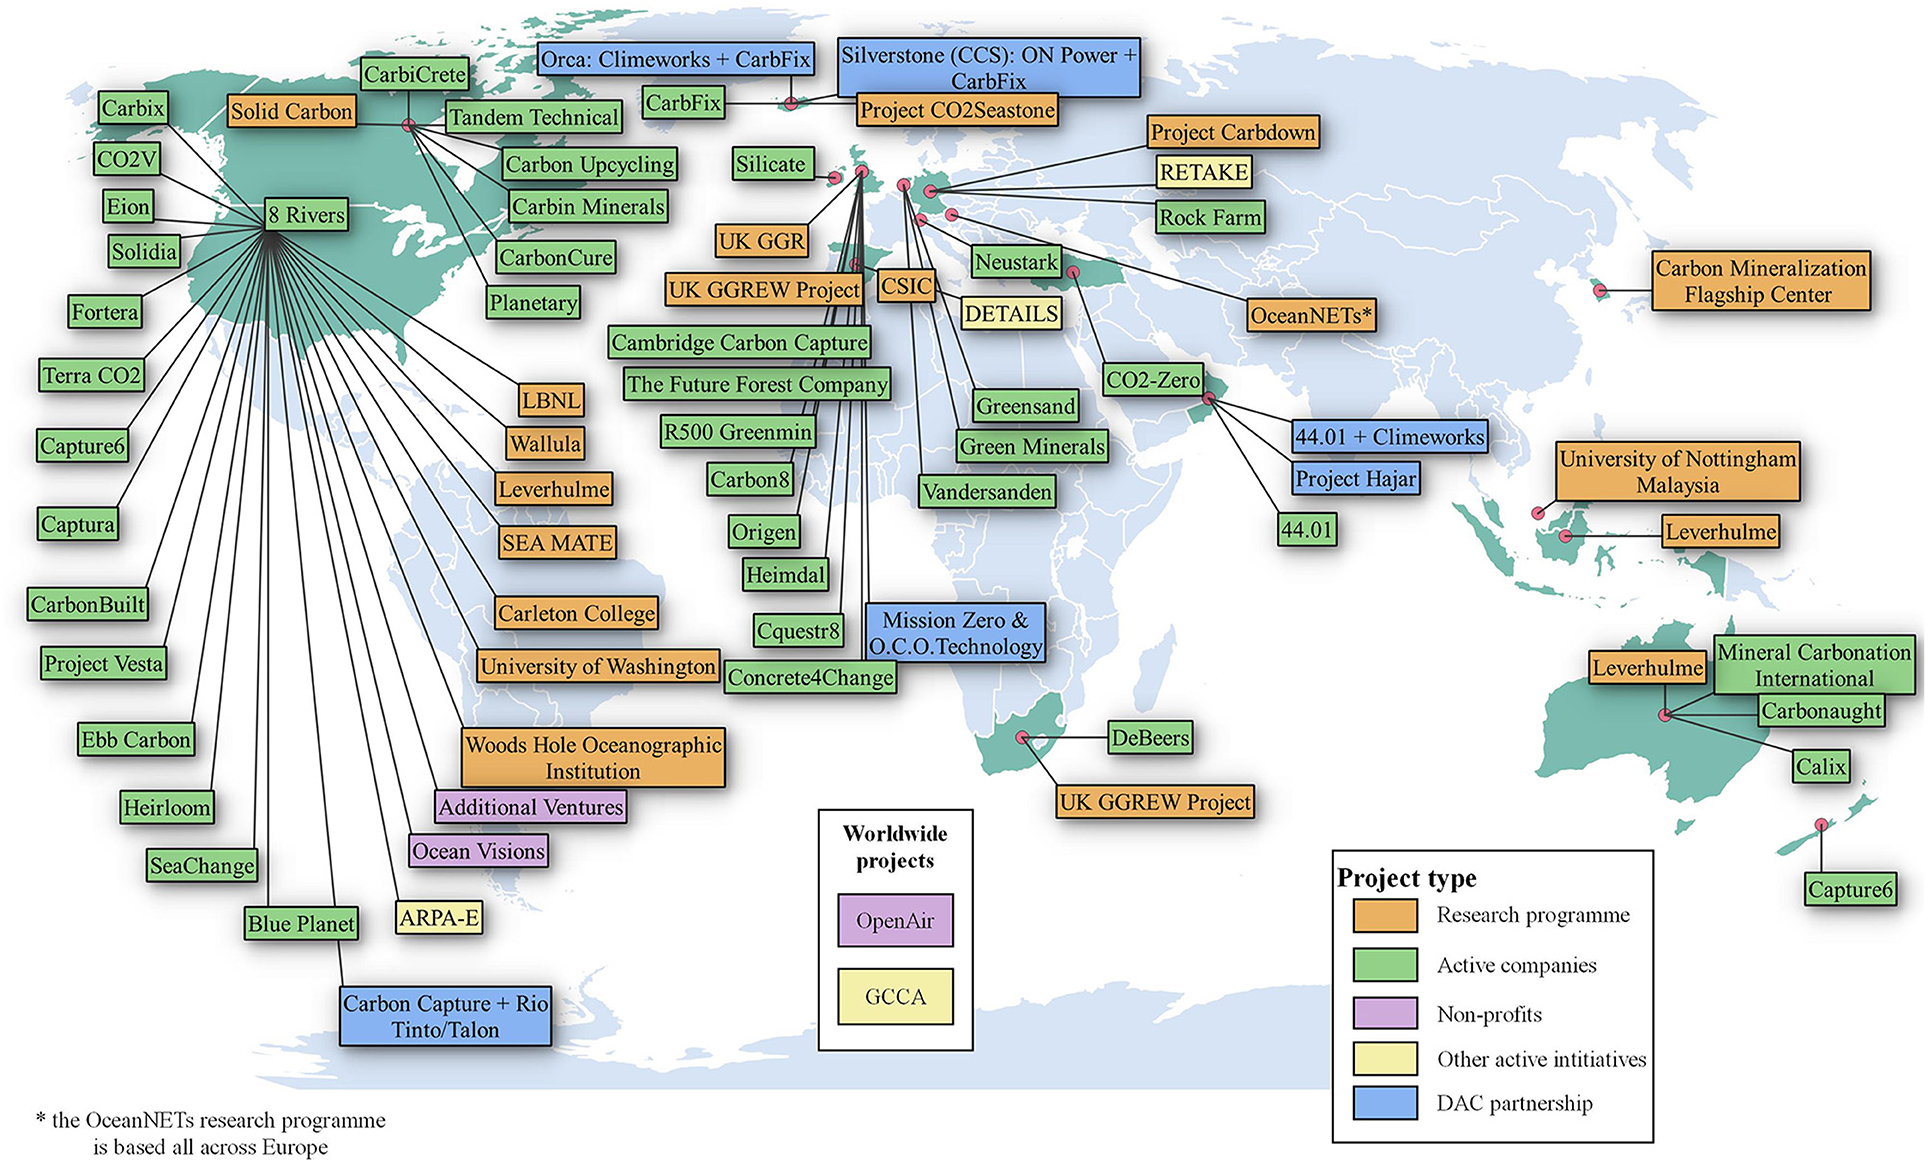
| 19:15, 20. Dez. 2022 | Global map of NET.jpg (Datei) |  |
1,25 MB | Dieter Kasang (Diskussion | Beiträge) | == Beschreibung == Weltkarte über geochemische NET-Firmen, -Projekte, -Initiativen == Lizenzhinweis == {| style="border:1px solid #8888aa; background-color:#f7f8ff;padding:5px;font-size:95%;" |Quelle: Campbell JS, Foteinis S, Furey V, Hawrot O, Pike D, Aeschlimann S, Maesano CN, Reginato PL, Goodwin DR, Looger LL, Boyden ES and Renforth P (2022) Geochemical Negative Emissions Technologies: Part I. Review. Front. Clim. 4:879133. doi: 10.3389/fclim.2022.879133 https://www.frontiersin.org/articles… | 1 |
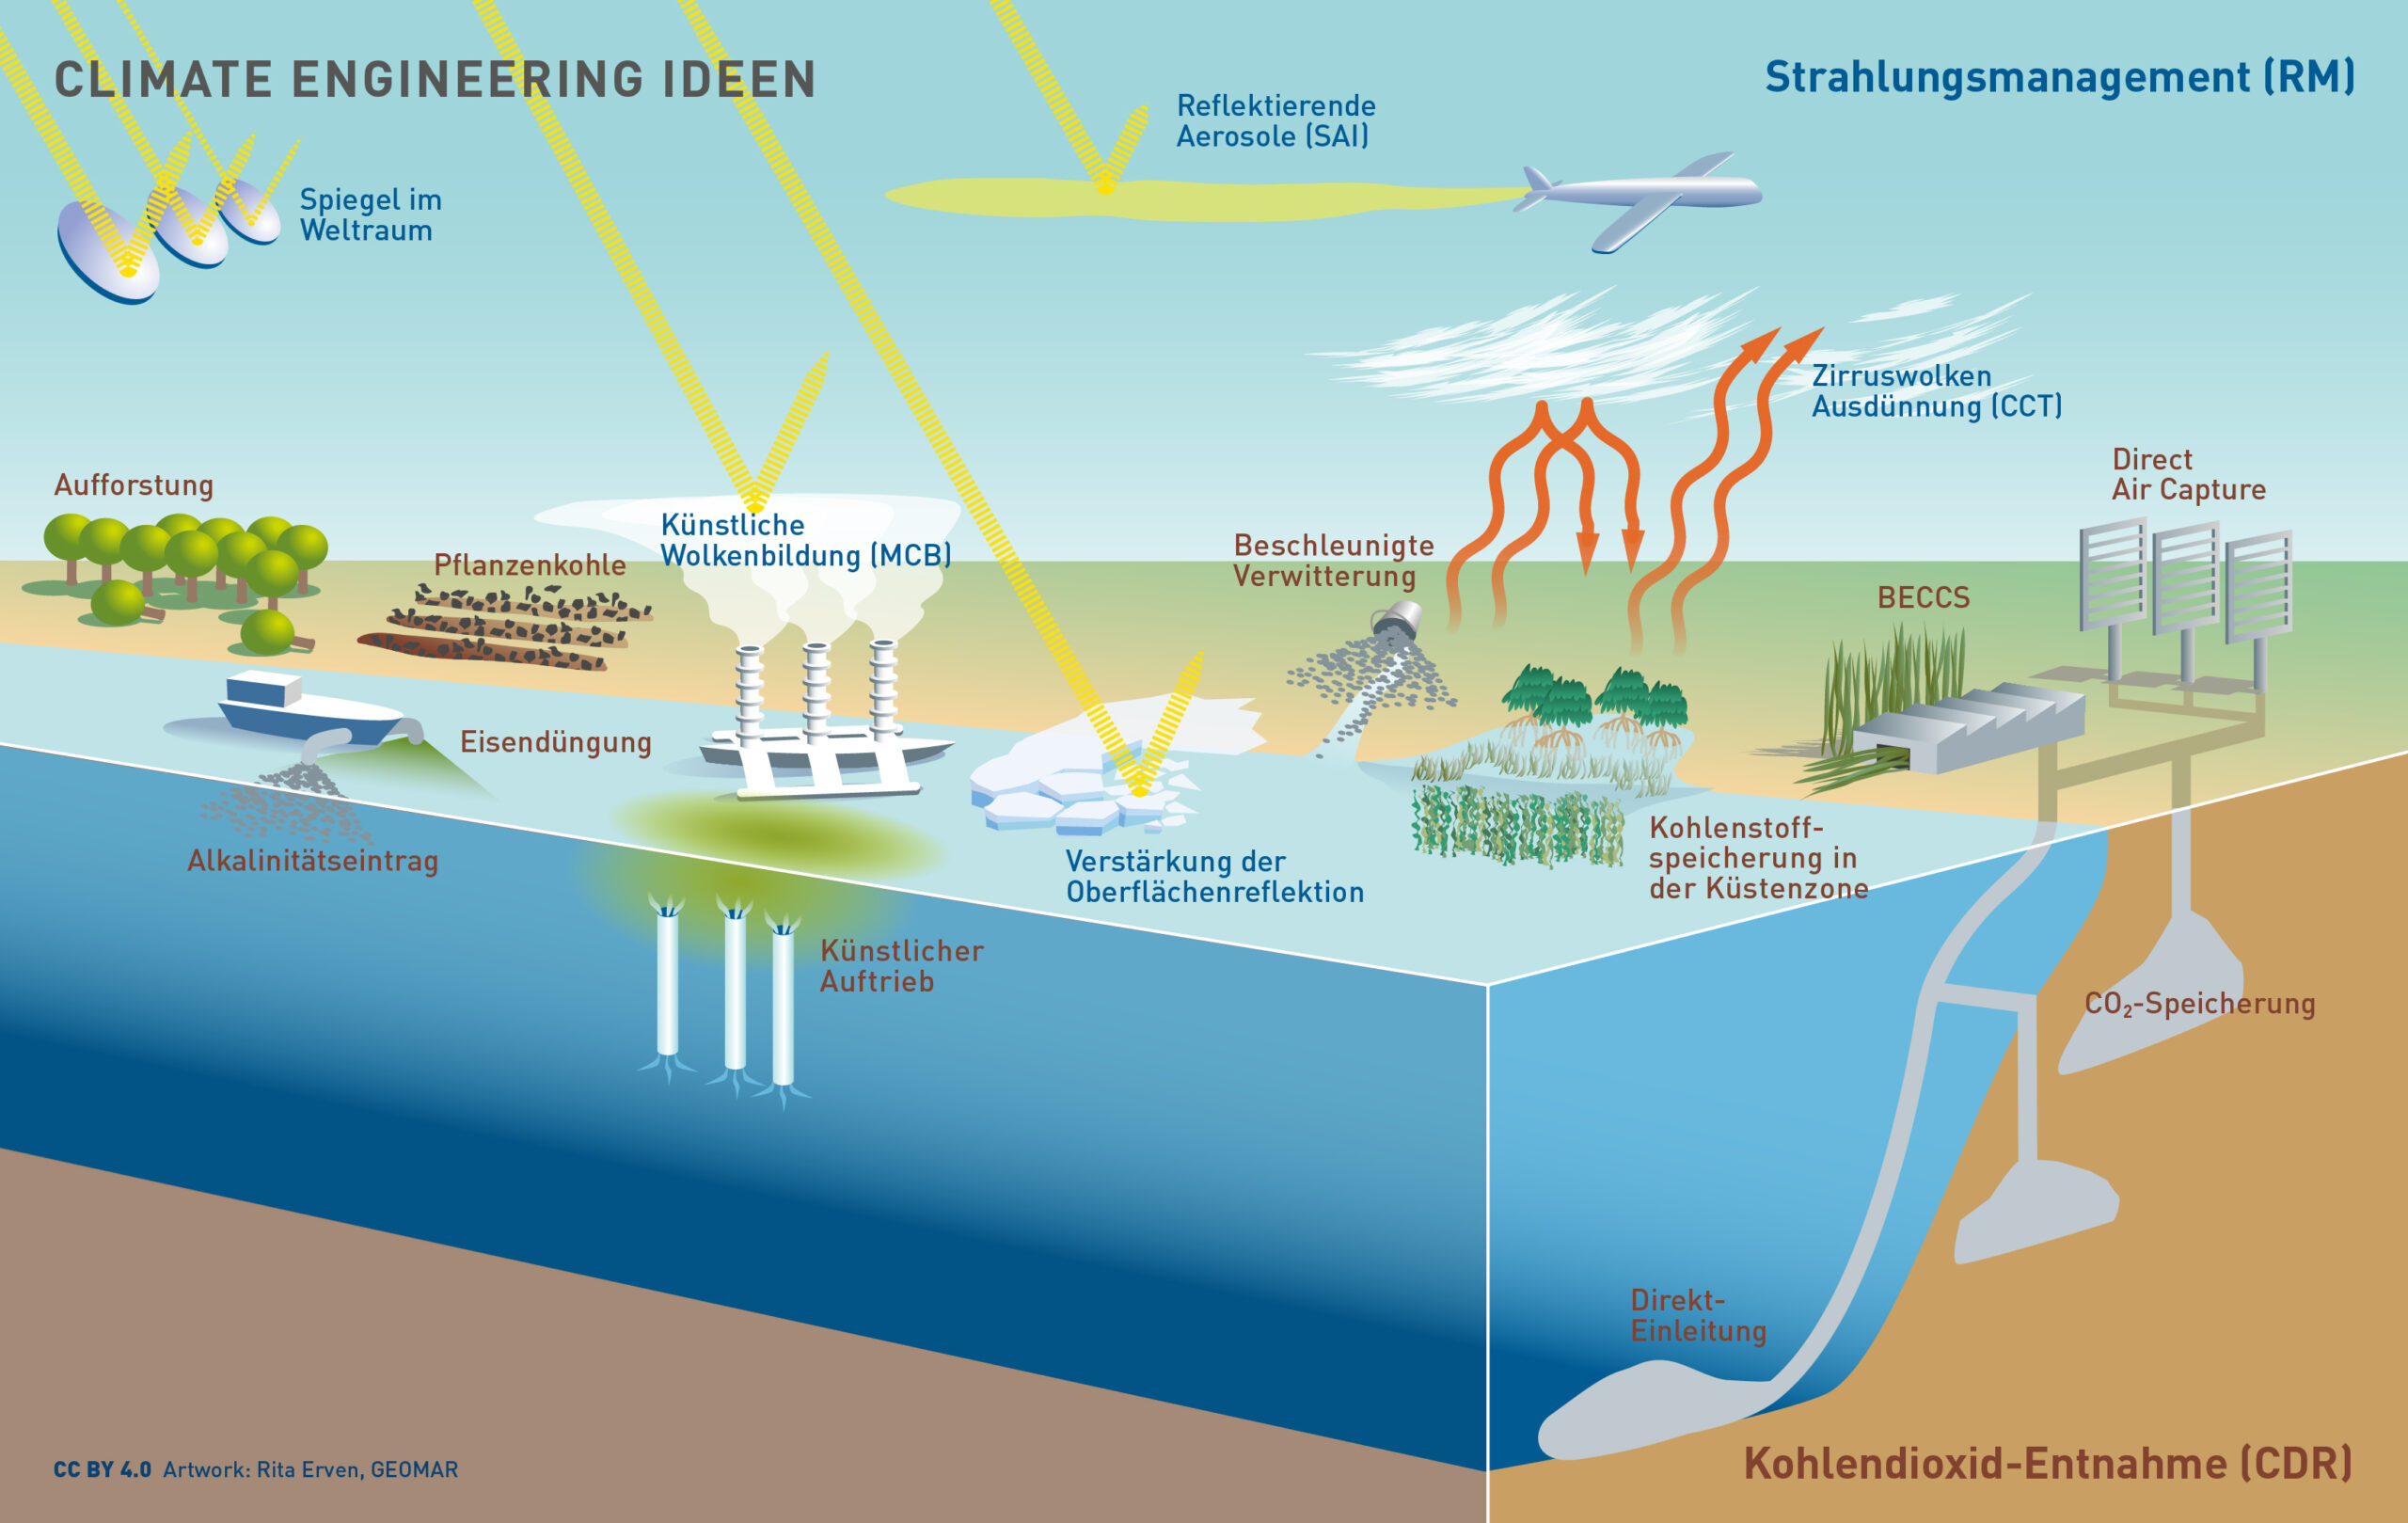
| 19:11, 20. Dez. 2022 | CE CDR und RM.jpg (Datei) |  |
422 KB | Dieter Kasang (Diskussion | Beiträge) | == Beschreibung == Strahlungsmanagement und Kohlendioxid-Entnahme == Lizenzhinweis == {| style="border:1px solid #8888aa; background-color:#f7f8ff;padding:5px;font-size:95%;" |Quelle: Carbone Dioxide Removal: Media und Informationen https://carbondioxide-removal.eu/materialien/ Lizenz: [http://creativecommons.org/licenses/by/4.0/ CC BY 4.0] |} | 1 |
| 19:33, 1. Dez. 2022 | CO2 mitigation curves 2° dt.jpg (Datei) |  |
315 KB | Dieter Kasang (Diskussion | Beiträge) | == Beschreibung == CO2-Reduktionspfade zur Erreichung des 2-Grad-Ziels, übersetzt ==Lizenzhinweis== {| style="border:1px solid #8888aa; background-color:#f7f8ff;padding:5px;font-size:95%;" | Quelle: Andrew, R. (2020): It's getting harder and harder to limit ourselves to 2°C, https://folk.universitetetioslo.no/roberan/t/global_mitigation_curves.shtml<br> Lizenz: [http://creativecommons.org/licenses/by/4.0/ CC BY] @robbie_andrew |} | 1 |
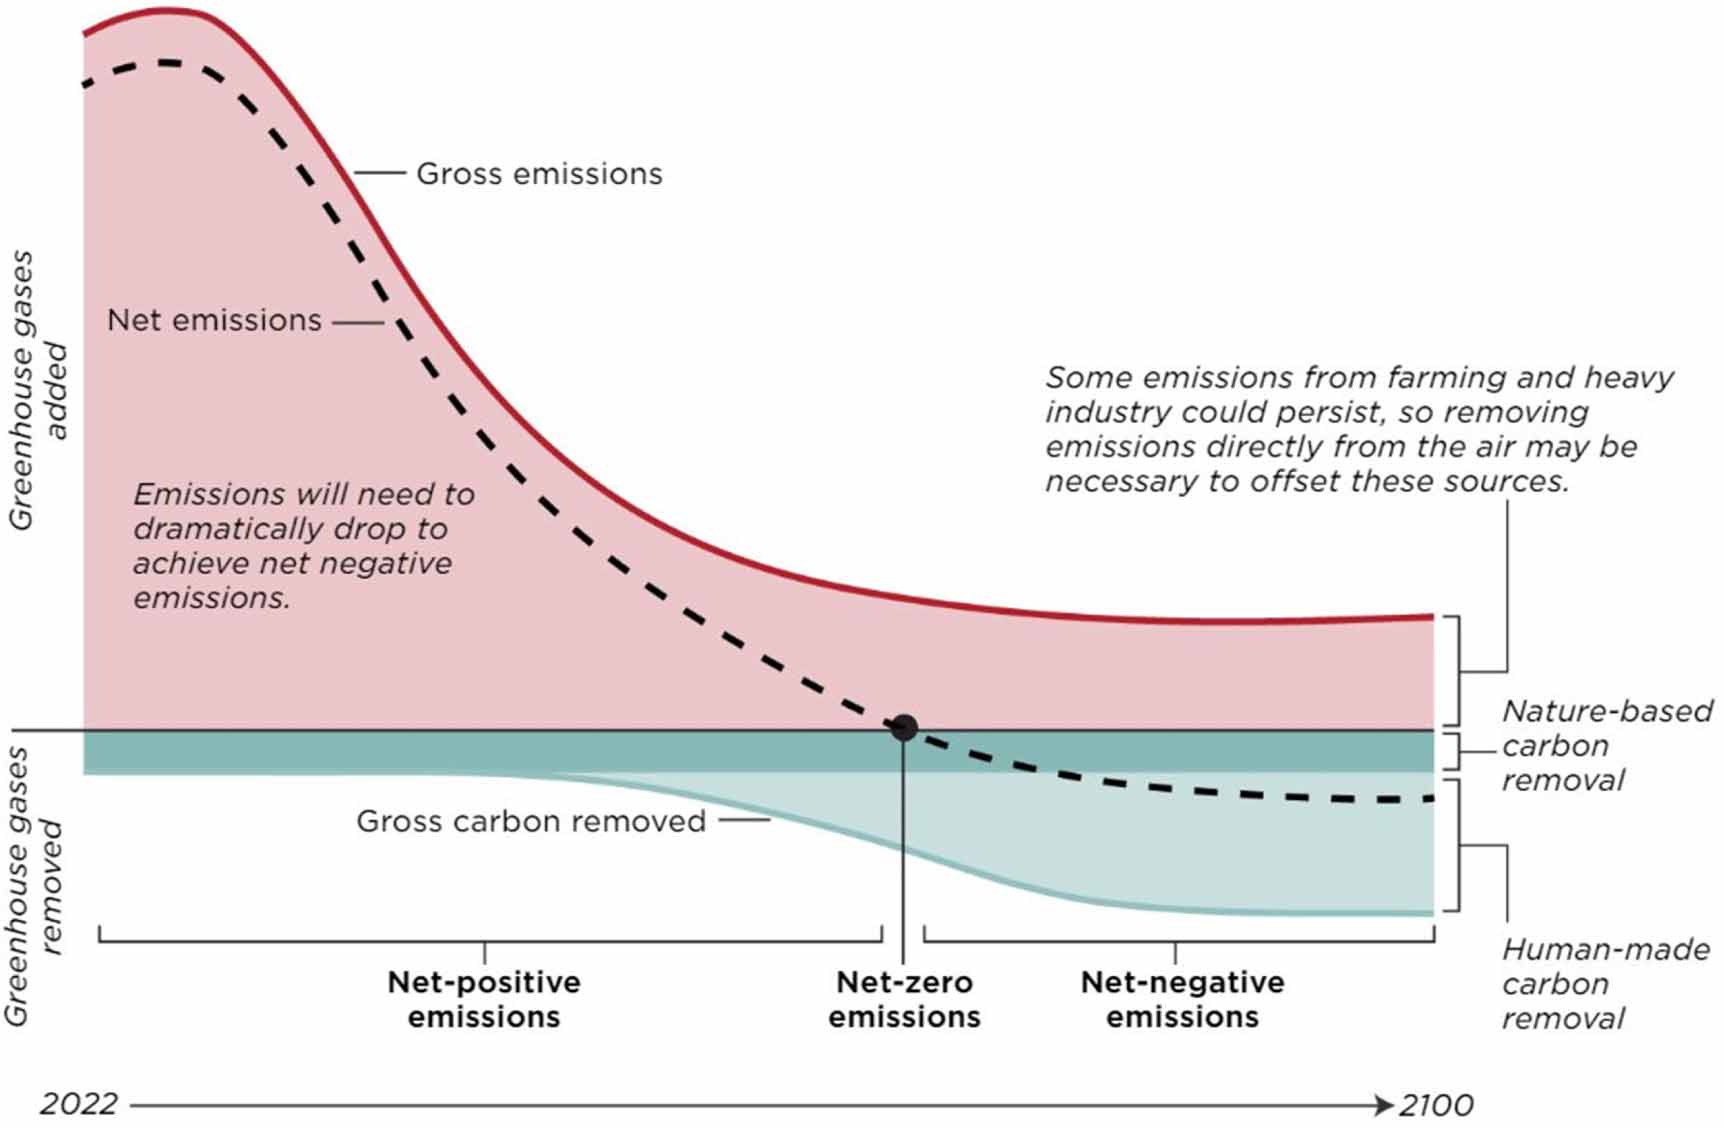
| 19:15, 1. Dez. 2022 | Netto null emissionen.jpg (Datei) |  |
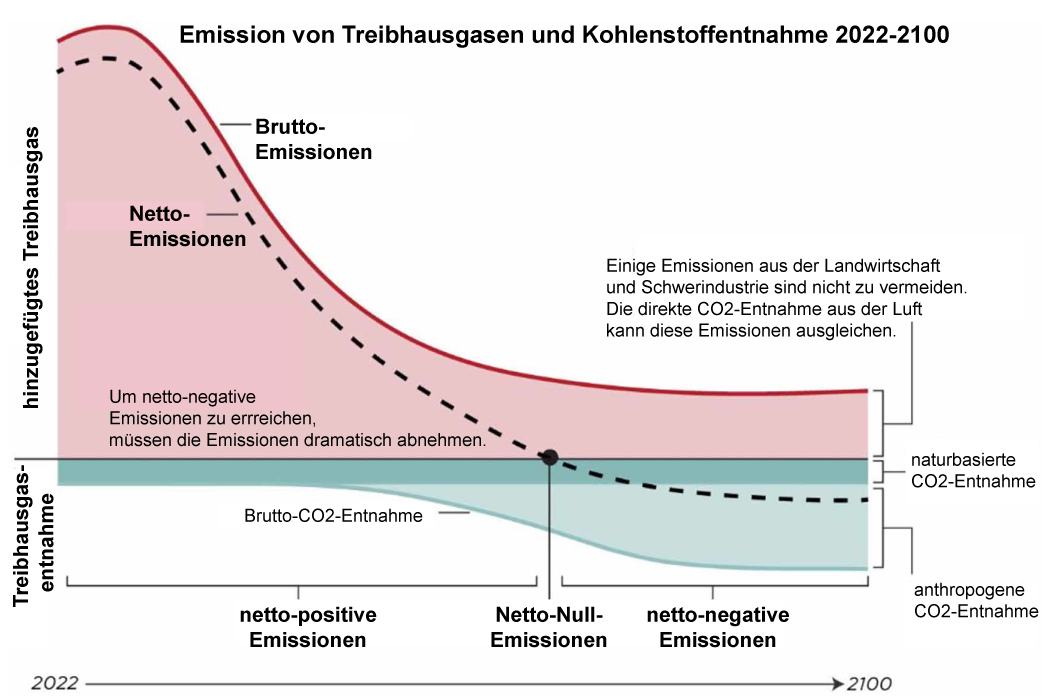
98 KB | Dieter Kasang (Diskussion | Beiträge) | == Beschreibung == Emissionen von Treibhausgasen und Kohlenstoffentnahme 2022-2100 ==Lizenzhinweis== {| style="border:1px solid #8888aa; background-color:#f7f8ff;padding:5px;font-size:95%;" | Quelle: Sovacool, B.K., C.M. Baum, S. Low, C. Roberts & J. Steinhauser (2022): Climate policy for a net-zero future: ten recommendations for Direct Air Capture, Environ. Res. Lett. 17 074014 DOI 10.1088/1748-9326/ac77a4<br> Lizenz: CC BY http://creativecommons.org/licenses/by/4.0/ |} | 1 |
| 12:44, 30. Nov. 2022 | CAT-Thermometer2100.png (Datei) |  |
234 KB | Dieter Kasang (Diskussion | Beiträge) | 3 | |
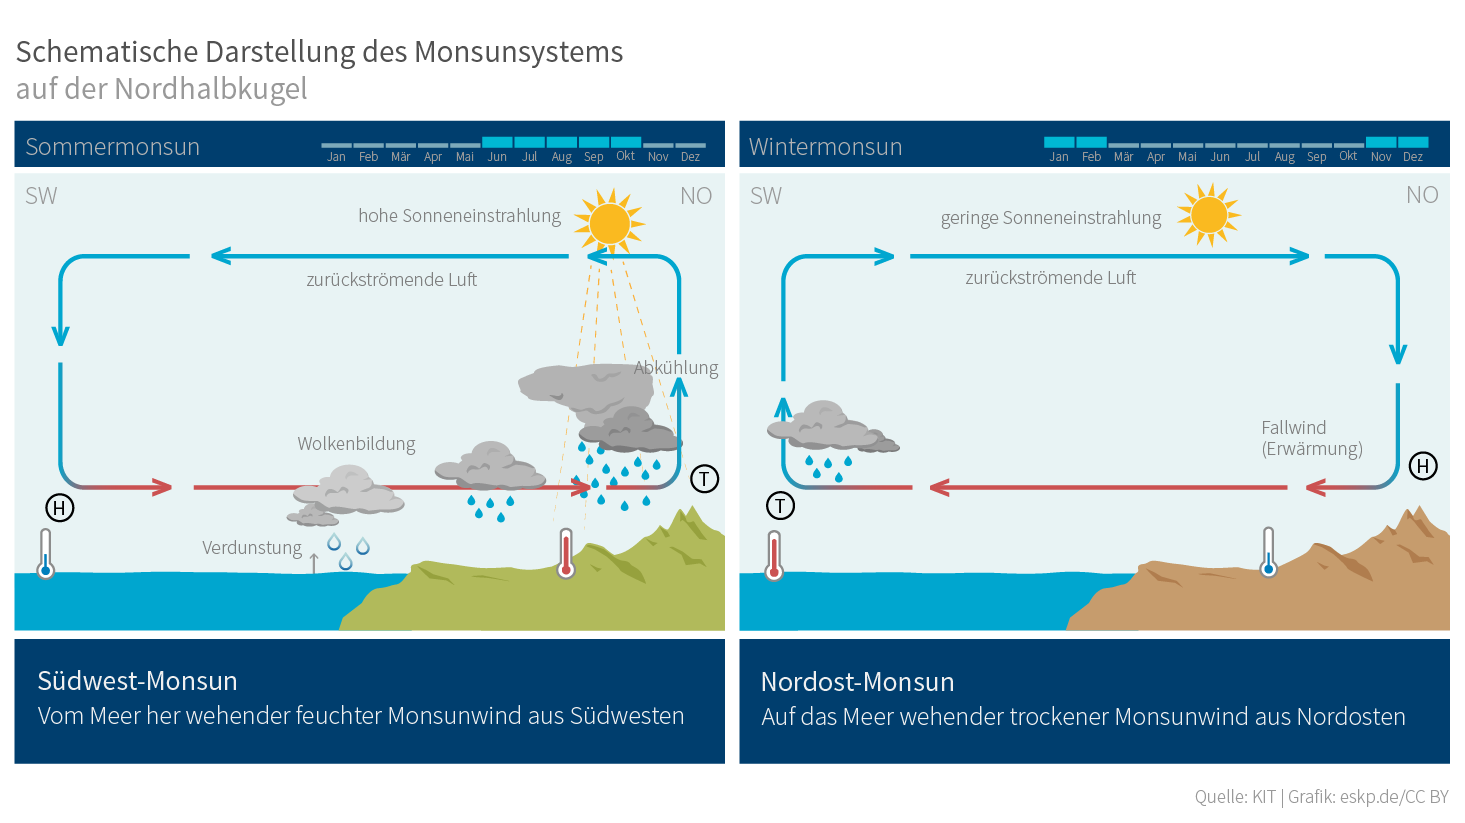
| 14:30, 28. Nov. 2022 | Monsun-schematisch.png (Datei) |  |
96 KB | Dieter Kasang (Diskussion | Beiträge) | == Beschreibung == Schematische Darstellung des Monsunsystems auf der Nordhalbkugel. ==Lizenzhinweis== {| style="border:1px solid #8888aa; background-color:#f7f8ff;padding:5px;font-size:95%;" | Quelle: Wissensplattform ESKP (o.J.): Monsun, https://www.eskp.de/grundlagen/klimawandel/monsun-935719/ Lizenz: CC BY 4.0 https://creativecommons.org/licenses/by/4.0/ |} | 1 |
| 19:38, 27. Nov. 2022 | SO2 emissions 1950-2020.jpg (Datei) |  |
58 KB | Dieter Kasang (Diskussion | Beiträge) | Schwefeldioxid-Emissionen nach Regionen 1850-2005 ==Lizenzhinweis== {| style="border:1px solid #8888aa; background-color:#f7f8ff;padding:5px;font-size:95%;" | Quelle: Jenkins, S., Grainger, R., Povey, A., Gettelman, A., Stier, P., and Allen, M. (2022): Is Anthropogenic Global Warming Accelerating? J. Climate, 1–43, https://doi.org/10.1175/JCLI-D-22-0081.1<br /> Lizenz: [https://creativecommons.org/licenses/by/4.0/deed.de CC BY] | |} | 1 |
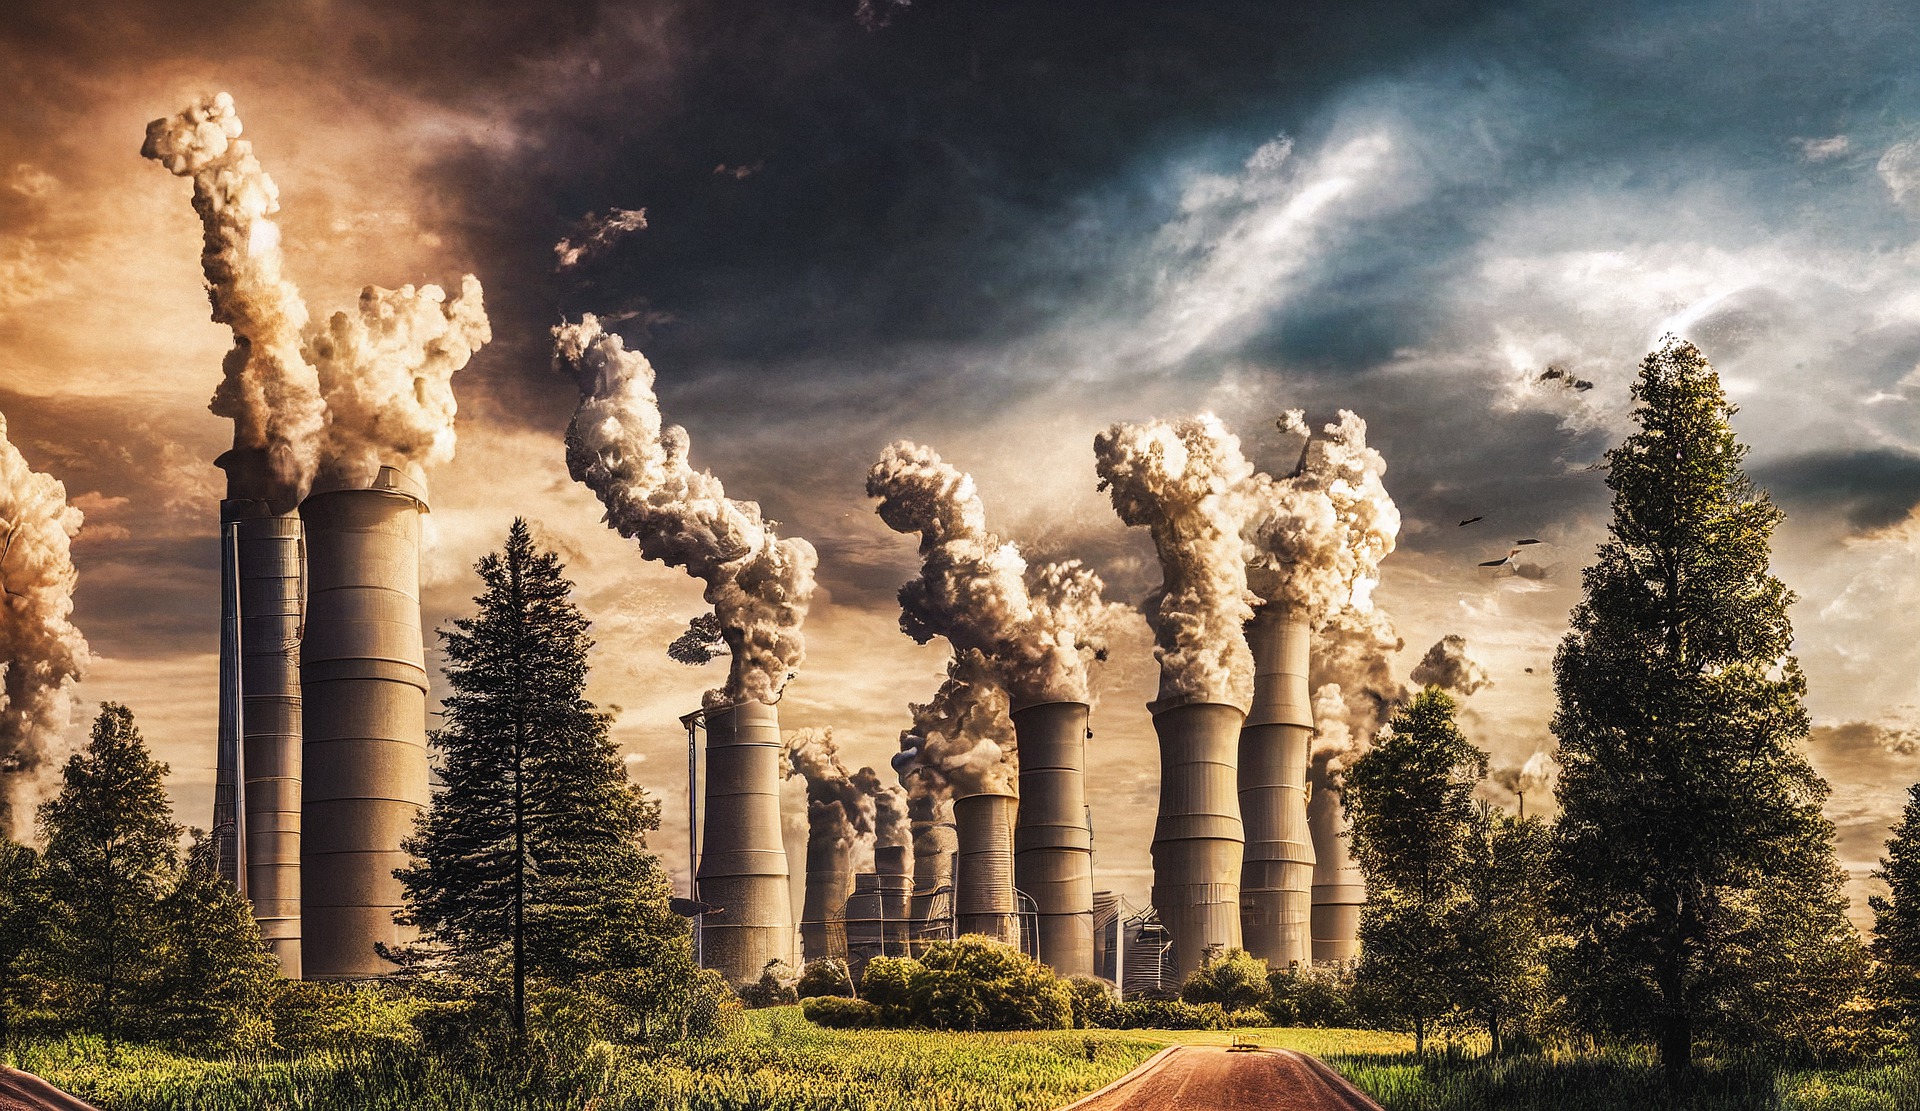
| 14:37, 27. Nov. 2022 | Rauchgas.jpg (Datei) |  |
858 KB | Dieter Kasang (Diskussion | Beiträge) | == Beschreibung == Industrielle Rauchgase als Quellen für CO2-Abscheidung == Lizenzhinweis == {| style="border:1px solid #8888aa; background-color:#f7f8ff;padding:5px;font-size:95%;" |Quelle: Pixabay, https://pixabay.com/de/photos/ai-generiert-luftverschmutzung-7573620/ Lizenz: Pixabay License, https://pixabay.com/service/license/ | 1 |
| 10:33, 27. Nov. 2022 | Oil-production-CO2.jpg (Datei) |  |
259 KB | Dieter Kasang (Diskussion | Beiträge) | == Beschreibung == Intensivierte Ölförderung durch CO2-Injektion == Lizenzhinweis == {| style="border:1px solid #8888aa; background-color:#f7f8ff;padding:5px;font-size:95%;" |Quelle: Li X-X, Yang T, Mbadinga SM, Liu J-F, Yang S-Z, Gu J-D and Mu B-Z (2017) Responses of Microbial Community Composition to Temperature Gradient and Carbon Steel Corrosion in Production Water of Petroleum Reservoir. Front. Microbiol. 8:2379. doi: 10.3389/fmicb.2017.02379 https://www.frontiersin.org/articles/10.3389/fm… | 1 |
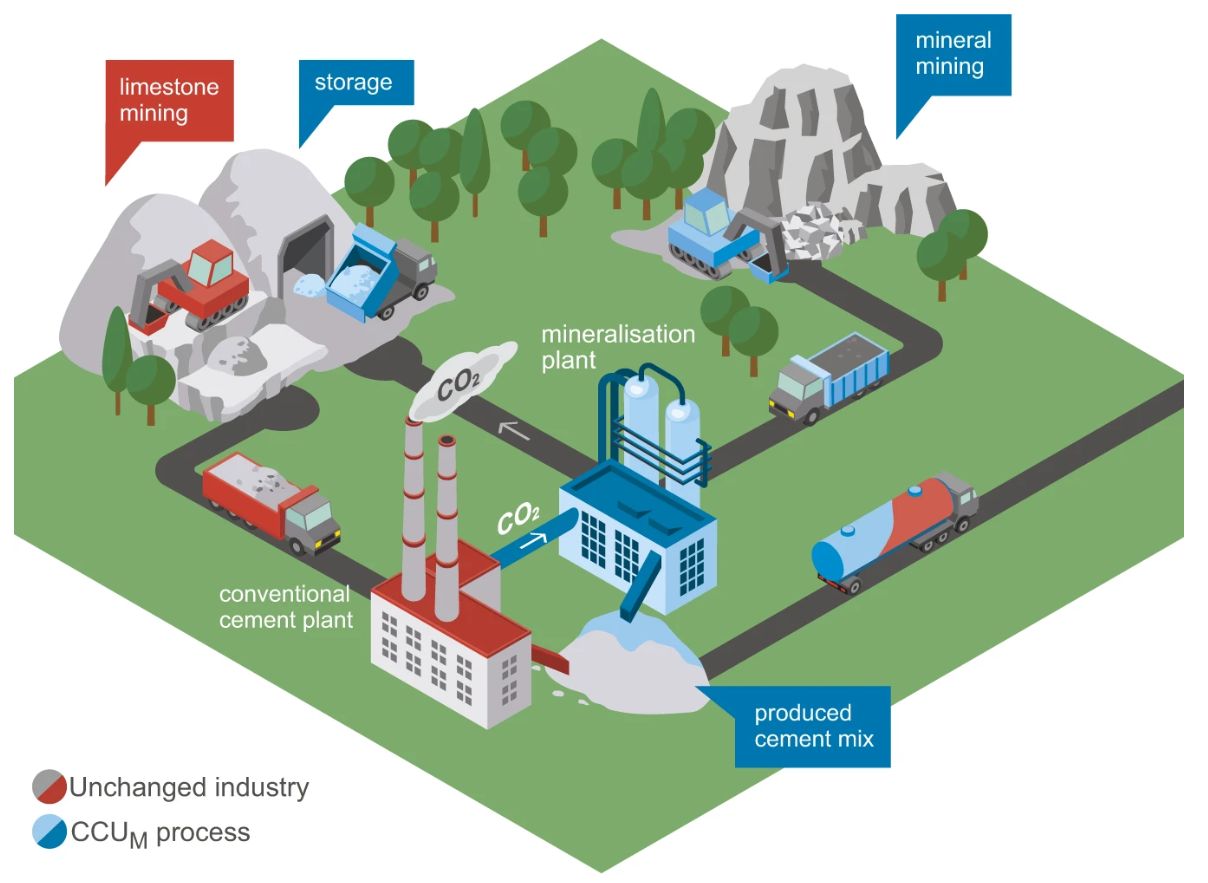
| 19:18, 19. Nov. 2022 | CO2 mineralization.jpg (Datei) |  |
92 KB | Dieter Kasang (Diskussion | Beiträge) | == Beschreibung == CO<sub>2</sub>-Quellen, indirekte und direkte Nutzung == Lizenzhinweis == {| style="border:1px solid #8888aa; background-color:#f7f8ff;padding:5px;font-size:95%;" |Quelle: Eigene Darstellung, Zeichenelemente IEA u.a.<br> Lizenz: CC BY-SA | 1 |
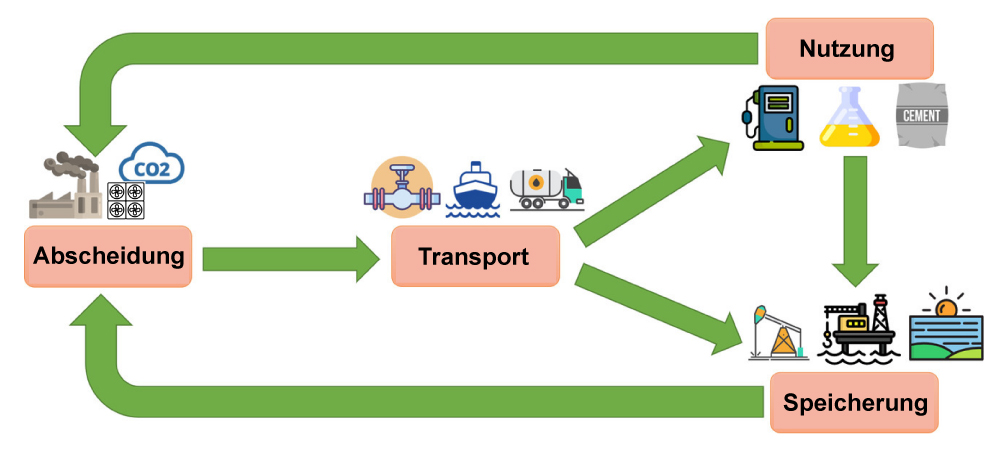
| 13:29, 19. Nov. 2022 | CO2-Quellen-Nutzung.jpg (Datei) |  |
95 KB | Dieter Kasang (Diskussion | Beiträge) | == Beschreibung == Entnahme, Transport, Nutzung und Speicherung von CO2 == Lizenzhinweis == {| style="border:1px solid #8888aa; background-color:#f7f8ff;padding:5px;font-size:95%;" |Quelle: Eigene Darstellung, Zeichenelemente IEA u.a.<br> Lizenz: CC BY-SA | 1 |
| 10:44, 17. Nov. 2022 | Land Ocean temp1880-2021.png (Datei) |  |
133 KB | Dieter Kasang (Diskussion | Beiträge) | Veränderung der globalen Oberflächentemperatur über dem Land (rot) und der Meeresoberflächentemperatur (blau) 1880-2021 im Vergleich zur Basis 1951-1980. ==Lizenzhinweis== {| style="border:1px solid #8888aa; background-color:#f7f8ff;padding:5px;font-size:95%;" | Quelle: NASA (2022): [https://data.giss.nasa.gov/gistemp/graphs_v4/ GISS Surface Temperature Analysis (v4)] <br> Lizenz: public domain |} | 1 |
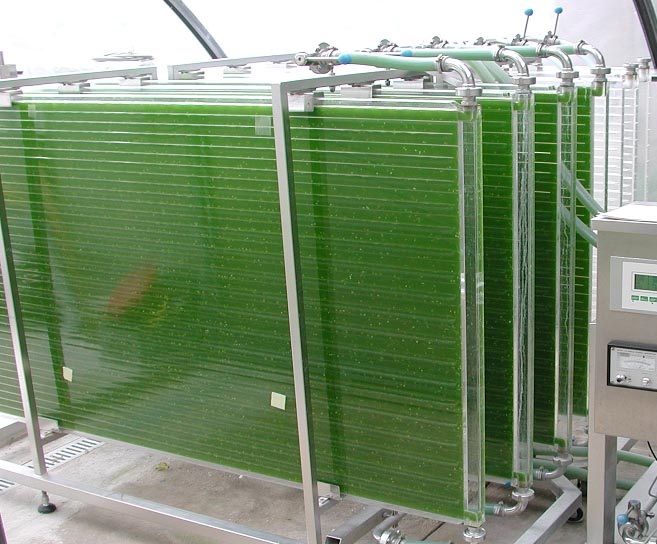
| 17:41, 14. Nov. 2022 | Photobioreactor microalgae.jpg (Datei) |  |
140 KB | Dieter Kasang (Diskussion | Beiträge) | == Beschreibung == Photobioreaktor aus Plastikplatten für die Kultivierung von Mikroalgen == Lizenzhinweis == {| style="border:1px solid #8888aa; background-color:#f7f8ff;padding:5px;font-size:95%;" |Quelle: Wikimedia Commons (2003): photobioreactor for the cultivation of microalgae, https://commons.wikimedia.org/wiki/File:Photobioreactor_PBR_500_P_IGV_Biotech.jpg <br> Lizenz: [https://creativecommons.org/licenses/by-sa/3.0/deed.en CC BY-SA] | 1 |
| 17:03, 14. Nov. 2022 | Trockeneis.jpg (Datei) |  |
131 KB | Dieter Kasang (Diskussion | Beiträge) | == Beschreibung == Trockeneis bzw. festes Kohlendioxid == Lizenzhinweis == {| style="border:1px solid #8888aa; background-color:#f7f8ff;padding:5px;font-size:95%;" |Quelle: commons.wikimedia.org/wiki/File:Trockeneis.jpg<br> Lizenz: CC BY-SA https://creativecommons.org/licenses/by-sa/3.0/deed.en | 1 |
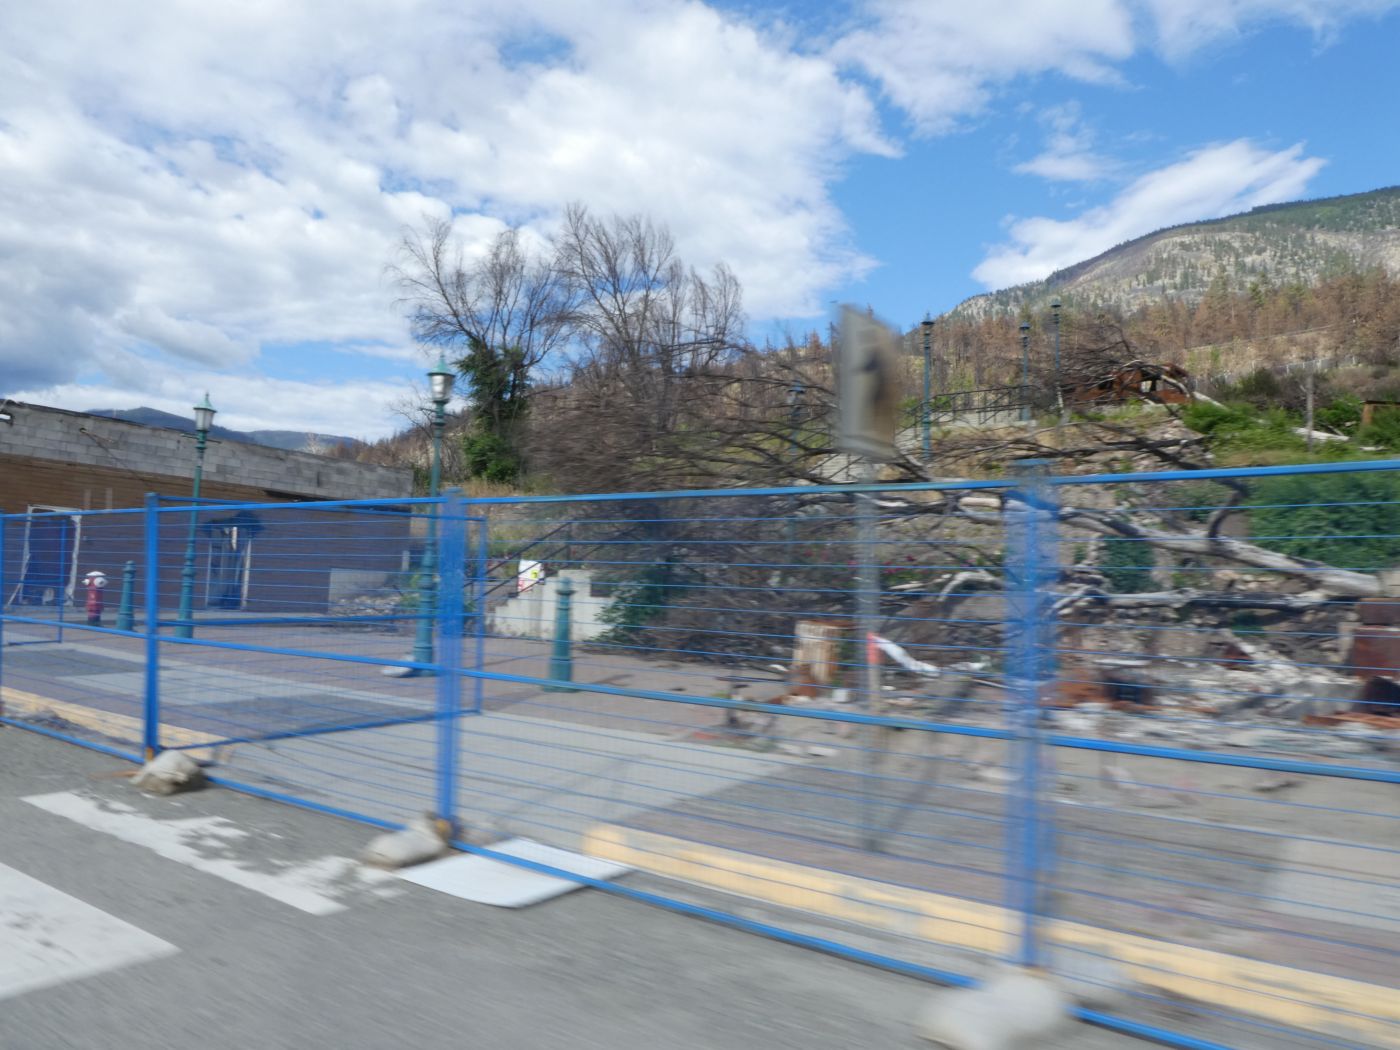
| 15:51, 13. Nov. 2022 | Lytton Juli 2022 sm.jpg (Datei) |  |
238 KB | Dieter Kasang (Diskussion | Beiträge) | Das kanadische Dorf Lytton ein Jahr nach der Vernichtung durch Hitzewelle und Waldbrand, aufgenommen aus einem vorbeifahrenden Auto im Juli 2022. ==Lizenzhinweis== {| style="border:1px solid #8888aa; background-color:#f7f8ff;padding:5px;font-size:95%;" | Quelle: FoTo: Jörg Fischer <br /> Lizenz: CC BY-SA |} | 1 |
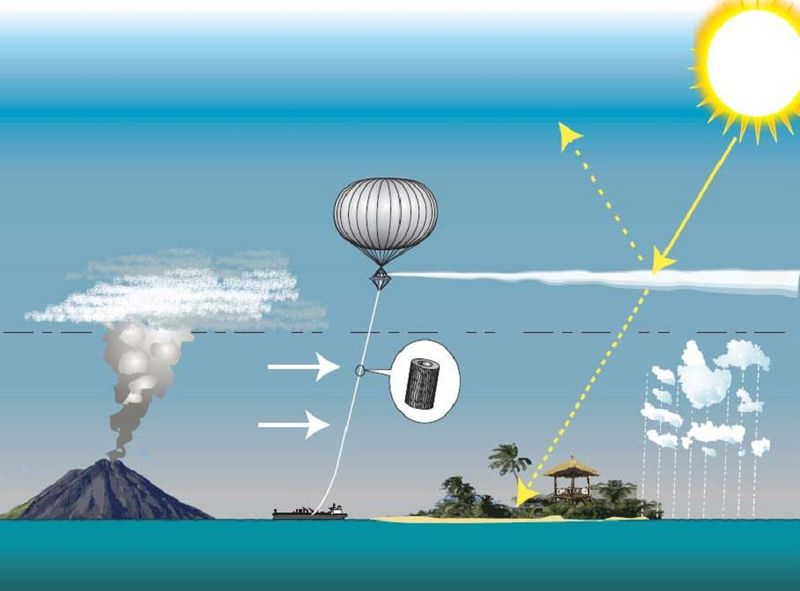
| 09:57, 13. Nov. 2022 | SPICE SRM overview.jpg (Datei) |  |
43 KB | Dieter Kasang (Diskussion | Beiträge) | == Beschreibung == Stratosphärische Aerosol-Injektion in Anlehnung an die Wirkung von Vulkanausbrüchen. == Lizenzhinweis == {| style="border:1px solid #8888aa; background-color:#f7f8ff;padding:5px;font-size:95%;" |Quelle: Wikimedia Commons (2011): SPICE SRM, https://commons.wikimedia.org/wiki/File:SPICE_SRM_overview.jpg Lizenz: CC BY-SA https://creativecommons.org/licenses/by-sa/3.0/deed.en |} | 1 |
| 16:52, 12. Nov. 2022 | Entnahme-Transport-Nutzung.jpg (Datei) | 96 KB | Dieter Kasang (Diskussion | Beiträge) | == Beschreibung == Entnahme, Transport, Nutzung und Speicherung von CO2 == Lizenzhinweis == {| style="border:1px solid #8888aa; background-color:#f7f8ff;padding:5px;font-size:95%;" |Quelle: Eigene Darstellung, Dieter Kasang<br> Lizenz: CC BY-SA | 1 | |
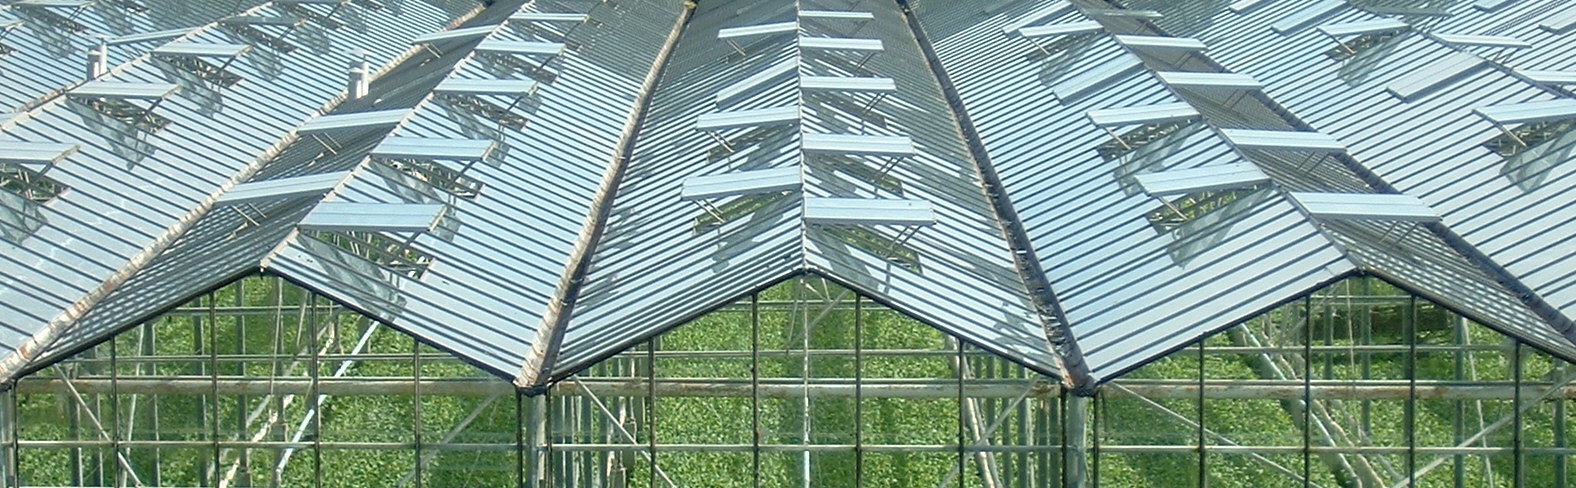
| 20:17, 11. Nov. 2022 | Treibhaus Niederlande.jpg (Datei) |  |
422 KB | Dieter Kasang (Diskussion | Beiträge) | == Beschreibung == Treibhaus in den Niederlanden == Lizenzhinweis == {| style="border:1px solid #8888aa; background-color:#f7f8ff;padding:5px;font-size:95%;" |Quelle: Wikimedia Commons (2005): Netherlands: Westland - greenhouses. https://commons.wikimedia.org/wiki/File:Westland_kassen.jpg <br> Lizenz: CC BY-SA | 1 |
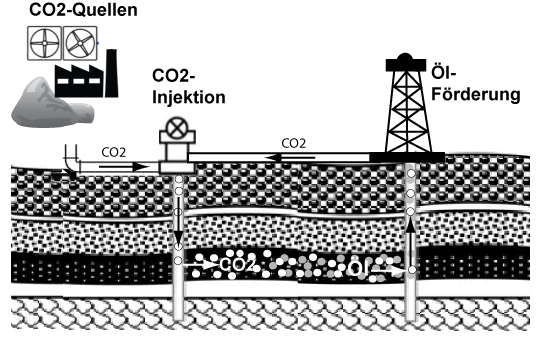
| 20:01, 11. Nov. 2022 | OER-dt.jpg (Datei) |  |
106 KB | Dieter Kasang (Diskussion | Beiträge) | == Beschreibung == Tertiäre Ölförderung durch CO2-Injektion == Lizenzhinweis == {| style="border:1px solid #8888aa; background-color:#f7f8ff;padding:5px;font-size:95%;" |Quelle: Eigene Darstellung, Dieter Kasang<br> Lizenz: CC BY-SA | 1 |
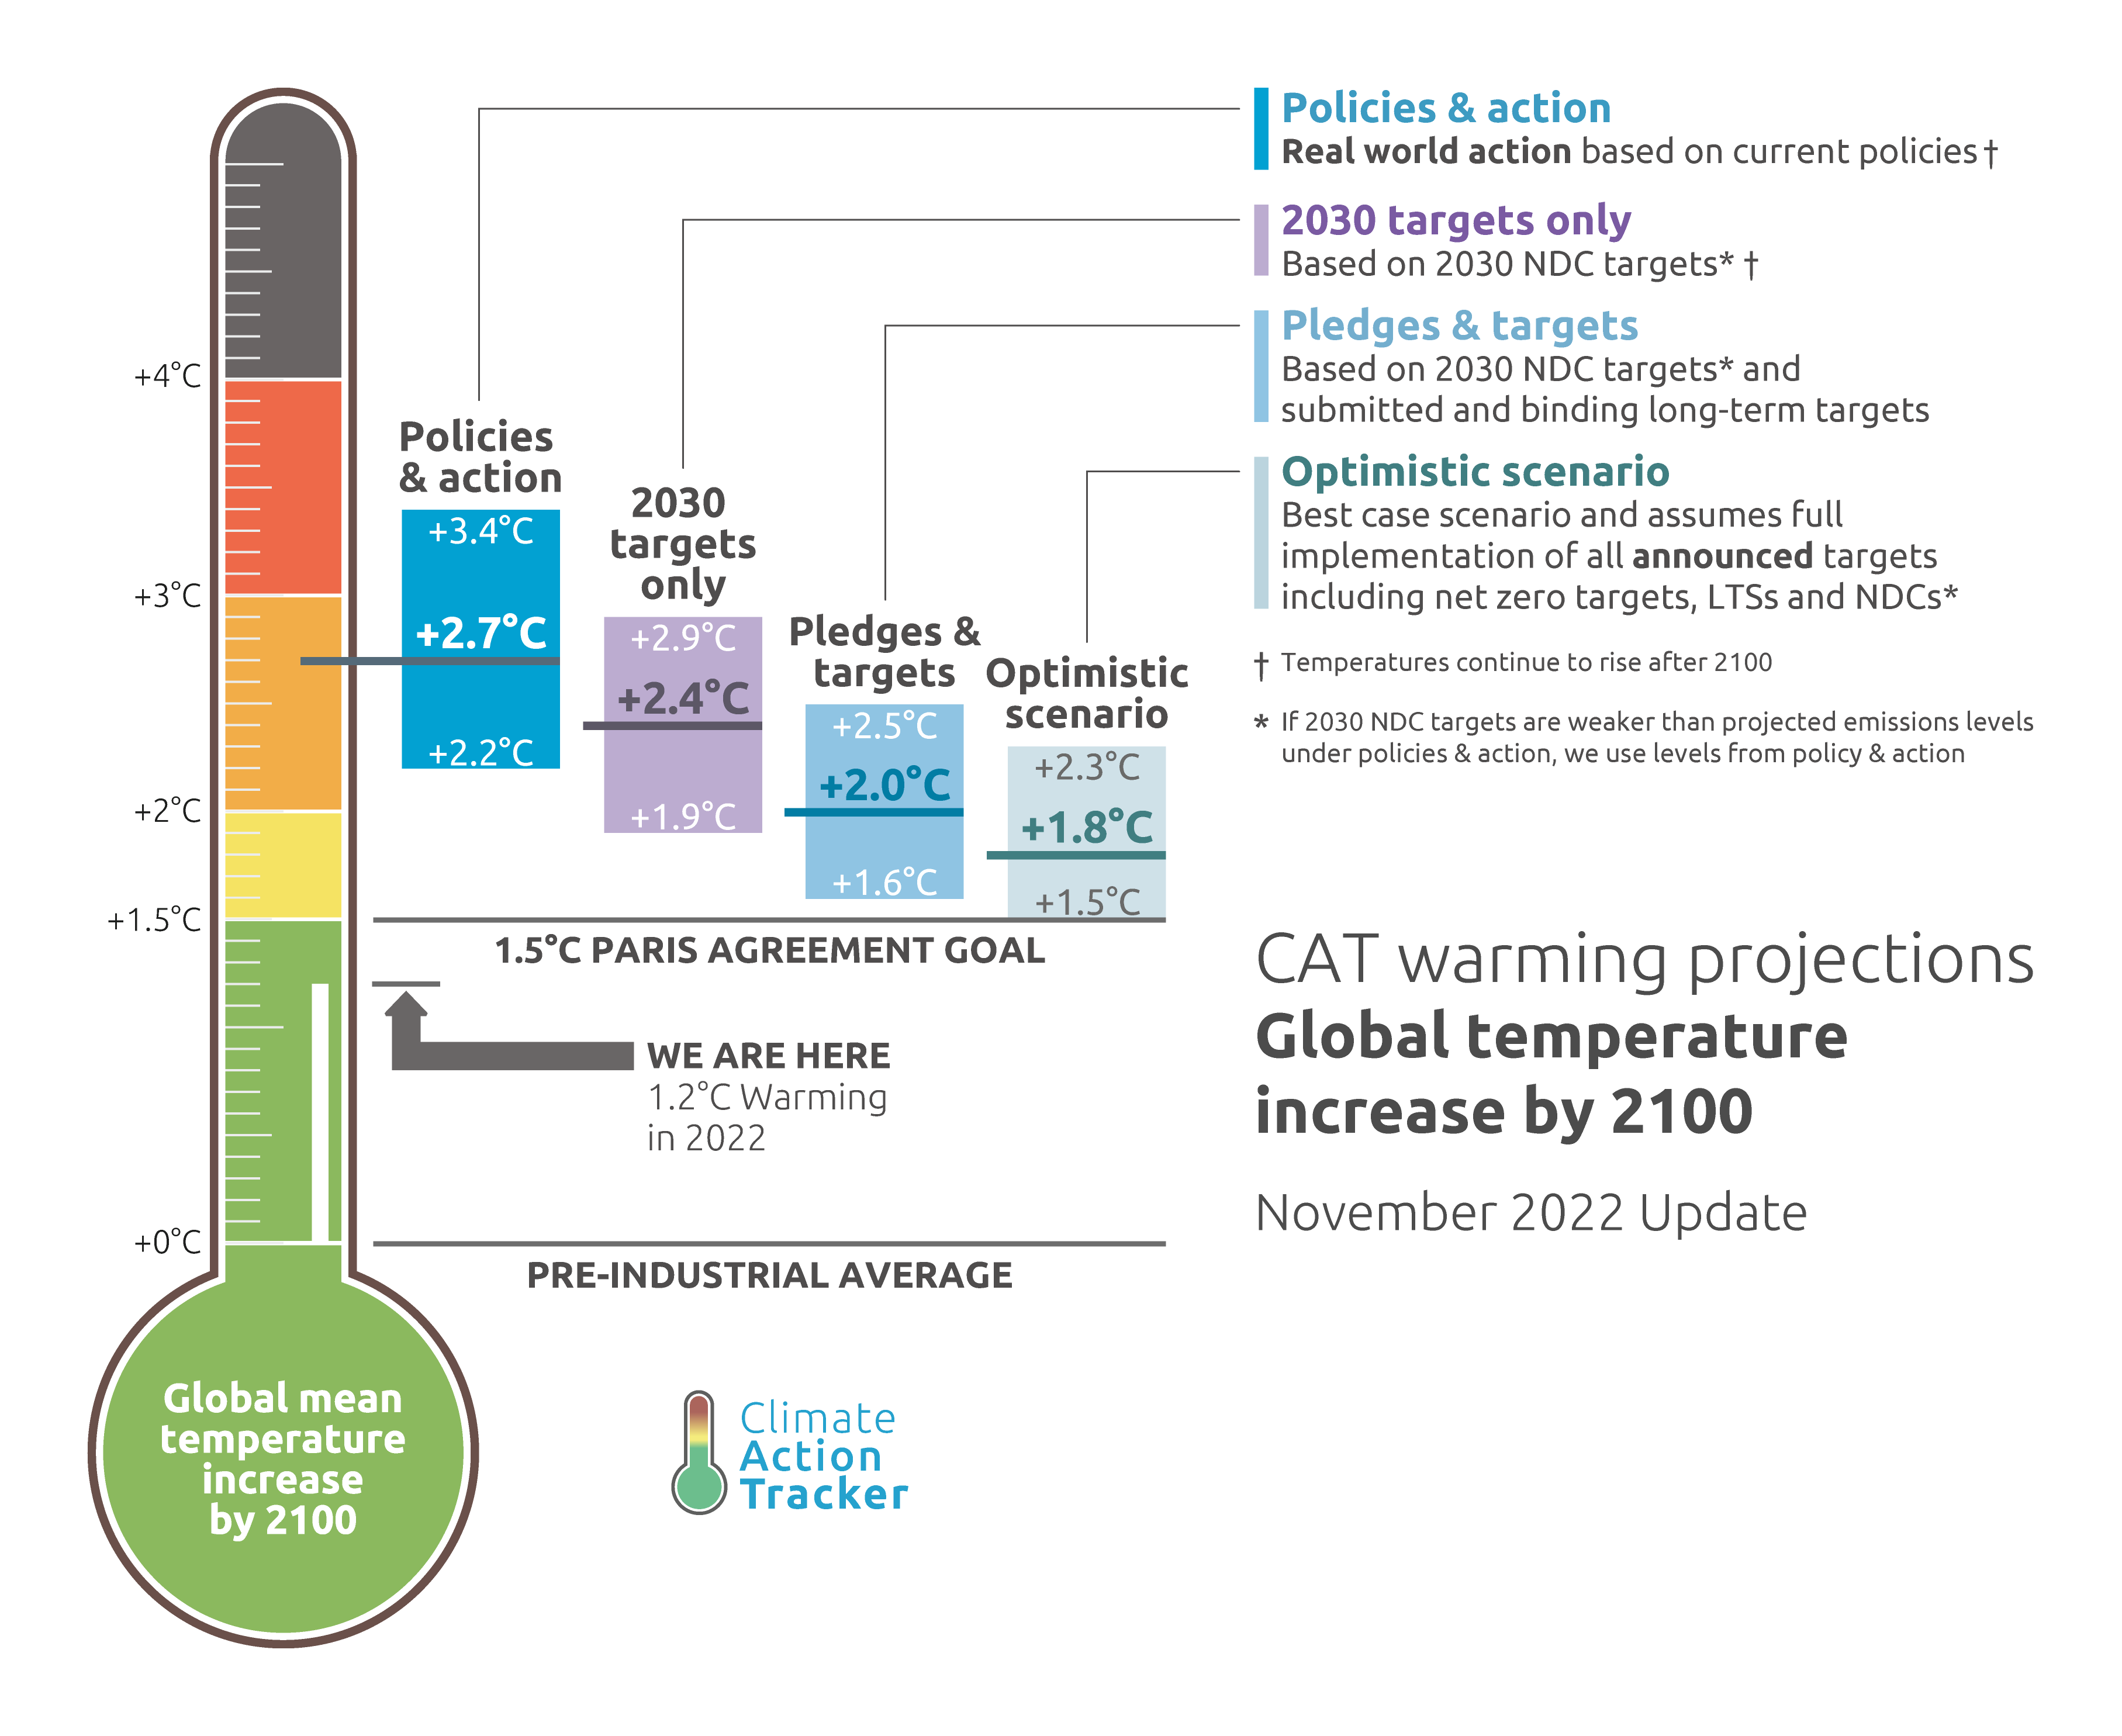
| 10:04, 11. Nov. 2022 | CAT-Thermometer-2022.11.png (Datei) |  |
234 KB | Dieter Kasang (Diskussion | Beiträge) | Pariser Klimaziele und die aktuelle Klimapolitik: Die Erwärmung gegenüber der vorindustriellen Zeit liegt gegenwärtig bei +1,2 °C. Die Beschlüsse der Klimakonferenz von Paris 2015 streben eine Erwärmung von 1,5 °C, höchstens 2 °C bis 2100 an. Die aktuelle Klimapolitik steuert auf eine Erwärmung von ca. 2,7 °C zu. Die seit der Pariser Konferenz übernommenen Verpflichtungen der einzelnen Staaten bis 2030 laufen auf eine Erwärmung von ca. 2,4 °C, die langfristigen Zusagen und Ziele auf 2,0 °C hina… | 1 |
| 09:32, 11. Nov. 2022 | CO2-capture-storage-utilisation.jpg (Datei) |  |
130 KB | Dieter Kasang (Diskussion | Beiträge) | == Beschreibung == Abscheidung, Transport, Nutzung und Speicherung von CO2 == Lizenzhinweis == {| style="border:1px solid #8888aa; background-color:#f7f8ff;padding:5px;font-size:95%;" |Quelle: Hong, W.Y. (2022): A techno-economic review on carbon capture, utilisation and storage systems for achieving a net-zero CO2 emissions future, Carbon Capture Science & Technology 3, https://doi.org/10.1016/j.ccst.2022.100044<br> Lizenz: Lizenz: [http://creativecommons.org/licenses/by/4.0/ CC BY] | 1 |
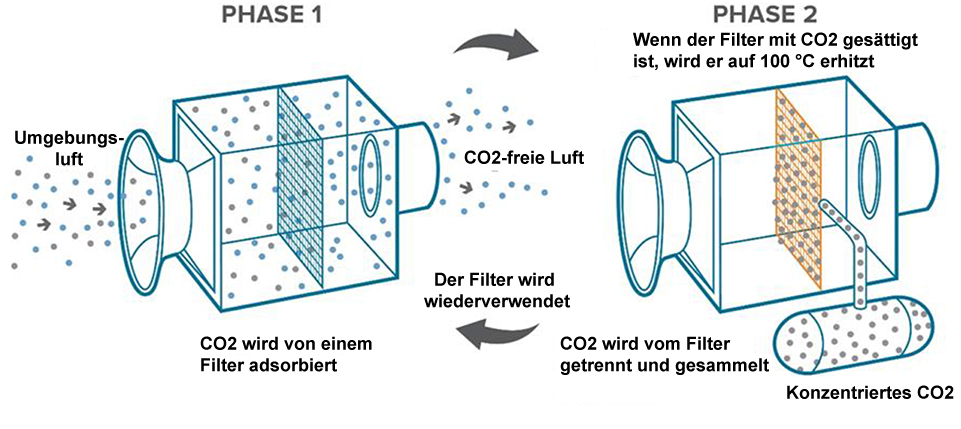
| 20:01, 10. Nov. 2022 | Direct-air-capture-phase-dt.jpg (Datei) |  |
213 KB | Dieter Kasang (Diskussion | Beiträge) | == Beschreibung == Darstellung der zwei Phasen des Direct Air Capture (DAC) == Lizenzhinweis == {| style="border:1px solid #8888aa; background-color:#f7f8ff;padding:5px;font-size:95%;" |Quelle: Beuttler, C., L. Charles and J. Wurzbacher (2019): The Role of Direct Air Capture in Mitigation of Anthropogenic Greenhouse Gas Emissions. Front. Clim. 1:10. doi: 10.3389/fclim.2019.00010 https://www.frontiersin.org/articles/10.3389/fclim.2019.00010/full Lizenz: Lizenz: CC BY http://creativecommons.org/… | 1 |
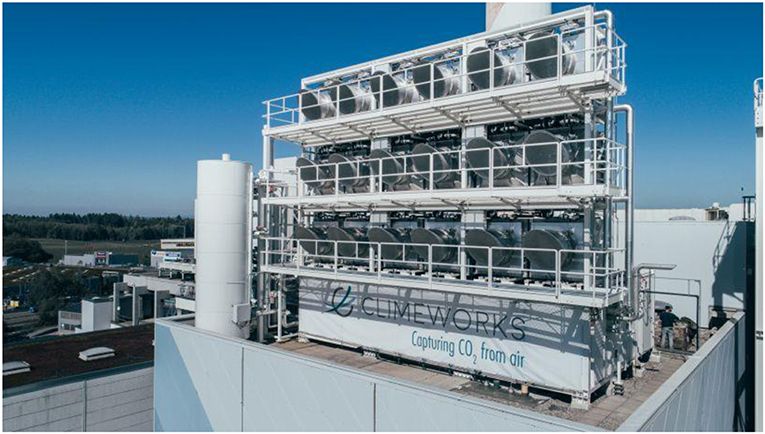
| 17:30, 30. Okt. 2022 | Direct air capture Hinwil.jpg (Datei) |  |
70 KB | Dieter Kasang (Diskussion | Beiträge) | == Beschreibung == CO2-Abscheidung aus der Umgebungsluft, Schweiz. == Lizenzhinweis == {| style="border:1px solid #8888aa; background-color:#f7f8ff;padding:5px;font-size:95%;" |Quelle: Beuttler, C., L. Charles, J. Wurzbacher (2019): The Role of Direct Air Capture in Mitigation of Anthropogenic Greenhouse Gas Emissions, Frontiers in Climate, https://www.frontiersin.org/articles/10.3389/fclim.2019.00010 Lizenz: [http://creativecommons.org/licenses/by/4.0/ CC BY] | 1 |
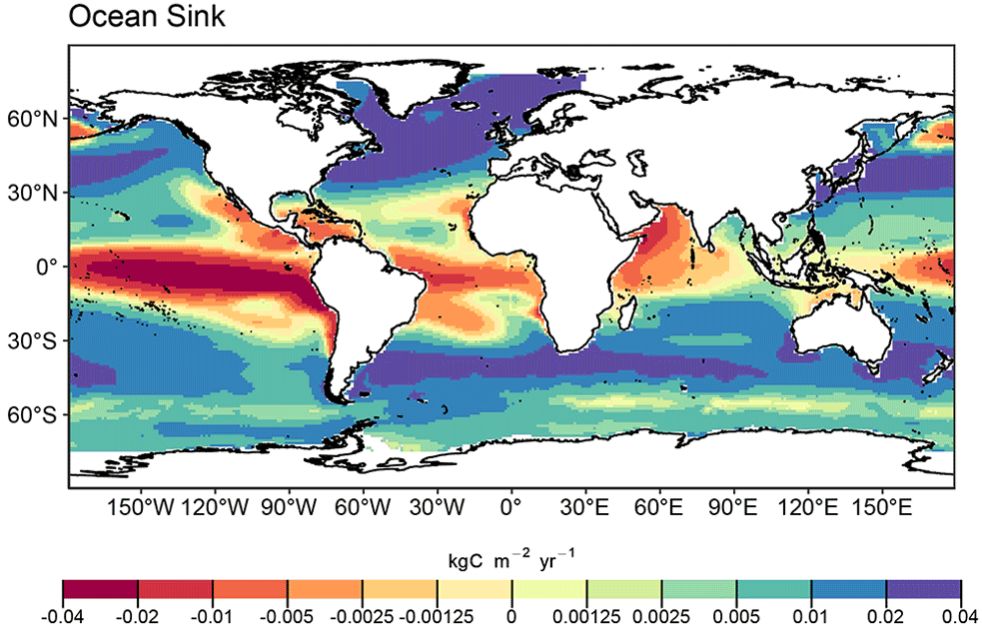
| 18:22, 15. Okt. 2022 | Ocean CO2 sink.jpg (Datei) |  |
103 KB | Dieter Kasang (Diskussion | Beiträge) | == Beschreibung == Die ozeanische anthropogene Kohlenstoffsenke als Mittel des Jahrzehnts 2011-2020 in kg C/m2/Jahr. Grüne bis blaue Farben zeigen CO2-Flüsse von der Atmosphäre in den Ozean, gelbe bis rote Farben vom Ozean in die Atmosphäre ==Lizenzhinweis== {| style="border:1px solid #8888aa; background-color:#f7f8ff;padding:5px;font-size:95%;" | Quelle: Friedlingstein, P., M.W.Jones, M. O'Sullivan et al. (2022): Global Carbon Budget 2021, Earth Syst. Sci. Data, 14, 1917–2005, https://doi.or… | 1 |
| 18:13, 15. Okt. 2022 | C fluxes-geological-dt.jpg (Datei) |  |
255 KB | Dieter Kasang (Diskussion | Beiträge) | == Beschreibung == Kohlenstoffaustausch zwischen den geologischen und den oberflächennahen Speichern ==Lizenzhinweis== {| style="border:1px solid #8888aa; background-color:#f7f8ff;padding:5px;font-size:95%;" | Quelle: Flickr (2019): [https://www.flickr.com/photos/deepcarbonobservatory/49012926183/in/album-72157654648898790/ Deep Carbon]<br> Lizenz: [https://creativecommons.org/licenses/by-sa/2.0/ CC BY]; eigene Beschriftung |} | 1 |
| 18:08, 15. Okt. 2022 | Deep-carbon-3.jpg (Datei) |  |
126 KB | Dieter Kasang (Diskussion | Beiträge) | Kohlenstoffaustausch zwischen den geologischen und den oberflächennahen Speichern ==Lizenzhinweis== {| style="border:1px solid #8888aa; background-color:#f7f8ff;padding:5px;font-size:95%;" | Quelle: Flickr (2019): Deep Carbon, https://www.flickr.com/photos/deepcarbonobservatory/49012926183/in/album-72157654648898790/ Lizenz: CC BY https://creativecommons.org/licenses/by-sa/2.0/; eigene Beschriftung <br> Lizenz: NASA public domain |} | 1 |
| 16:37, 19. Sep. 2022 | S-Asia wet days SSP5-8.5.jpg (Datei) |  |
53 KB | Dieter Kasang (Diskussion | Beiträge) | == Beschreibung == Änderung der Anzahl der Tage mit Niederschlägen von >1 mm („feuchte Tage“) während des Sommer-Monsuns zwischen 1965-2015 und 2050-2100 == Lizenzhinweis == {| style="border:1px solid #8888aa; background-color:#f7f8ff;padding:5px;font-size:95%;" |Quelle: Katzenberger, A., Levermann, A., Schewe, J., & Pongratz, J. (2022): Intensification of very wet monsoon seasons in India under global warming. Geophysical Research Letters, 49, e2022GL098856. https://doi.org/10.1029/2022GL09885… | 1 |
| 16:32, 19. Sep. 2022 | Indian Monsoon rain 1860-2090.png (Datei) |  |
338 KB | Dieter Kasang (Diskussion | Beiträge) | == Beschreibung == Änderung der Niederschläge während des Indischen Sommermonsuns 1860-2090 in mm/Tag nach verschiedenen Szanarien im Vergleich zum Mittel 1985-2015 == Lizenzhinweis == {| style="border:1px solid #8888aa; background-color:#f7f8ff;padding:5px;font-size:95%;" |Quelle: Katzenberger, A., Schewe, J., Pongratz, J., and Levermann, A. (2021): [https://doi.org/10.5194/esd-12-367-2021 Robust increase of Indian monsoon rainfall and its variability under future warming in CMIP6 models], Ear… | 1 |
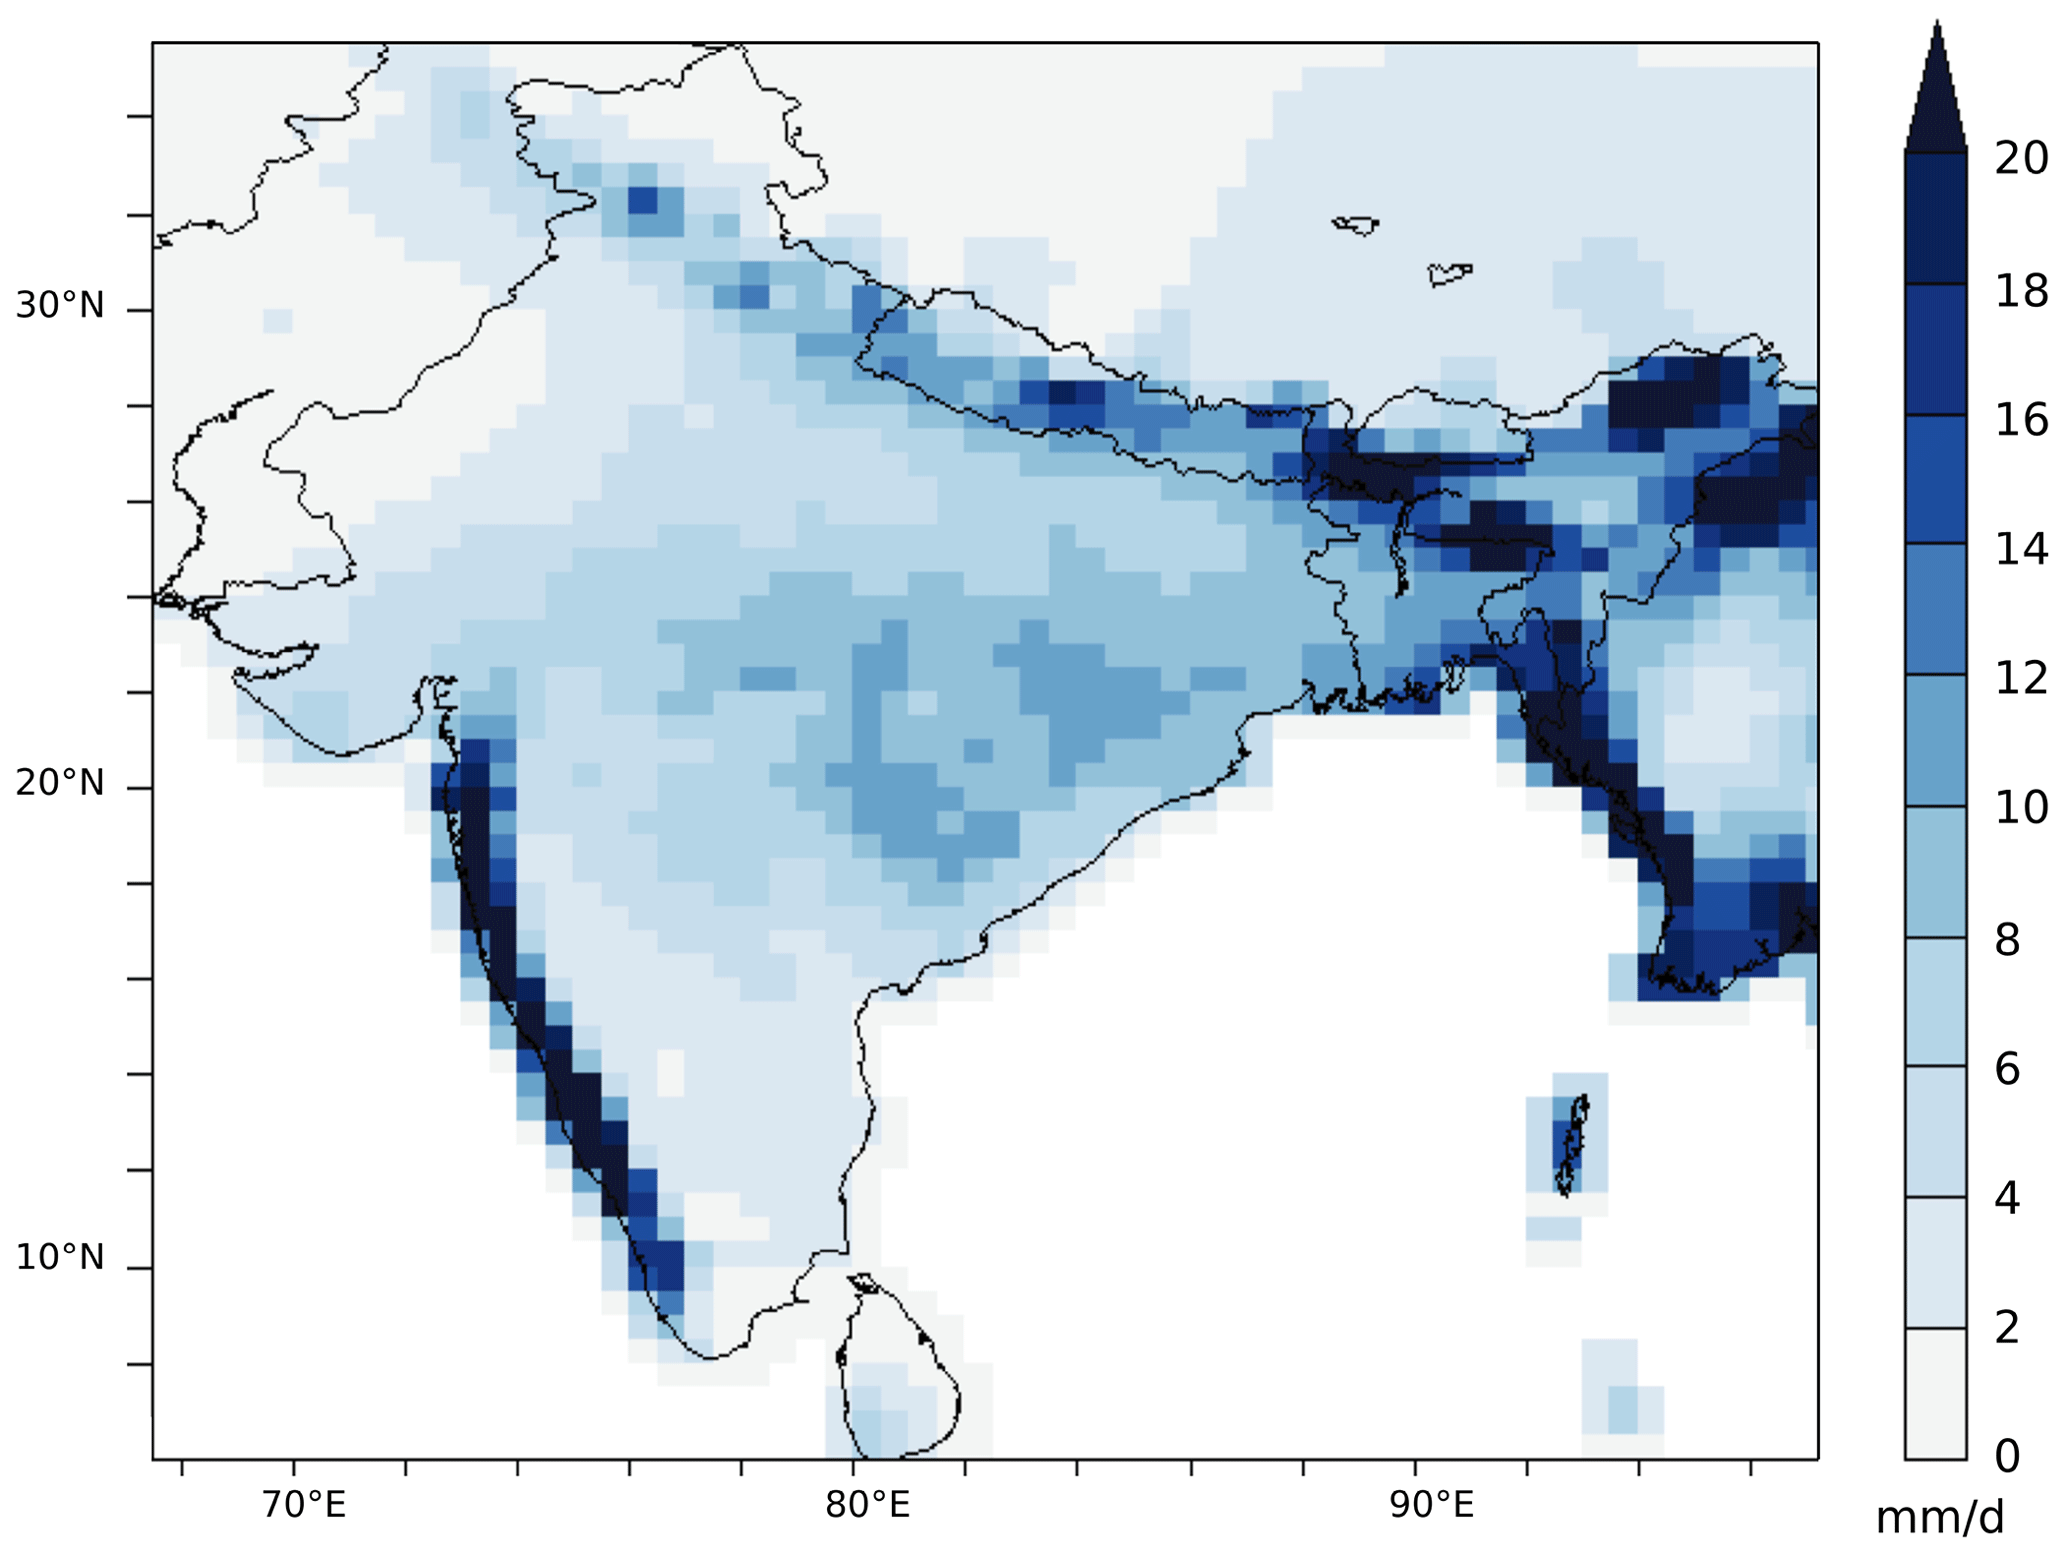
| 16:26, 19. Sep. 2022 | Indian Monsoon prec 1985-2015.png (Datei) |  |
178 KB | Dieter Kasang (Diskussion | Beiträge) | == Beschreibung == Räumliche Verteilung der Niederschläge während des Indischen Sommermonsuns 1985-2015 in mm/Tag == Lizenzhinweis == {| style="border:1px solid #8888aa; background-color:#f7f8ff;padding:5px;font-size:95%;" |Quelle: Katzenberger, A., Schewe, J., Pongratz, J., and Levermann, A. (2021): Robust increase of Indian monsoon rainfall and its variability under future warming in CMIP6 models, Earth Syst. Dynam., 12, 367–386, https://doi.org/10.5194/esd-12-367-2021<br> Lizenz: CC BY https… | 1 |
