Dateiliste
Aus Klimawandel
Diese Spezialseite listet alle hochgeladenen Dateien auf.
| Datum | Name | Vorschaubild | Größe | Benutzer | Beschreibung | Versionen |
|---|---|---|---|---|---|---|
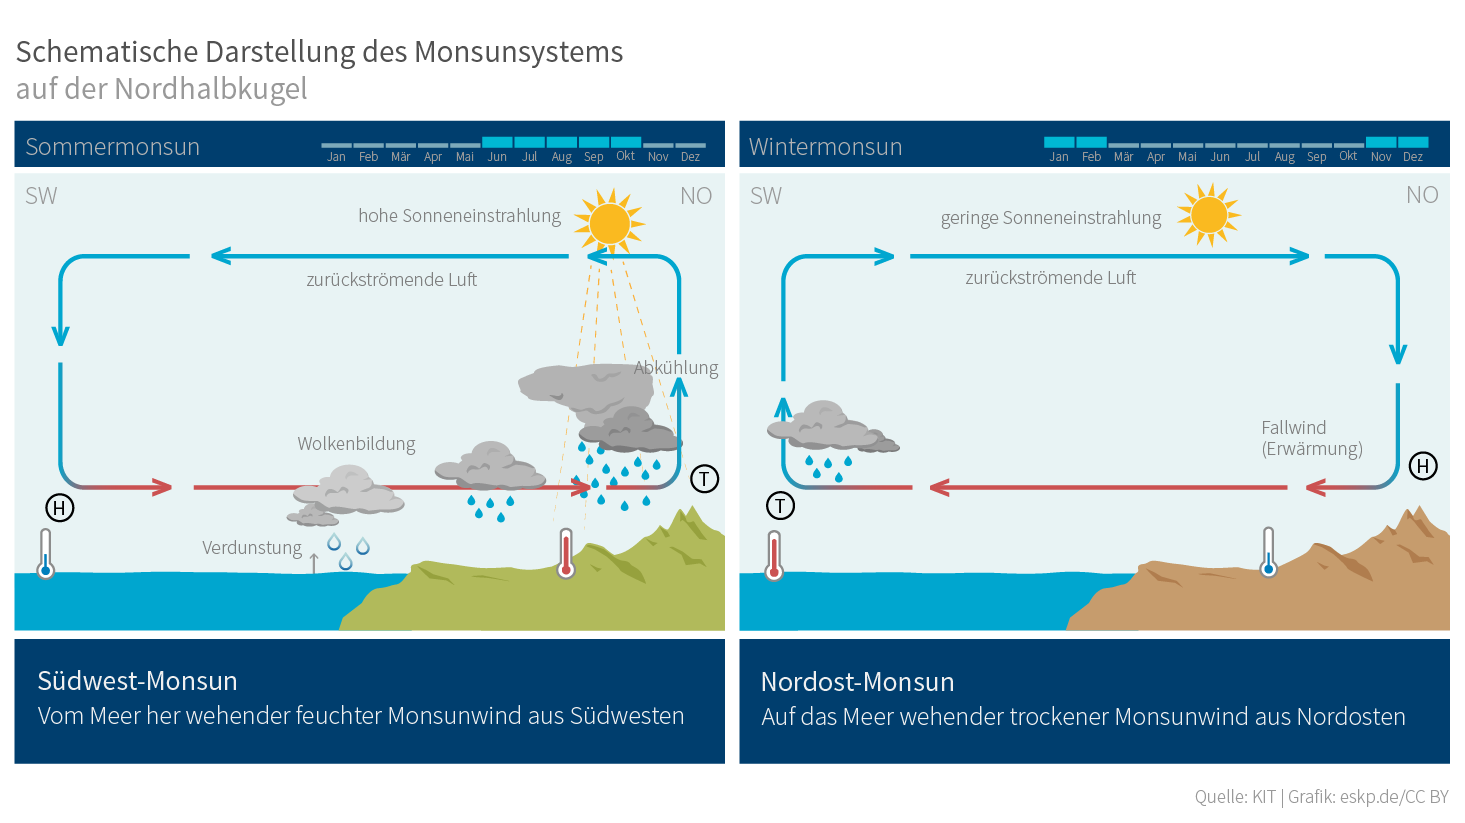
| 14:30, 28. Nov. 2022 | Monsun-schematisch.png (Datei) |  |
96 KB | Dieter Kasang (Diskussion | Beiträge) | == Beschreibung == Schematische Darstellung des Monsunsystems auf der Nordhalbkugel. ==Lizenzhinweis== {| style="border:1px solid #8888aa; background-color:#f7f8ff;padding:5px;font-size:95%;" | Quelle: Wissensplattform ESKP (o.J.): Monsun, https://www.eskp.de/grundlagen/klimawandel/monsun-935719/ Lizenz: CC BY 4.0 https://creativecommons.org/licenses/by/4.0/ |} | 1 |
| 19:38, 27. Nov. 2022 | SO2 emissions 1950-2020.jpg (Datei) |  |
58 KB | Dieter Kasang (Diskussion | Beiträge) | Schwefeldioxid-Emissionen nach Regionen 1850-2005 ==Lizenzhinweis== {| style="border:1px solid #8888aa; background-color:#f7f8ff;padding:5px;font-size:95%;" | Quelle: Jenkins, S., Grainger, R., Povey, A., Gettelman, A., Stier, P., and Allen, M. (2022): Is Anthropogenic Global Warming Accelerating? J. Climate, 1–43, https://doi.org/10.1175/JCLI-D-22-0081.1<br /> Lizenz: [https://creativecommons.org/licenses/by/4.0/deed.de CC BY] | |} | 1 |
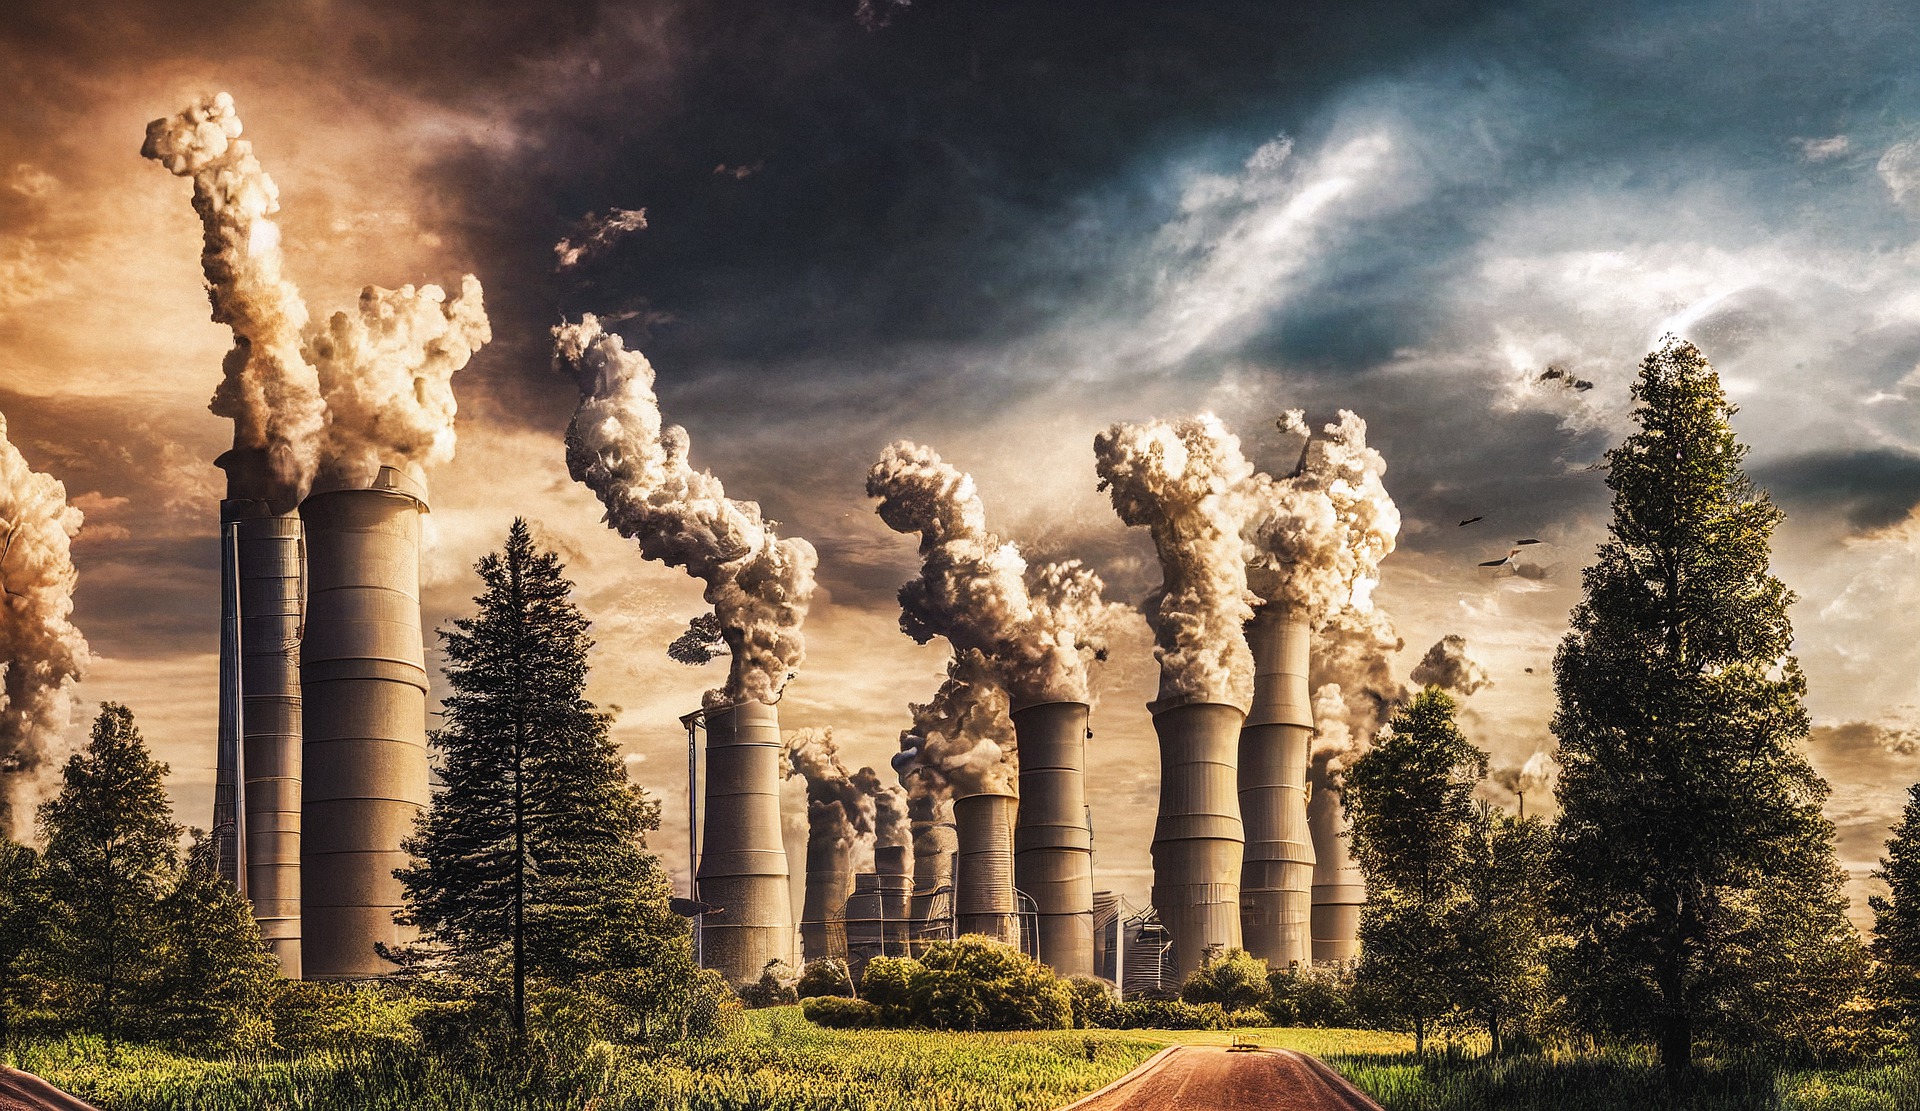
| 14:37, 27. Nov. 2022 | Rauchgas.jpg (Datei) |  |
858 KB | Dieter Kasang (Diskussion | Beiträge) | == Beschreibung == Industrielle Rauchgase als Quellen für CO2-Abscheidung == Lizenzhinweis == {| style="border:1px solid #8888aa; background-color:#f7f8ff;padding:5px;font-size:95%;" |Quelle: Pixabay, https://pixabay.com/de/photos/ai-generiert-luftverschmutzung-7573620/ Lizenz: Pixabay License, https://pixabay.com/service/license/ | 1 |
| 10:33, 27. Nov. 2022 | Oil-production-CO2.jpg (Datei) |  |
259 KB | Dieter Kasang (Diskussion | Beiträge) | == Beschreibung == Intensivierte Ölförderung durch CO2-Injektion == Lizenzhinweis == {| style="border:1px solid #8888aa; background-color:#f7f8ff;padding:5px;font-size:95%;" |Quelle: Li X-X, Yang T, Mbadinga SM, Liu J-F, Yang S-Z, Gu J-D and Mu B-Z (2017) Responses of Microbial Community Composition to Temperature Gradient and Carbon Steel Corrosion in Production Water of Petroleum Reservoir. Front. Microbiol. 8:2379. doi: 10.3389/fmicb.2017.02379 https://www.frontiersin.org/articles/10.3389/fm… | 1 |
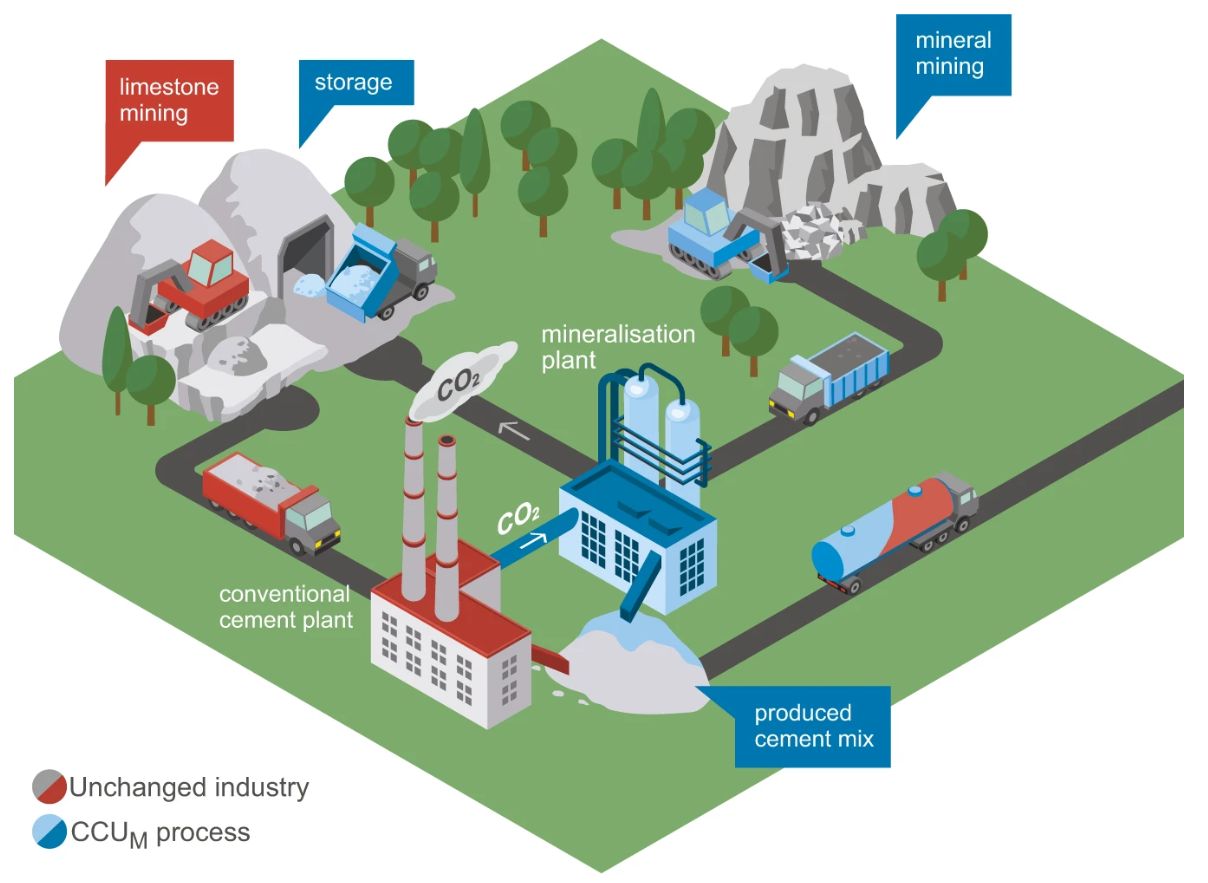
| 19:18, 19. Nov. 2022 | CO2 mineralization.jpg (Datei) |  |
92 KB | Dieter Kasang (Diskussion | Beiträge) | == Beschreibung == CO<sub>2</sub>-Quellen, indirekte und direkte Nutzung == Lizenzhinweis == {| style="border:1px solid #8888aa; background-color:#f7f8ff;padding:5px;font-size:95%;" |Quelle: Eigene Darstellung, Zeichenelemente IEA u.a.<br> Lizenz: CC BY-SA | 1 |
| 13:29, 19. Nov. 2022 | CO2-Quellen-Nutzung.jpg (Datei) |  |
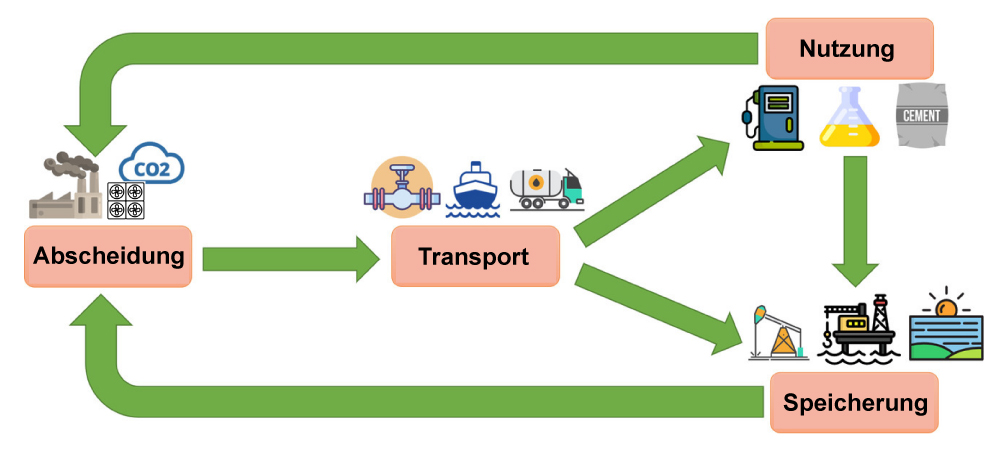
95 KB | Dieter Kasang (Diskussion | Beiträge) | == Beschreibung == Entnahme, Transport, Nutzung und Speicherung von CO2 == Lizenzhinweis == {| style="border:1px solid #8888aa; background-color:#f7f8ff;padding:5px;font-size:95%;" |Quelle: Eigene Darstellung, Zeichenelemente IEA u.a.<br> Lizenz: CC BY-SA | 1 |
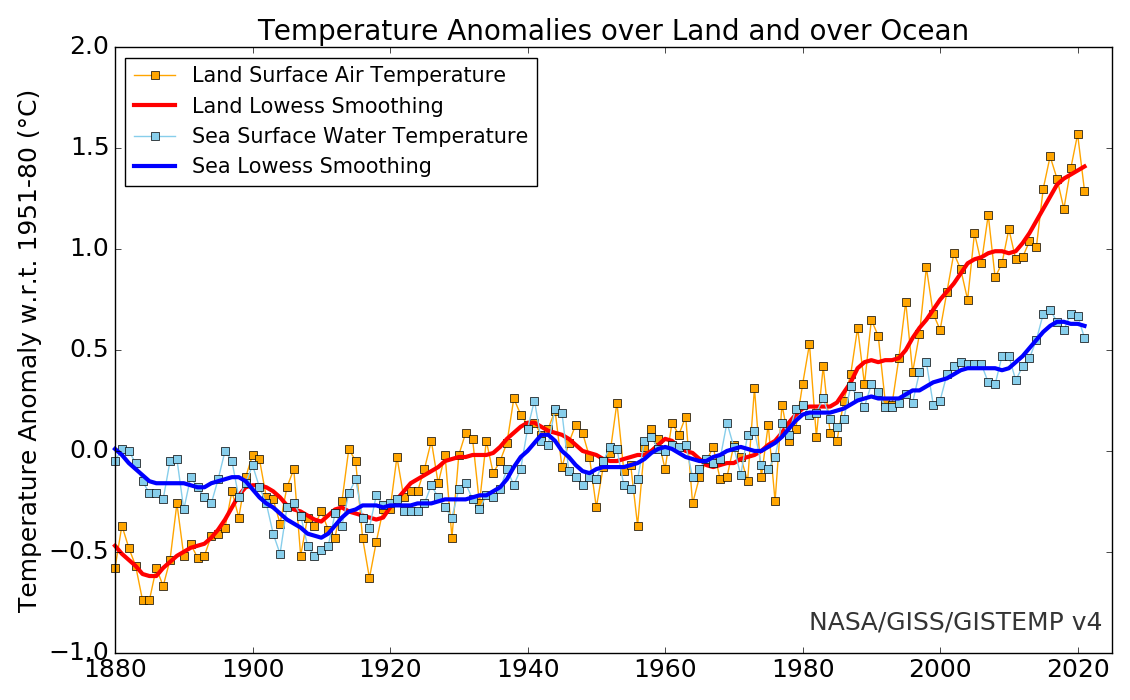
| 10:44, 17. Nov. 2022 | Land Ocean temp1880-2021.png (Datei) |  |
133 KB | Dieter Kasang (Diskussion | Beiträge) | Veränderung der globalen Oberflächentemperatur über dem Land (rot) und der Meeresoberflächentemperatur (blau) 1880-2021 im Vergleich zur Basis 1951-1980. ==Lizenzhinweis== {| style="border:1px solid #8888aa; background-color:#f7f8ff;padding:5px;font-size:95%;" | Quelle: NASA (2022): [https://data.giss.nasa.gov/gistemp/graphs_v4/ GISS Surface Temperature Analysis (v4)] <br> Lizenz: public domain |} | 1 |
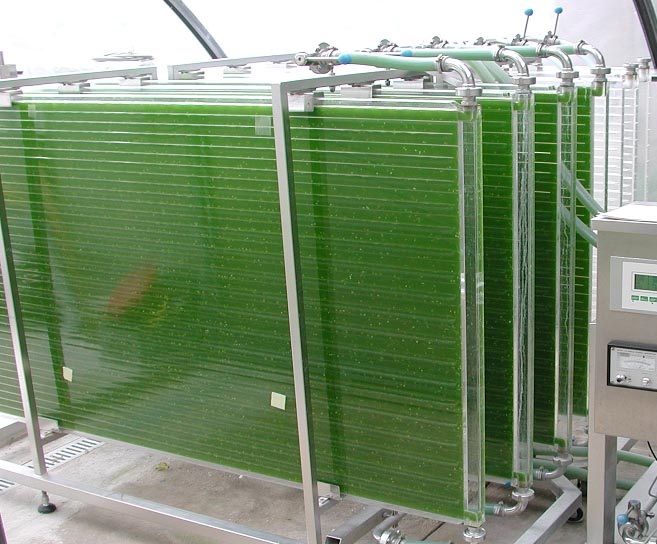
| 17:41, 14. Nov. 2022 | Photobioreactor microalgae.jpg (Datei) |  |
140 KB | Dieter Kasang (Diskussion | Beiträge) | == Beschreibung == Photobioreaktor aus Plastikplatten für die Kultivierung von Mikroalgen == Lizenzhinweis == {| style="border:1px solid #8888aa; background-color:#f7f8ff;padding:5px;font-size:95%;" |Quelle: Wikimedia Commons (2003): photobioreactor for the cultivation of microalgae, https://commons.wikimedia.org/wiki/File:Photobioreactor_PBR_500_P_IGV_Biotech.jpg <br> Lizenz: [https://creativecommons.org/licenses/by-sa/3.0/deed.en CC BY-SA] | 1 |
| 17:03, 14. Nov. 2022 | Trockeneis.jpg (Datei) |  |
131 KB | Dieter Kasang (Diskussion | Beiträge) | == Beschreibung == Trockeneis bzw. festes Kohlendioxid == Lizenzhinweis == {| style="border:1px solid #8888aa; background-color:#f7f8ff;padding:5px;font-size:95%;" |Quelle: commons.wikimedia.org/wiki/File:Trockeneis.jpg<br> Lizenz: CC BY-SA https://creativecommons.org/licenses/by-sa/3.0/deed.en | 1 |
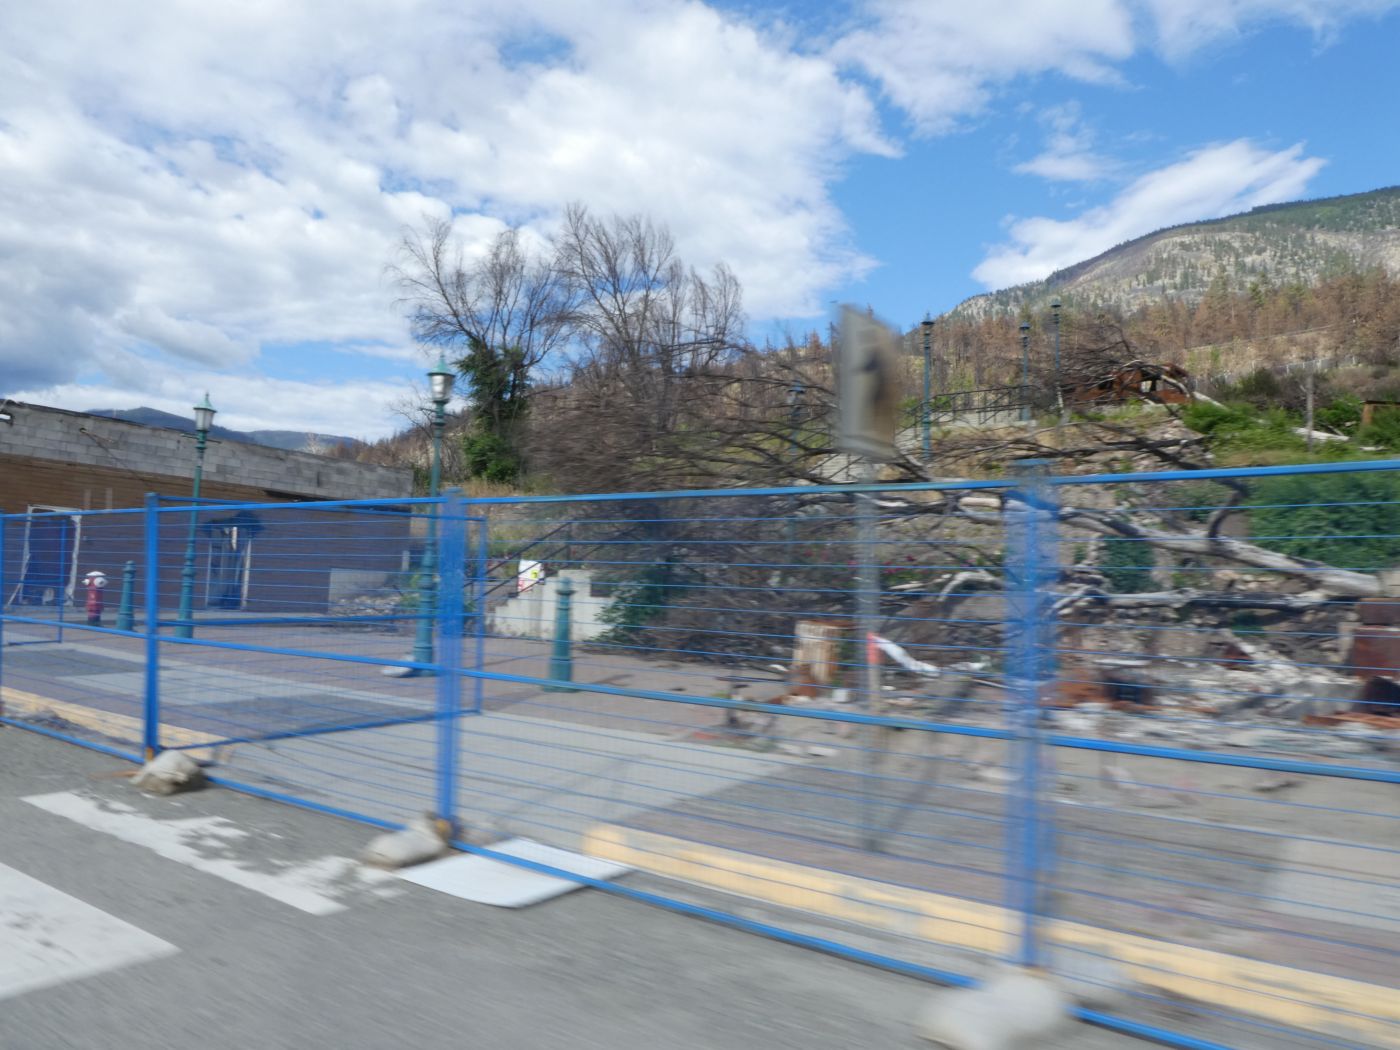
| 15:51, 13. Nov. 2022 | Lytton Juli 2022 sm.jpg (Datei) |  |
238 KB | Dieter Kasang (Diskussion | Beiträge) | Das kanadische Dorf Lytton ein Jahr nach der Vernichtung durch Hitzewelle und Waldbrand, aufgenommen aus einem vorbeifahrenden Auto im Juli 2022. ==Lizenzhinweis== {| style="border:1px solid #8888aa; background-color:#f7f8ff;padding:5px;font-size:95%;" | Quelle: FoTo: Jörg Fischer <br /> Lizenz: CC BY-SA |} | 1 |
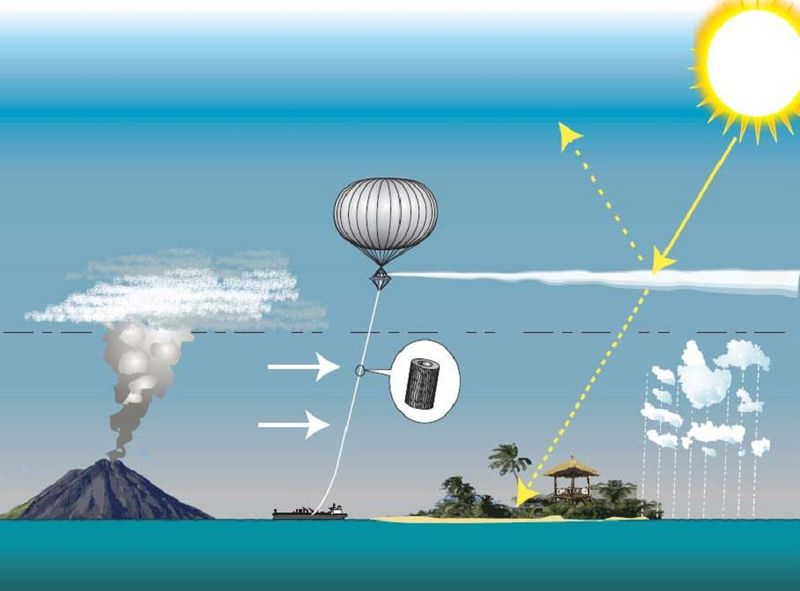
| 09:57, 13. Nov. 2022 | SPICE SRM overview.jpg (Datei) |  |
43 KB | Dieter Kasang (Diskussion | Beiträge) | == Beschreibung == Stratosphärische Aerosol-Injektion in Anlehnung an die Wirkung von Vulkanausbrüchen. == Lizenzhinweis == {| style="border:1px solid #8888aa; background-color:#f7f8ff;padding:5px;font-size:95%;" |Quelle: Wikimedia Commons (2011): SPICE SRM, https://commons.wikimedia.org/wiki/File:SPICE_SRM_overview.jpg Lizenz: CC BY-SA https://creativecommons.org/licenses/by-sa/3.0/deed.en |} | 1 |
| 16:52, 12. Nov. 2022 | Entnahme-Transport-Nutzung.jpg (Datei) | 96 KB | Dieter Kasang (Diskussion | Beiträge) | == Beschreibung == Entnahme, Transport, Nutzung und Speicherung von CO2 == Lizenzhinweis == {| style="border:1px solid #8888aa; background-color:#f7f8ff;padding:5px;font-size:95%;" |Quelle: Eigene Darstellung, Dieter Kasang<br> Lizenz: CC BY-SA | 1 | |
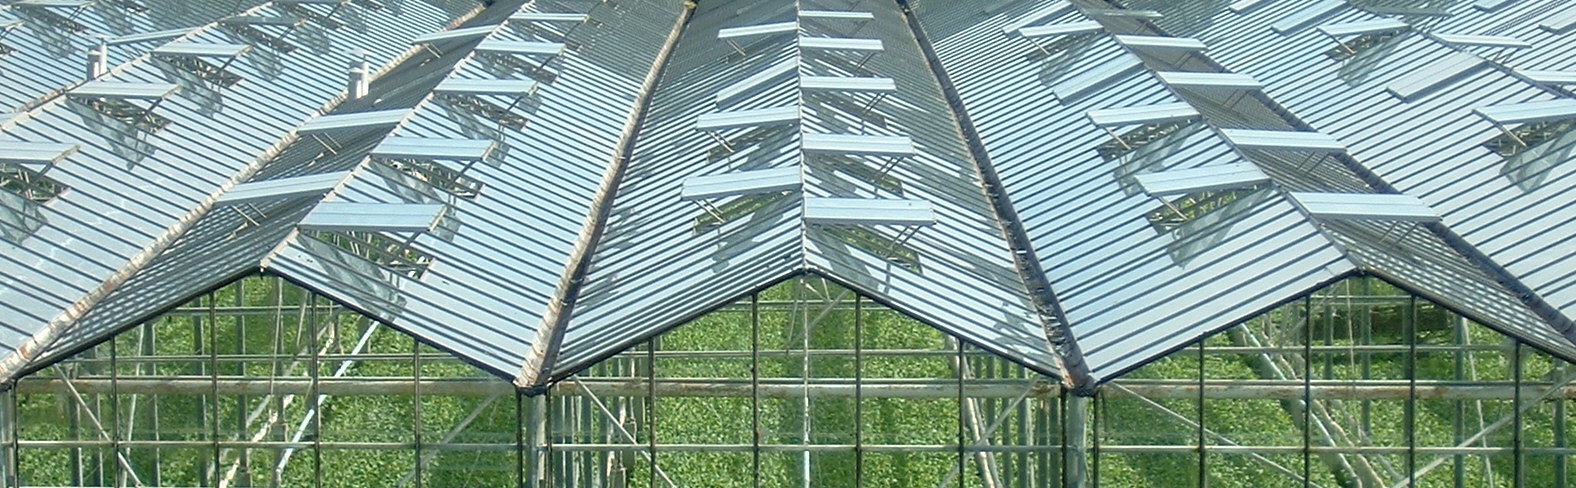
| 20:17, 11. Nov. 2022 | Treibhaus Niederlande.jpg (Datei) |  |
422 KB | Dieter Kasang (Diskussion | Beiträge) | == Beschreibung == Treibhaus in den Niederlanden == Lizenzhinweis == {| style="border:1px solid #8888aa; background-color:#f7f8ff;padding:5px;font-size:95%;" |Quelle: Wikimedia Commons (2005): Netherlands: Westland - greenhouses. https://commons.wikimedia.org/wiki/File:Westland_kassen.jpg <br> Lizenz: CC BY-SA | 1 |
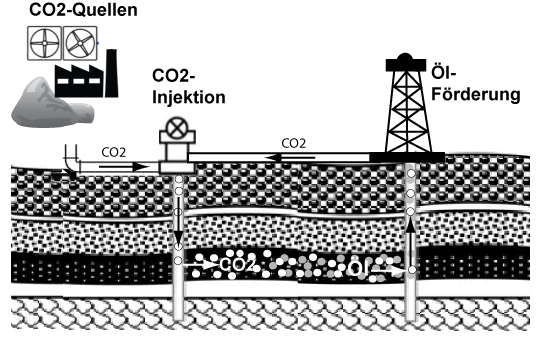
| 20:01, 11. Nov. 2022 | OER-dt.jpg (Datei) |  |
106 KB | Dieter Kasang (Diskussion | Beiträge) | == Beschreibung == Tertiäre Ölförderung durch CO2-Injektion == Lizenzhinweis == {| style="border:1px solid #8888aa; background-color:#f7f8ff;padding:5px;font-size:95%;" |Quelle: Eigene Darstellung, Dieter Kasang<br> Lizenz: CC BY-SA | 1 |
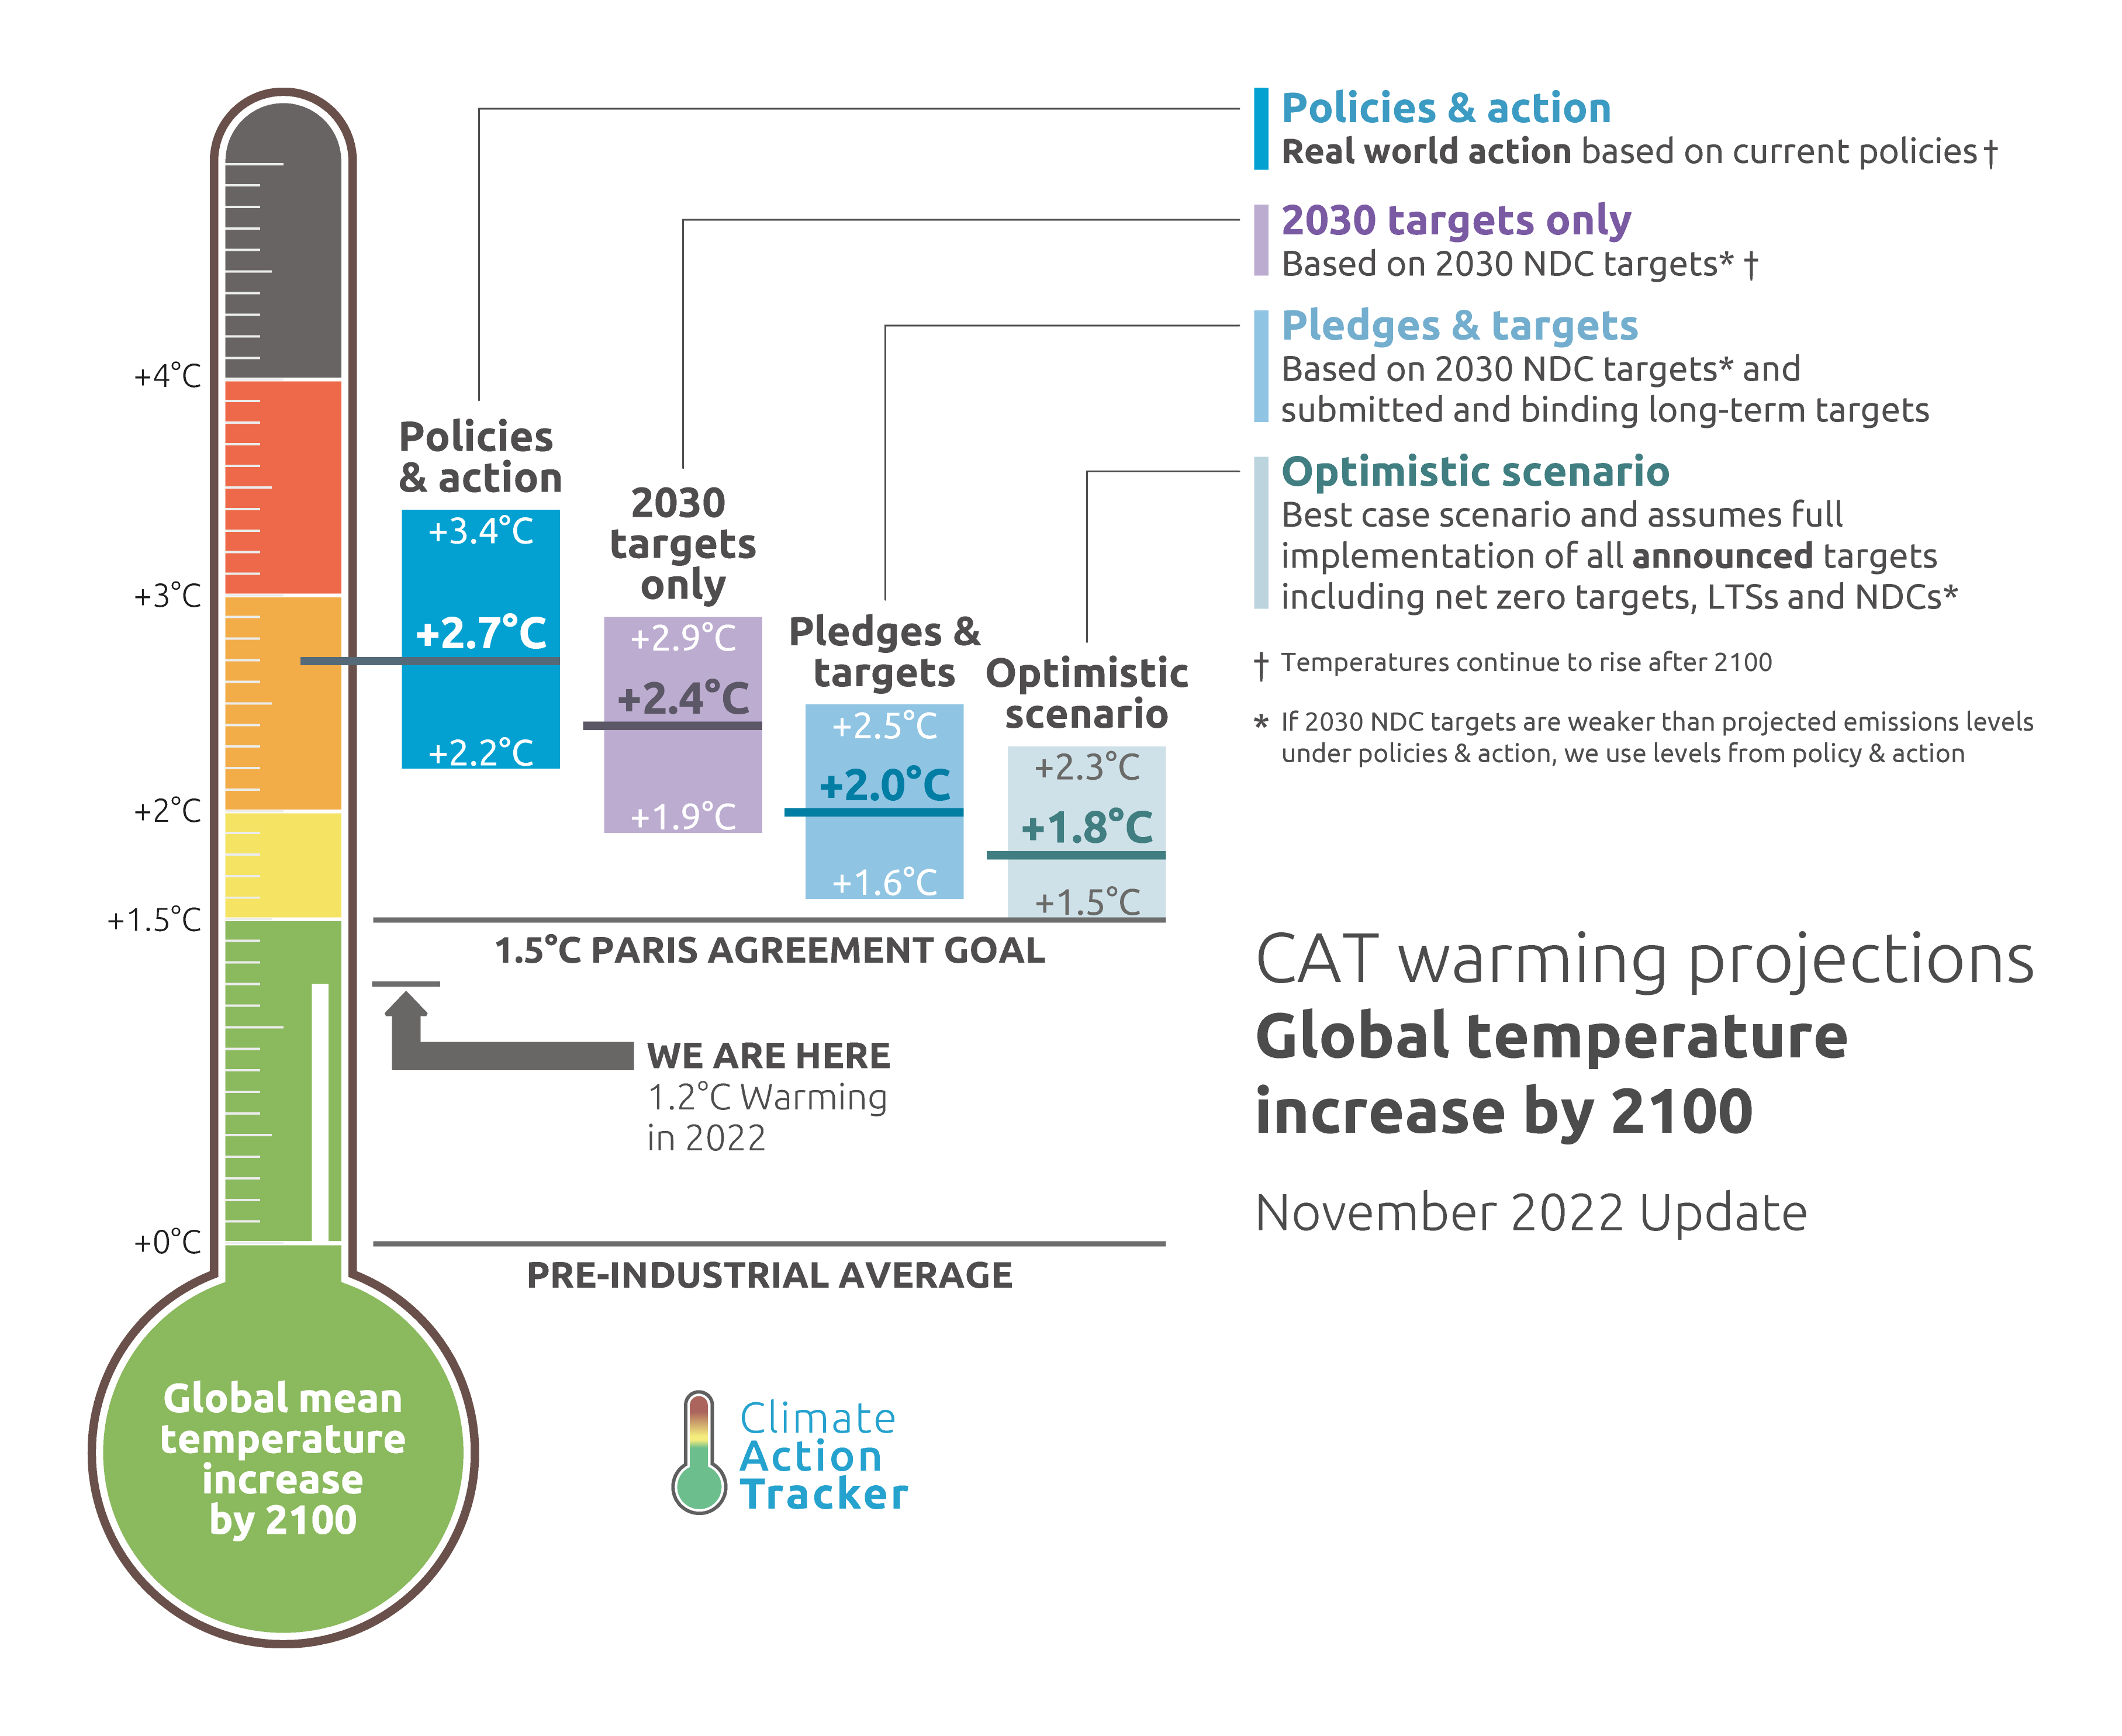
| 10:04, 11. Nov. 2022 | CAT-Thermometer-2022.11.png (Datei) |  |
234 KB | Dieter Kasang (Diskussion | Beiträge) | Pariser Klimaziele und die aktuelle Klimapolitik: Die Erwärmung gegenüber der vorindustriellen Zeit liegt gegenwärtig bei +1,2 °C. Die Beschlüsse der Klimakonferenz von Paris 2015 streben eine Erwärmung von 1,5 °C, höchstens 2 °C bis 2100 an. Die aktuelle Klimapolitik steuert auf eine Erwärmung von ca. 2,7 °C zu. Die seit der Pariser Konferenz übernommenen Verpflichtungen der einzelnen Staaten bis 2030 laufen auf eine Erwärmung von ca. 2,4 °C, die langfristigen Zusagen und Ziele auf 2,0 °C hina… | 1 |
| 09:32, 11. Nov. 2022 | CO2-capture-storage-utilisation.jpg (Datei) |  |
130 KB | Dieter Kasang (Diskussion | Beiträge) | == Beschreibung == Abscheidung, Transport, Nutzung und Speicherung von CO2 == Lizenzhinweis == {| style="border:1px solid #8888aa; background-color:#f7f8ff;padding:5px;font-size:95%;" |Quelle: Hong, W.Y. (2022): A techno-economic review on carbon capture, utilisation and storage systems for achieving a net-zero CO2 emissions future, Carbon Capture Science & Technology 3, https://doi.org/10.1016/j.ccst.2022.100044<br> Lizenz: Lizenz: [http://creativecommons.org/licenses/by/4.0/ CC BY] | 1 |
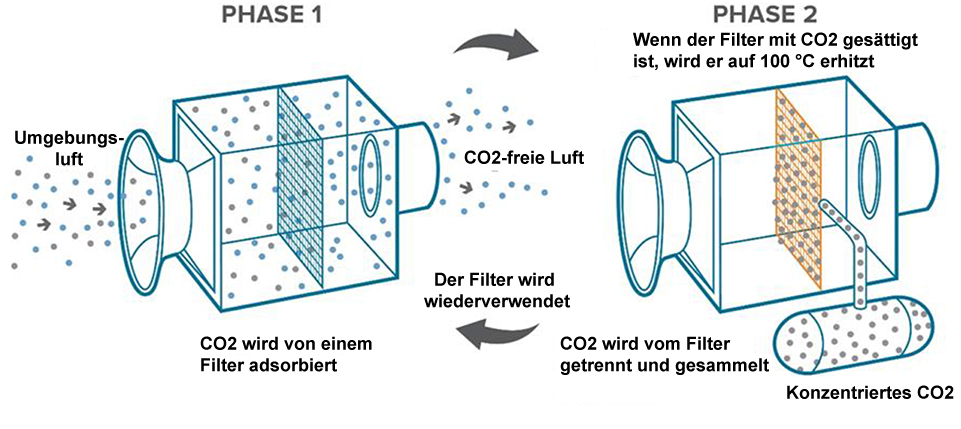
| 20:01, 10. Nov. 2022 | Direct-air-capture-phase-dt.jpg (Datei) |  |
213 KB | Dieter Kasang (Diskussion | Beiträge) | == Beschreibung == Darstellung der zwei Phasen des Direct Air Capture (DAC) == Lizenzhinweis == {| style="border:1px solid #8888aa; background-color:#f7f8ff;padding:5px;font-size:95%;" |Quelle: Beuttler, C., L. Charles and J. Wurzbacher (2019): The Role of Direct Air Capture in Mitigation of Anthropogenic Greenhouse Gas Emissions. Front. Clim. 1:10. doi: 10.3389/fclim.2019.00010 https://www.frontiersin.org/articles/10.3389/fclim.2019.00010/full Lizenz: Lizenz: CC BY http://creativecommons.org/… | 1 |
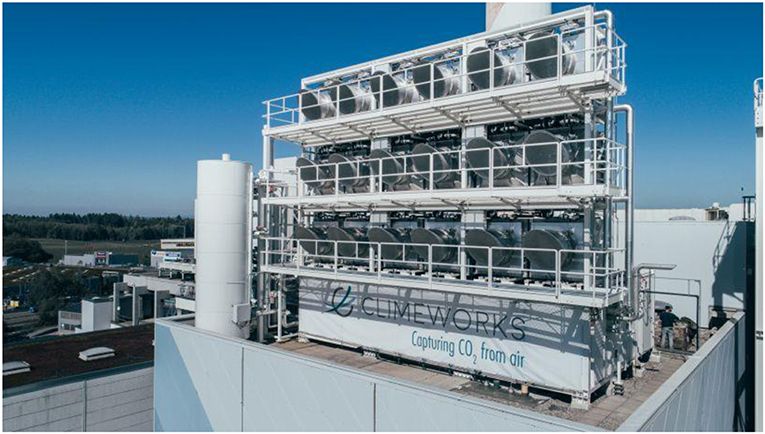
| 17:30, 30. Okt. 2022 | Direct air capture Hinwil.jpg (Datei) |  |
70 KB | Dieter Kasang (Diskussion | Beiträge) | == Beschreibung == CO2-Abscheidung aus der Umgebungsluft, Schweiz. == Lizenzhinweis == {| style="border:1px solid #8888aa; background-color:#f7f8ff;padding:5px;font-size:95%;" |Quelle: Beuttler, C., L. Charles, J. Wurzbacher (2019): The Role of Direct Air Capture in Mitigation of Anthropogenic Greenhouse Gas Emissions, Frontiers in Climate, https://www.frontiersin.org/articles/10.3389/fclim.2019.00010 Lizenz: [http://creativecommons.org/licenses/by/4.0/ CC BY] | 1 |
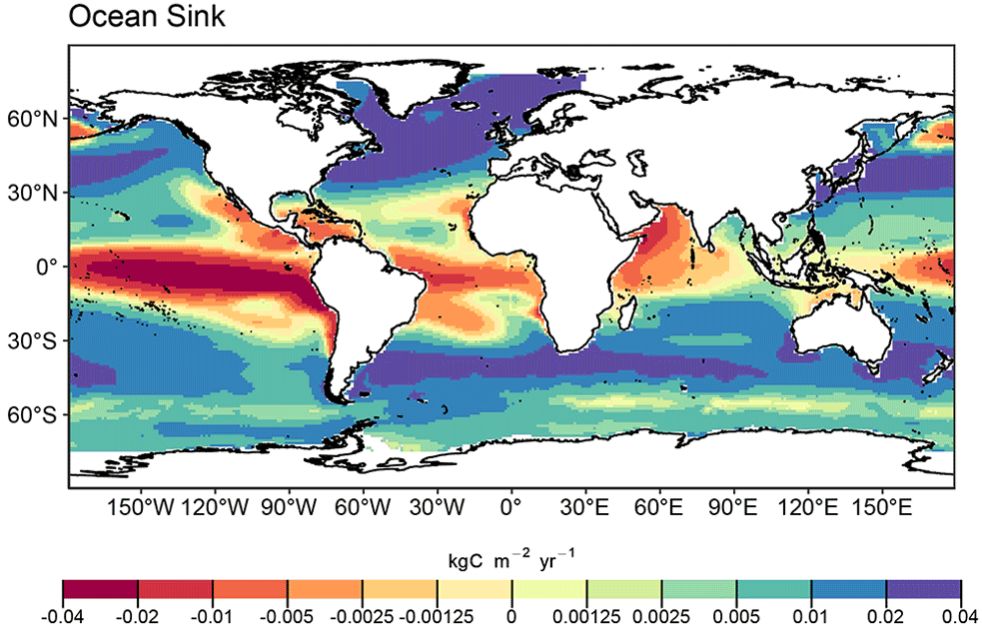
| 18:22, 15. Okt. 2022 | Ocean CO2 sink.jpg (Datei) |  |
103 KB | Dieter Kasang (Diskussion | Beiträge) | == Beschreibung == Die ozeanische anthropogene Kohlenstoffsenke als Mittel des Jahrzehnts 2011-2020 in kg C/m2/Jahr. Grüne bis blaue Farben zeigen CO2-Flüsse von der Atmosphäre in den Ozean, gelbe bis rote Farben vom Ozean in die Atmosphäre ==Lizenzhinweis== {| style="border:1px solid #8888aa; background-color:#f7f8ff;padding:5px;font-size:95%;" | Quelle: Friedlingstein, P., M.W.Jones, M. O'Sullivan et al. (2022): Global Carbon Budget 2021, Earth Syst. Sci. Data, 14, 1917–2005, https://doi.or… | 1 |
| 18:13, 15. Okt. 2022 | C fluxes-geological-dt.jpg (Datei) |  |
255 KB | Dieter Kasang (Diskussion | Beiträge) | == Beschreibung == Kohlenstoffaustausch zwischen den geologischen und den oberflächennahen Speichern ==Lizenzhinweis== {| style="border:1px solid #8888aa; background-color:#f7f8ff;padding:5px;font-size:95%;" | Quelle: Flickr (2019): [https://www.flickr.com/photos/deepcarbonobservatory/49012926183/in/album-72157654648898790/ Deep Carbon]<br> Lizenz: [https://creativecommons.org/licenses/by-sa/2.0/ CC BY]; eigene Beschriftung |} | 1 |
| 18:08, 15. Okt. 2022 | Deep-carbon-3.jpg (Datei) |  |
126 KB | Dieter Kasang (Diskussion | Beiträge) | Kohlenstoffaustausch zwischen den geologischen und den oberflächennahen Speichern ==Lizenzhinweis== {| style="border:1px solid #8888aa; background-color:#f7f8ff;padding:5px;font-size:95%;" | Quelle: Flickr (2019): Deep Carbon, https://www.flickr.com/photos/deepcarbonobservatory/49012926183/in/album-72157654648898790/ Lizenz: CC BY https://creativecommons.org/licenses/by-sa/2.0/; eigene Beschriftung <br> Lizenz: NASA public domain |} | 1 |
| 16:37, 19. Sep. 2022 | S-Asia wet days SSP5-8.5.jpg (Datei) |  |
53 KB | Dieter Kasang (Diskussion | Beiträge) | == Beschreibung == Änderung der Anzahl der Tage mit Niederschlägen von >1 mm („feuchte Tage“) während des Sommer-Monsuns zwischen 1965-2015 und 2050-2100 == Lizenzhinweis == {| style="border:1px solid #8888aa; background-color:#f7f8ff;padding:5px;font-size:95%;" |Quelle: Katzenberger, A., Levermann, A., Schewe, J., & Pongratz, J. (2022): Intensification of very wet monsoon seasons in India under global warming. Geophysical Research Letters, 49, e2022GL098856. https://doi.org/10.1029/2022GL09885… | 1 |
| 16:32, 19. Sep. 2022 | Indian Monsoon rain 1860-2090.png (Datei) |  |
338 KB | Dieter Kasang (Diskussion | Beiträge) | == Beschreibung == Änderung der Niederschläge während des Indischen Sommermonsuns 1860-2090 in mm/Tag nach verschiedenen Szanarien im Vergleich zum Mittel 1985-2015 == Lizenzhinweis == {| style="border:1px solid #8888aa; background-color:#f7f8ff;padding:5px;font-size:95%;" |Quelle: Katzenberger, A., Schewe, J., Pongratz, J., and Levermann, A. (2021): [https://doi.org/10.5194/esd-12-367-2021 Robust increase of Indian monsoon rainfall and its variability under future warming in CMIP6 models], Ear… | 1 |
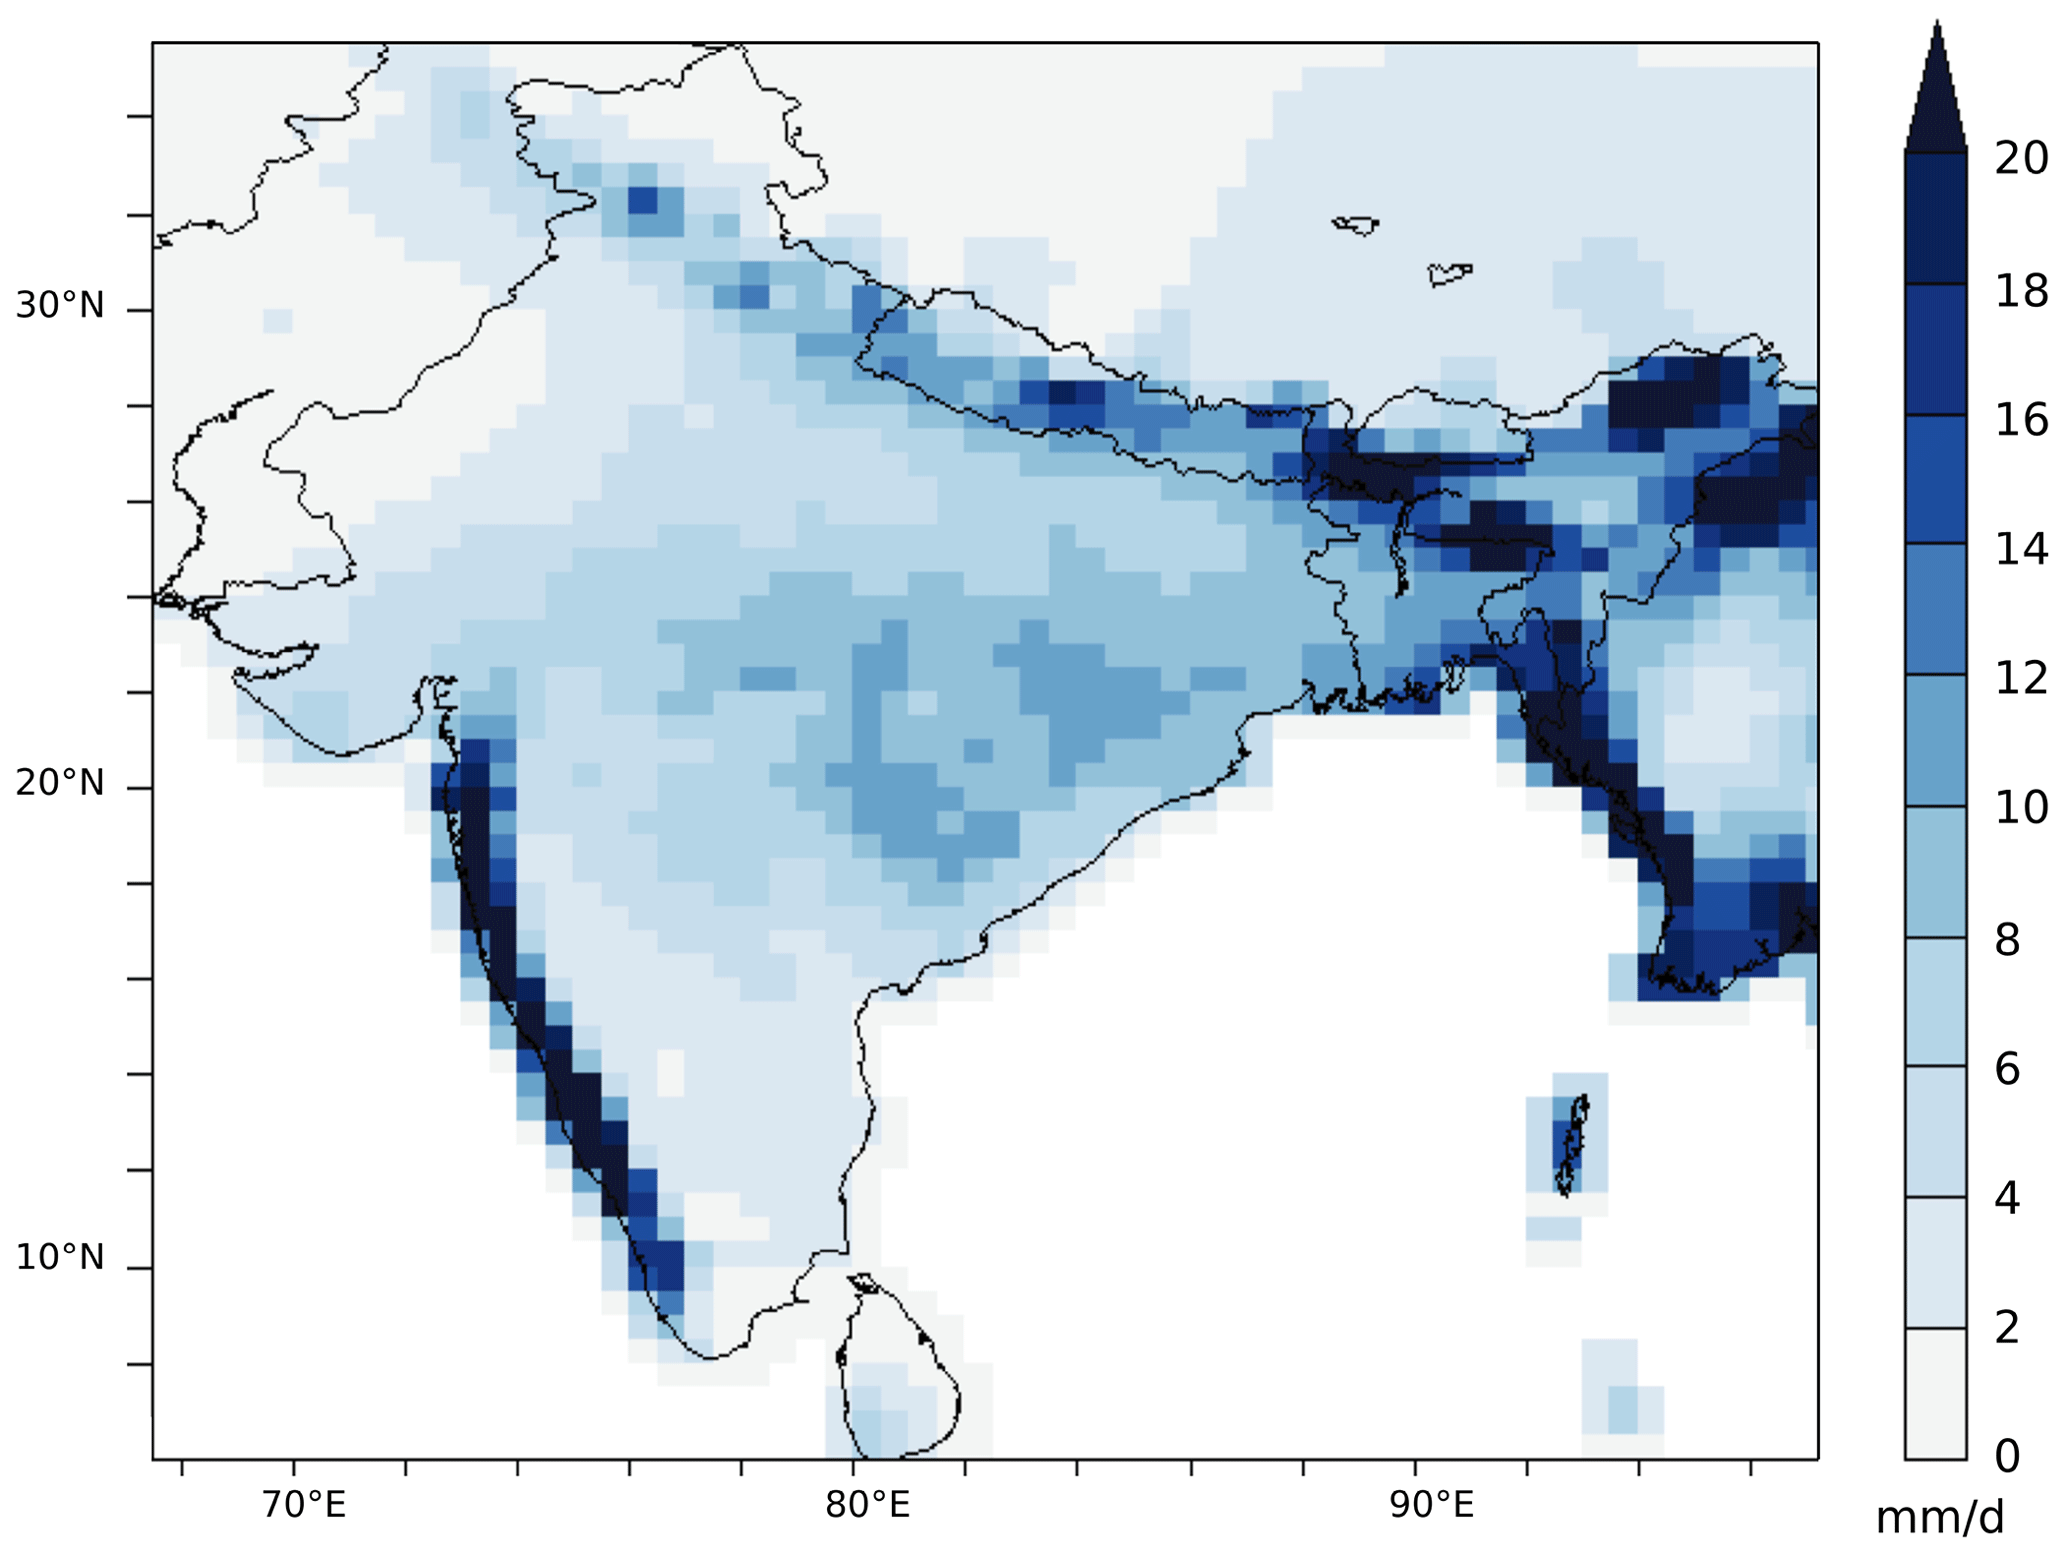
| 16:26, 19. Sep. 2022 | Indian Monsoon prec 1985-2015.png (Datei) |  |
178 KB | Dieter Kasang (Diskussion | Beiträge) | == Beschreibung == Räumliche Verteilung der Niederschläge während des Indischen Sommermonsuns 1985-2015 in mm/Tag == Lizenzhinweis == {| style="border:1px solid #8888aa; background-color:#f7f8ff;padding:5px;font-size:95%;" |Quelle: Katzenberger, A., Schewe, J., Pongratz, J., and Levermann, A. (2021): Robust increase of Indian monsoon rainfall and its variability under future warming in CMIP6 models, Earth Syst. Dynam., 12, 367–386, https://doi.org/10.5194/esd-12-367-2021<br> Lizenz: CC BY https… | 1 |
| 16:23, 19. Sep. 2022 | S-Asia monsoon prec2100.jpg (Datei) |  |
123 KB | Dieter Kasang (Diskussion | Beiträge) | == Beschreibung == Änderung der Monsun-Niederschläge in mm/Tag 1950 bis 2100 im Vergleich zum Mittel 1995-2014 == Lizenzhinweis == {| style="border:1px solid #8888aa; background-color:#f7f8ff;padding:5px;font-size:95%;" |Quelle: Qing-Yuan Wu, Qing-Quan Li, Yi-Hui Ding et al. (2022): Asian summer monsoon responses to the change of land‒sea thermodynamic contrast in a warming climate: CMIP6 projections, Advances in Climate Change Research, 10.1016/j.accre.2022.01.001, 13, 2, (205-217)<br> Lizenz:… | 1 |
| 16:18, 19. Sep. 2022 | S-Asia monsoon dynamic2100.jpg (Datei) |  |
111 KB | Dieter Kasang (Diskussion | Beiträge) | Änderung der Monsun-Zirkulation in m/sec 1950 bis 2100 im Vergleich zum Mittel 1995-2014 == Lizenzhinweis == {| style="border:1px solid #8888aa; background-color:#f7f8ff;padding:5px;font-size:95%;" |Quelle: Qing-Yuan Wu, Qing-Quan Li, Yi-Hui Ding et al. (2022): Asian summer monsoon responses to the change of land‒sea thermodynamic contrast in a warming climate: CMIP6 projections, Advances in Climate Change Research, 10.1016/j.accre.2022.01.001, 13, 2, (205-217) <br> Lizenz: CC BY-NC-ND https://… | 1 |
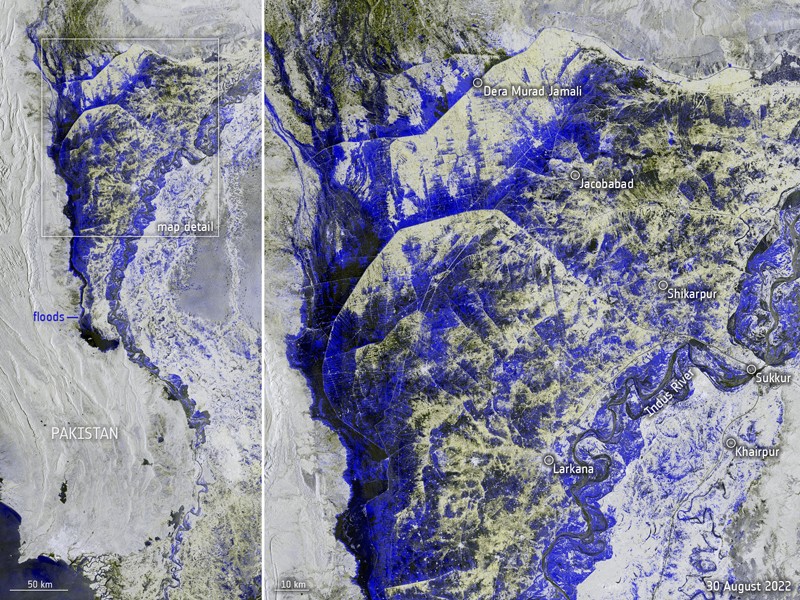
| 15:13, 19. Sep. 2022 | Pakistan 2022 flooding.jpg (Datei) |  |
230 KB | Dieter Kasang (Diskussion | Beiträge) | Überschwemmungen in Pakistan 2022 ==Lizenzhinweis== {| style="border:1px solid #8888aa; background-color:#f7f8ff;padding:5px;font-size:95%;" | Quelle: Nature (2022): Why are Pakistan’s floods so extreme this year? https://www.nature.com/articles/d41586-022-02813-6 <br> Lizenz: CC BY-SA https://creativecommons.org/licenses/by-sa/3.0/igo/ |} | 1 |
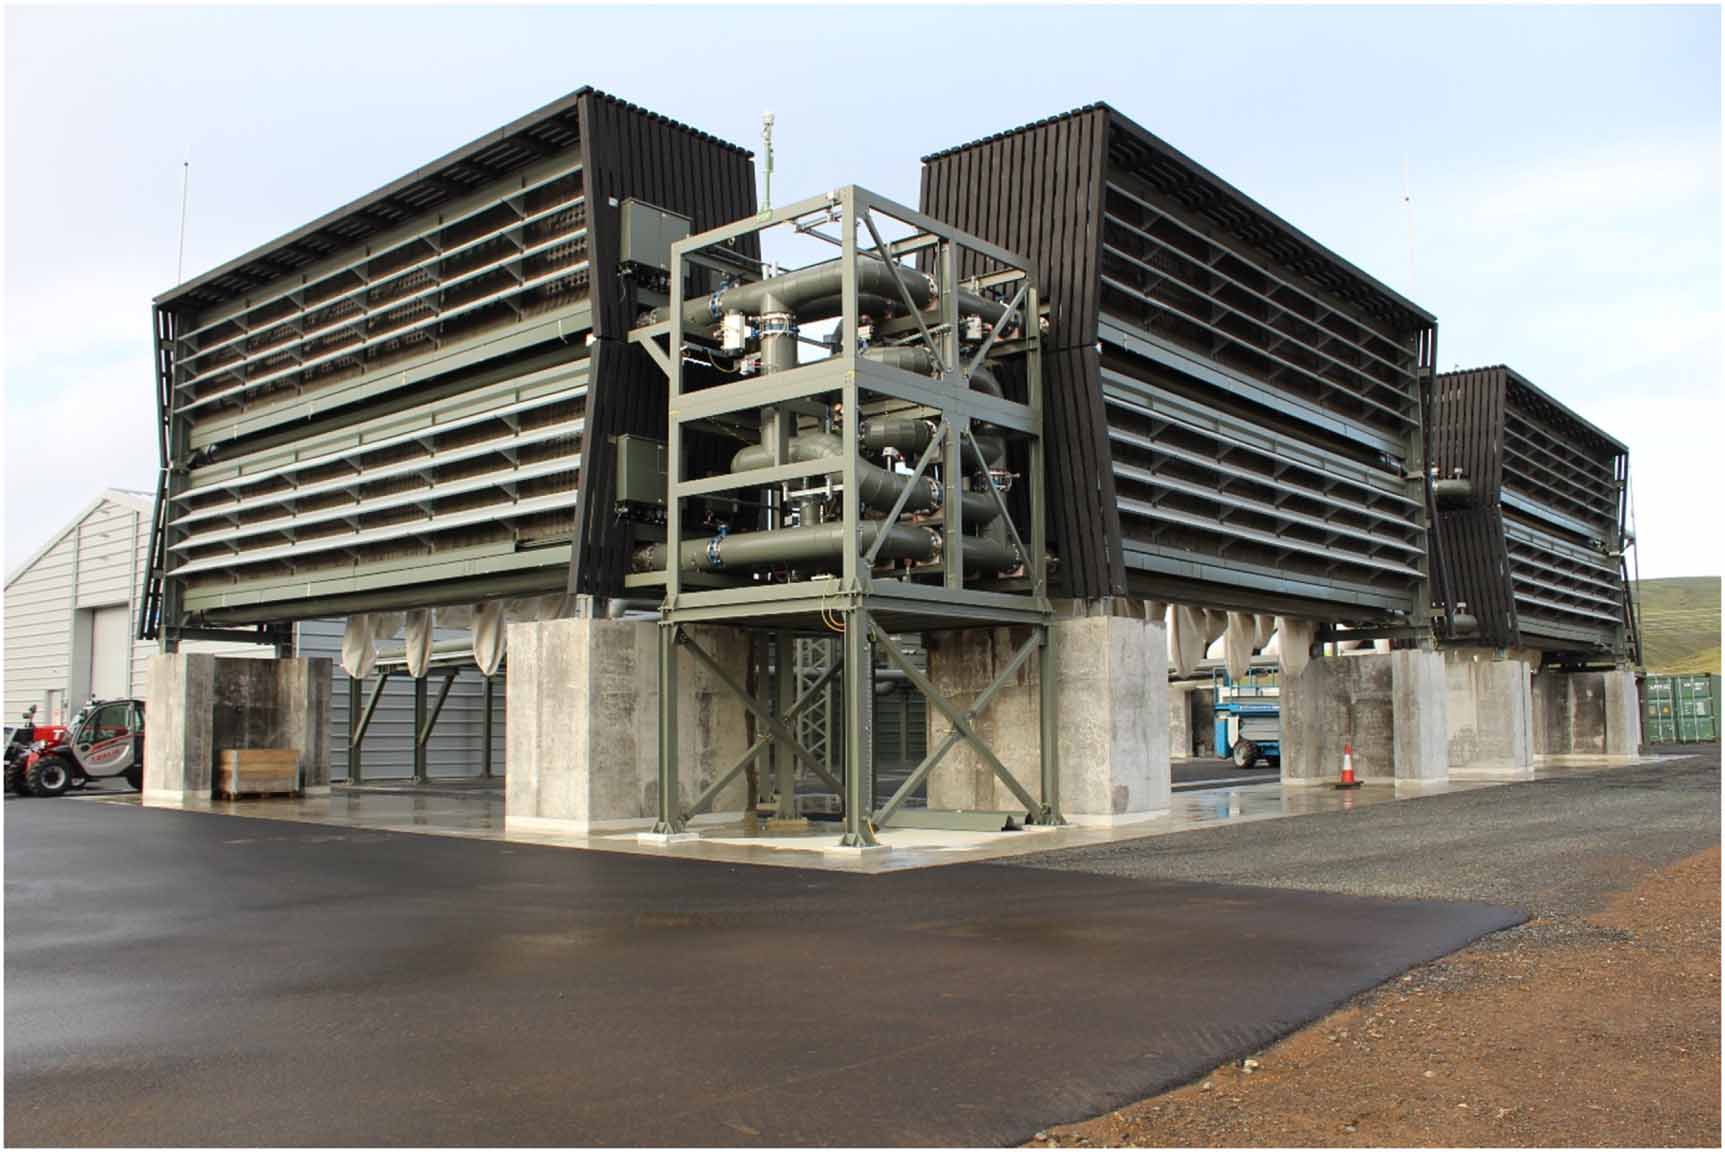
| 12:09, 17. Sep. 2022 | Direct Air Capture Iceland.jpg (Datei) |  |
151 KB | Dieter Kasang (Diskussion | Beiträge) | == Beschreibung == Abscheidung von atmosphärischem CO2 direkt aus der Umgebungsluft auf Island == Lizenzhinweis == {| style="border:1px solid #8888aa; background-color:#f7f8ff;padding:5px;font-size:95%;" |Quelle: : Sovacool, B.K., C.M. Baum, S. Low et al. (2022): Environ. Res. Lett. 17 074014, https://iopscience.iop.org/article/10.1088/1748-9326/ac77a4 Lizenz: [http://creativecommons.org/licenses/by/4.0/ CC BY] | 1 |
| 11:20, 17. Sep. 2022 | Enhanced weathering ocean alkalinity.jpg (Datei) |  |
288 KB | Dieter Kasang (Diskussion | Beiträge) | == Beschreibung == Methoden zur CO2-Speicherung == Lizenzhinweis == {| style="border:1px solid #8888aa; background-color:#f7f8ff;padding:5px;font-size:95%;" |Quelle: Bach LT, Gill SJ, Rickaby REM, Gore S and Renforth P (2019): CO2 Removal with Enhanced Weathering and Ocean Alkalinity Enhancement: Potential Risks and Co-benefits for Marine Pelagic Ecosystems. Front. Clim. 1:7. doi: 10.3389/fclim.2019.00007 Lizenz: CC BY http://creativecommons.org/licenses/by/4.0/ | 1 |
| 09:24, 17. Sep. 2022 | Capturing CO2.jpg (Datei) |  |
36 KB | Dieter Kasang (Diskussion | Beiträge) | == Beschreibung == Methoden zur CO2-Speicherung == Lizenzhinweis == {| style="border:1px solid #8888aa; background-color:#f7f8ff;padding:5px;font-size:95%;" |Quelle: Snæbjörnsdóttir S, Steinþórsdóttir K, Snorradóttir S and Helgason K (2021): Protecting Our Climate by Turning CO2 Into Stone. Front. Young Minds. 9:579895. doi: 10.3389/frym.2021.579895: https://kids.frontiersin.org/articles/10.3389/frym.2021.579895 Lizenz: [http://creativecommons.org/licenses/by/4.0/ CC BY] |} | 1 |
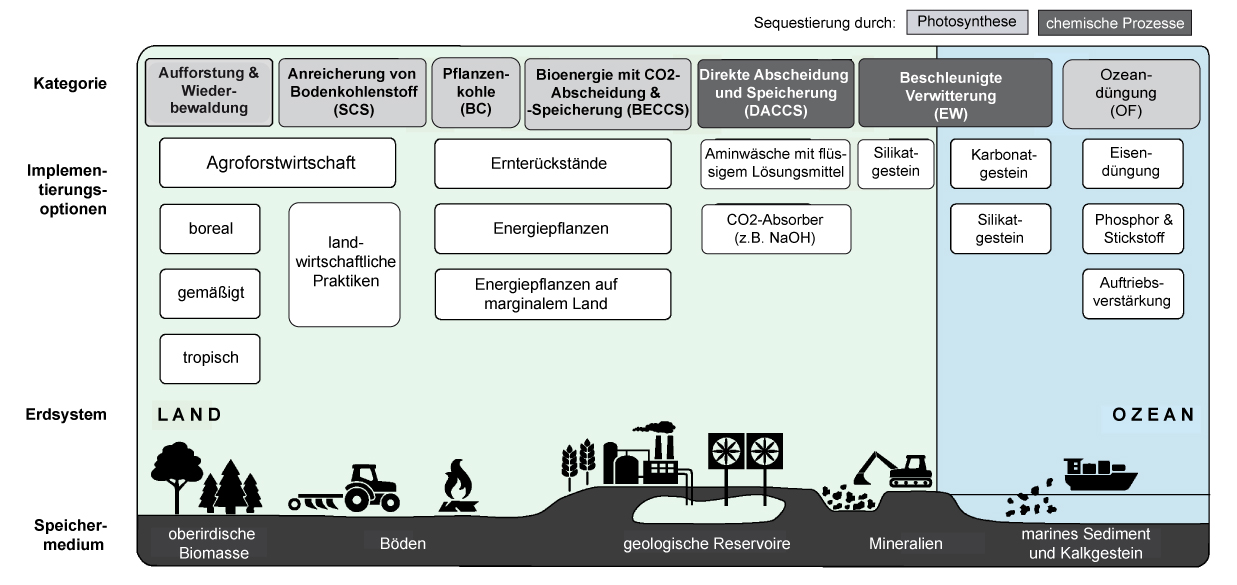
| 09:17, 17. Sep. 2022 | CDR methods.jpg (Datei) |  |
204 KB | Dieter Kasang (Diskussion | Beiträge) | == Beschreibung == Methoden des Carbon Dioxid Removal (CDR) == Lizenzhinweis == {| style="border:1px solid #8888aa; background-color:#f7f8ff;padding:5px;font-size:95%;" |Quelle: : Lawrence, M.G., Schäfer, S., Muri, H. et al. (2018): Evaluating climate geoengineering proposals in the context of the Paris Agreement temperature goals. Nat Commun 9, 3734 https://doi.org/10.1038/s41467-018-05938-3 Lizenz: CC BY http://creativecommons.org/licenses/by/4.0/ |} | 1 |
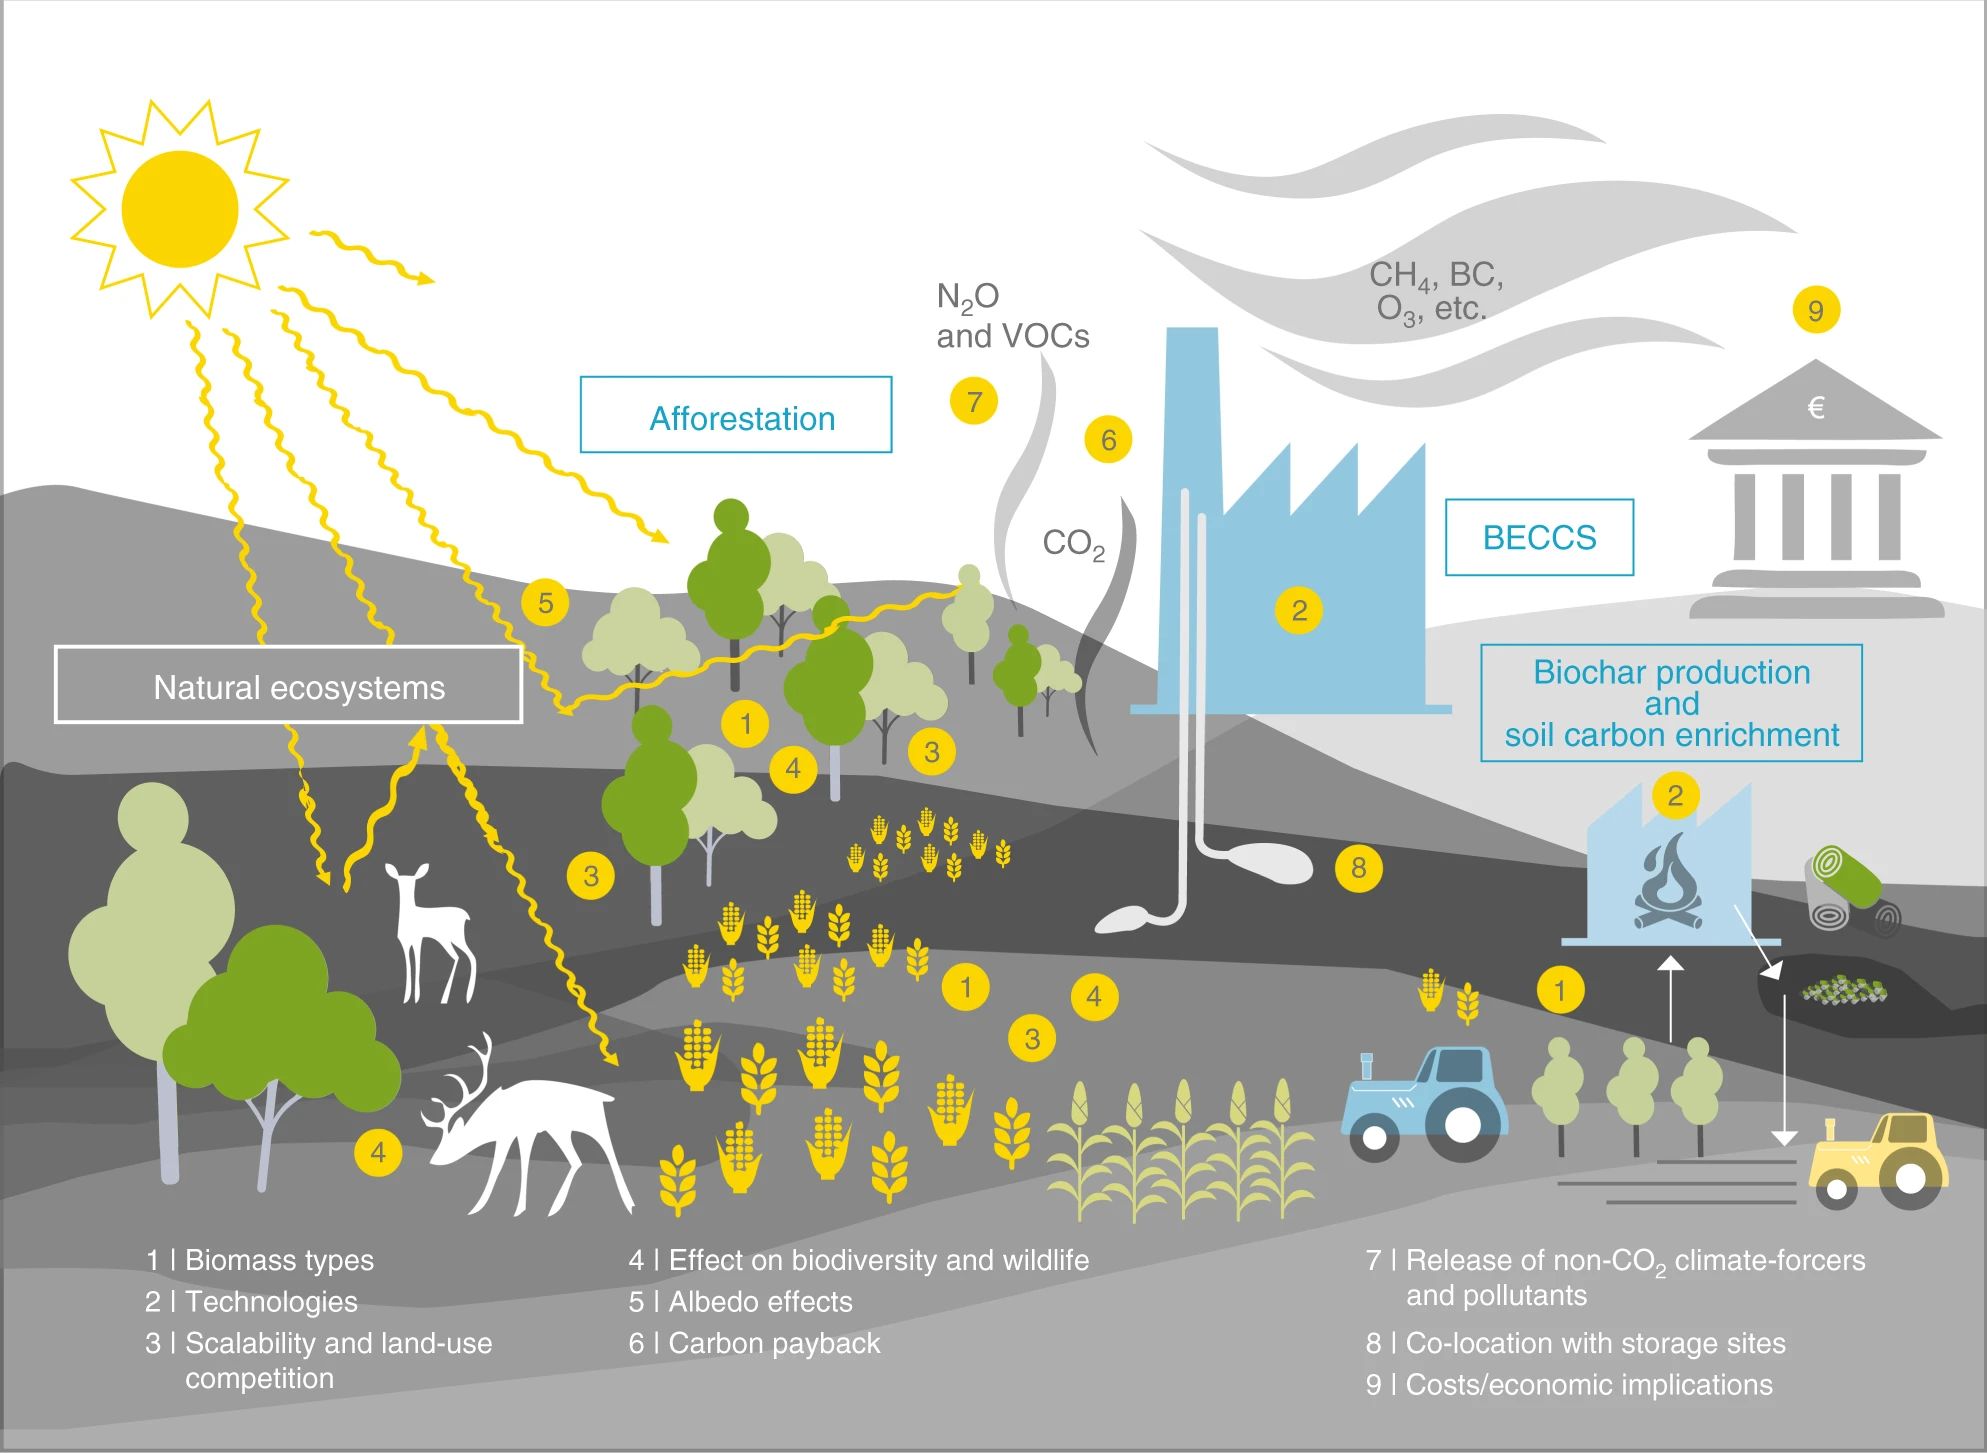
| 09:13, 17. Sep. 2022 | Negative-emissionen.jpg (Datei) |  |
216 KB | Dieter Kasang (Diskussion | Beiträge) | == Beschreibung == Übersicht über Verfahren der negativen Emissionen == Lizenzhinweis == {| style="border:1px solid #8888aa; background-color:#f7f8ff;padding:5px;font-size:95%;" |Quelle: Minx, J. C., Lamb, W. F., Callaghan, M. W., Fuss, S., et al. (2018): Negative emissions—Part 1: Research landscape and synthesis. Environmental Research Letters, 13(6), 063001. https://doi.org/10.1088/1748-9326/aabf9b; verändert und übersetzt Lizenz: CC BY http://creativecommons.org/licenses/by/3.0/ |} | 1 |
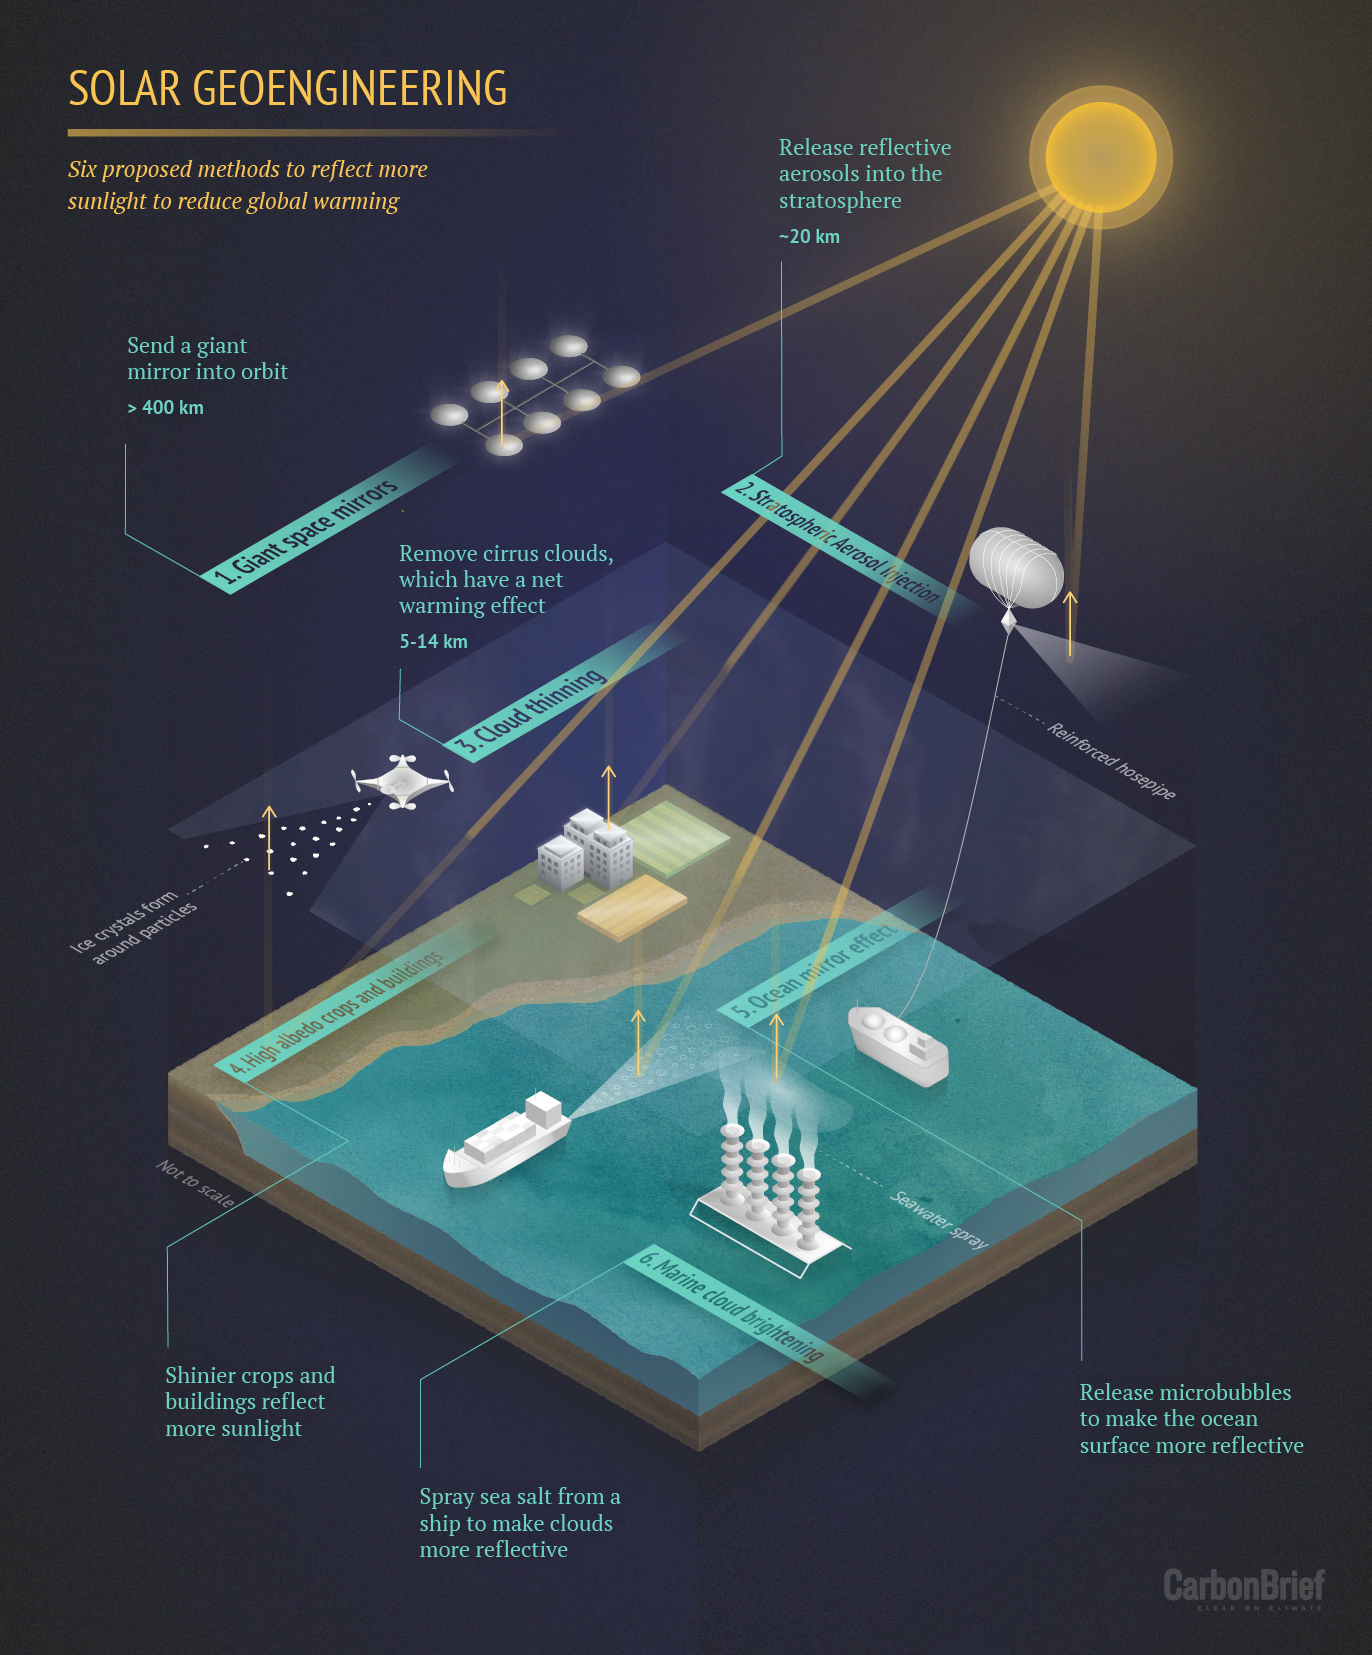
| 09:03, 17. Sep. 2022 | Solar-geoengineering.jpg (Datei) |  |
1,33 MB | Dieter Kasang (Diskussion | Beiträge) | Climate Engineering durch Verringerung der Solarstrahlung: 6 Methoden zur Reflexion von Solarstrahlung. 1. Spiegel im Weltall, 2. Injektion von Schwefeldioxid in die Stratosphäre, 3. Ausdünnung von Cirruswolken, 4. Erhöhung der Albedo von Feldern und Gebäuden, 5. Erhöhung der Albedo der Meeresoberfläche (durch Aussprühen von Mikrobläschen), 6. Aufhellung mariner Schichtwolken == Lizenzhinweis == {| style="border:1px solid #8888aa; background-color:#f7f8ff;padding:5px;font-size:95%;" |Quelle: Ca… | 1 |
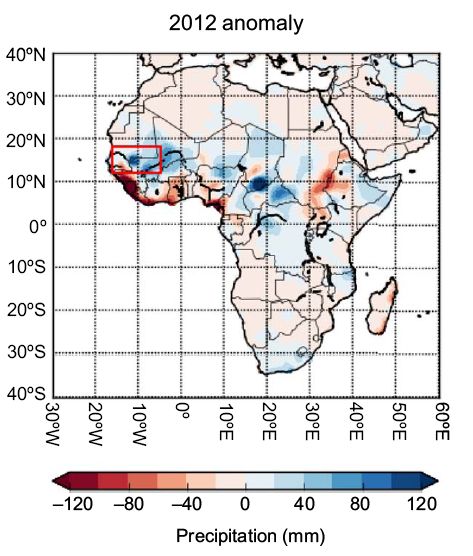
| 09:52, 15. Sep. 2022 | Afrika JJA-Niederschlag 2012.jpg (Datei) |  |
57 KB | Dieter Kasang (Diskussion | Beiträge) | == Beschreibung == Abweichung des Sommerniederschlags in Afrika 2012 vom Monatsmittel 1901-2011 ==Lizenzhinweis== {| style="border:1px solid #8888aa; background-color:#f7f8ff;padding:5px;font-size:95%;" | Quelle: Parker, H.R., F.C Lott, R.J Cornforth et al. (2017): A comparison of model ensembles for attributing 2012 West African rainfall, Environmental Research Letters, Volume 12, Number 1, doi:10.1088/1748-9326/aa5386<br /> Lizenz: CC BY http://creativecommons.org/licenses/by/3.0/ |} | 1 |
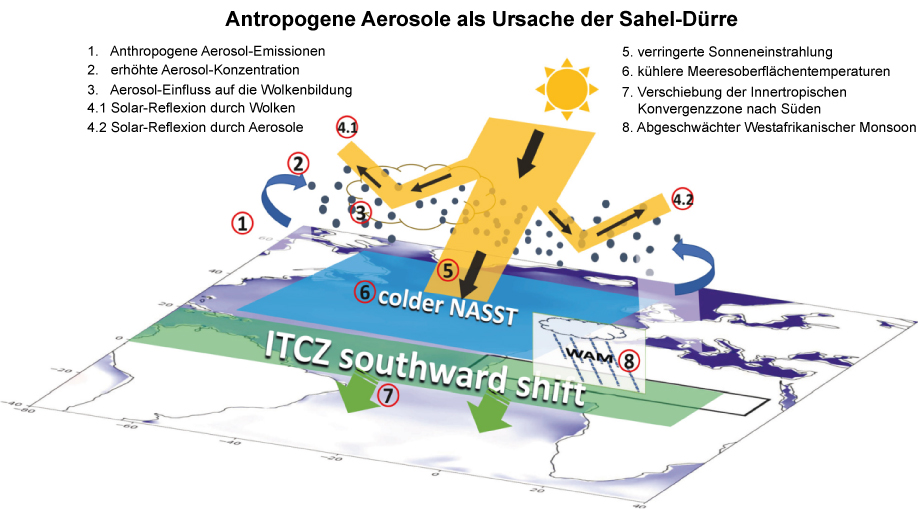
| 09:29, 15. Sep. 2022 | Sahel-Dürre-Aerosole.jpg (Datei) |  |
211 KB | Dieter Kasang (Diskussion | Beiträge) | == Beschreibung == Strahlungsdurchlässigkeit über dem Nordatlantik, Meeresoberflächentemperatur des Nordatlantiks und Sahel-Niederschlag. Die Abb. belegt die Bedeutung der Aerosolbelastung im Nordatlantik für die Sahel-Dürre. Vgl. Wasserprobleme im Sahel. Abb. verändert und beschriftet. ==Lizenzhinweis== {| style="border:1px solid #8888aa; background-color:#f7f8ff;padding:5px;font-size:95%;" | Quelle: Zhang, S., Stier, P., Dagan, G., & Wang, M. (2022). [https://doi.org/10.1029/2021GL095629… | 1 |
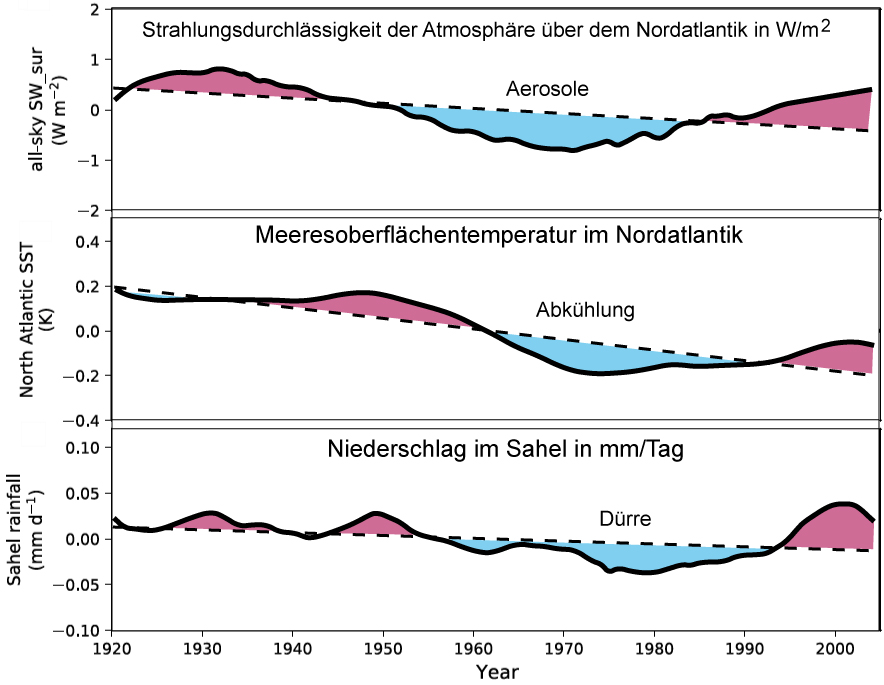
| 10:21, 14. Sep. 2022 | Aerosols SST Sahel-rain.jpg (Datei) |  |
146 KB | Dieter Kasang (Diskussion | Beiträge) | == Beschreibung == Strahlungsdurchlässigkeit über dem Nordatlantik, Meeresoberflächentemperatur des Nordatlantiks und Sahel-Niederschlag. Die Abb. belegt die Bedeutung der Aerosolbelastung im Nordatlantik für die Sahel-Dürre. Vgl. Wasserprobleme im Sahel. Abb. verändert: dt. Beschriftung. ==Lizenzhinweis== {| style="border:1px solid #8888aa; background-color:#f7f8ff;padding:5px;font-size:95%;" | Quelle: Zhang, S., Stier, P., Dagan, G., & Wang, M. (2022). [https://doi.org/10.1029/2021GL09562… | 1 |
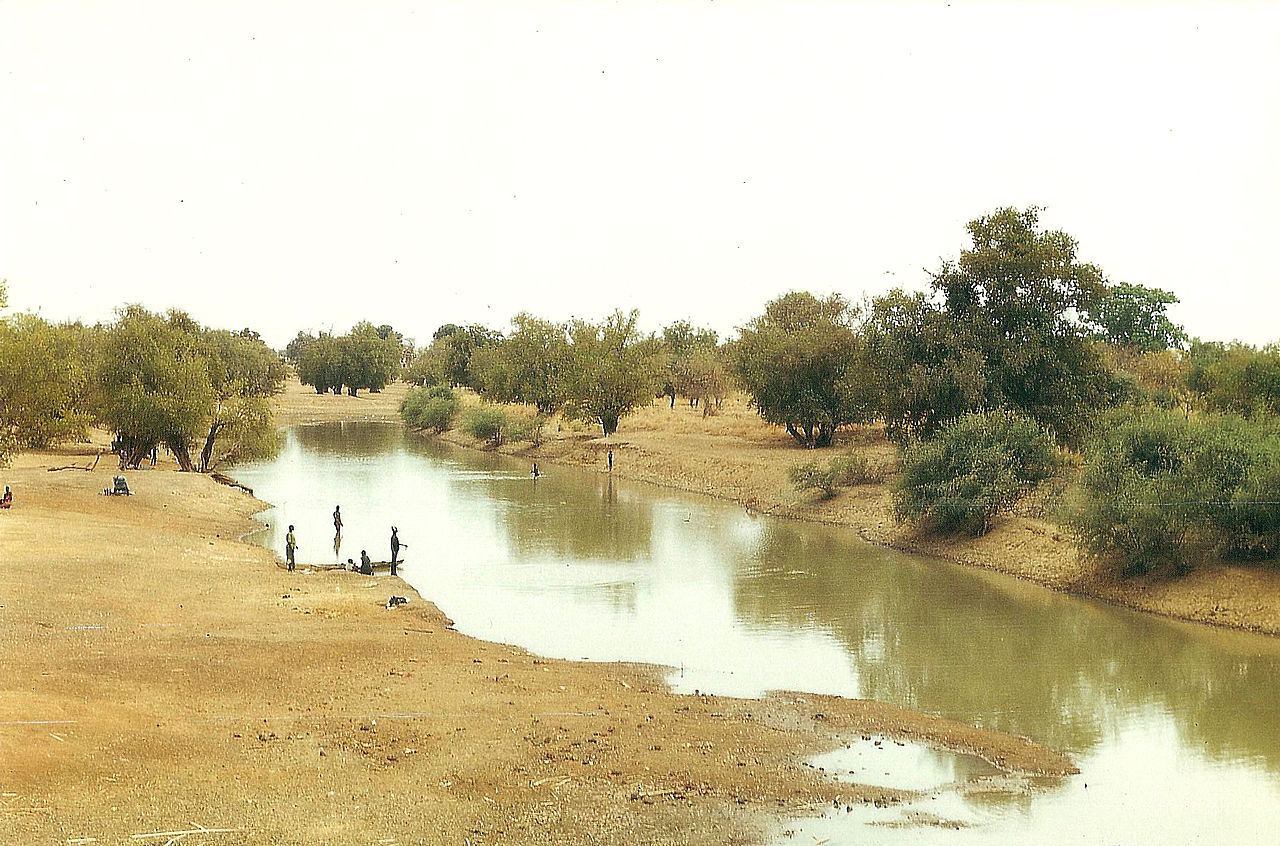
| 09:49, 14. Sep. 2022 | Nakambe river dry season.jpg (Datei) |  |
279 KB | Dieter Kasang (Diskussion | Beiträge) | == Beschreibung == Nakambe River (Weißer Volta) in Burkina Faso während der Trockenzeit 2009 ==Lizenzhinweis== {| style="border:1px solid #8888aa; background-color:#f7f8ff;padding:5px;font-size:95%;" | Quelle: Ampomah, B. (2019): The Impact of Climate Change on Water Supply in the Sahel Region: The case of Burkina Faso, https://iwa-network.org/the-impact-of-climate-change-on-water-supply-in-the-sahel-region/<br> Lizenz: CC BY-SA 3.0 |} | 1 |
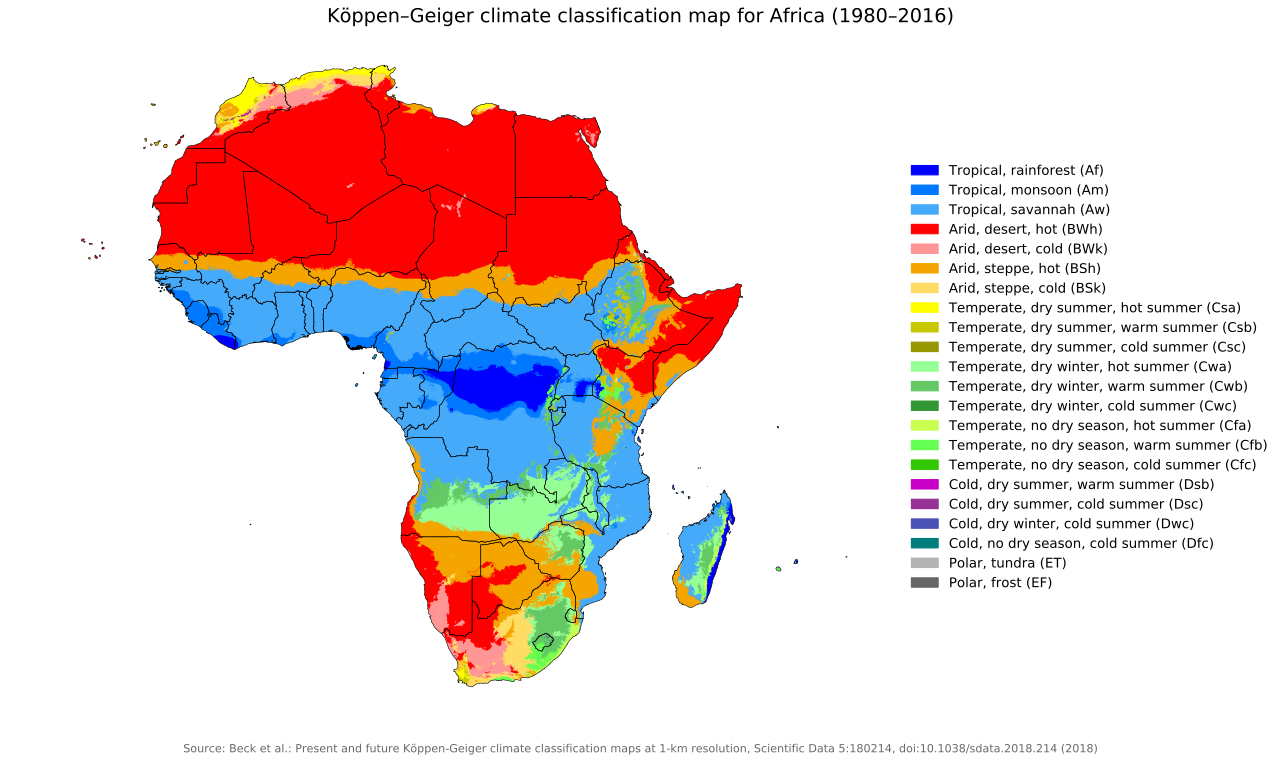
| 19:55, 13. Sep. 2022 | Koppen-Geiger Map Africa.png (Datei) |  |
244 KB | Dieter Kasang (Diskussion | Beiträge) | == Beschreibung == Klimazonen in Afrika nach Köppen-Geiger ==Lizenzhinweis== {| style="border:1px solid #8888aa; background-color:#f7f8ff;padding:5px;font-size:95%;" | Quelle: Wikimedia Commons (2018): Köppen–Geiger climate classification map for Africa https://commons.wikimedia.org/wiki/File:Koppen-Geiger_Map_Africa_present.svg <br> Lizenz: [https://creativecommons.org/licenses/by/4.0/deed.en CC BY] |} | 1 |
| 19:41, 13. Sep. 2022 | Sahel prec 21st.jpg (Datei) |  |
65 KB | Dieter Kasang (Diskussion | Beiträge) | == Beschreibung == Änderung der Niederschläge im Sahel in mm/Jahr bis 2080-2099 im Vergleich zu 1986-2005 ==Lizenzhinweis== {| style="border:1px solid #8888aa; background-color:#f7f8ff;padding:5px;font-size:95%;" | Quelle: Gaetani, M., S. Janicot, M. Vrac et al. (2020): Robust assessment of the time of emergence of precipitation change in West Africa. Sci Rep 10, 7670 https://doi.org/10.1038/s41598-020-63782-2<br> Lizenz: CC BY http://creativecommons.org/licenses/by/4.0/ |} | 1 |
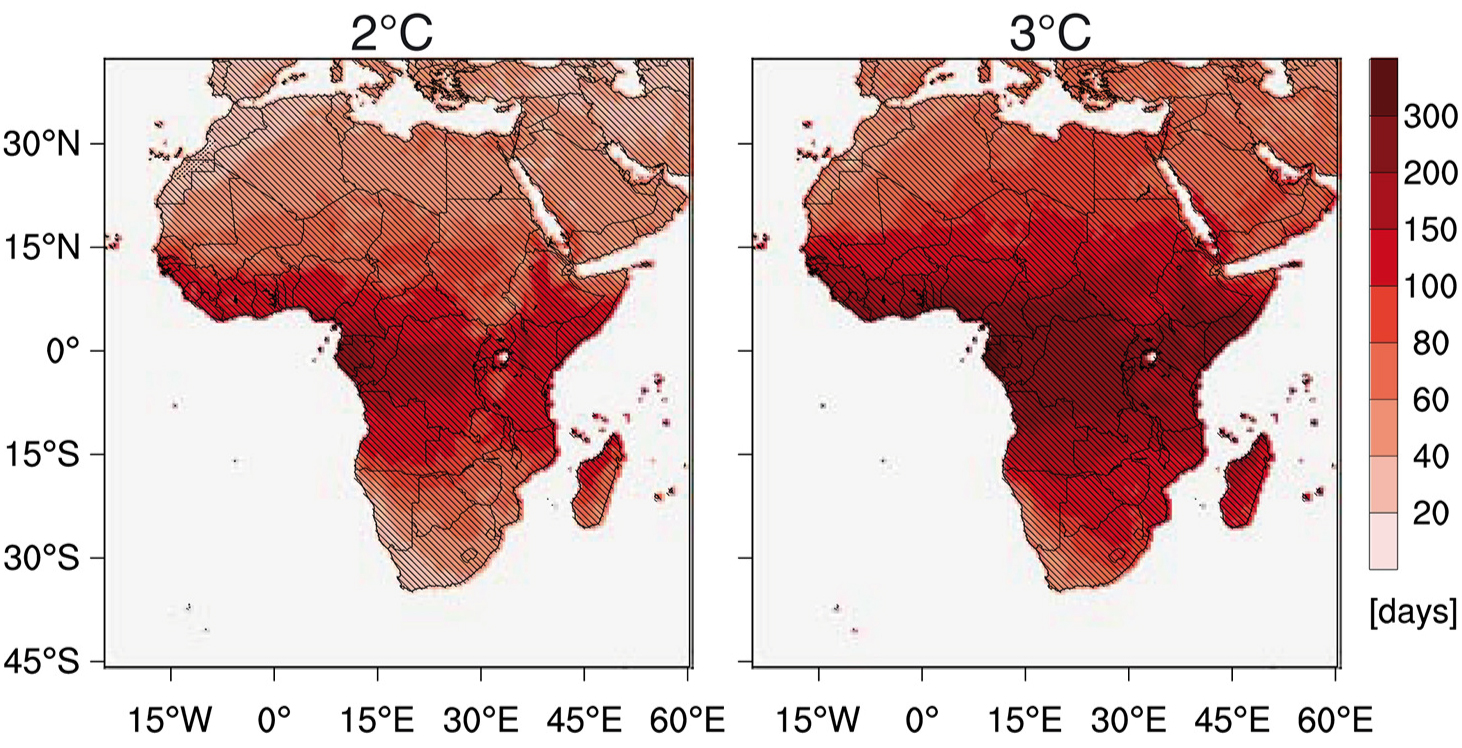
| 19:25, 13. Sep. 2022 | Africa-hot-nights.jpg (Datei) |  |
863 KB | Dieter Kasang (Diskussion | Beiträge) | == Beschreibung == Erhöhung der Anzahl heißer Nächte bis 2100 gegenüber der Referenzperiode 1971-2000 ==Lizenzhinweis== {| style="border:1px solid #8888aa; background-color:#f7f8ff;padding:5px;font-size:95%;" | Quelle: Weber, T., Haensler, A., Rechid, D., Pfeifer, S., Eggert, B., & Jacob, D. (2018): [https://doi.org/10.1002/2017EF000714 Analyzing regional climate change in Africa in a 1.5, 2, and 3°C global warming world.] Earth’s Future, 6, 643–655. <br /> Lizenz: [http://creativecommons.org… | 1 |
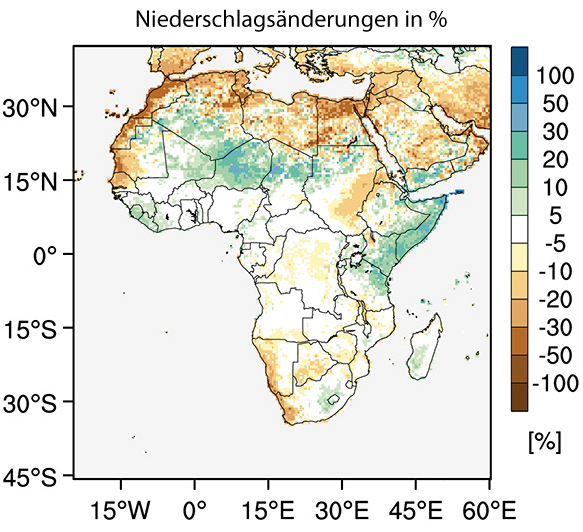
| 09:55, 13. Sep. 2022 | Africa-rainfall-change.jpg (Datei) |  |
216 KB | Dieter Kasang (Diskussion | Beiträge) | Niederschlagsänderungen in Afrika in der Regenzeit bei einer globalen Erwärmung von 3 °C ==Lizenzhinweis== {| style="border:1px solid #8888aa; background-color:#f7f8ff;padding:5px;font-size:95%;" | Quelle: Weber, T., Haensler, A., Rechid, D., Pfeifer, S., Eggert, B., & Jacob, D. (2018): Analyzing regional climate change in Africa in a 1.5, 2, and 3°C global warming world. Earth’s Future, 6, 643–655. https://doi.org/10.1002/2017EF000714 <br /> Lizenz: CC BY-NC-ND http://creativecommons.org/lice… | 1 |
| 18:51, 10. Sep. 2022 | Africa summer days 1980-2018.jpg (Datei) |  |
88 KB | Dieter Kasang (Diskussion | Beiträge) | == Beschreibung == Änderung der Sommertage in Afrika 1980 bis 2018 in Tage pro Jahrzehnt ==Lizenzhinweis== {| style="border:1px solid #8888aa; background-color:#f7f8ff;padding:5px;font-size:95%;" | Quelle: Engdaw, M. M., A. P. Ballinger, G. C. Hegerl and A. K. Steiner, 2021: Changes in temperature and heat waves over Africa using observational and reanalysis data sets. International Journal of Climatology, n/a(n/a), doi: https://doi.org/10.1002/joc.7295<br> Lizenz: [http://creativecommons.org… | 1 |
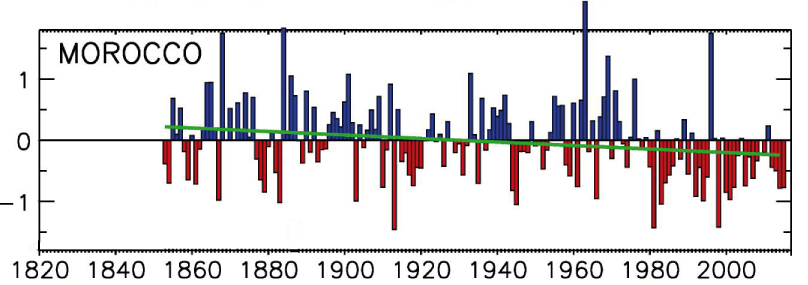
| 15:32, 10. Sep. 2022 | Morocco-rainfall.jpg (Datei) |  |
99 KB | Dieter Kasang (Diskussion | Beiträge) | == Beschreibung == Änderung der mittleren Jahresniederschläge 1850-2015 als Standardabweichung ==Lizenzhinweis== {| style="border:1px solid #8888aa; background-color:#f7f8ff;padding:5px;font-size:95%;" | Quelle: Nicholson, S. E., C. Funk and A. H. Fink, 2018: Rainfall over the African continent from the 19th through the 21st century. Global and Planetary Change, 165, 114–127, doi:https://doi.org/10.1016/j.gloplacha.2017.12.014<br> Lizenz: CC BY-NC-ND https://creativecommons.org/licenses/by-n… | 1 |
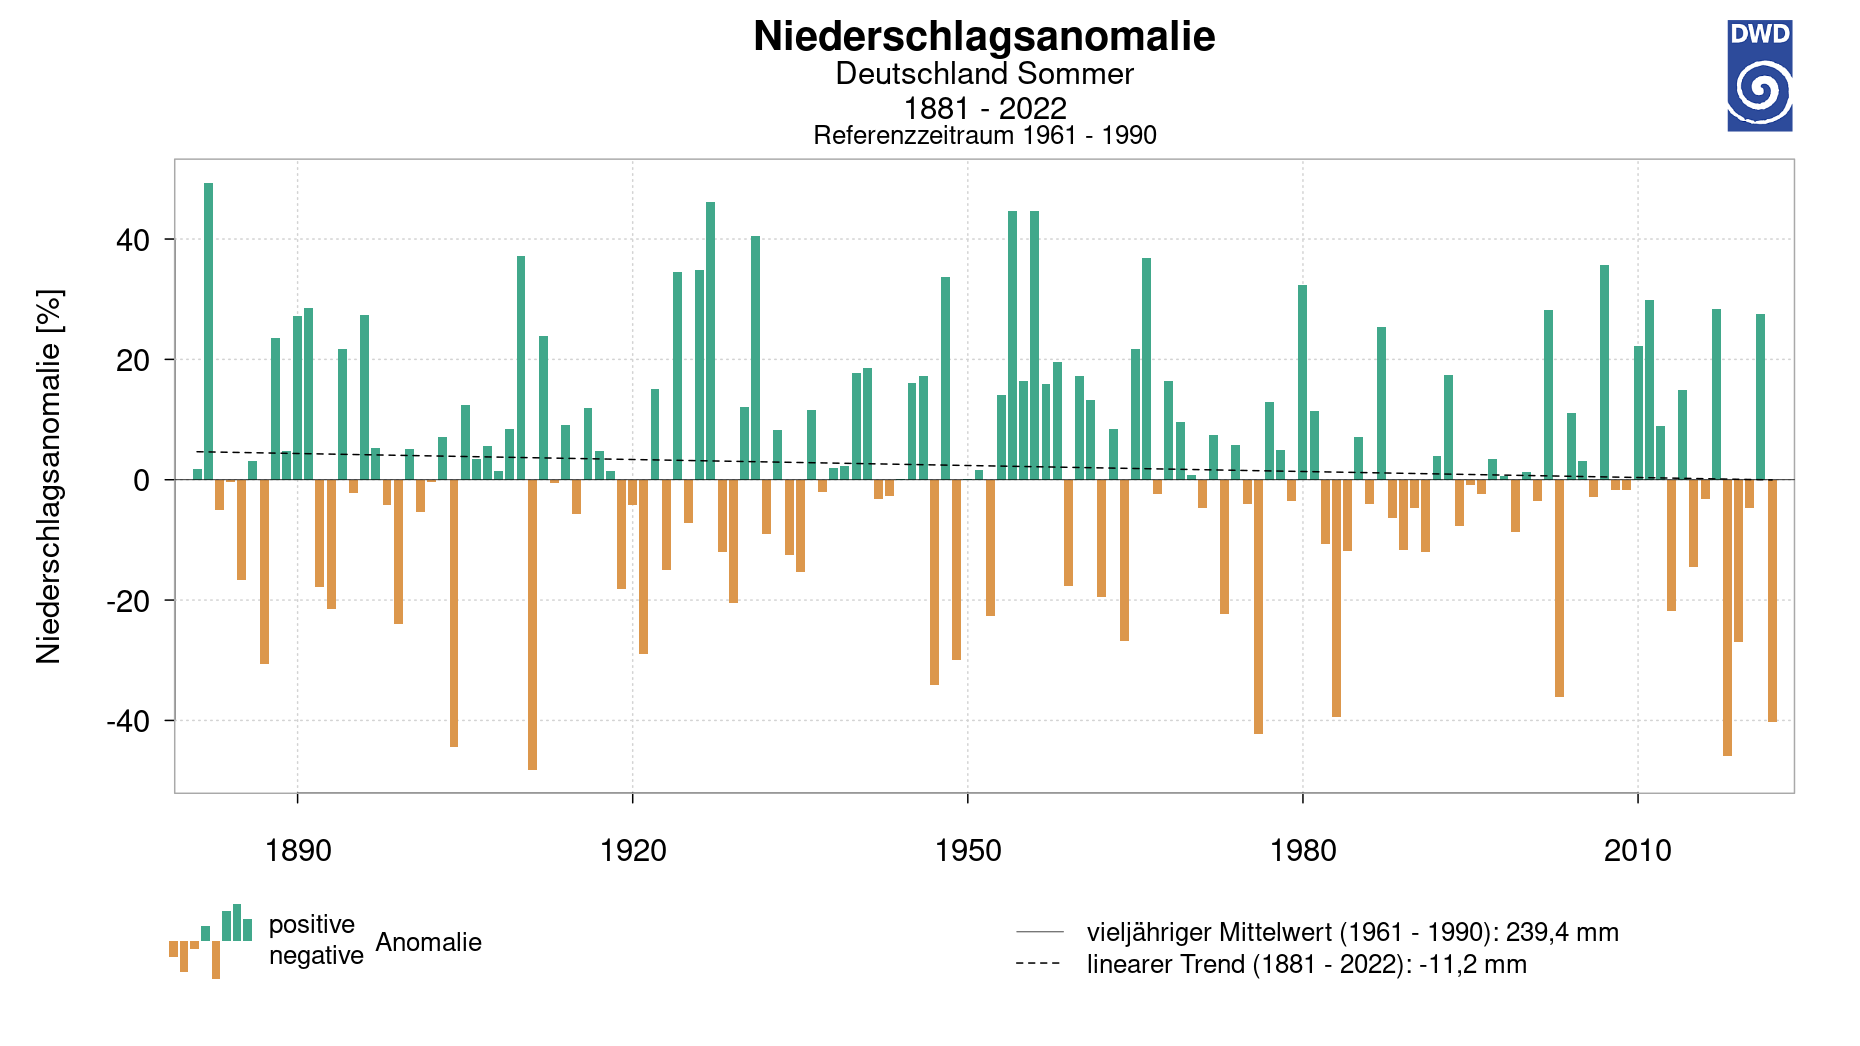
| 08:39, 4. Sep. 2022 | D Niederschlag 1881-2022.png (Datei) |  |
99 KB | Dieter Kasang (Diskussion | Beiträge) | == Beschreibung == Sommerniederschläge in Deutschland 1881 bis 2022 im Vergleich zum Mittel 1961-1990 == Lizenzhinweis == {| style="border:1px solid #8888aa; background-color:#f7f8ff;padding:5px;font-size:95%;" |Quelle: [https://www.dwd.de/DE/leistungen/zeitreihen/zeitreihen.html?nn=480164 DWD: Zeitreihen und Trends, Deutschland Sommer, 1881-2022]<br> Lizenz: [http://creativecommons.org/licenses/by-nc-nd/4.0/deed.de CC BY-NC-ND] |} | 1 |
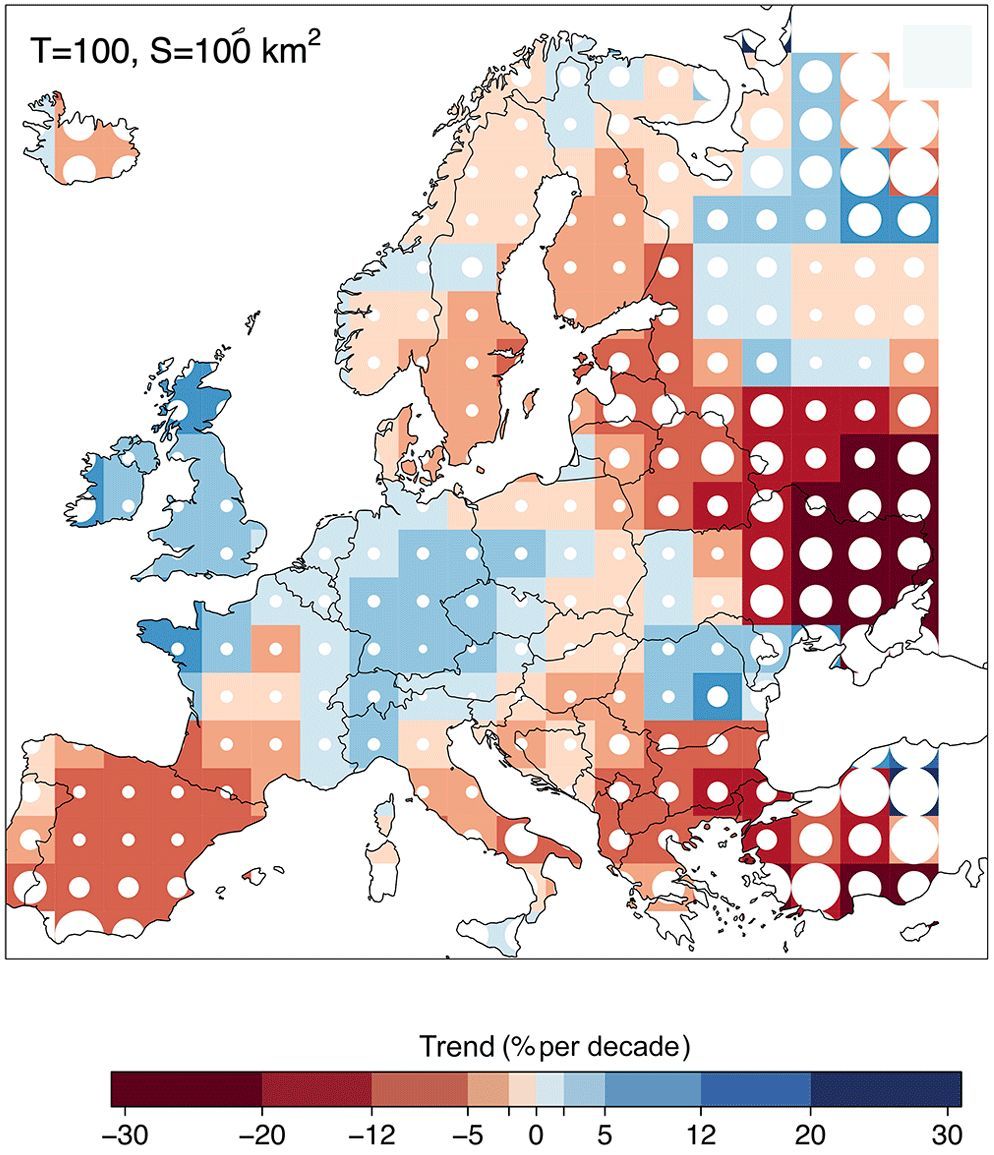
| 11:30, 24. Aug. 2022 | Europe flood trends 1960-2010.jpg (Datei) |  |
182 KB | Dieter Kasang (Diskussion | Beiträge) | == Beschreibung == Änderung von Hochwasser-Ereignissen mit einer Wiederkehrperiode von 100 Jahren und in kleineren Flussbecken von ca. 100 km2 ==Lizenzhinweis== {| style="border:1px solid #8888aa; background-color:#f7f8ff;padding:5px;font-size:95%;" | Quelle: Bertola, M., Viglione, A., Lun, D., Hall, J., and Blöschl, G. (2020): Flood trends in Europe: are changes in small and big floods different? Hydrol. Earth Syst. Sci., 24, 1805–1822, https://doi.org/10.5194/hess-24-1805-2020 <br> Lizenz:… | 2 |
| 10:48, 24. Aug. 2022 | EU exposed to floods1870-2020.jpg (Datei) |  |
75 KB | Dieter Kasang (Diskussion | Beiträge) | == Beschreibung == Änderung der Exponiertheit von Bevölkerung, Bruttoinlandsprodukt und Sachwerten 1870-2020 in Europa ==Lizenzhinweis== {| style="border:1px solid #8888aa; background-color:#f7f8ff;padding:5px;font-size:95%;" | Quelle: Paprotny, D., Sebastian, A., Morales-Nápoles, O. et al. (2018): Trends in flood losses in Europe over the past 150 years. Nat Commun 9, 1985. https://doi.org/10.1038/s41467-018-04253-1 <br> Lizenz: CC BY http://creativecommons.org/licenses/by/4.0/ |} | 1 |
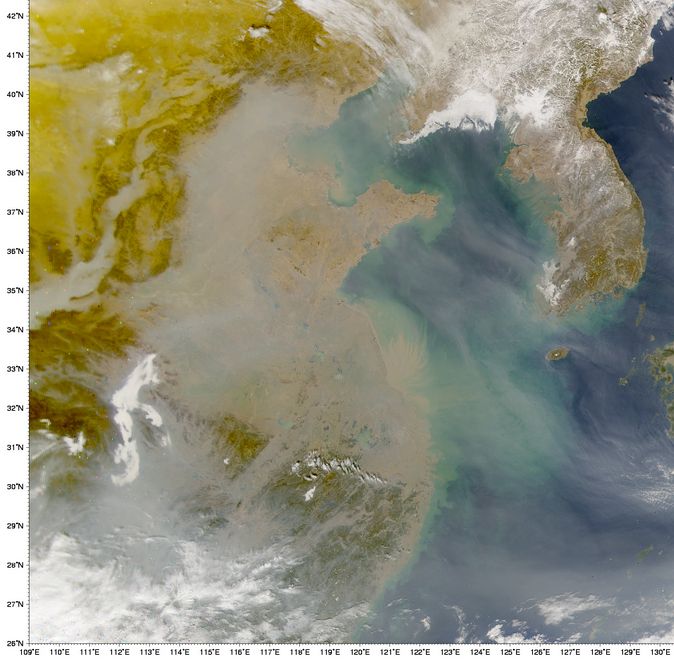
| 11:06, 19. Aug. 2022 | Aerosole Ostchina.jpg (Datei) |  |
70 KB | Dieter Kasang (Diskussion | Beiträge) | Aerosolbelastung über Ostasien ==Lizenzhinweis== {| style="border:1px solid #8888aa; background-color:#f7f8ff;padding:5px;font-size:95%;" | Quelle: Wikimedia Commons (2002): Asian Dust, NASA aerospace photography.jpg, Autor: Image courtesy the SeaWiFS Project, NASA/Goddard Space Flight Center, and ORBIMAGE https://commons.wikimedia.org/wiki/File:Asian_Dust,_NASA_aerospace_photography.jpg <br> Lizenz: public domain |} | 1 |
| 10:43, 19. Aug. 2022 | Aerosol forcing1860-2100.jpg (Datei) |  |
36 KB | Dieter Kasang (Diskussion | Beiträge) | == Beschreibung == Strahlungsantrieb von Aerosolen historisch ab 1860 und nach Szenarien bis 2100 ==Lizenzhinweis== {| style="border:1px solid #8888aa; background-color:#f7f8ff;padding:5px;font-size:95%;" | Quelle: Westervelt, D. M., Horowitz, L. W., Naik, V., Golaz, J.-C., and Mauzerall, D. L.: [https://doi.org/10.5194/acp-15-12681-2015 Radiative forcing and climate response to projected 21st century aerosol decreases], Atmos. Chem. Phys., 15, 12681–12703<br> Lizenz: [https://creativecommons.o… | 1 |
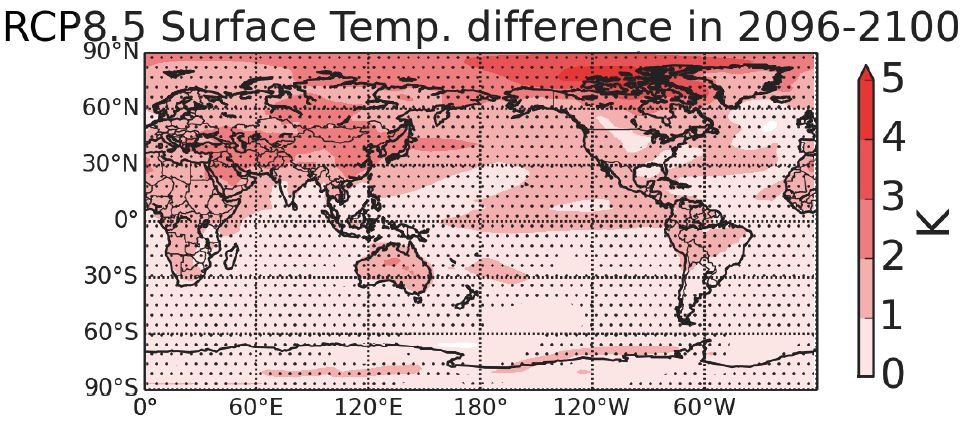
| 10:35, 19. Aug. 2022 | Aerosol temp 2100 RCP8.5.jpg (Datei) |  |
128 KB | Dieter Kasang (Diskussion | Beiträge) | == Beschreibung == Regionale Veränderung der Temperatur durch Aerosolabnahme 2096-2100 im Vergleich zu 2005 nach dem Szenario RCP8.5 ==Lizenzhinweis== {| style="border:1px solid #8888aa; background-color:#f7f8ff;padding:5px;font-size:95%;" | Quelle: Westervelt, D. M., Horowitz, L. W., Naik, V., Golaz, J.-C., and Mauzerall, D. L.: [https://doi.org/10.5194/acp-15-12681-2015 Radiative forcing and climate response to projected 21st century aerosol decreases], Atmos. Chem. Phys., 15, 12681–12703<br>… | 1 |
| 10:32, 19. Aug. 2022 | Aerosol temp 2100 RCP8.5 E-Asia.jpg (Datei) |  |
48 KB | Dieter Kasang (Diskussion | Beiträge) | == Beschreibung == Temperaturzunahme durch den Rückgang der Aerosolemissionen bis 2100 nach verschiedenen Szenarien in Ostasien ==Lizenzhinweis== {| style="border:1px solid #8888aa; background-color:#f7f8ff;padding:5px;font-size:95%;" | Quelle: Westervelt, D. M., Horowitz, L. W., Naik, V., Golaz, J.-C., and Mauzerall, D. L.: [https://doi.org/10.5194/acp-15-12681-2015 Radiative forcing and climate response to projected 21st century aerosol decreases], Atmos. Chem. Phys., 15, 12681–12703<br> Lize… | 1 |