Dateiliste
Aus Klimawandel
Diese Spezialseite listet alle hochgeladenen Dateien auf.
| Datum | Name | Vorschaubild | Größe | Benutzer | Beschreibung | Versionen |
|---|---|---|---|---|---|---|
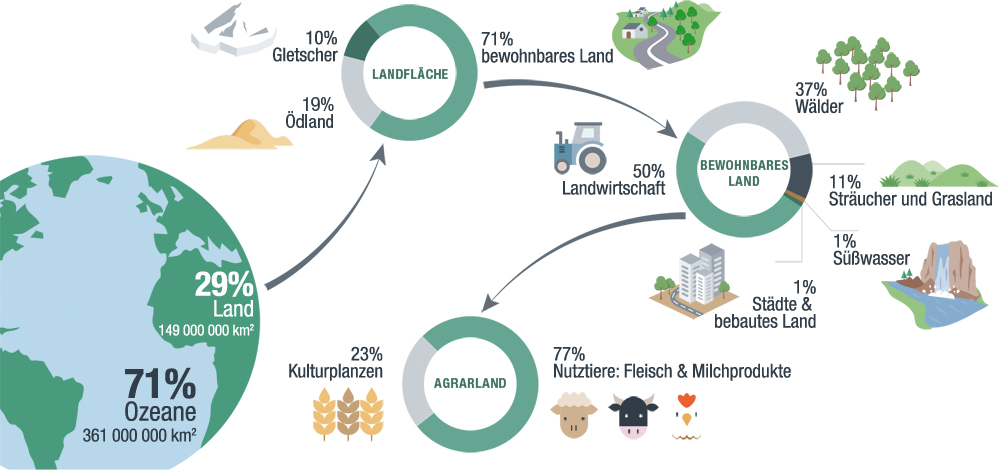
| 21:06, 13. Jan. 2022 | Landnutzung-2015.jpg (Datei) |  |
241 KB | Dieter Kasang (Diskussion | Beiträge) | == Beschreibung == Landnutzungsformen und ihre Flächenanteile 2015 ==Lizenzhinweis== {| style="border:1px solid #8888aa; background-color:#f7f8ff;padding:5px;font-size:95%;" | Quelle: Office for Climate Education (2021): IPCC-Sonderbericht „Klimawandel und Landsysteme“ – Zusammenfassung für Lehrende, https://www.sonnentaler.net/dokumentation/ipcc-berichte/sr-klimawandel-landnutzung/ <br> Lizenz: CC BY-NC-SA |} | 1 |
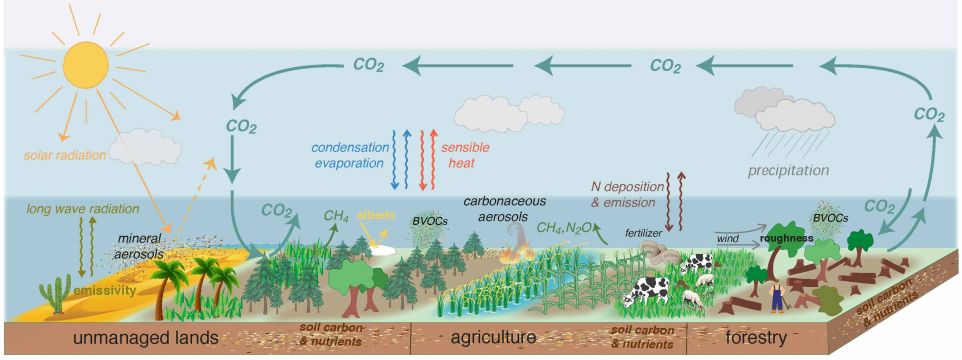
| 20:19, 13. Jan. 2022 | Landcover atmosphere interaction sm.jpg (Datei) |  |
55 KB | Dieter Kasang (Diskussion | Beiträge) | Wechselwirkungen zwischen Landbedeckungen und Atmosphäre ==Lizenzhinweis== {| style="border:1px solid #8888aa; background-color:#f7f8ff;padding:5px;font-size:95%;" | Quelle: IPCC (2019): Land-climate interactions. In: Climate Change and Land, Box 2.1, Figure 1, https://www.ipcc.ch/srccl/<br> Lizenz: [https://www.ipcc.ch/copyright IPCC-Copyright]: Reproduction of limited number of figures or short excerpts of IPCC material is authorized free of charge and without formal written permission pro… | 1 |
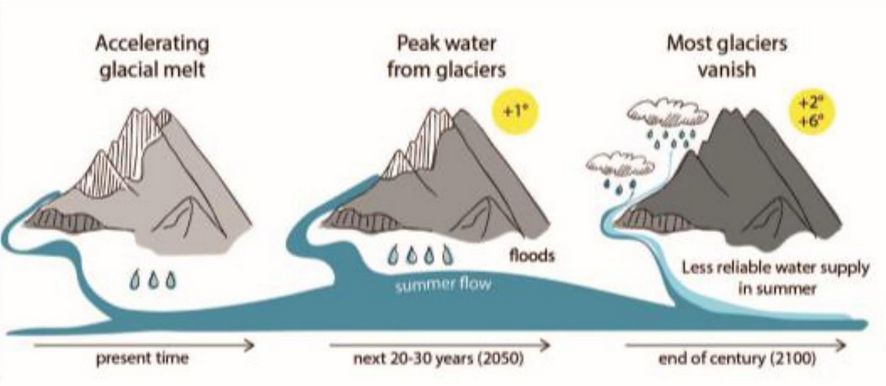
| 20:48, 9. Jan. 2022 | Glacier melt runoff.jpg (Datei) |  |
36 KB | Dieter Kasang (Diskussion | Beiträge) | == Beschreibung == Gletscherschmelze und Abfluss in Mittelasien ==Lizenzhinweis== {| style="border:1px solid #8888aa; background-color:#f7f8ff;padding:5px;font-size:95%;" | Quelle: M. Barandun, J. Fiddes, M. Scherler, T. Mathys, T. Saks, D. Petrakov, M. Hoelzle (2020): The state and future of the cryosphere in Central Asia, Water Secur., 11 (2020), Article 100072, 10.1016/j.wasec.2020.100072<br> Lizenz: [https://creativecommons.org/licenses/ CC-BY-NC-ND] |} | 1 |
| 20:43, 9. Jan. 2022 | Central Asia mountains.ai.jpg (Datei) |  |
84 KB | Dieter Kasang (Diskussion | Beiträge) | Gebirgsregionen in Mittelasien ==Lizenzhinweis== {| style="border:1px solid #8888aa; background-color:#f7f8ff;padding:5px;font-size:95%;" | Quelle: M. Barandun, J. Fiddes, M. Scherler, T. Mathys, T. Saks, D. Petrakov, M. Hoelzle (2020): The state and future of the cryosphere in Central Asia, Water Secur., 11 (2020), Article 100072, 10.1016/j.wasec.2020.100072<br> Lizenz: Creative Commons CC-BY-NC-ND https://creativecommons.org/licenses/ |} | 1 |
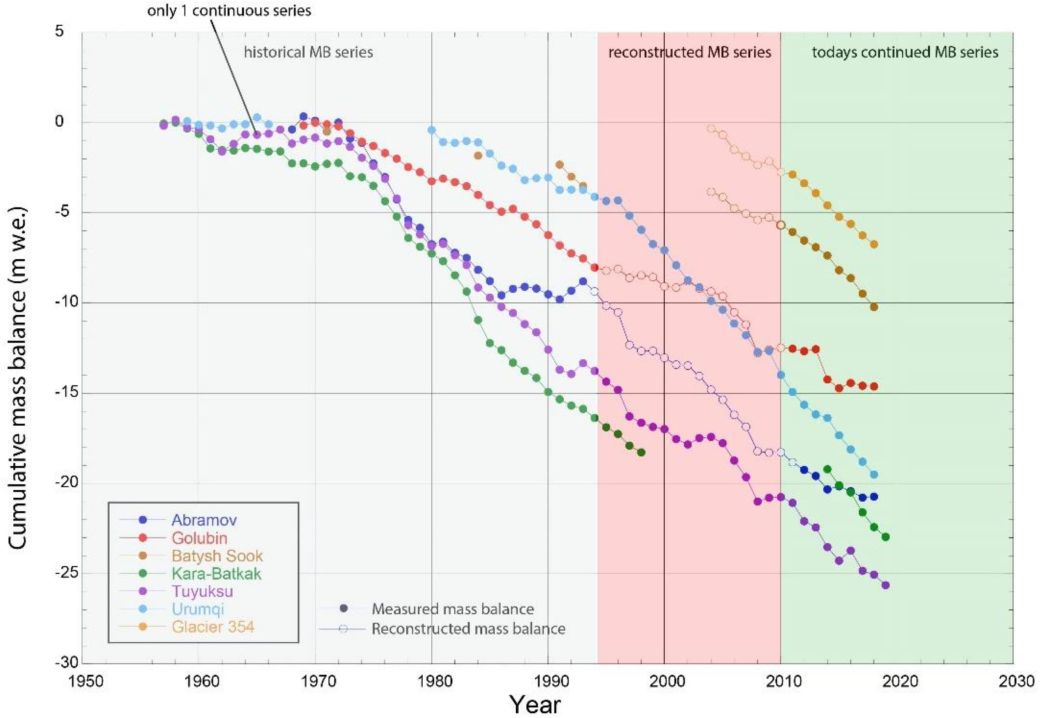
| 20:28, 9. Jan. 2022 | Tien Shan Pamir glaciers MB.jpg (Datei) |  |
66 KB | Dieter Kasang (Diskussion | Beiträge) | == Beschreibung == Zeitserien der kumulativen Änderung der Massenbilanz von einzelnen Gletschern in Mittelasien in m Wasseräquivalent (Abramov: Pamir; alle anderen Gletscher: Tien Shan) ==Lizenzhinweis== {| style="border:1px solid #8888aa; background-color:#f7f8ff;padding:5px;font-size:95%;" | Quelle: Barandun, M., J. Fiddes, M. Scherler, T. Mathys, T. Saks, D. Petrakov, M. Hoelzle (2020): The state and future of the cryosphere in Central Asia, Water Secur., 11, Article 100072, 10.1016/j.wasec.… | 1 |
| 20:25, 9. Jan. 2022 | CentralAsia snowmelt 1980-2100.jpg (Datei) |  |
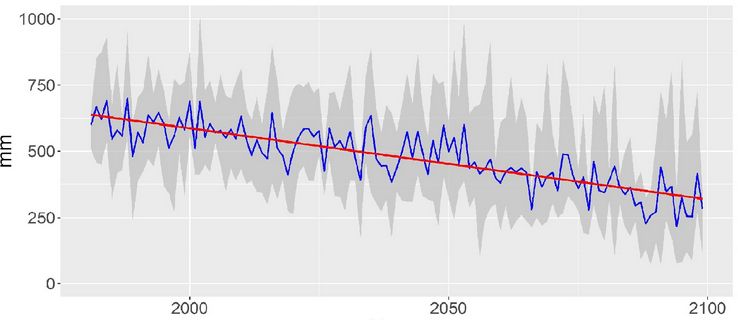
28 KB | Dieter Kasang (Diskussion | Beiträge) | == Beschreibung == Abnahme der Schneedicke im westlichen Tien Shan 1981-2100 nach Modellberechnungen mit dem hohen Szenario RCP8.5. ==Lizenzhinweis== {| style="border:1px solid #8888aa; background-color:#f7f8ff;padding:5px;font-size:95%;" | Quelle: Didovets, I., A. Lobanova, V. Krysanova et al. (2021): Central Asian rivers under climate change: Impacts assessment in eight representative catchments, Journal of Hydrology: Regional Studies 34, https://doi.org/10.1016/j.ejrh.2021.100779 <br> Lize… | 1 |
| 20:18, 9. Jan. 2022 | Tien-Shan-Wasserspeicher-2003-2013.jpg (Datei) |  |
233 KB | Dieter Kasang (Diskussion | Beiträge) | == Beschreibung == Änderung des vor allem in Eis und Schnee gespeicherten Wassers im Tien Shan zwischen 2003 bis 2014 in mm/Jahr. ==Lizenzhinweis== {| style="border:1px solid #8888aa; background-color:#f7f8ff;padding:5px;font-size:95%;" | Quelle: Chen, Y., L. Weihong, H. Deng et al. (2016): Changes in Central Asia’s Water Tower: Past, Present and Future. Scientific Reports 6, 35458; doi: 10.1038/srep35458<br> Lizenz: CC BY http://creativecommons.org/licenses/by/4.0/ |} | 1 |
| 20:13, 9. Jan. 2022 | CA-wasserprod.-verbrauch.jpg (Datei) |  |
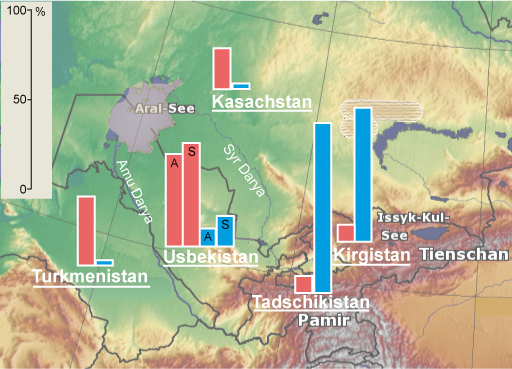
168 KB | Dieter Kasang (Diskussion | Beiträge) | Das Missverhältnis zwischen Produktion und Verbrauch von Wasser zwischen den Staaten Mittelasiens. Dargestellt sind die Anteile am Wasser der Flusseinzugsgebiete des Amu Darya (Turkmenistan, Usbekistan, Tadschikistan) und Syr Darya (Kasachstan, Usbekistan, Kirgistan) in %. Beim Aralsee sind die restlichen Wasserflächen nach einer NASA-Aufnahme vom August 2021 sowie die frühere Ausdehnung gezeigt. ==Lizenzhinweis== {| style="border:1px solid #8888aa; background-color:#f7f8ff;padding:5px;font-si… | 1 |
| 19:43, 5. Jan. 2022 | Eu soil moisture summer-2019.jpg (Datei) |  |
37 KB | Dieter Kasang (Diskussion | Beiträge) | == Beschreibung == Bodenfeuchte in den oberen 7 cm im August 2019 == Lizenzhinweis == {| style="border:1px solid #8888aa; background-color:#f7f8ff;padding:5px;font-size:95%;" |Quelle: Copernicus Climate Change (2020): Precipitation, relative humidity and soil moisture for August 2019, https://climate.copernicus.eu/precipitation-relative-humidity-and-soil-moisture-august-2019<br> Lizenz: Reproduction of the publically available content of this website is authorised, provided the source is acknow… | 1 |
| 17:00, 3. Jan. 2022 | Central EU drought area 1850-2100.jpg (Datei) |  |
85 KB | Dieter Kasang (Diskussion | Beiträge) | == Beschreibung == : Änderung der Dürrefläche 1850 bis 2100 in Mitteleuropa. HistNat: historische durch natürliche Ursachen bedingt; Hist: historisch alle Ursachen; RCP2.6, 4.5, 8.5: Projektionen nach einem unteren, mittleren und hohen Szenario. Eingefügt: Anzahl von Zweijahres-Dürren in verschiedenen Zeitabschnitten. == Lizenzhinweis == {| style="border:1px solid #8888aa; background-color:#f7f8ff;padding:5px;font-size:95%;" |Quelle: Hari, V., O. Rakovec, Y. Markonis et al. (2020): Increased fu… | 1 |
| 16:46, 3. Jan. 2022 | Carbon storage vegetation 2018.jpg (Datei) |  |
85 KB | Dieter Kasang (Diskussion | Beiträge) | == Beschreibung == Auswirkungen klimatischer Verhältnisse im Frühjahr 2018 auf die Kohlenstoffaufnahme durch die Vegetation im Sommer in gr. Kohlenstoff pro m<sup>2</sup> und Monat (gC/m<sup>2</sup>/Monat). == Lizenzhinweis == {| style="border:1px solid #8888aa; background-color:#f7f8ff;padding:5px;font-size:95%;" |Quelle: Bastos, A., P. Ciais, P. Friedlingstein, S. Sitch, J. Pongratz, L. Fan et al. (2020): [https://doi.org/10.1126/sciadv.aba2724 Direct and seasonal legacy effects of the 2018… | 2 |
| 16:25, 3. Jan. 2022 | Eu soil moisture 1979-2020.jpg (Datei) |  |
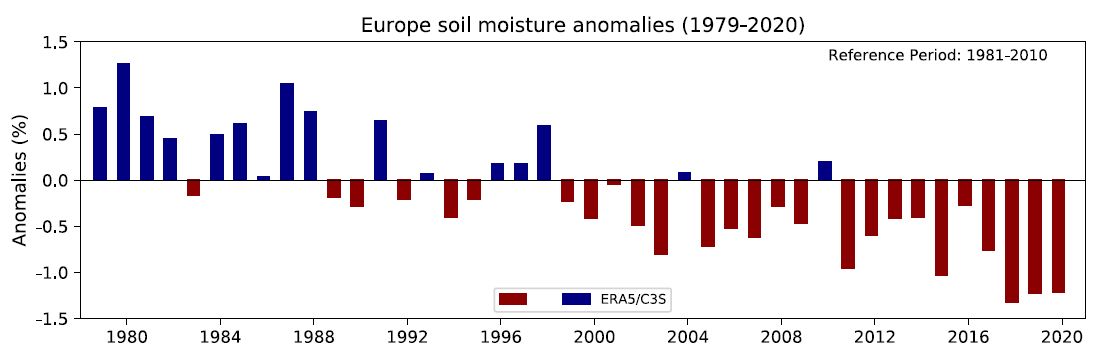
38 KB | Dieter Kasang (Diskussion | Beiträge) | == Beschreibung == Jährliche Abweichung der Bodenfeuchte in Europa vom Mittel 1981-2010 in %. == Lizenzhinweis == {| style="border:1px solid #8888aa; background-color:#f7f8ff;padding:5px;font-size:95%;" |Quelle: Copernicus Climate Change (2021): European state of the climate 2020, Soil Moisture, https://climate.copernicus.eu/esotc/2020/soil-moisture<br> Lizenz: [https://climate.copernicus.eu/disclaimer-and-privacy Reproduction of the publically available content of this website is authorised, p… | 1 |
| 16:18, 3. Jan. 2022 | Eu wet days 2020.jpg (Datei) |  |
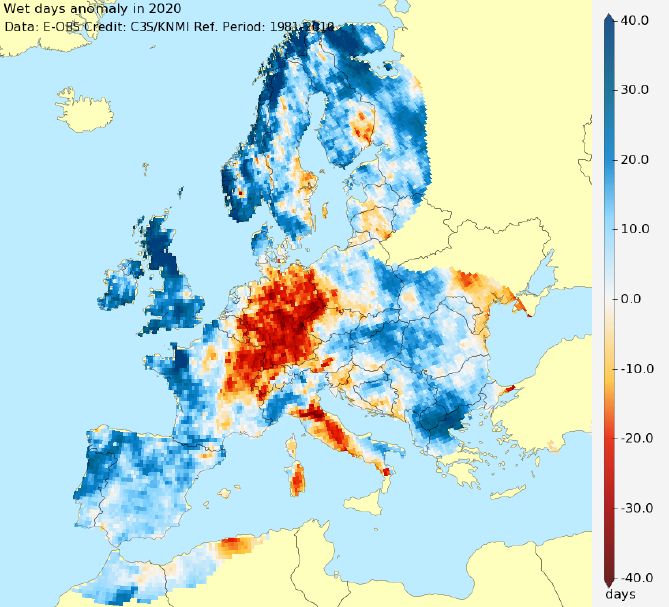
74 KB | Dieter Kasang (Diskussion | Beiträge) | == Beschreibung == Anzahl der feuchten Tage (ab 1mm Niederschlag/Tag) 2020 im Vergleich zum Mittel 1981-2010 == Lizenzhinweis == {| style="border:1px solid #8888aa; background-color:#f7f8ff;padding:5px;font-size:95%;" |Quelle: Copernicus Climate Change (2021): European state of the climate 2020, Precipitation, https://climate.copernicus.eu/esotc/2020/precipitations <br> Lizenz: Reproduction of the publically available content of this website is authorised, provided the source is acknowledged, s… | 1 |
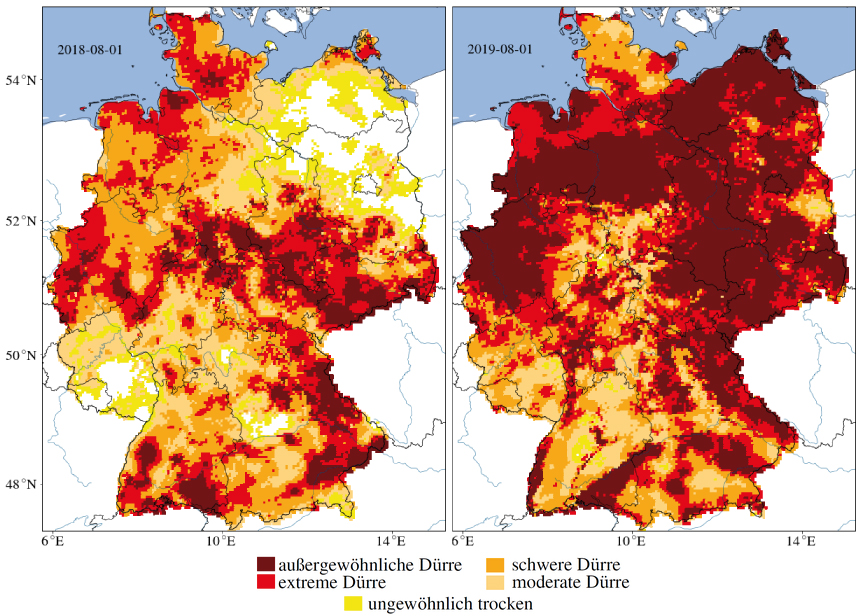
| 14:55, 3. Jan. 2022 | Deutschland Dürre Aug.2018-2019.jpg (Datei) |  |
543 KB | Dieter Kasang (Diskussion | Beiträge) | Trockenheit des Gesamtbodens (bis 1,8 m Tiefe) im August 2018 (links) und August 2019 (rechts) in Deutschland. == Lizenzhinweis == {| style="border:1px solid #8888aa; background-color:#f7f8ff;padding:5px;font-size:95%;" |Quelle: UFZ Helmholtz Zentrum für Umweltforschung: Dürremonitor Deutschland https://www.ufz.de/index.php?de=37937<br> Lizenz: „Die Grafiken können im Rahmen von Wissenschaft und Forschung sowie für redaktionelle Zwecke unter Angabe des folgenden Vermerks unentgeltlich genutzt w… | 1 |
| 17:42, 28. Dez. 2021 | Soil salinization Afghanistan.jpg (Datei) |  |
227 KB | Dieter Kasang (Diskussion | Beiträge) | == Beschreibung == Bodenversalzung durch Salzausblühungen auf einem bewässerten Feld in Afghanistan. == Lizenzhinweis == {| style="border:1px solid #8888aa; background-color:#f7f8ff;padding:5px;font-size:95%;" | Quelle: FAO (2020): State of knowledge of soil biodiversity – Status, challenges and potentialities, http://www.fao.org/3/cb1928en/CB1928EN.pdf https://doi.org/10.4060/cb1928en <br> Lizenz: [https://creativecommons.org/licenses/by-nc-sa CC BY-NC-SA] |} | 1 |
| 12:38, 28. Dez. 2021 | Düngung-N-P.jpg (Datei) |  |
173 KB | Dieter Kasang (Diskussion | Beiträge) | == Beschreibung == Düngung durch Stickstoff (N) und Phosphate (P) == Lizenzhinweis == {| style="border:1px solid #8888aa; background-color:#f7f8ff;padding:5px;font-size:95%;" | Quelle: Cavicchioli R., Ripple W. J., Timmis K. N., Azam F., Bakken L. R., Baylis M., et al. (2019). Scientists’ warning to humanity: microorganisms and climate change. Nat. Rev. Microbiol. 17 569–586. 10.1038/s41579-019-0222-5 <br> Lizenz: [http://creativecommons.org/licenses/by/4.0/ CC BY] |} | 1 |
| 11:58, 28. Dez. 2021 | Humans effect miroorganisms.jpg (Datei) |  |
190 KB | Dieter Kasang (Diskussion | Beiträge) | == Beschreibung == Menschliche Aktivitäten beeinflussen Mikroorganismen == Lizenzhinweis == {| style="border:1px solid #8888aa; background-color:#f7f8ff;padding:5px;font-size:95%;" | Quelle: Cavicchioli R., Ripple W. J., Timmis K. N., Azam F., Bakken L. R., Baylis M., et al. (2019). Scientists’ warning to humanity: microorganisms and climate change. Nat. Rev. Microbiol. 17 569–586. 10.1038/s41579-019-0222-5 <br> Lizenz: CC BY http://creativecommons.org/licenses/by/4.0/ |} | 1 |
| 11:53, 28. Dez. 2021 | Drivers-soil-alteration.jpg (Datei) |  |
333 KB | Dieter Kasang (Diskussion | Beiträge) | == Beschreibung == Ursachen von Boden-Degradation == Lizenzhinweis == {| style="border:1px solid #8888aa; background-color:#f7f8ff;padding:5px;font-size:95%;" | Quelle: FAO (2020): [https://doi.org/10.4060/cb1928en State of knowledge of soil biodiversity - Status, challenges and potentialities], Figure 3.4.4.1 <br> Lizenz: [https://creativecommons.org/licenses/by-nc-sa/3.0/igo/legalcode CC BY-NC-SA] |} | 1 |
| 10:25, 28. Dez. 2021 | Soil-CO2.jpg (Datei) |  |
168 KB | Dieter Kasang (Diskussion | Beiträge) | == Beschreibung == Boden und Kohlendioxid == Lizenzhinweis == {| style="border:1px solid #8888aa; background-color:#f7f8ff;padding:5px;font-size:95%;" | Quelle: FAO (2015): Status of the World’s Soil Resources <br> Lizenz: 2material may be copied, downloaded and printed for private study, research and teaching purposes, or for use in non-commercial products or services, provided that appropriate acknowledgement of FAO as the source and copyright holder is given" |} | 1 |
| 17:45, 26. Dez. 2021 | Aboveground soils gases.jpg (Datei) |  |
135 KB | Dieter Kasang (Diskussion | Beiträge) | == Beschreibung == Bodenfunktionen, übersetzt == Lizenzhinweis == {| style="border:1px solid #8888aa; background-color:#f7f8ff;padding:5px;font-size:95%;" | Quelle: FAO (2015): [https://www.fao.org/resources/infographics/infographics-details/en/c/284478/ Soil funtions]<br> Lizenz: material may be copied, downloaded and printed for private study, research and teaching purposes, or for use in non-commercial products or services, provided that appropriate acknowledgement of FAO as the source and c… | 1 |
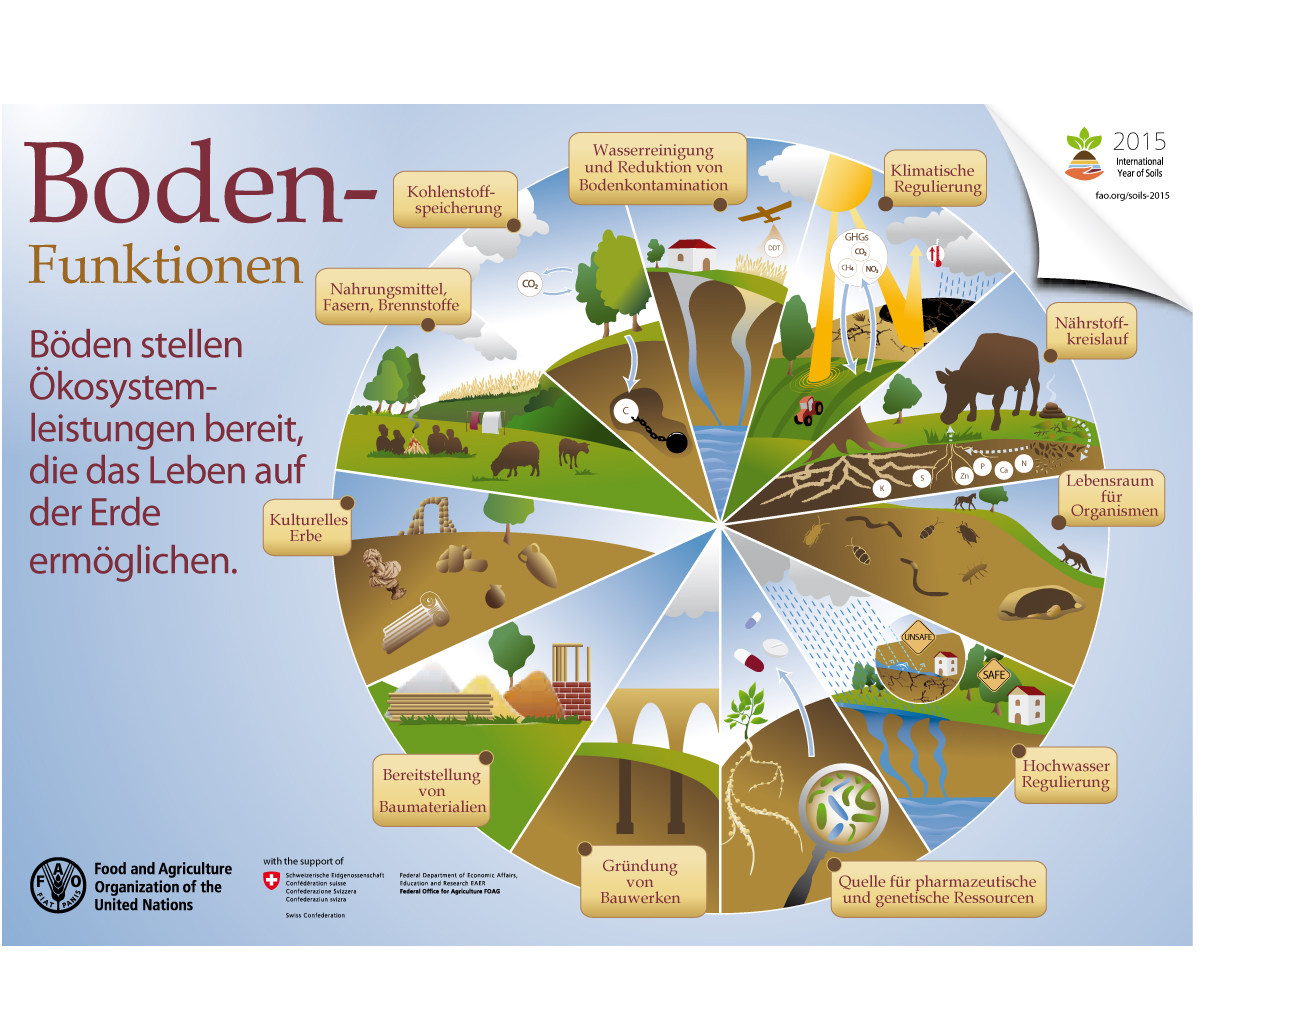
| 16:36, 26. Dez. 2021 | Bodenfunktionen FAO-dt.jpg (Datei) |  |
653 KB | Dieter Kasang (Diskussion | Beiträge) | Bodenfunktionen, übersetzt == Lizenzhinweis == {| style="border:1px solid #8888aa; background-color:#f7f8ff;padding:5px;font-size:95%;" | Quelle: FAO (2015): Soil funtions, https://www.fao.org/resources/infographics/infographics-details/en/c/284478/<br> Lizenz: material may be copied, downloaded and printed for private study, research and teaching purposes, or for use in non-commercial products or services, provided that appropriate acknowledgement of FAO as the source and copyright holder is g… | 1 |
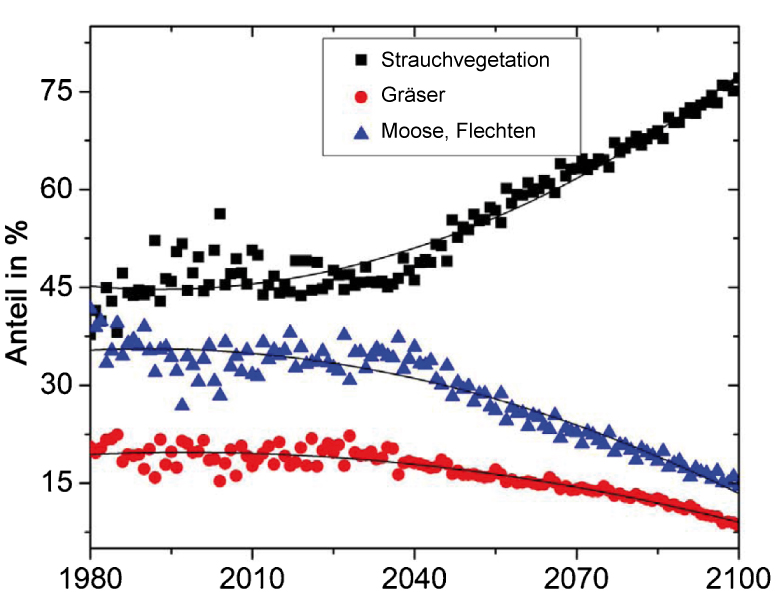
| 14:39, 26. Dez. 2021 | Tundra-Verbuschung-2100.jpg (Datei) |  |
148 KB | Dieter Kasang (Diskussion | Beiträge) | == Beschreibung == Langfristige Veränderung des Anteils an der Netto-Primärproduktion von Strauchvegetation (sgrubs)und nicht verholzenden Pflanzen (grasartige Vegetation (Graminoids) und nicht vaskuläre Pflanzen (non-vascular)) ==Lizenzhinweis== {| style="border:1px solid #8888aa; background-color:#f7f8ff;padding:5px;font-size:95%;" | Quelle: Mekonnen, Z.A., W.J. Riley and R.F. Grant(2018): 21st century tundra shrubification could enhance net carbon uptake of North America Arctic tundra under… | 1 |
| 14:33, 26. Dez. 2021 | Hardangervidda 1986.jpg (Datei) |  |
148 KB | Dieter Kasang (Diskussion | Beiträge) | == Beschreibung == Hardangervidda (Norwegen) im August. Tundra im Vordergrund, im Hintergrund ein Gletscher ==Lizenzhinweis== {| style="border:1px solid #8888aa; background-color:#f7f8ff;padding:5px;font-size:95%;" | Quelle: Wikimedia Commons (1986): Wikimedia Commons (1986): Hardangervidda, Autor: https://en.wikipedia.org/wiki/de:User:Axel_Hindemith<br /> Lizenz: Gemeinfrei |} | 1 |
| 14:24, 26. Dez. 2021 | Soil–plant–atmosphere-interactions.jpg (Datei) |  |
249 KB | Dieter Kasang (Diskussion | Beiträge) | == Beschreibung == Ausbreitung von Buschvegetation in der arktischen Tundra und die damit verbundenen Prozesse: Klimawandel (Temperatur, Niederschlag, CO2-Zunahme), Bodenfeuchtigkeit und Schneedynamik, Auftauen von Permafrost, Nährstoffe, Zerstörung (z.B. Feuer), Pflanzenfresser. +/- = Zunahme/Abnahme. ==Lizenzhinweis== {| style="border:1px solid #8888aa; background-color:#f7f8ff;padding:5px;font-size:95%;" | Quelle: Mekonnen, Z.A., W.J. Riley, L.T. Berner et al. (2021): Arctic tundra shrubific… | 1 |
| 16:56, 15. Dez. 2021 | Eu-precipitation-anomalies2018-19.jpg (Datei) |  |
334 KB | Dieter Kasang (Diskussion | Beiträge) | == Beschreibung == Abweichungen der sommerlichen Niederschläge in % vom Mittel 1980-2010 in den Jahren 2018 (links) und 2019 (rechts) == Lizenzhinweis == {| style="border:1px solid #8888aa; background-color:#f7f8ff;padding:5px;font-size:95%;" |Quelle: Hari, V., O. Rakovec, Y. Markonis et al. (2020): Increased future occurrences of the exceptional 2018–2019 Central European drought under global warming. Sci Rep 10, 12207 https://doi.org/10.1038/s41598-020-68872-9<br> Lizenz: CC BY http://creati… | 1 |
| 16:50, 15. Dez. 2021 | Drought summer 2018.jpg (Datei) |  |
83 KB | Dieter Kasang (Diskussion | Beiträge) | Räumliche Verteilung der Bodenfeuchte im Sommer 2018. Blau = hohe, rot = niedrige Bodenfeuchte, ausgedrückt durch einen Indexwert: unter -2,0 = extreme Dürre, -2,0 bis 1,5 = starke Dürre. == Lizenzhinweis == {| style="border:1px solid #8888aa; background-color:#f7f8ff;padding:5px;font-size:95%;" |Quelle: : Bastos, A., Ciais, P., Friedlingstein, P., Sitch, S., Pongratz, J., Fan, L., et al. (2020): Direct and seasonal legacy effects of the 2018 heat wave and drought on European ecosystem producti… | 1 |
| 16:49, 7. Dez. 2021 | Global-temp-decades.jpg (Datei) |  |
45 KB | Dieter Kasang (Diskussion | Beiträge) | == Beschreibung == Änderung der globalen Mitteltemperatur 1850-2020: Jahresmittel, gleitende 10-Jahresmittel und Dekaden-Mittel. ==Lizenzhinweis== {| style="border:1px solid #8888aa; background-color:#f7f8ff;padding:5px;font-size:95%;" | Quelle: Climatic Research Unit (University of East Anglia) and Met Office: Temperature https://crudata.uea.ac.uk/cru/data/temperature/ <br> Lizenz: Open Government Licence http://www.nationalarchives.gov.uk/doc/open-government-licence/version/3/ |} | 1 |
| 20:22, 30. Nov. 2021 | Stratospere temp1979-2018.jpg (Datei) | 84 KB | Dieter Kasang (Diskussion | Beiträge) | Temperaturveränderung in der Stratosphäre in 20-40 km Höhe 1979-2018 im Verhältnis zur Periode 1980-2018. Die gepunkteten Linien und die eingefügte Box oben rechts geben die Trends für die gesamte Periode und für die Zeiträume 1979–97 and 1998–2018 (von links nach rechts in der Box) in K/Jahrzehnt an. ==Lizenzhinweis== {| style="border:1px solid #8888aa; background-color:#f7f8ff;padding:5px;font-size:95%;" | Quelle: Steiner, A. K., and Coauthors, 2020: Observed Temperature Changes in the Tropos… | 1 | |
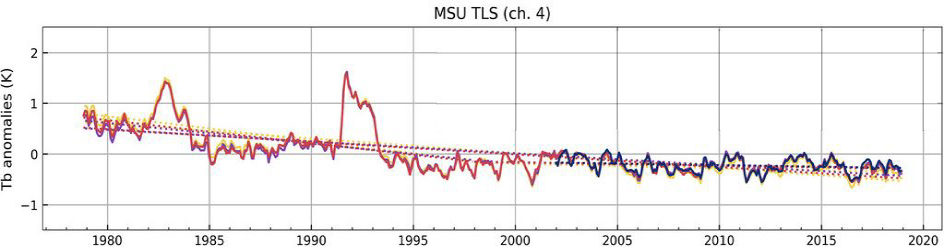
| 11:51, 30. Nov. 2021 | Stratospheric temp 1970-2020.jpg (Datei) |  |
47 KB | Dieter Kasang (Diskussion | Beiträge) | Änderung der Jahresmitteltemperatur 1979-2020 in der unteren Stratosphäre nach drei Datensätzen ==Lizenzhinweis== {| style="border:1px solid #8888aa; background-color:#f7f8ff;padding:5px;font-size:95%;" | Quelle: NOAA National Centers for Environmental Information: [https://www.ncdc.noaa.gov/temp-and-precip/msu/time-series/global/ls/ann/12 Microwave Sounding Unit Temperature Anomalies], geplottet <br> Lizenz: public domain |} | 1 |
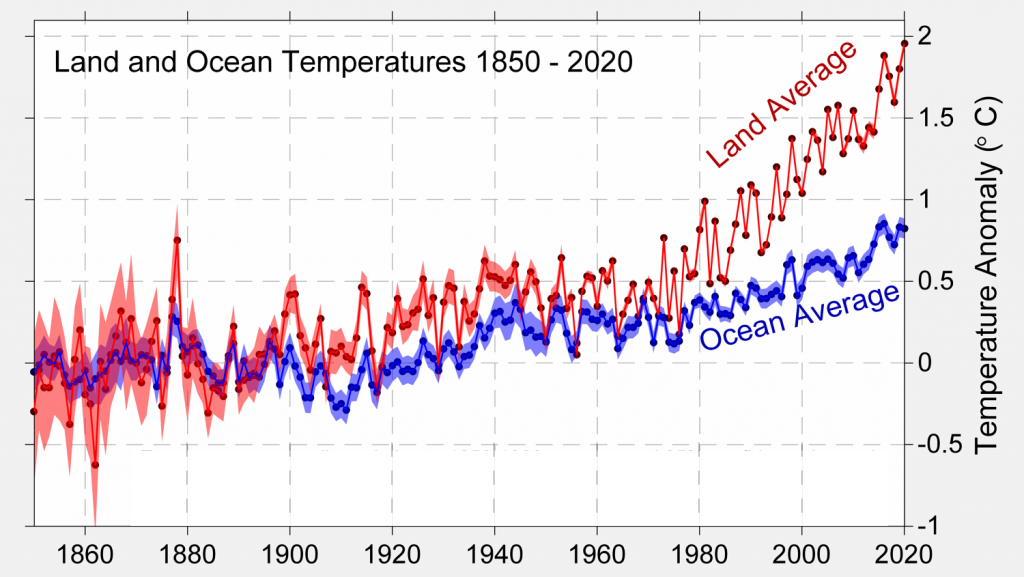
| 20:29, 29. Nov. 2021 | Land Ocean temp1850-2020.jpg (Datei) |  |
275 KB | Dieter Kasang (Diskussion | Beiträge) | Globale Jahresmitteltemperaturen 1850-2020 über dem Land und über dem Ozean, relativ zum Mittel 1850-1900 ==Lizenzhinweis== {| style="border:1px solid #8888aa; background-color:#f7f8ff;padding:5px;font-size:95%;" | Quelle: Berkeley Earth (2021): [http://berkeleyearth.org/global-temperature-report-for-2020/ Global Temperature for 2020]<br> Lizenz: [https://creativecommons.org/licenses/by/4.0/ CC BY] |} | 1 |
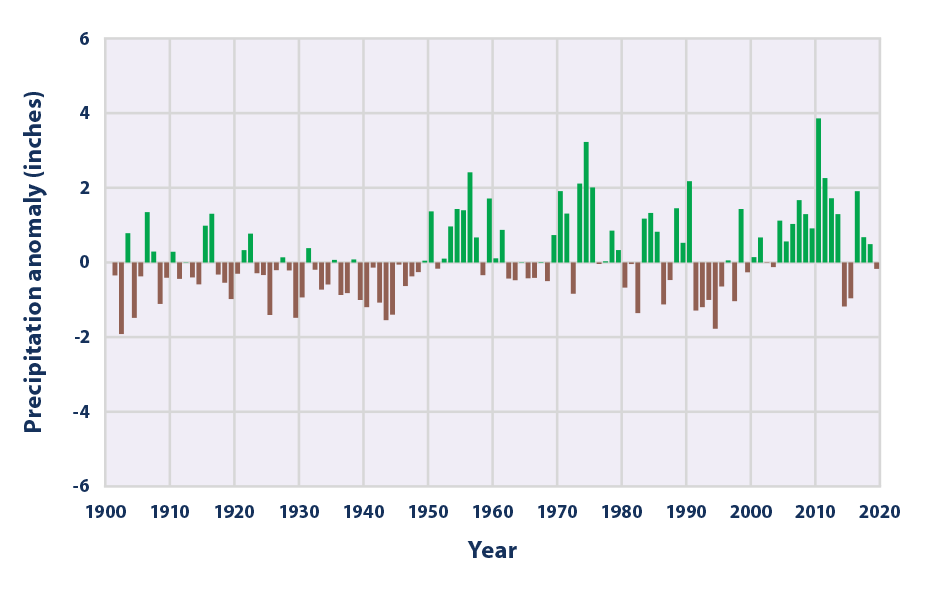
| 17:06, 28. Nov. 2021 | Precipitation global1900-2020.png (Datei) |  |
22 KB | Dieter Kasang (Diskussion | Beiträge) | Änderung der globalen jährlichen Niederschläge 1900 bis 2019 im Vergleich zum Mittel 1901-2000. ==Lizenzhinweis== {| style="border:1px solid #8888aa; background-color:#f7f8ff;padding:5px;font-size:95%;" | Quelle: EPA (United States Environmental Protection Agency): [https://www.epa.gov/climate-indicators/climate-change-indicators-us-and-global-precipitation#ref2 Climate Change Indicators: U.S. and Global Precipitation]<br> Lizenz: public domain |} | 1 |
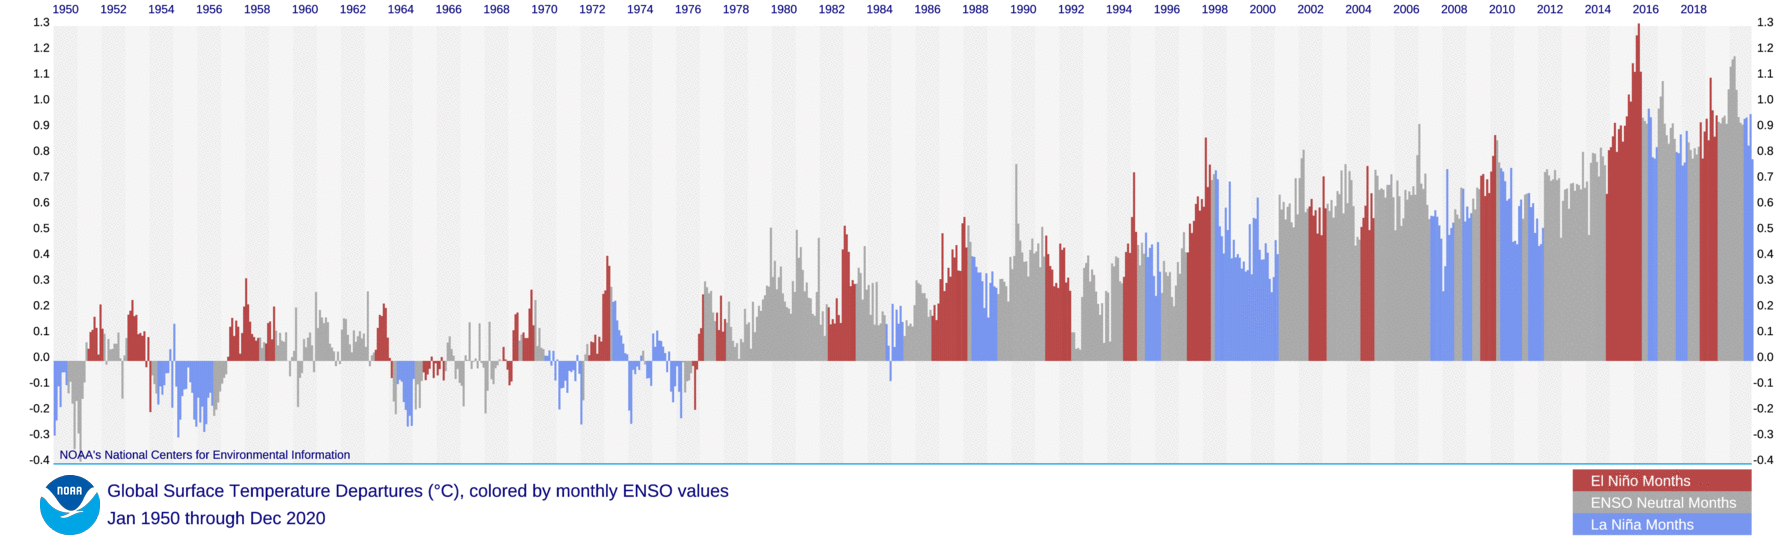
| 10:04, 28. Nov. 2021 | ENSO global temp 2020.png (Datei) |  |
511 KB | Dieter Kasang (Diskussion | Beiträge) | Globale Temperaturen und ENSO. Globale Monatsmitteltemperaturen und El-Niño- und La-Niña-Jahre 1980-2018 ==Lizenzhinweis== {| style="border:1px solid #8888aa; background-color:#f7f8ff;padding:5px;font-size:95%;" | Quelle: NOAA National Centers for Environmental Information, State of the Climate: Global Climate Report - Annual 2020 (2021): Monthly temperature anomalies versus El Niño, https://www.ncdc.noaa.gov/sotc/global/202013/supplemental/page-2<br> Lizenz: public domain |} | 1 |
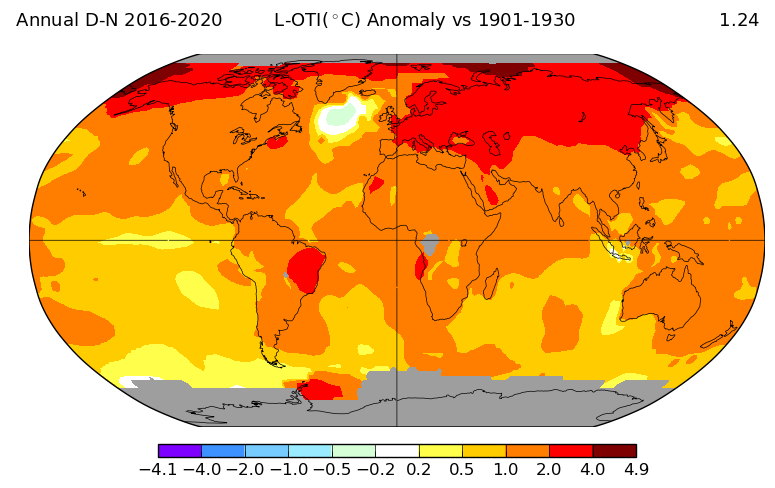
| 15:05, 27. Nov. 2021 | 2016-2020 global temp diff.png (Datei) |  |
82 KB | Dieter Kasang (Diskussion | Beiträge) | Temperaturdifferenz 2016-2020 im Vergleich zum Beginn des 20. Jahrhunderts (1901-1930) ==Lizenzhinweis== {| style="border:1px solid #8888aa; background-color:#f7f8ff;padding:5px;font-size:95%;" | Quelle: NASA (2021): GISS Surface Temperature Analysis (v4), https://data.giss.nasa.gov/gistemp/maps/ Lizenz: public domain |} | 1 |
| 13:45, 27. Nov. 2021 | CCC global temp1850-2020.jpg (Datei) |  |
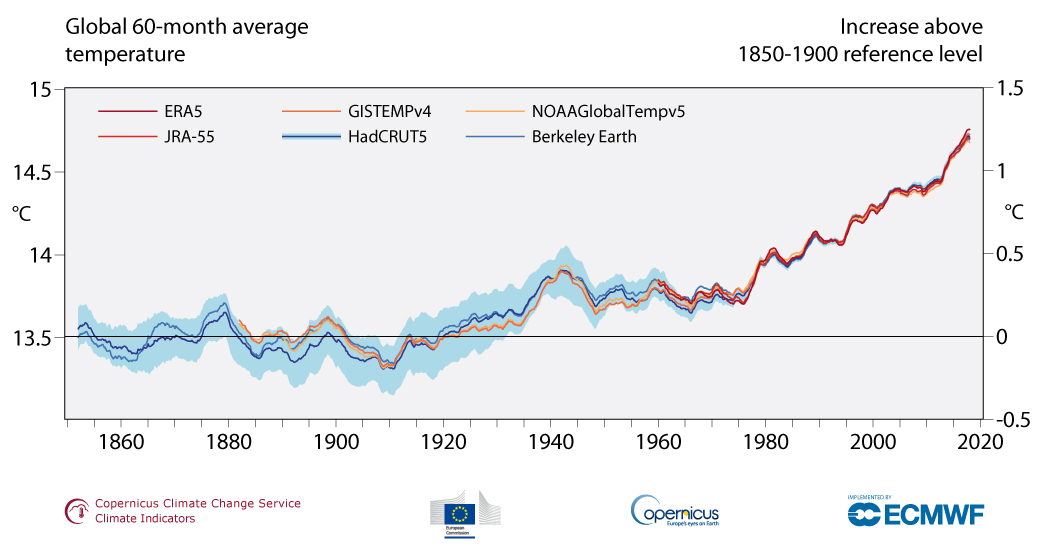
151 KB | Dieter Kasang (Diskussion | Beiträge) | == Beschreibung == Änderung der globalen 5-Jahresmitteltemperatur 1850-2020 absolut und im Vergleich zu 1850-1900 nach 6 Datensätzen. ==Lizenzhinweis== {| style="border:1px solid #8888aa; background-color:#f7f8ff;padding:5px;font-size:95%;" | Quelle: Copernicus Climate Change(2021): Globe in 2020, https://climate.copernicus.eu/climate-indicators/temperature<br> Lizenz: [https://climate.copernicus.eu/data-protection-and-privacy-statement Reproduction of the publicly available content of this… | 1 |
| 13:37, 27. Nov. 2021 | CCC global temp1970-2020.jpg (Datei) |  |
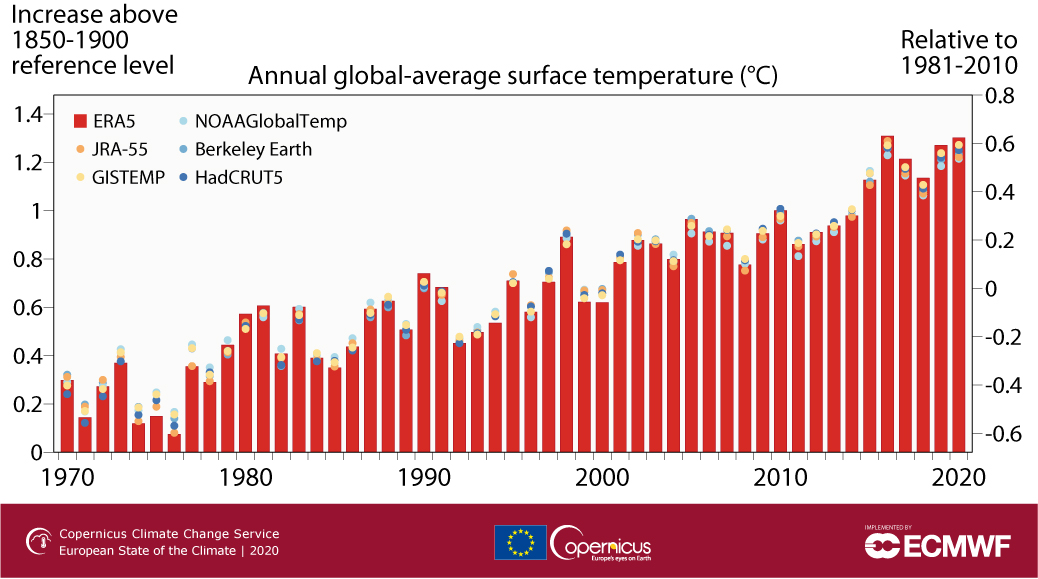
220 KB | Dieter Kasang (Diskussion | Beiträge) | Änderung der globalen Jahresmitteltemperatur 1970-2020 im Vergleich zu 1850-1900 und zu 1981-2010 nach 6 Datensätzen. ==Lizenzhinweis== {| style="border:1px solid #8888aa; background-color:#f7f8ff;padding:5px;font-size:95%;" | Quelle: Copernicus (2021): Globe in 2020, https://climate.copernicus.eu/esotc/2020/globe-in-2020 <br> Lizenz: Reproduction of the publicly available content of this website is authorised, provided the source is acknowledged, save where otherwise stated. https://clima… | 1 |
| 14:25, 20. Nov. 2021 | HCMC subsidence rate2016-2019.jpg (Datei) |  |
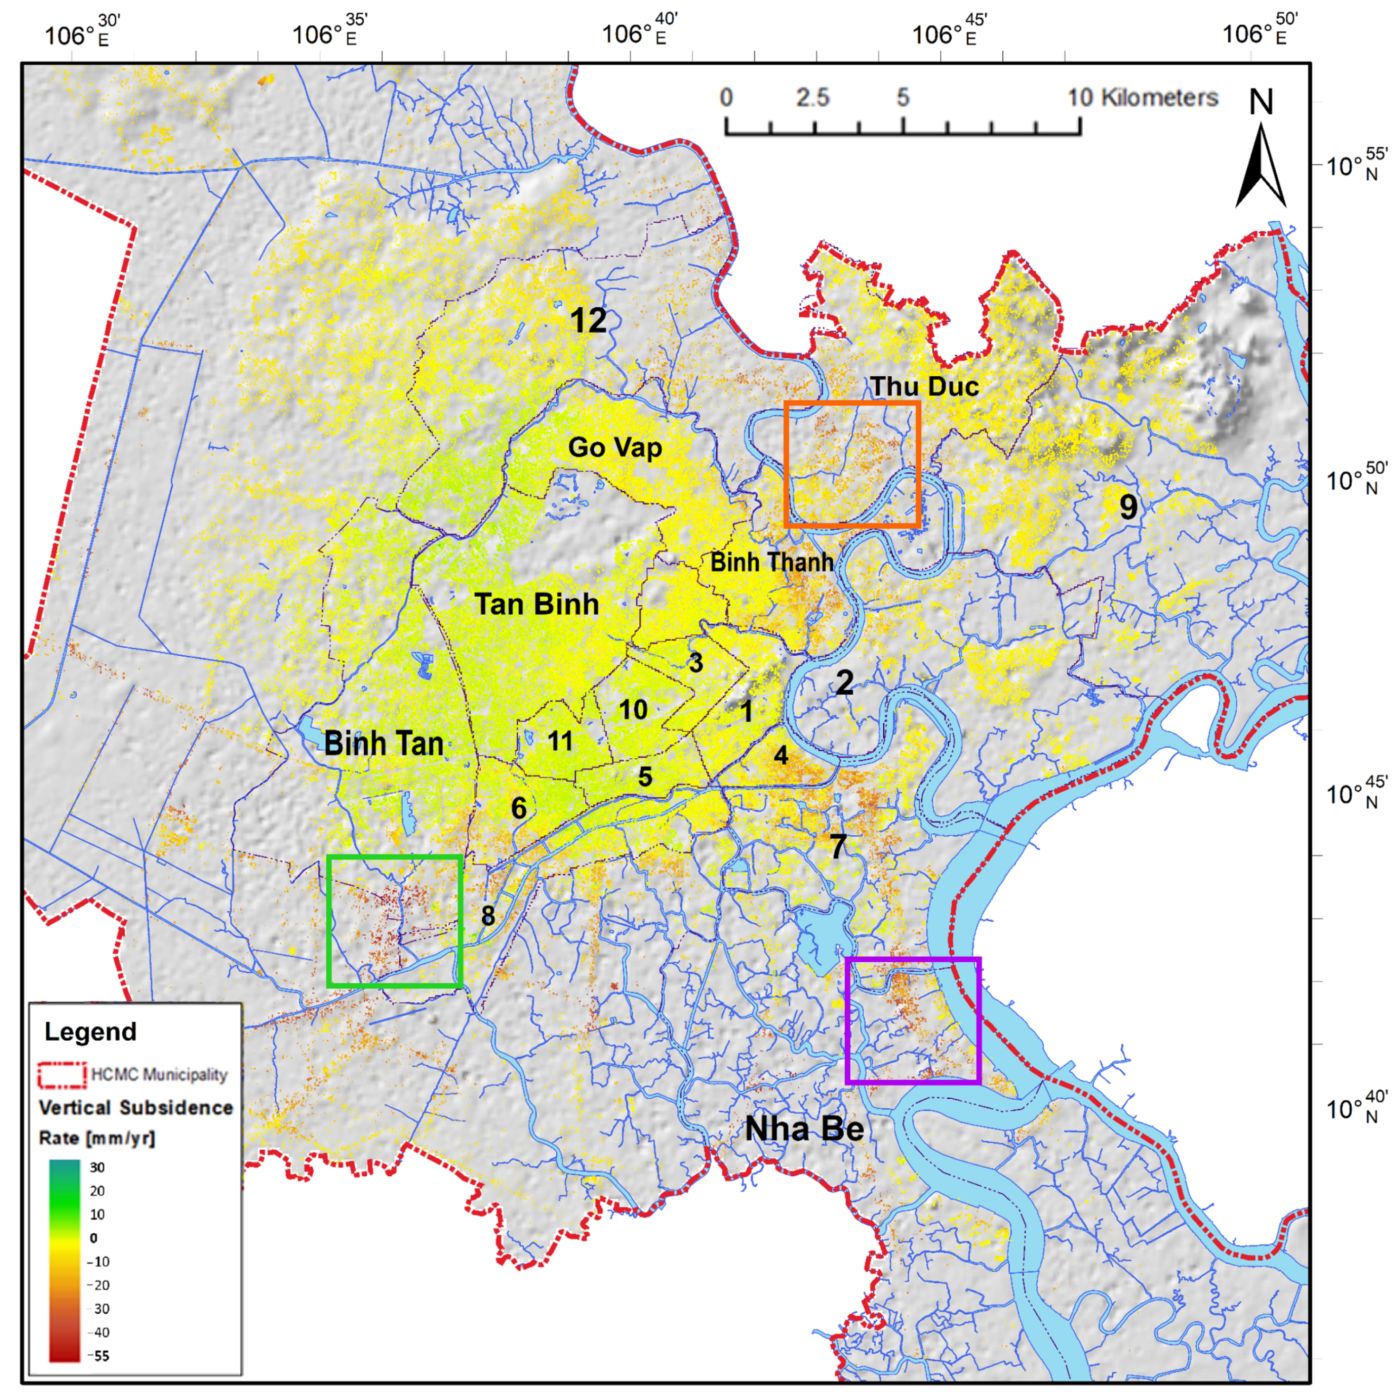
356 KB | Dieter Kasang (Diskussion | Beiträge) | == Beschreibung == Durchschnittliche Bodenabsenkung (Subsidenz) in mm/Jahr 2016-2019 in Hoh Chi Minh Stadt. ==Lizenzhinweis== {| style="border:1px solid #8888aa; background-color:#f7f8ff;padding:5px;font-size:95%;" | Quelle: Duffy, C. E., Andreas Braun, and Volker Hochschild. 2020. "Surface Subsidence in Urbanized Coastal Areas: PSI Methods Based on Sentinel-1 for Ho Chi Minh City" Remote Sensing 12, no. 24: 4130. https://doi.org/10.3390/rs12244130<br> Lizenz: [http://creativecommons.org/ CC… | 1 |
| 09:43, 20. Nov. 2021 | HCMC-SLR-2m.jpg (Datei) |  |
986 KB | Dieter Kasang (Diskussion | Beiträge) | Ho Chi Minh City und seine Manufakturbetriebe bei einem Meeresspiegelanstieg von 2 m. ==Lizenzhinweis== {| style="border:1px solid #8888aa; background-color:#f7f8ff;padding:5px;font-size:95%;" | Quelle: R. Leitold, R., J. Revilla Diez (2019): Exposure of manufacturing firms to future sea level rise in Ho Chi Minh City, Vietnam, J. Maps, 15 (1) (2019), pp. 13-20, 10.1080/17445647.2018.1548385; übersetzt<br> Lizenz: [http://creativecommons.org/licenses/by/4.0/ CC BY] |} | 1 |
| 11:44, 19. Nov. 2021 | Urban agglomerations UN.jpg (Datei) |  |
141 KB | Dieter Kasang (Diskussion | Beiträge) | == Beschreibung == Große Städte der Welt. Die Farben der Staaten geben den Urbanisierungsgrad an. Megastädte mit über 10 Mill. Einwohnern sind in großen roten Kreisen dargestellt; sie liegen besonders im süd-, südost- und ostasiatischen Raum und bevorzugt an Küsten. ==Lizenzhinweis== {| style="border:1px solid #8888aa; background-color:#f7f8ff;padding:5px;font-size:95%;" | Quelle: United Nations, Department of Economic and Social Affairs, Population Division (2019): World Urbanization Prospects… | 1 |
| 20:35, 18. Nov. 2021 | Shanghai-Grundwasser-Subsidenz.jpg (Datei) |  |
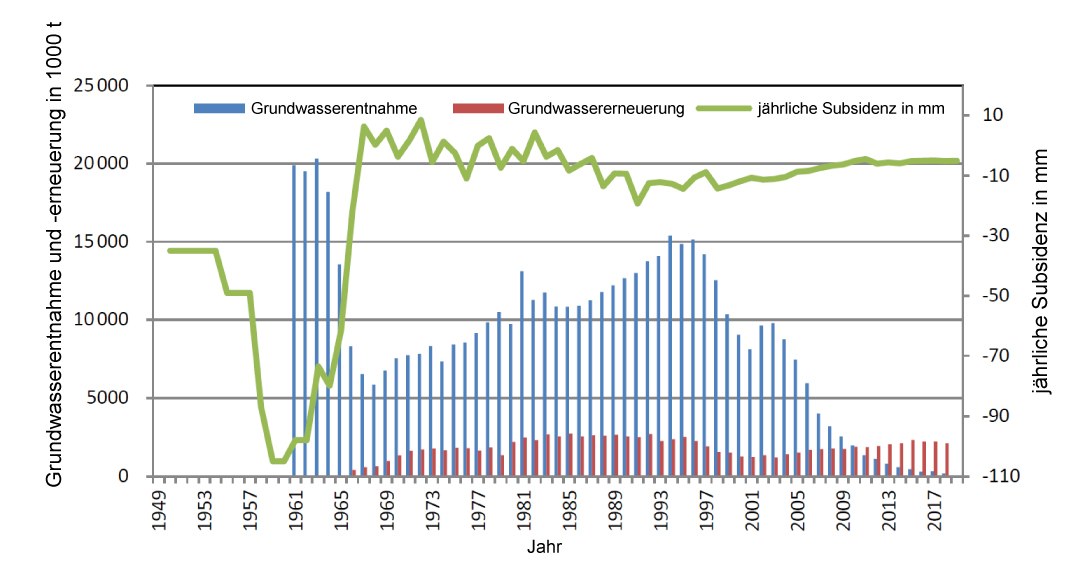
202 KB | Dieter Kasang (Diskussion | Beiträge) | == Beschreibung == Grundwasserentnahme und -erneuerung sowie jährliche Subsidenz in Shanghai 1949-2018 ==Lizenzhinweis== {| style="border:1px solid #8888aa; background-color:#f7f8ff;padding:5px;font-size:95%;" | Quelle: Yang, T., X. Yan, X. Huang, and J. Wu (2020): [https://doi.org/10.5194/piahs-382-831-2020 Integrated management of groundwater exploitation and recharge in Shanghai based on land subsidence control], Proc. IAHS, 382, 831–836<br> Lizenz: [http://creativecommons.org/licenses/by… | 1 |
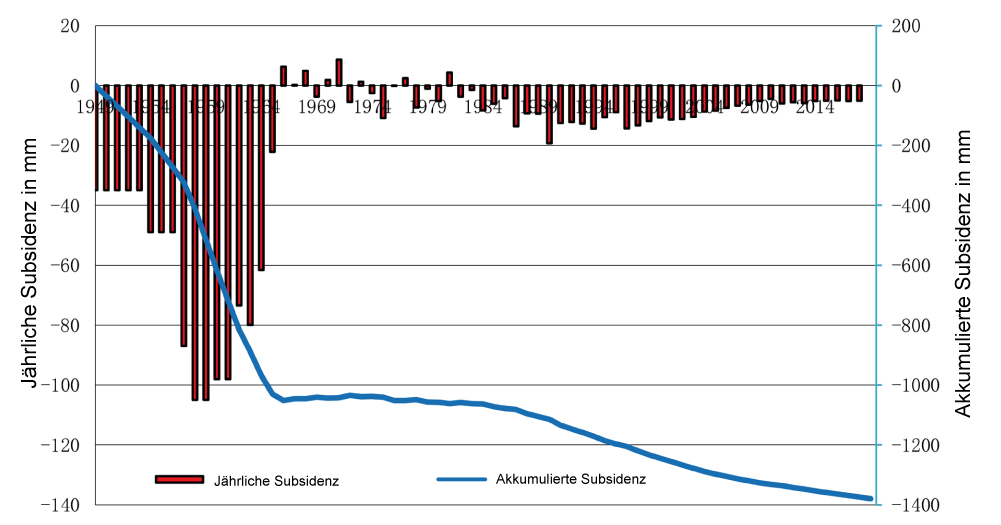
| 20:07, 18. Nov. 2021 | Shanghai-subsidence-1949-2018.jpg (Datei) |  |
128 KB | Dieter Kasang (Diskussion | Beiträge) | == Beschreibung == Jährliche und akkumulierte Subsidenz 1949-2018 in Shanghai ==Lizenzhinweis== {| style="border:1px solid #8888aa; background-color:#f7f8ff;padding:5px;font-size:95%;" | Quelle: Yang, T., X. Yan, X. Huang, and J. Wu (2020): Integrated management of groundwater exploitation and recharge in Shanghai based on land subsidence control, Proc. IAHS, 382, 831–836, https://doi.org/10.5194/piahs-382-831-2020<br> Lizenz: [http://creativecommons.org/licenses/by/4.0/ CC BY] |} | 1 |
| 20:01, 18. Nov. 2021 | Shanghai-Grundwasser-2000-2017.jpg (Datei) |  |
65 KB | Dieter Kasang (Diskussion | Beiträge) | == Beschreibung == Grundwasserentnahme und Grundwassererneuerung in Shanghai 2000-2017 ==Lizenzhinweis== {| style="border:1px solid #8888aa; background-color:#f7f8ff;padding:5px;font-size:95%;" | Quelle: He, X.-C., T.-L. Yang, S.L. Shen, Y.-S. Xu, A. Arulrajah (2019): Land subsidence control zone and policy for the environmental protection of Shanghai. Int J Environ Res Public Health 16(15):2729. https://doi. org/ 10.3390/ijerp h1615 2729<br> Lizenz: CC BY http://creativecommons.org/licenses… | 1 |
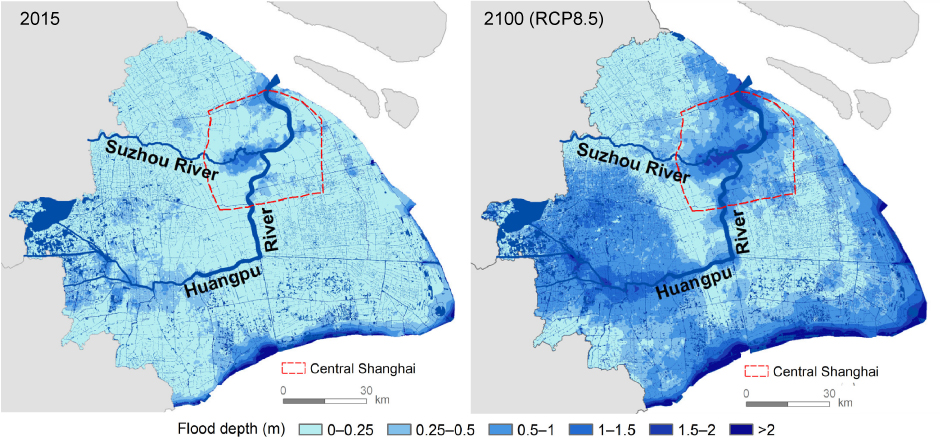
| 19:58, 18. Nov. 2021 | Shanghai-flooding-2015-RCP8.5.jpg (Datei) |  |
351 KB | Dieter Kasang (Diskussion | Beiträge) | == Beschreibung == Überflutungshöhe bei einer Sturmflut mit einer Wiederkehrperiode von 1000 Jahren 2015 und 2100 (RCP8.5). ==Lizenzhinweis== {| style="border:1px solid #8888aa; background-color:#f7f8ff;padding:5px;font-size:95%;" | Quelle: Du, S.Q., P. Scussolini, P.J. Ward et al. (2020): Hard or soft flood adaptation? Advantages of a hybrid strategy for Shanghai. Global Environmental Change, 61, 102037. https://doi.org/10.1016/j.gloenvcha.2020.102037<br> Lizenz: CC BY-NC-ND https://creativ… | 1 |
| 19:54, 18. Nov. 2021 | Subsidence Shanghai 1921-2016.png (Datei) |  |
1,41 MB | Dieter Kasang (Diskussion | Beiträge) | == Beschreibung == Subsidenz in Shanghai 1921-2016 ==Lizenzhinweis== {| style="border:1px solid #8888aa; background-color:#f7f8ff;padding:5px;font-size:95%;" | Quelle: He, X,-C,, T.-L. Yang, S.L. Shen, Y.-S. Xu, A. Arulrajah (2019): Land subsidence control zone and policy for the environmental protection of Shanghai. Int J Environ Res Public Health 16(15):2729. https://doi. org/ 10.3390/ijerp h1615 2729<br> Lizenz: CC BY http://creativecommons.org/licenses/by/4.0/ |} | 1 |
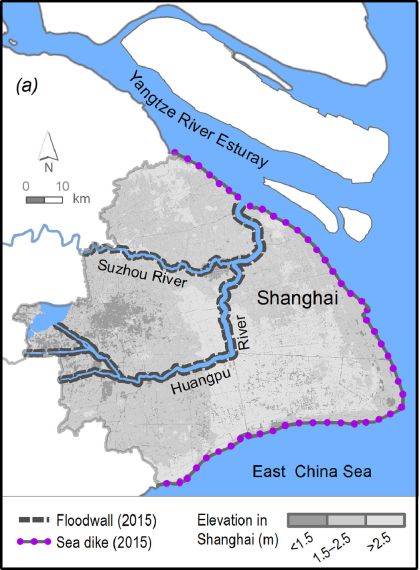
| 19:50, 18. Nov. 2021 | Shanghai flood protection.jpg (Datei) |  |
46 KB | Dieter Kasang (Diskussion | Beiträge) | Shanghai: Lage, Höhe über dem Meeresspiegel und Küstenschutz. ==Lizenzhinweis== {| style="border:1px solid #8888aa; background-color:#f7f8ff;padding:5px;font-size:95%;" | Quelle: Du, S.Q., P. Scussolini, P.J. Ward et al. (2020): Hard or soft flood adaptation? Advantages of a hybrid strategy for Shanghai. Global Environmental Change, 61, 102037. https://doi.org/10.1016/j.gloenvcha.2020.102037<br> Lizenz: CC BY-NC-ND https://creativecommons.org/licenses/by-nc-nd/4.0/ |} | 1 |
| 19:45, 18. Nov. 2021 | Jakarta-flooding-SLR-subsidence.jpg (Datei) |  |
131 KB | Dieter Kasang (Diskussion | Beiträge) | == Beschreibung == Überflutungen in Djakarta bei fortgesetzter Subsidenz und Meeresspiegelanstieg (oben) und bei einem Stopp der Subsidenz (unten) (übersetzt) ==Lizenzhinweis== {| style="border:1px solid #8888aa; background-color:#f7f8ff;padding:5px;font-size:95%;" | Quelle: Takagi, H., D. Fujii, M. Esteban, and X. Yi (2017): Effectiveness and Limitation of Coastal Dykes in Jakarta: The Need for Prioritizing Actions against Land Subsidence, Sustainability 9, no. 4: 619. https://doi.org/10.3390/… | 1 |
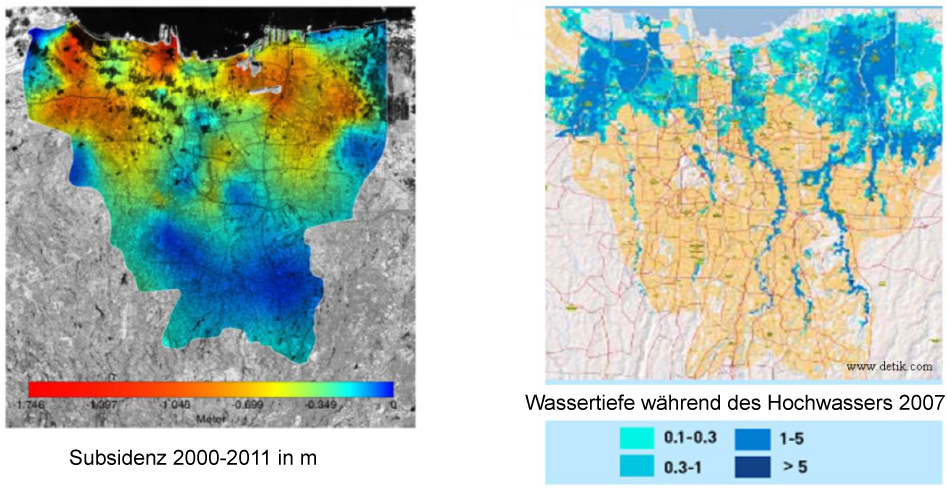
| 17:00, 18. Nov. 2021 | Jakarta-subsidence-flooding-2007.jpg (Datei) |  |
327 KB | Dieter Kasang (Diskussion | Beiträge) | == Beschreibung == Subsidenz 2000 bis 2011 und die Wassertiefe während der Hochwasserkatastrophe 2007 (übersetzt) ==Lizenzhinweis== {| style="border:1px solid #8888aa; background-color:#f7f8ff;padding:5px;font-size:95%;" | Quelle: Abidin, H. Z., Andreas, H., Gumilar, I., and Wibowo, I. R. R. (2015): On correlation between urban development, land subsidence and flooding phenomena in Jakarta, Proc. IAHS, 370, 15–20, doi:10.5194/piahs-370-15-2015<br> Lizenz: CC BY |} | 1 |
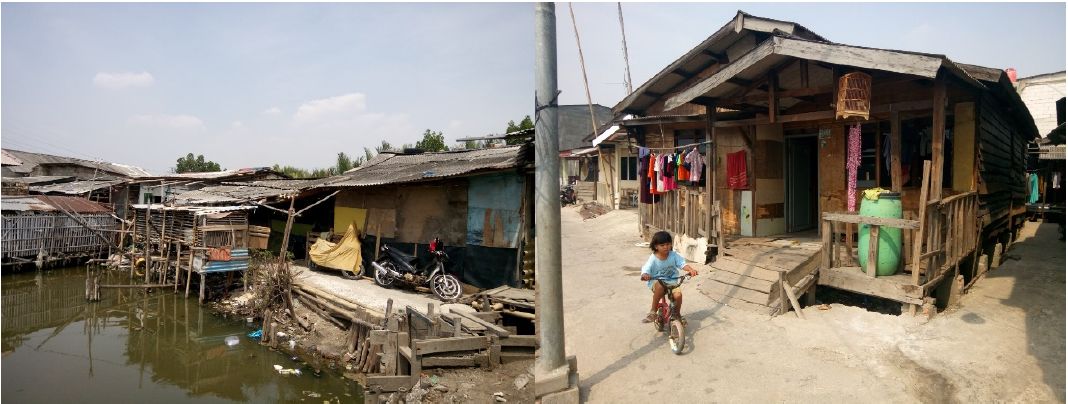
| 16:52, 18. Nov. 2021 | Jakarta settlement conditions.jpg (Datei) |  |
90 KB | Dieter Kasang (Diskussion | Beiträge) | == Beschreibung == Wohnverhältnisse in Djakarta. Links wir die prekäre Lage am Wasser deutlich. Das Haus rechts wurde gegen das Hochwasser angehoben. ==Lizenzhinweis== {| style="border:1px solid #8888aa; background-color:#f7f8ff;padding:5px;font-size:95%;" | Quelle: Yoga Putra, G.A., R.H. Koestoer and I. Lestari (2019): Local resilience towards overcoming floods of local climate change for adaptation: A study of marunda community in north jakarta, IOP Conf. Ser.: Earth Environ. Sci. 239 012043<… | 1 |
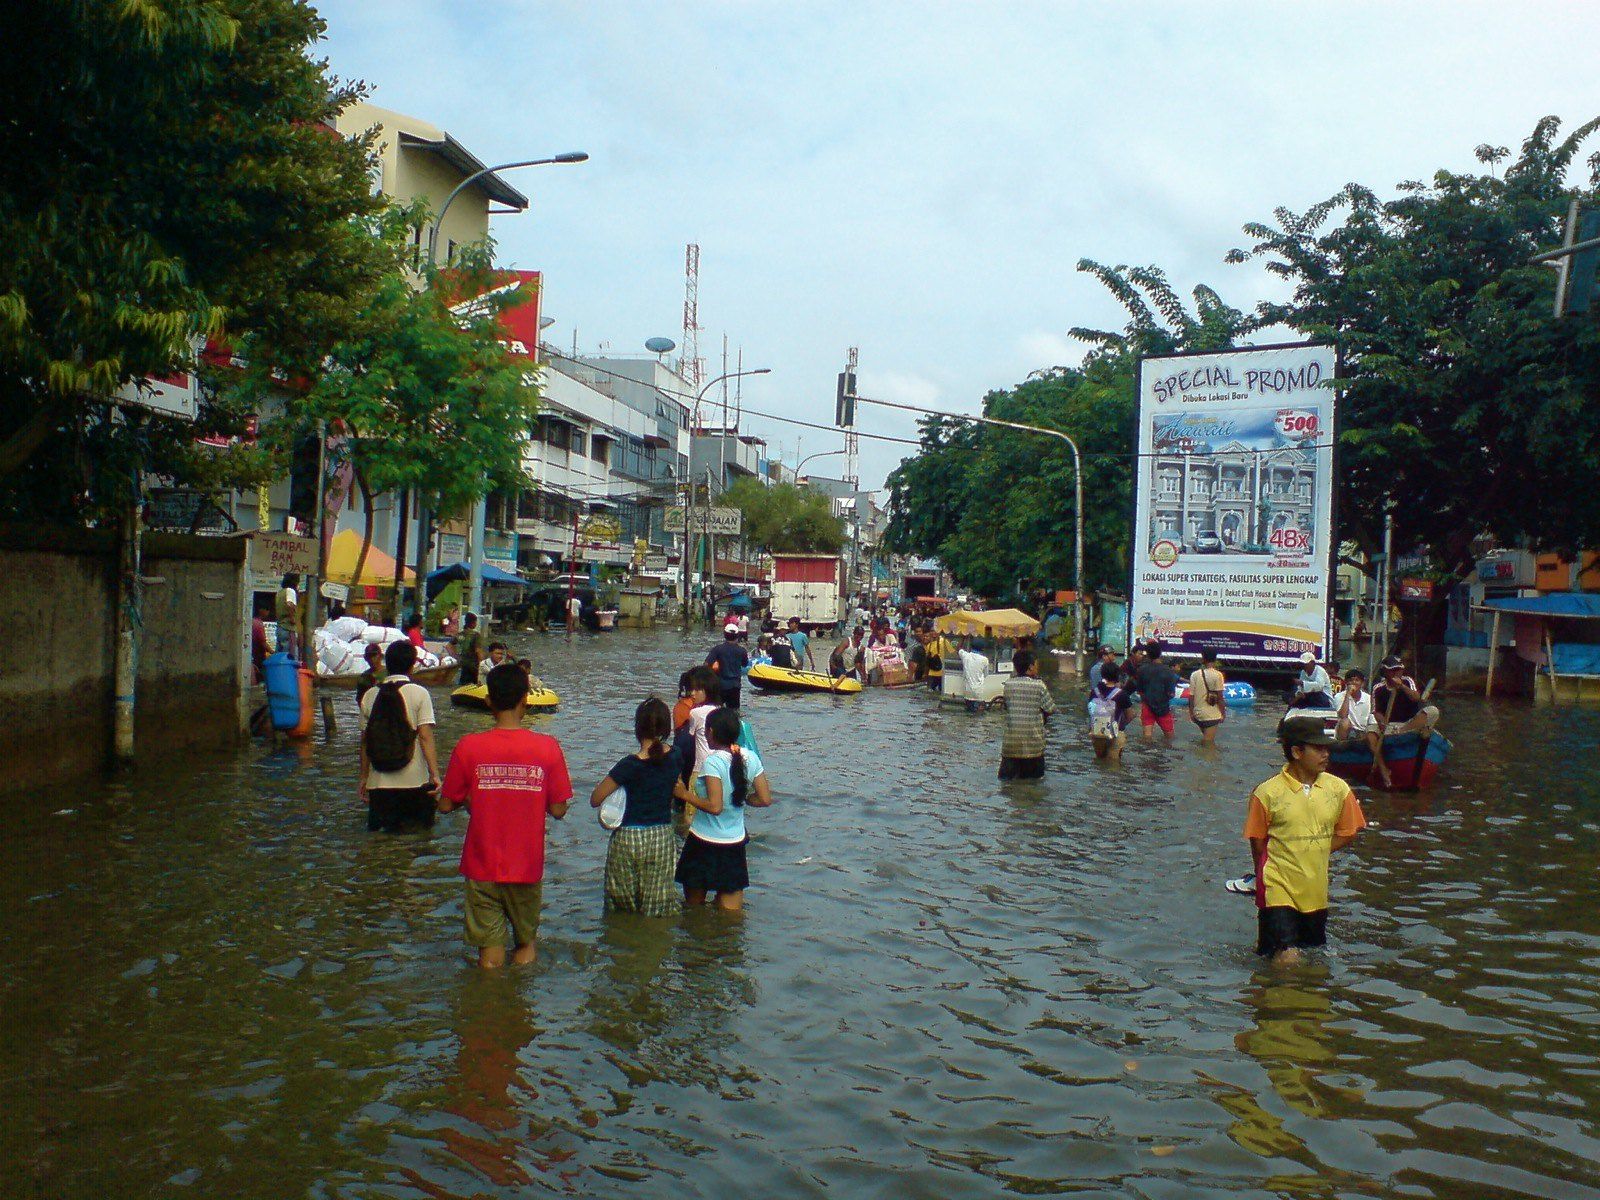
| 16:45, 18. Nov. 2021 | Jakarta floods.jpg (Datei) |  |
406 KB | Dieter Kasang (Diskussion | Beiträge) | == Beschreibung == Menschen auf einem überfluteten Marktplatz in Djakarta ==Lizenzhinweis== {| style="border:1px solid #8888aa; background-color:#f7f8ff;padding:5px;font-size:95%;" | Quelle: Flickr, C. Wiriawan (2007): Flooded marketplace, https://www.flickr.com/photos/shanghaidaddy/382761698/in/photostream/<br> Lizenz: CC BY-NC-ND https://creativecommons.org/licenses/by-nc-nd/2.0/ |} | 1 |
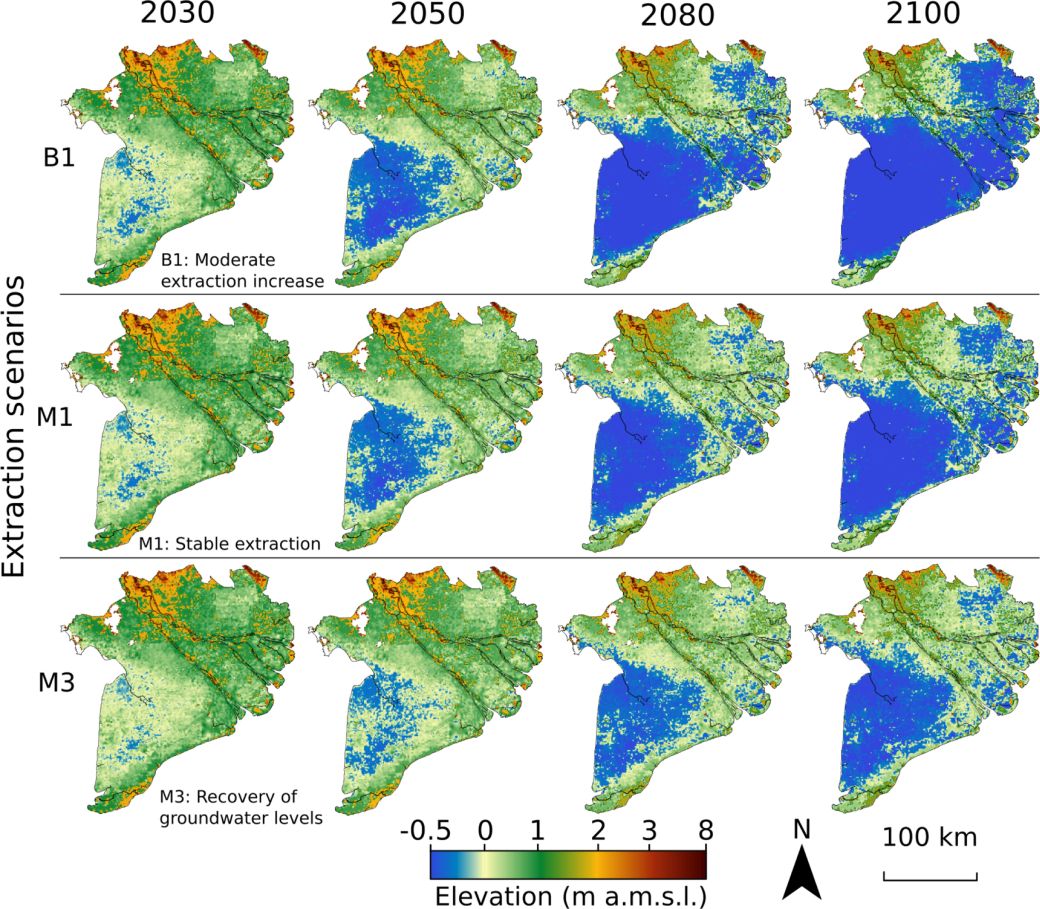
| 16:35, 18. Nov. 2021 | Mekong delta scenarios sm.jpg (Datei) |  |
246 KB | Dieter Kasang (Diskussion | Beiträge) | == Beschreibung == Projektionen des zukünftigen Oberflächenniveaus im Mekong-Delta nach verschiedenen Szenarien. B1: moderate Zunahme der Grundwasser-Extraktion; M1: Stabilisierung der Grundwasser-Extraktion; M2: Wiederherstellung der Grundwasser-Neveaus ==Lizenzhinweis== {| style="border:1px solid #8888aa; background-color:#f7f8ff;padding:5px;font-size:95%;" | Quelle: Minderhoud, P.S.J, H. Middelkoop, H., G. Erkens et al. (2020): Groundwater extraction may drown mega-delta: projections of extr… | 1 |
| 16:25, 18. Nov. 2021 | Mekong delta innundation.jpg (Datei) |  |
797 KB | Dieter Kasang (Diskussion | Beiträge) | Das Mekong-Delta mit Angaben zur Höhe jährlicher Überschwemmungen (gelb bis grün) ==Lizenzhinweis== {| style="border:1px solid #8888aa; background-color:#f7f8ff;padding:5px;font-size:95%;" | Quelle: Earth System Knowledge Platform, HZG (o.J.): Das Mekong Delta – drastische Änderungen sind wahrscheinlich, https://www.eskp.de/naturgefahren/kuestenmetropolen-senken-sich-teils-massiv-935926/<br> Lizenz: [https://creativecommons.org/licenses/by/4.0/ CC BY 4.0] |} | 1 |
