Dateiliste
Aus Klimawandel
Diese Spezialseite listet alle hochgeladenen Dateien auf.
| Datum | Name | Vorschaubild | Größe | Benutzer | Beschreibung | Versionen |
|---|---|---|---|---|---|---|
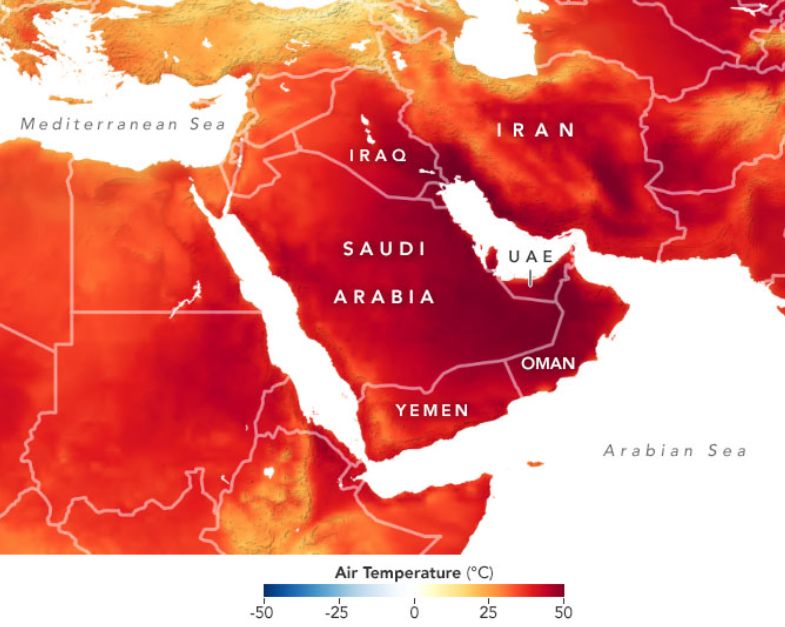
| 18:25, 10. Jul. 2021 | Middle East heat June 2021.jpg (Datei) |  |
63 KB | Dieter Kasang (Diskussion | Beiträge) | Höchsttemperaturen im Mittleren Osten am 6. Juni 2021 ==Lizenzhinweis== {| style="border:1px solid #8888aa; background-color:#f7f8ff;padding:5px;font-size:95%;" | Quelle: NASA Earth Observatory (2021): Heatwave Scorches the Middle East, https://earthobservatory.nasa.gov/images/148430/heatwave-scorches-the-middle-east <br> Lizenz: public domain |} | 1 |
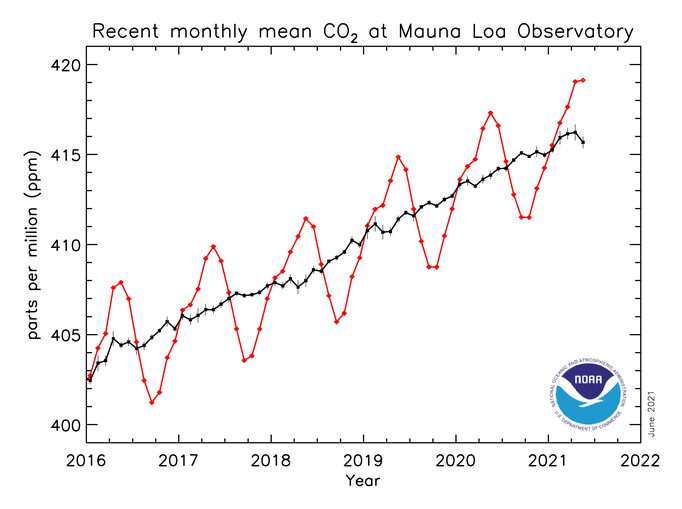
| 09:40, 22. Jun. 2021 | CO2 trend aktuell.png (Datei) |  |
84 KB | Dieter Kasang (Diskussion | Beiträge) | Monatliche CO<sub>2</sub>-Konzentration am Mauna Loa ==Lizenzhinweis== {| style="border:1px solid #8888aa; background-color:#f7f8ff;padding:5px;font-size:95%;" | Quelle: NOAA Earth System Research Laboratory (2020): [https://www.esrl.noaa.gov/gmd/ccgg/trends/ Monthly Average Mauna Loa CO<sub>2</sub>] <br> Lizenz: public domain |} | 1 |
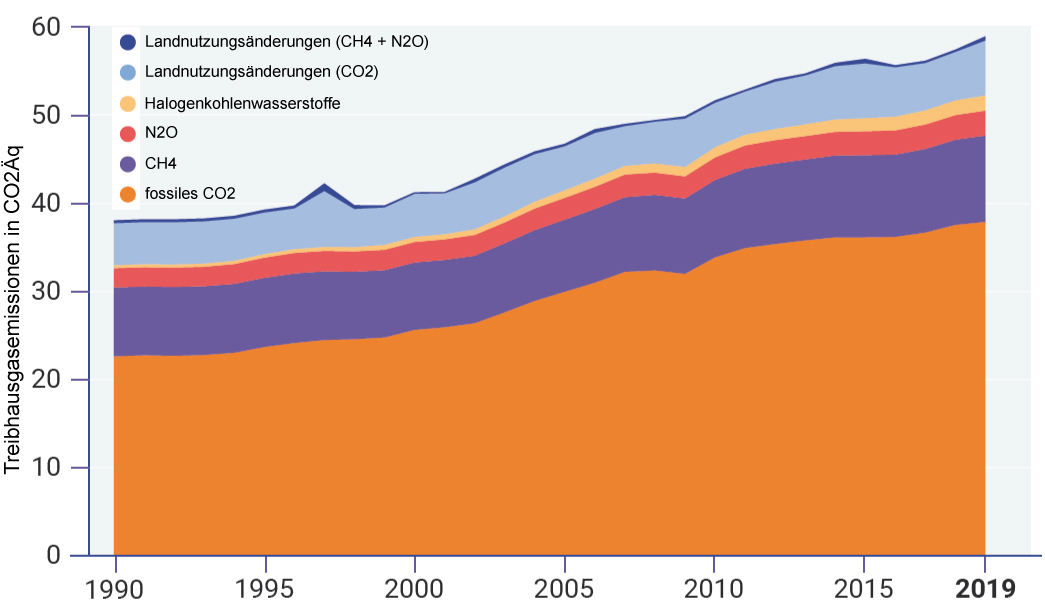
| 14:08, 20. Jun. 2021 | TG-Emissionen1990-2019.jpg (Datei) |  |
121 KB | Dieter Kasang (Diskussion | Beiträge) | == Beschreibung == Globale Treibhausgas-Emissionen für alle Quellen (von oben nach unten): Landnutzungsänderungen (CH4 und N2O), Landnutzungsänderungen (CO2), Halogenkohlenwasserstoffe, N2O, CH4, fossiles CO2 ==Lizenzhinweis== {| style="border:1px solid #8888aa; background-color:#f7f8ff;padding:5px;font-size:95%;" | Quelle: UN Environment Programme (2019): Emissions Gap Report 2019, https://www.unenvironment.org/resources/emissions-gap-report-2019 <br> Lizenz: This publication may be reproduc… | 1 |
| 19:17, 19. Jun. 2021 | GHG-emissions countries.jpg (Datei) |  |
51 KB | Dieter Kasang (Diskussion | Beiträge) | == Beschreibung == Emissionen der wichtigsten Treibhausgasemittenten in GtCO2-Äquivalente (ohne Landnutzung) ==Lizenzhinweis== {| style="border:1px solid #8888aa; background-color:#f7f8ff;padding:5px;font-size:95%;" | Quelle: UN Environment Programme (2019): Emissions Gap Report 2019, https://www.unenvironment.org/resources/emissions-gap-report-2019 <br> Lizenz: This publication may be reproduced in whole or in part and in any form for educational or non-profit services without special permis… | 2 |
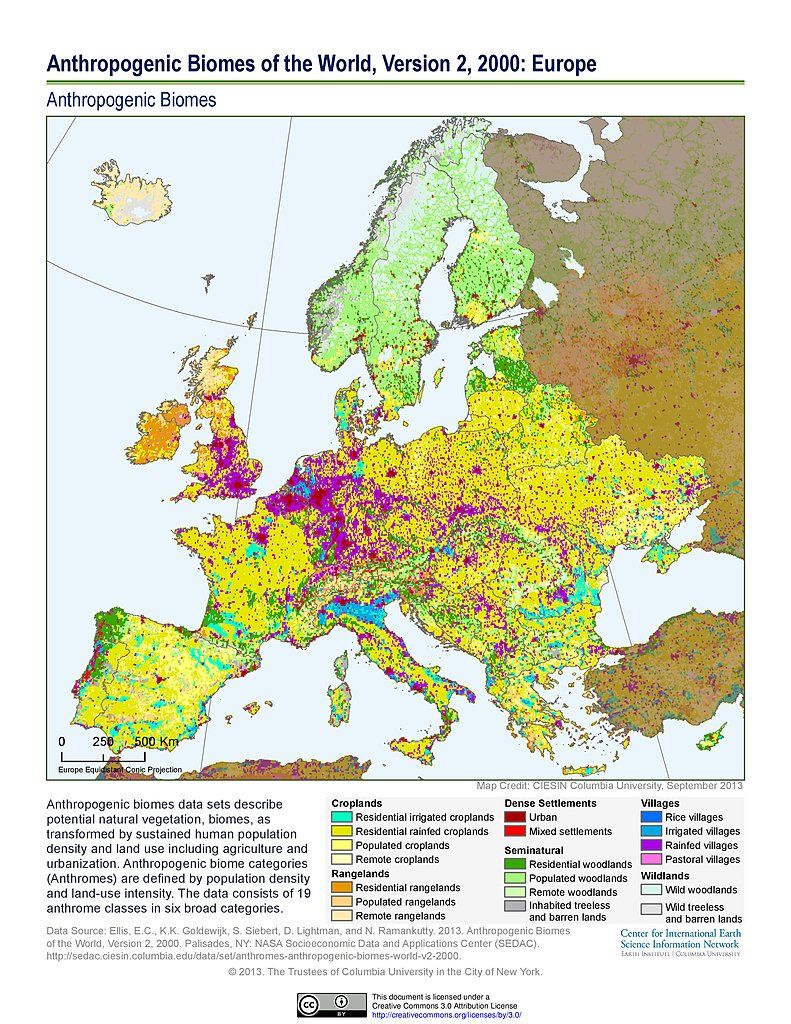
| 19:29, 6. Jun. 2021 | Anthromes Europe2000.jpg (Datei) |  |
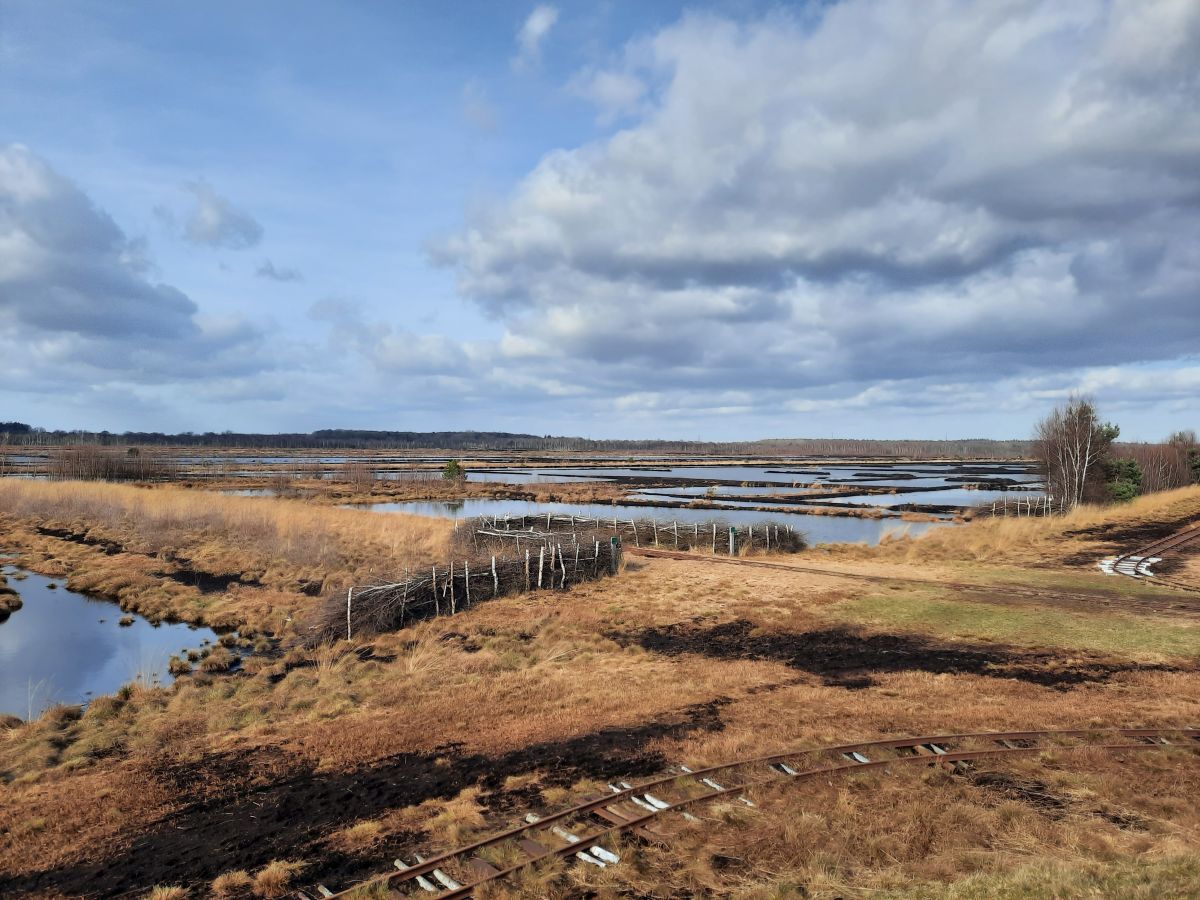
230 KB | Dieter Kasang (Diskussion | Beiträge) | == Beschreibung == Himmelmoor bei Hamburg, wiedervernässt. == Lizenzhinweis == {| style="border:1px solid #8888aa; background-color:#f7f8ff;padding:5px;font-size:95%;" | Quelle: Foto: D. Kasang, Febr. 2021<br> Lizenz: [https://creativecommons.org/licenses/by-sa/2.0/ CC BY-SA] |} | 1 |
| 19:23, 6. Jun. 2021 | Himmelmoor2.jpg (Datei) |  |
251 KB | Dieter Kasang (Diskussion | Beiträge) | == Beschreibung == Himmelmoor bei Hamburg, wiedervernässt. == Lizenzhinweis == {| style="border:1px solid #8888aa; background-color:#f7f8ff;padding:5px;font-size:95%;" | Quelle: Foto: D. Kasang, Febr. 2021<br> Lizenz: [https://creativecommons.org/licenses/by-nc-sa/2.0/ CC BY-NC-SA] |} | 1 |
| 19:18, 6. Jun. 2021 | Kemeri Bog Letland pine trees.jpg (Datei) |  |
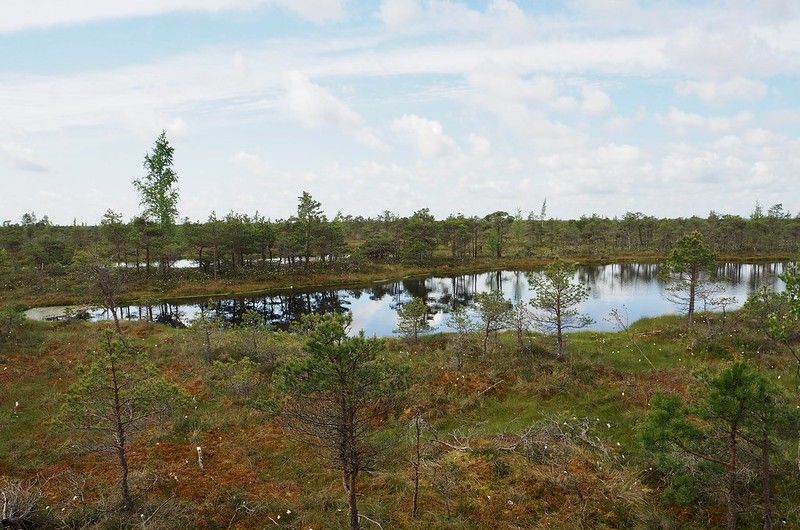
104 KB | Dieter Kasang (Diskussion | Beiträge) | == Beschreibung == Moorgebiet im Kemeri-Nationalpark, Lettland. Spärlicher Baumbewuchs (Kiefern). == Lizenzhinweis == {| style="border:1px solid #8888aa; background-color:#f7f8ff;padding:5px;font-size:95%;" | Quelle: Flickr (2017): Formation of tropical peatllands, https://www.flickr.com/photos/gridarendal/35220201616/ + GRID-Arendal, http://www.grida.no/resources/11010 <br> Lizenz: CC BY-NC-SA https://creativecommons.org/licenses/by-nc-sa/2.0/ |} | 1 |
| 19:12, 6. Jun. 2021 | EU peat cover.jpg (Datei) |  |
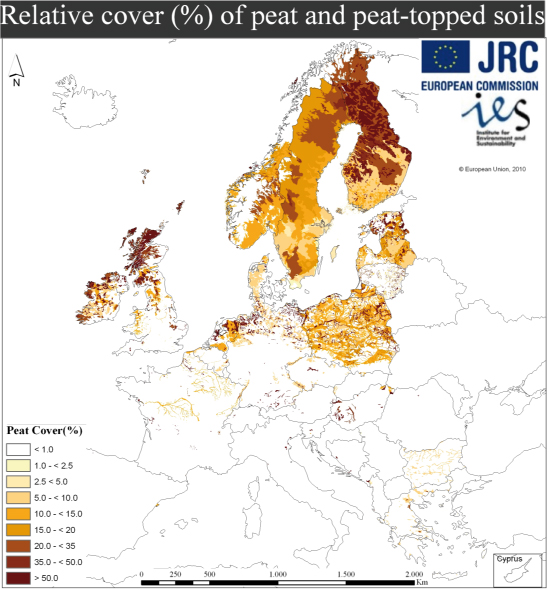
189 KB | Dieter Kasang (Diskussion | Beiträge) | Moorbedeckung in der EU in % der Gitterzellen. == Lizenzhinweis == {| style="border:1px solid #8888aa; background-color:#f7f8ff;padding:5px;font-size:95%;" | Quelle: Quelle: European Soil Data Center, https://esdac.jrc.ec.europa.eu/ESDB_Archive/octop/Resources/PeatLand_Europe.pdf <br> Lizenz: CC BY 4.0 Creative Commons Attribution 4.0 International (CC BY 4.0) licence |} | 1 |
| 19:31, 1. Jun. 2021 | Sahel-Regentage--intensität1955-2010.jpg (Datei) |  |
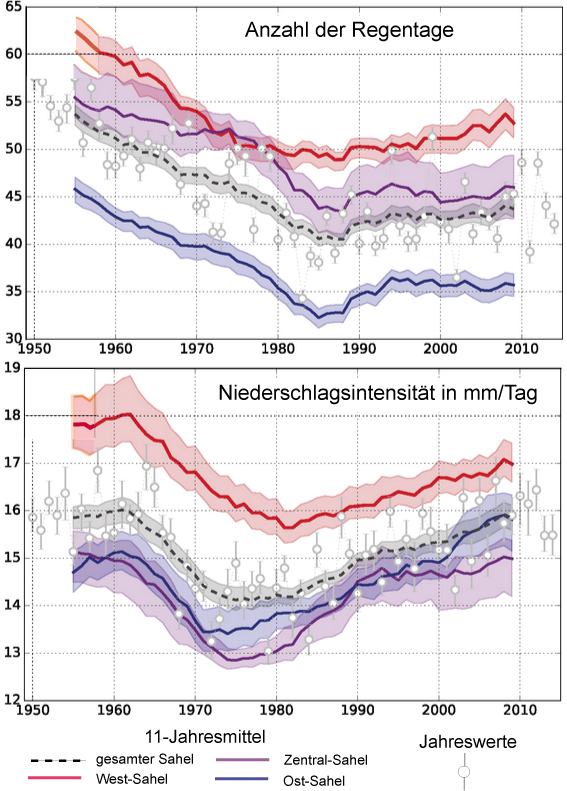
255 KB | Dieter Kasang (Diskussion | Beiträge) | == Beschreibung == Anzahl der Regentage und die Niederschlagsintensität in der Sahelzone 1955-2010. Regentage in verschiedenen Sektoren der Sahelzone als Jahres- und als 11-Jahres-Mittel. Niederschlagsintensität in mm pro Tag. ==Lizenzhinweis== {| style="border:1px solid #8888aa; background-color:#f7f8ff;padding:5px;font-size:95%;" | Quelle: Panthou, G., T. Lebel, T. Vischel et al. (2018): Rainfall intensification in tropical semi-arid regions: the Sahelian case, Environmental Research Letters,… | 1 |
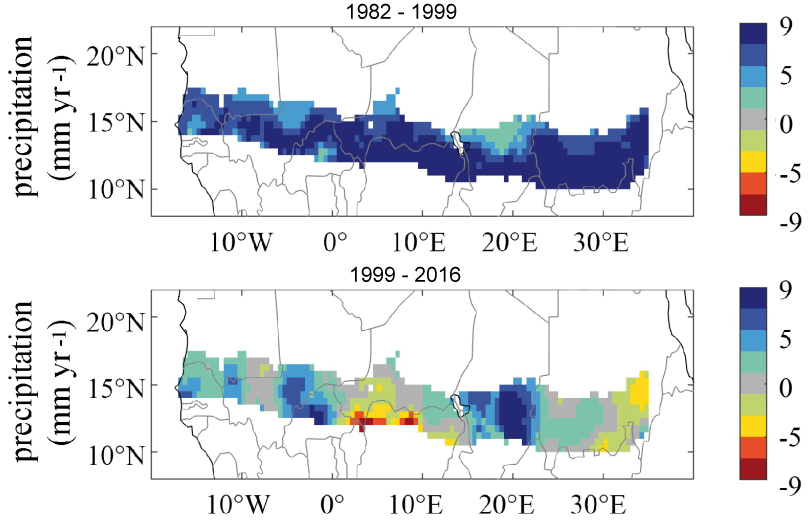
| 19:25, 1. Jun. 2021 | Sahel-prec-1982-2016.jpg (Datei) |  |
154 KB | Dieter Kasang (Diskussion | Beiträge) | Änderung der Niederschläge in mm/Jahr in der Sahelzone 1982-1999 (oben) und 1999-2016 (unten) ==Lizenzhinweis== {| style="border:1px solid #8888aa; background-color:#f7f8ff;padding:5px;font-size:95%;" | Quelle: Chen, T., S. Zhou, C. Liang et al. (2020): The Greening and Wetting of the Sahel Have Leveled off since about 1999 in Relation to SST. Remote Sensing. 2020; 12(17):2723. https://doi.org/10.3390/rs12172723<br> Lizenz: CC BY 4.0 http://creativecommons.org/licenses/by/4.0/ |} | 1 |
| 19:01, 1. Jun. 2021 | E-Africa prec 1981-2013.jpg (Datei) |  |
116 KB | Dieter Kasang (Diskussion | Beiträge) | == Beschreibung == Jahresmittel der Niederschläge in Ostafrika in mm. Eingerahmt sind besondere Untersuchungsgebiete der Quelle. ==Lizenzhinweis== {| style="border:1px solid #8888aa; background-color:#f7f8ff;padding:5px;font-size:95%;" | Quelle: Bahaga, TK, Fink, AH, Knippertz, P. Revisiting interannual to decadal teleconnections influencing seasonal rainfall in the Greater Horn of Africa during the 20th century. Int J Climatol. 2019; 39: 2765– 2785. https://doi.org/10.1002/joc.5986<br /> Lize… | 1 |
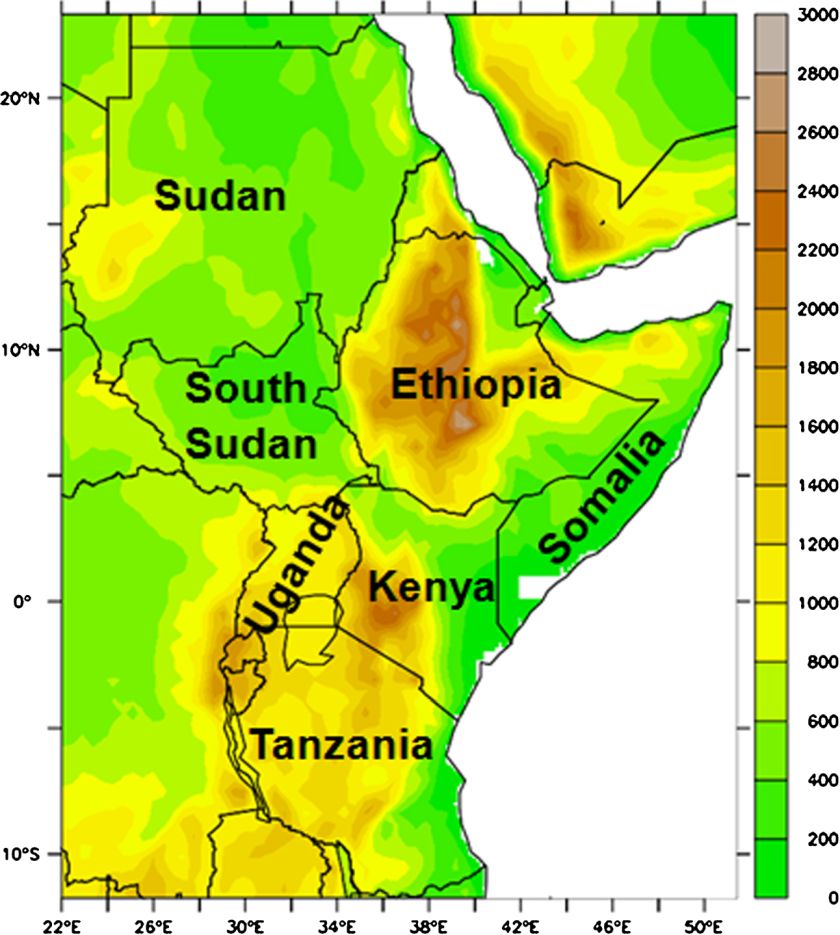
| 18:30, 1. Jun. 2021 | E-Africa Topographic.jpg (Datei) |  |
133 KB | Dieter Kasang (Diskussion | Beiträge) | == Beschreibung == Topographische Karte Ostafrikas ==Lizenzhinweis== {| style="border:1px solid #8888aa; background-color:#f7f8ff;padding:5px;font-size:95%;" | Quelle: Osima, S. et al. (2018): Projected climate over the Greater Horn of Africa under 1.5 °C and 2 °C global warming T2 - Environmental Research Letters 13 (6), https://doi.org/10.1088/1748-9326/aaba1b<br /> Lizenz: CC BY http://creativecommons.org/licenses/by/3.0/ |} | 1 |
| 18:27, 1. Jun. 2021 | Rainfall season1971-2000.jpg (Datei) |  |
62 KB | Dieter Kasang (Diskussion | Beiträge) | == Beschreibung == Mittlerer Niederschlag in mm während der Regenzeit 1971-2000 ==Lizenzhinweis== {| style="border:1px solid #8888aa; background-color:#f7f8ff;padding:5px;font-size:95%;" | Quelle: Weber, T., A. Haensler, D. Rechid, S. Pfeifer, B. Eggert and D. Jacob (2018): [https://doi.org/10.1002/2017EF000714 Analyzing Regional Climate Change in Africa in a 1.5, 2, and 3°C Global Warming World], Earth’s Future 6, 4, 643-655<br /> Lizenz: [http://creativecommons.org/licenses/by-nc-nd/4.0/ CC… | 1 |
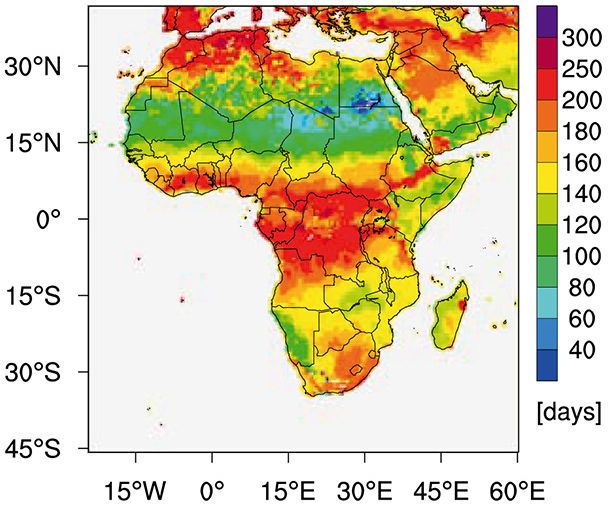
| 18:23, 1. Jun. 2021 | Rainy season length1971-2000.jpg (Datei) |  |
65 KB | Dieter Kasang (Diskussion | Beiträge) | == Beschreibung == Länge der sommerlichen Regenzeit in Tagen im Mittel 1971-2000 ==Lizenzhinweis== {| style="border:1px solid #8888aa; background-color:#f7f8ff;padding:5px;font-size:95%;" | Quelle: Weber, T., A. Haensler, D. Rechid, S. Pfeifer, B. Eggert and D. Jacob (2018): Analyzing Regional Climate Change in Africa in a 1.5, 2, and 3°C Global Warming World, Earth’s Future, https://doi.org/10.1002/2017EF000714 <br /> Lizenz: CC BY-NC-ND http://creativecommons.org/licenses/by-nc-nd/4.0/ |} | 1 |
| 18:14, 1. Jun. 2021 | Afrika JJA-Niederschlag2001-2011.jpg (Datei) |  |
58 KB | Dieter Kasang (Diskussion | Beiträge) | Monatsmittel des Sommerniederschlags (JJA) in Afrika 1901-2011 ==Lizenzhinweis== {| style="border:1px solid #8888aa; background-color:#f7f8ff;padding:5px;font-size:95%;" | Quelle: Parker, H.R., F.C Lott, R.J Cornforth et al. (2017): A comparison of model ensembles for attributing 2012 West African rainfall, Environmental Research Letters, Volume 12, Number 1, doi:10.1088/1748-9326/aa5386<br /> Lizenz: CC BY http://creativecommons.org/licenses/by/3.0/ |} | 1 |
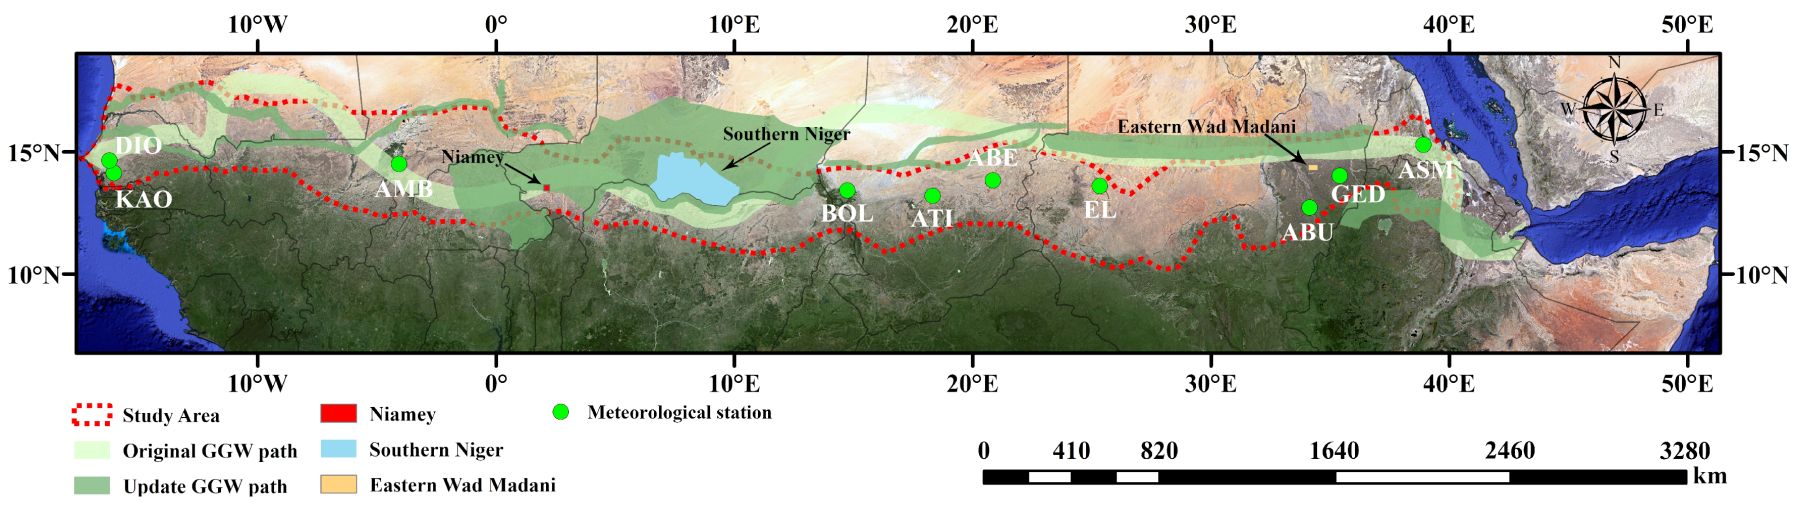
| 14:26, 1. Jun. 2021 | Sahel Great Green Wall.jpg (Datei) |  |
163 KB | Dieter Kasang (Diskussion | Beiträge) | == Beschreibung == Grüne Mauer im Sahel: Abgrenzung des Untersuchungsgebiets, ursprünglicher Verlauf, aktualisierter Verlauf, Wetterstationen == Lizenzhinweis == {| style="border:1px solid #8888aa; background-color:#f7f8ff;padding:5px;font-size:95%;" | Quelle: Wu, S., X. Gao, J. Lei, N. Zhou, Y. Wang (2020): Spatial and Temporal Changes in the Normalized Difference Vegetation Index and Their Driving Factors in the Desert/Grassland Biome Transition Zone of the Sahel Region of Africa. Remote Sens… | 1 |
| 14:21, 1. Jun. 2021 | Tree-cover-loss-W-Africa.jpg (Datei) |  |
231 KB | Dieter Kasang (Diskussion | Beiträge) | == Beschreibung == Baumbedeckungsverlust in Westafrika in Anteil pro Gitterzelle (0,05°) 2001 bis 2019 == Lizenzhinweis == {| style="border:1px solid #8888aa; background-color:#f7f8ff;padding:5px;font-size:95%;" | Quelle: Leblois, A. (2021): Mitigating the impact of bad rainy seasons in poor agricultural regions to tackle deforestation, Environmental Research Letters 16, 5, doi: https://doi.org/10.1088/1748-9326/abdbf0 <br> Lizenz: [http://creativecommons.org/licenses/by/4.0/ CC BY] |} | 1 |
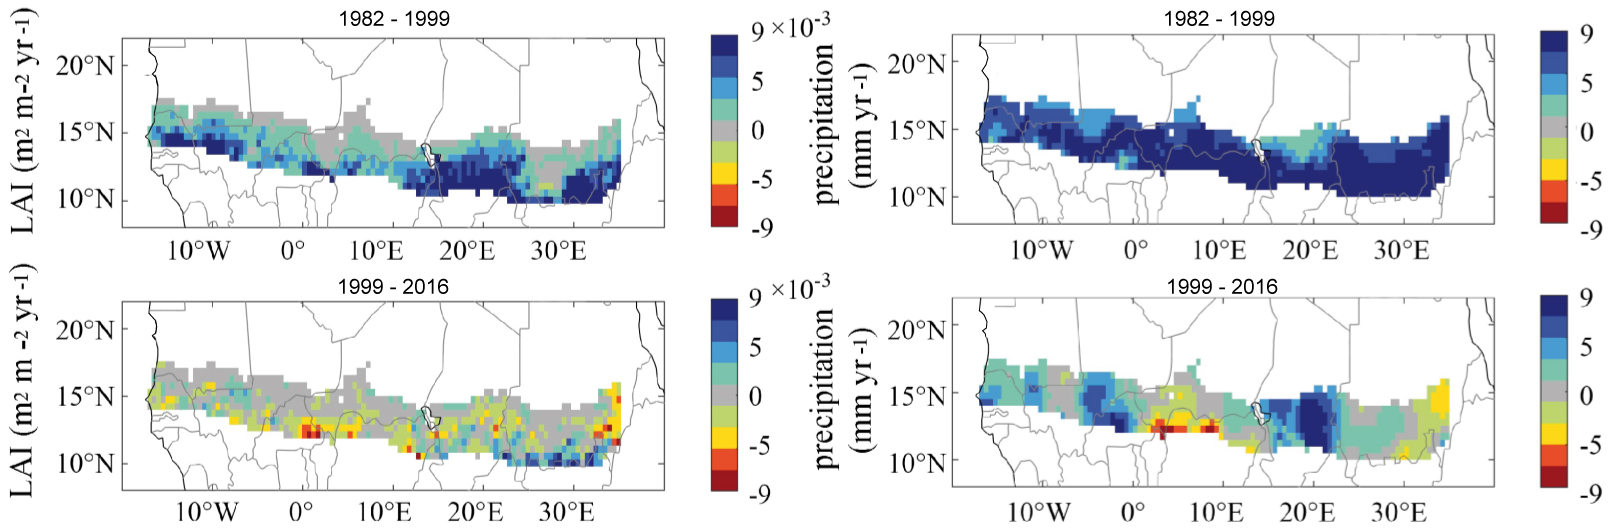
| 14:16, 1. Jun. 2021 | Sahel-LAI-prec-1982-2016.jpg (Datei) |  |
298 KB | Dieter Kasang (Diskussion | Beiträge) | == Beschreibung == Änderung des Blattflächenindex LAI (Leaf Area Index) und der Niederschläge in der Sahelzone 1982-1999 (oben) und 1999-2016 (unten) == Lizenzhinweis == {| style="border:1px solid #8888aa; background-color:#f7f8ff;padding:5px;font-size:95%;" | Quelle: Chen, T., S. Zhou, C. Liang et al. (2020): The Greening and Wetting of the Sahel Have Leveled off since about 1999 in Relation to SST. Remote Sensing. 2020; 12(17):2723. https://doi.org/10.3390/rs12172723<br> Lizenz: CC BY 4.0 ht… | 1 |
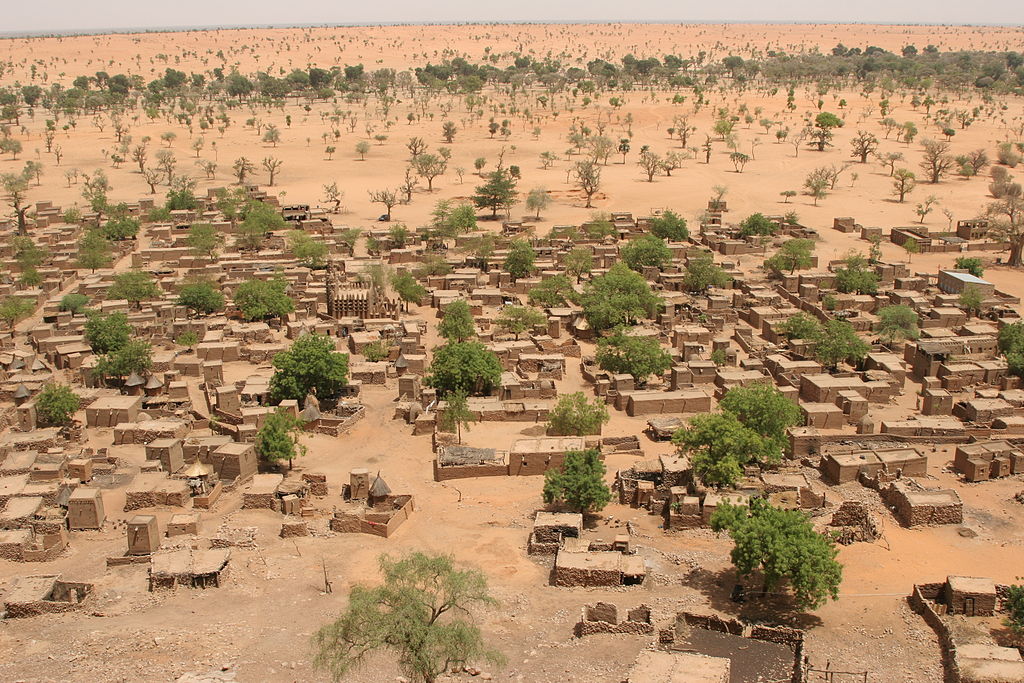
| 14:05, 1. Jun. 2021 | Village Telly in Mali.jpg (Datei) |  |
229 KB | Dieter Kasang (Diskussion | Beiträge) | == Beschreibung == Das Dorf Telly in der Nähe des Bandiagara-Felsmassivs in Mali == Lizenzhinweis == {| style="border:1px solid #8888aa; background-color:#f7f8ff;padding:5px;font-size:95%;" | Quelle: Wikimedia Commons (2008): Village Telly in Mali, Author: Ferdinand Reus, https://commons.wikimedia.org/wiki/File:Les_Falaises_de_Bandiagara.jpg<br> Lizenz: CC BY-SA https://creativecommons.org/licenses/by-sa/2.0/deed.en |} | 1 |
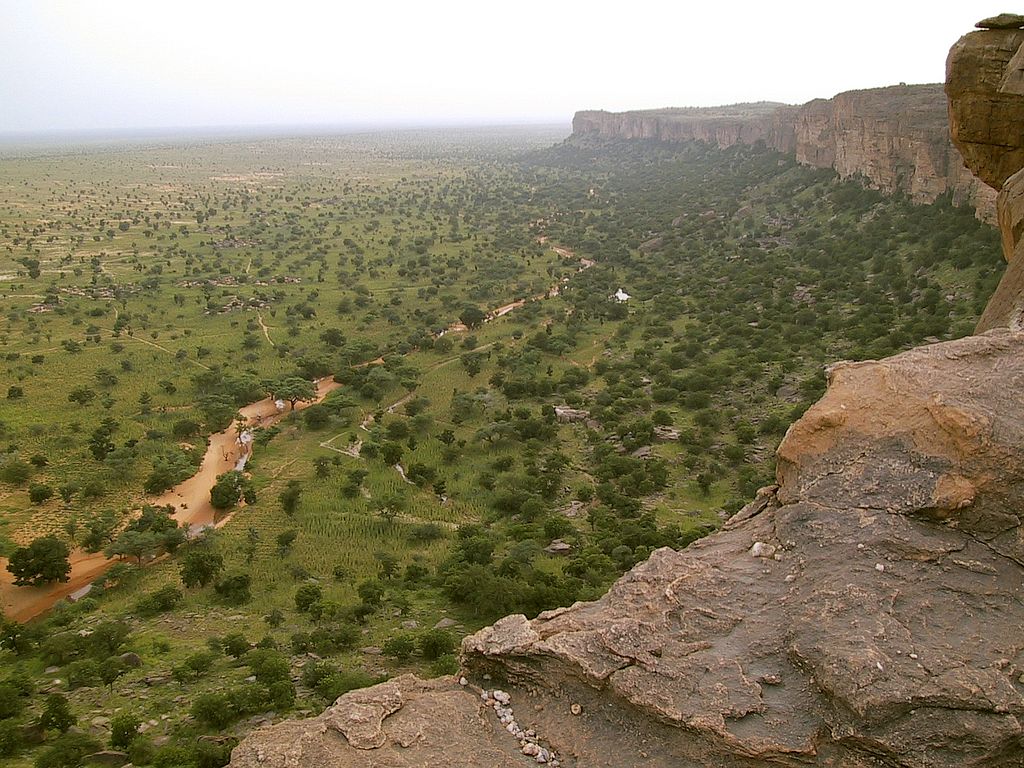
| 11:42, 1. Jun. 2021 | Mali Bandiagara Felsmassiv.jpg (Datei) |  |
198 KB | Dieter Kasang (Diskussion | Beiträge) | == Beschreibung == Savanne mit lockerem Baumbestand unterhalb des Bandiagara-Felsmassivs in Mali == Lizenzhinweis == {| style="border:1px solid #8888aa; background-color:#f7f8ff;padding:5px;font-size:95%;" | Quelle: Wikimedia Commons (2001): Les Falaises de Bandiagara, Author: Timm Guenther https://commons.wikimedia.org/wiki/File:Les_Falaises_de_Bandiagara.jpg <br> Lizenz: CC BY-SA https://creativecommons.org/licenses/by-sa/3.0/deed.en |} | 1 |
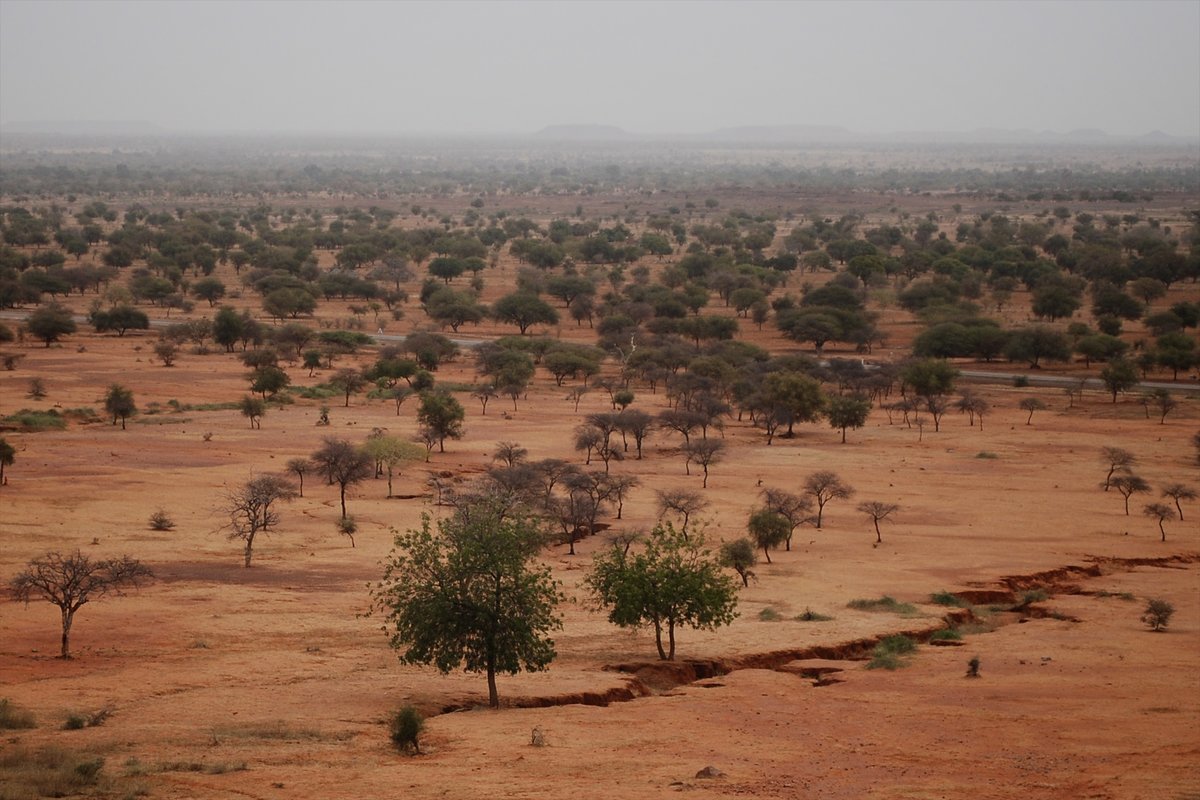
| 11:38, 1. Jun. 2021 | Sahel Bäume.jpg (Datei) |  |
178 KB | Dieter Kasang (Diskussion | Beiträge) | == Beschreibung == Savanne mit typischer Baumbedeckung im Sahel == Lizenzhinweis == {| style="border:1px solid #8888aa; background-color:#f7f8ff;padding:5px;font-size:95%;" | Quelle: N’Dri, A.B., T.D. Soro, J. Gignoux et al. (2018): [https://doi.org/10.1186/s42408-018-0005-9 Season affects fire behavior in annually burned humid savanna of West Africa]. fire ecol 14, 5 (2018)<br> Lizenz: [http://creativecommons.org/licenses/by/4.0/ CC BY] |} | 1 |
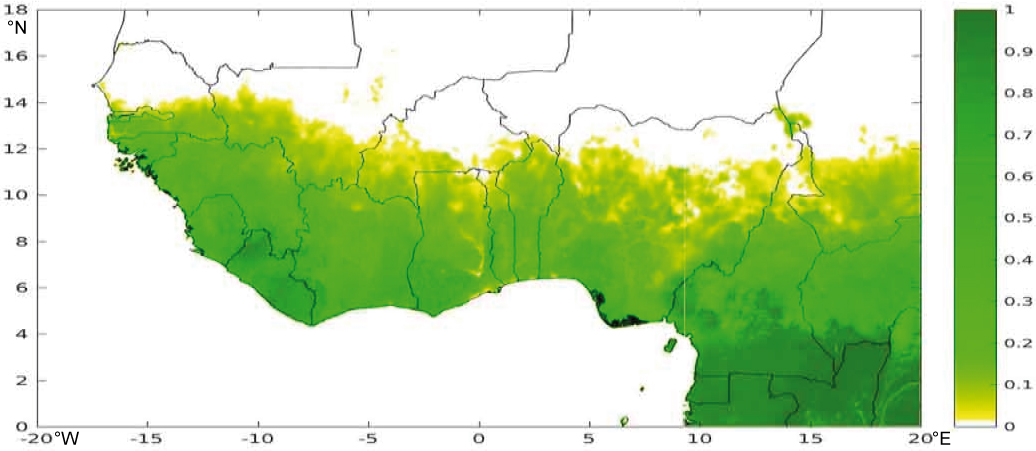
| 11:34, 1. Jun. 2021 | W-Africa-crop-area.jpg (Datei) |  |
416 KB | Dieter Kasang (Diskussion | Beiträge) | == Beschreibung == Anbaugebiete in Westafrika in Anteil pro Gitterzelle (0,05°) um 2000 == Lizenzhinweis == {| style="border:1px solid #8888aa; background-color:#f7f8ff;padding:5px;font-size:95%;" | Quelle: Leblois, A. (2021): Mitigating the impact of bad rainy seasons in poor agricultural regions to tackle deforestation, Environmental Research Letters 16, 5, doi: https://doi.org/10.1088/1748-9326/abdbf0 <br> Lizenz: [http://creativecommons.org/licenses/by/4.0/ CC BY] |} | 1 |
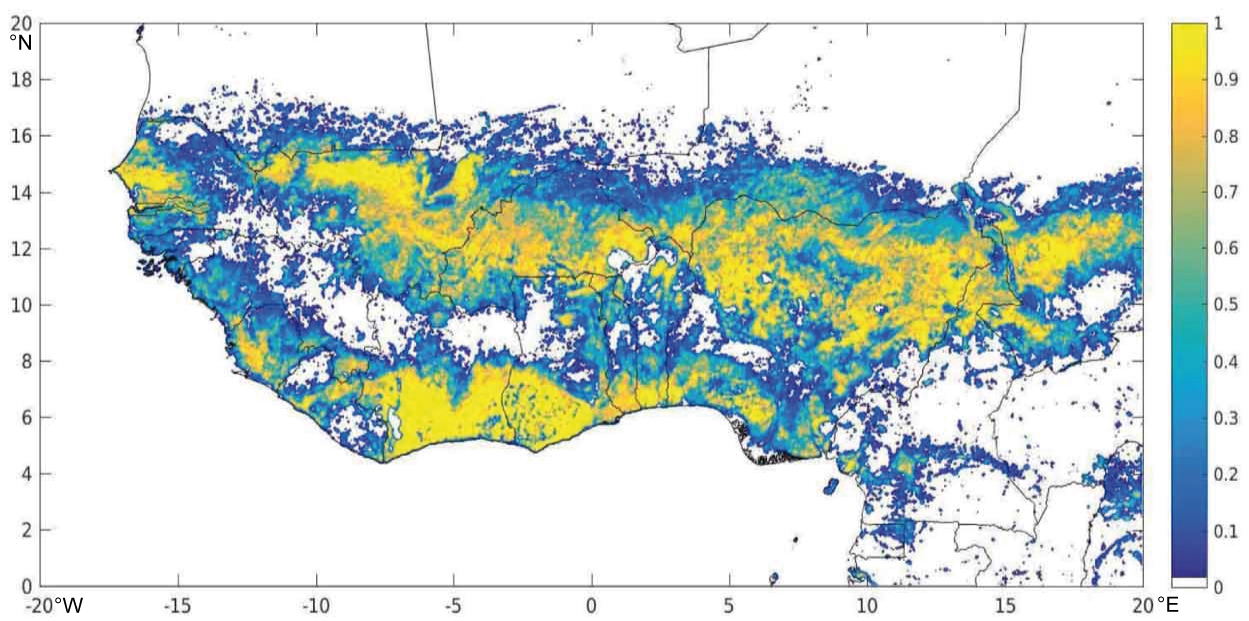
| 11:29, 1. Jun. 2021 | W-Africa-eco-climatic-zones.jpg (Datei) |  |
276 KB | Dieter Kasang (Diskussion | Beiträge) | == Beschreibung == Baumbedeckung in Westafrika in Anteil pro Gitterzelle (0,05°) um 2000 == Lizenzhinweis == {| style="border:1px solid #8888aa; background-color:#f7f8ff;padding:5px;font-size:95%;" | Quelle: Leblois, A. (2021): Mitigating the impact of bad rainy seasons in poor agricultural regions to tackle deforestation, Environmental Research Letters 16, 5, doi: https://doi.org/10.1088/1748-9326/abdbf0 <br> Lizenz: [http://creativecommons.org/licenses/by/4.0/ CC BY] |} | 1 |
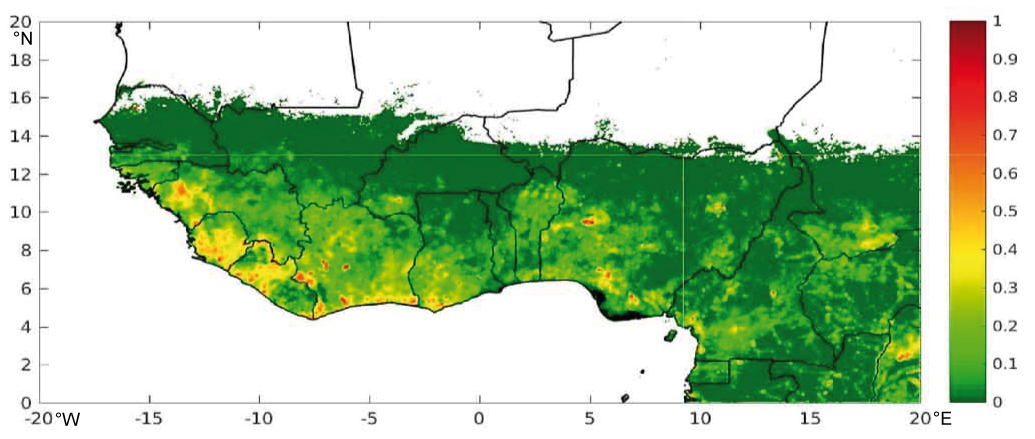
| 11:24, 1. Jun. 2021 | Baumbedeckung-W-Afrika.jpg (Datei) |  |
195 KB | Dieter Kasang (Diskussion | Beiträge) | == Beschreibung == Baumbedeckung in Westafrika in Anteil pro Gitterzelle (0,05°) == Lizenzhinweis == {| style="border:1px solid #8888aa; background-color:#f7f8ff;padding:5px;font-size:95%;" | Quelle: Leblois, A. (2021): Mitigating the impact of bad rainy seasons in poor agricultural regions to tackle deforestation, Environmental Research Letters 16, 5, doi: https://doi.org/10.1088/1748-9326/abdbf0 <br> Lizenz: [http://creativecommons.org/licenses/by/4.0/ CC BY] |} | 1 |
| 18:53, 23. Mai 2021 | Sahel-LAI-change-2100-RCP8.5.jpg (Datei) |  |
197 KB | Dieter Kasang (Diskussion | Beiträge) | == Beschreibung == Änderung des Blattflächen-Index (LAI = Leaf Area Index) im nördlichen Afrika im Juni-August 2071-2100 im Vergleich zu 1951-2005 nach RCP8.5 und 27 Modellsimulationen == Lizenzhinweis == {| style="border:1px solid #8888aa; background-color:#f7f8ff;padding:5px;font-size:95%;" | Quelle: Pausata, F.S.R., M. Gaetani, G. Messori (2020): [https://doi.org/10.1016/j.oneear.2020.03.002. The Greening of the Sahara: Past Changes and Future Implications], One Earth 2, 3, 235-250<br> Lize… | 1 |
| 18:46, 23. Mai 2021 | Greening Sahel 1982-1999.jpg (Datei) |  |
64 KB | Dieter Kasang (Diskussion | Beiträge) | == Beschreibung == Greening im Sahel 1982-1999 nach dem NDVI-Index == Lizenzhinweis == {| style="border:1px solid #8888aa; background-color:#f7f8ff;padding:5px;font-size:95%;" | Quelle: Wikimedia Commons (2005): Greening Sahel 1982-1999, https://en.wikipedia.org/wiki/File:Greening_Sahel_1982-1999.jpg <br> Lizenz: CC BY-SA https://creativecommons.org/licenses/by-sa/2.5/deed.en |} | 1 |
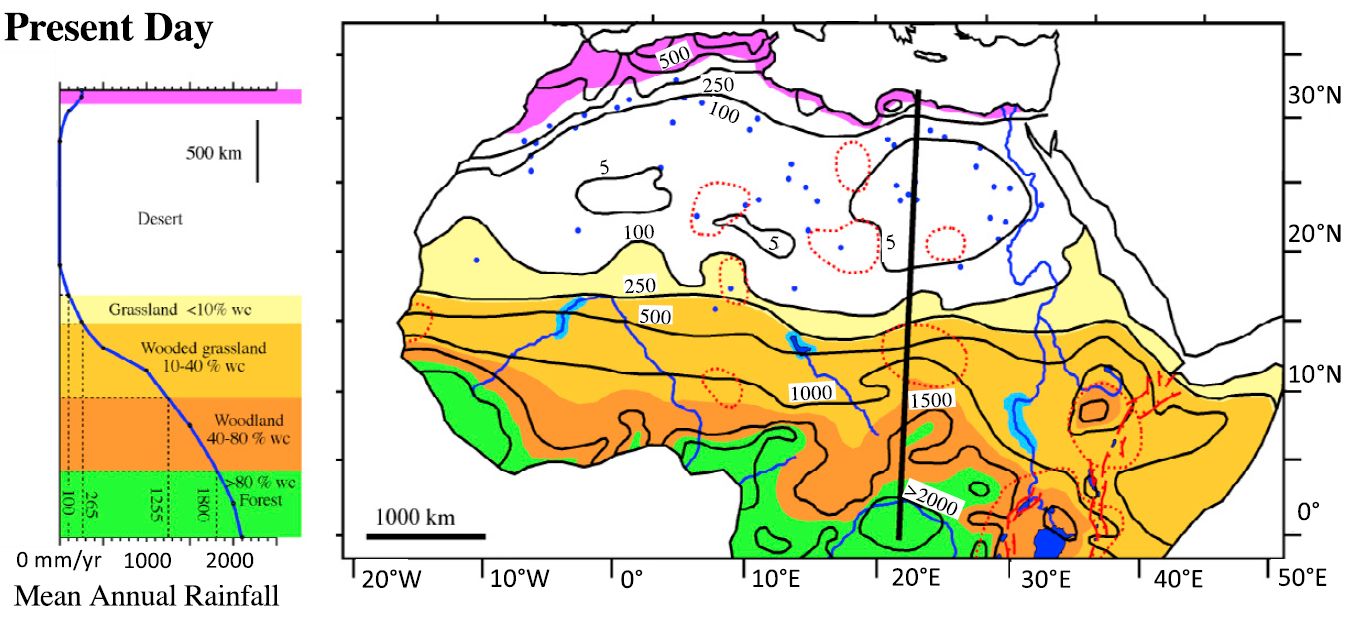
| 18:42, 23. Mai 2021 | N-Africa vegetation precipitation.jpg (Datei) |  |
136 KB | Dieter Kasang (Diskussion | Beiträge) | == Beschreibung == Vegetationszonen und Niederschlag im nördlichen Afrika == Lizenzhinweis == {| style="border:1px solid #8888aa; background-color:#f7f8ff;padding:5px;font-size:95%;" | Quelle: Pausata, F.S.R., M. Gaetani, G. Messori (2020): The Greening of the Sahara: Past Changes and Future Implications, One Earth 2, 3, 235-250, https://doi.org/10.1016/j.oneear.2020.03.002.<br> Lizenz: CC BY 4.0 https://creativecommons.org/licenses/by/4.0/ |} | 1 |
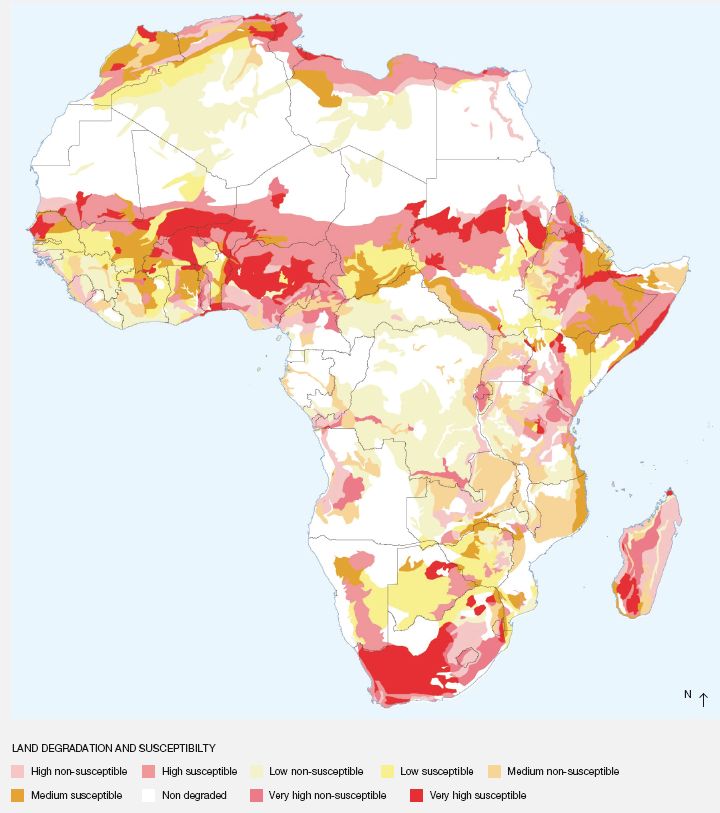
| 18:36, 23. Mai 2021 | Africa land degradation.jpg (Datei) |  |
70 KB | Dieter Kasang (Diskussion | Beiträge) | == Beschreibung == Landdegradation und Risikoniveau == Lizenzhinweis == {| style="border:1px solid #8888aa; background-color:#f7f8ff;padding:5px;font-size:95%;" | Quelle: IPBES (2018): The IPBES regional assessment report on biodiversity and ecosystem services for Africa. Archer, E. Dziba, L., Mulongoy, K. J., Maoela, M. A., and Walters, M. (eds.). Secretariat of the Intergovernmental Science-Policy Platform on Biodiversity and Ecosystem Services, Bonn, Germany, http://www.ipbes.net/ <br> Lizen… | 1 |
| 18:31, 23. Mai 2021 | Africa aboveground biomass.jpg (Datei) |  |
99 KB | Dieter Kasang (Diskussion | Beiträge) | == Beschreibung == Oberirdische Biomasse in Afrika == Lizenzhinweis == {| style="border:1px solid #8888aa; background-color:#f7f8ff;padding:5px;font-size:95%;" | Quelle: Martens, C., T. Hickler, C. Davis-Reddy et al. (2020): [https://doi.org/10.1111/gcb.15390 Large uncertainties in future biome changes in Africa call for flexible climate adaptation strategies], Glob. Change Biol., 27, 340–358<br> Lizenz: [http://creativecommons.org/licenses/by/4.0/ CC BY] |} | 1 |
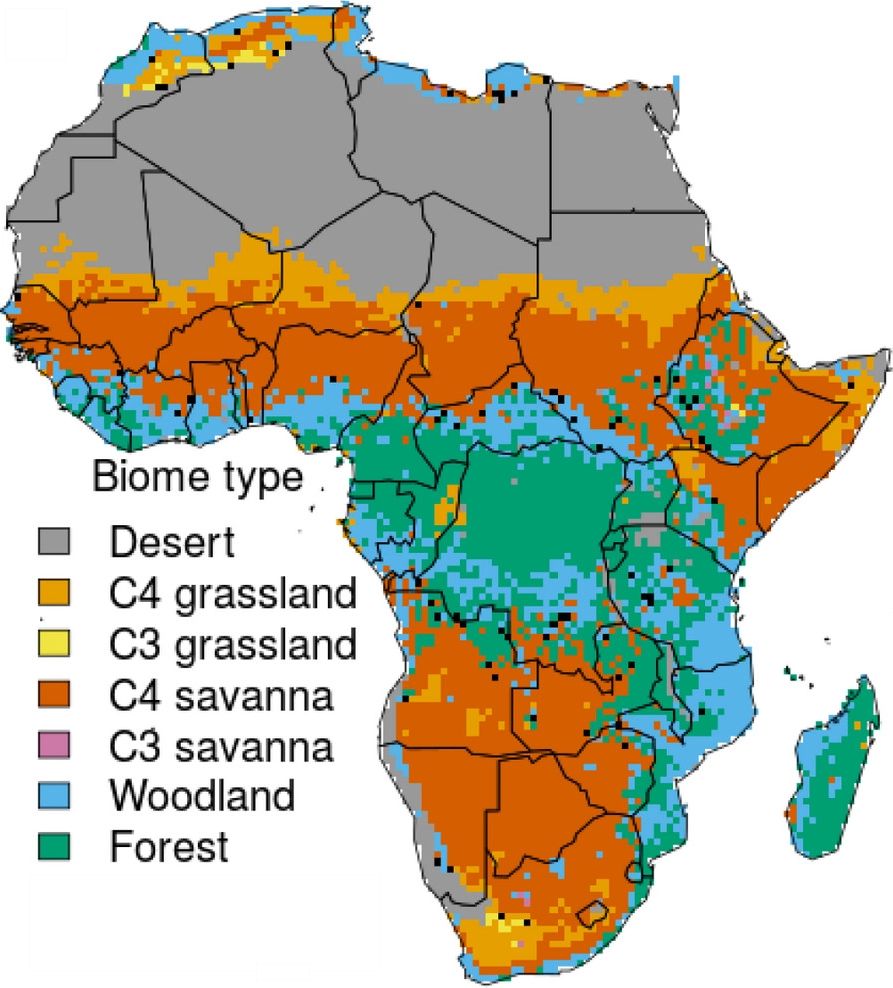
| 18:25, 23. Mai 2021 | Africa biome type.jpg (Datei) |  |
117 KB | Dieter Kasang (Diskussion | Beiträge) | == Beschreibung == Ökoregionen (Biome) in Afrika == Lizenzhinweis == {| style="border:1px solid #8888aa; background-color:#f7f8ff;padding:5px;font-size:95%;" | Quelle: Martens, C., T. Hickler, C. Davis-Reddy et al. (2020): Large uncertainties in future biome changes in Africa call for flexible climate adaptation strategies, Glob. Change Biol., 27, 340–358, https://doi.org/10.1111/gcb.15390<br> Lizenz: CC BY http://creativecommons.org/licenses/by/4.0/ |} | 1 |
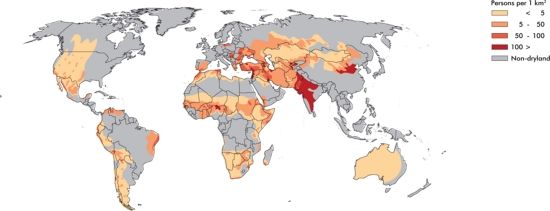
| 16:24, 18. Mai 2021 | Drylands population.jpg (Datei) |  |
17 KB | Dieter Kasang (Diskussion | Beiträge) | == Beschreibung == Landnutzung und Landbedeckung in Indien 2001 (Kreise: Untersuchungsgebiete der Studie) ==Lizenzhinweis== {| style="border:1px solid #8888aa; background-color:#f7f8ff;padding:5px;font-size:95%;" | Quelle: Parida, B.R., A.C. Pandey, N.R. Patel (2020): [https://doi.org/10.3390/cli8080092 Greening and Browning Trends of Vegetation in India and Their Responses to Climatic and Non-Climatic Drivers]. Climate. 2020; 8(8):92. <br>[http://www.grida.no/publications/425 GRID Arendal] <… | 1 |
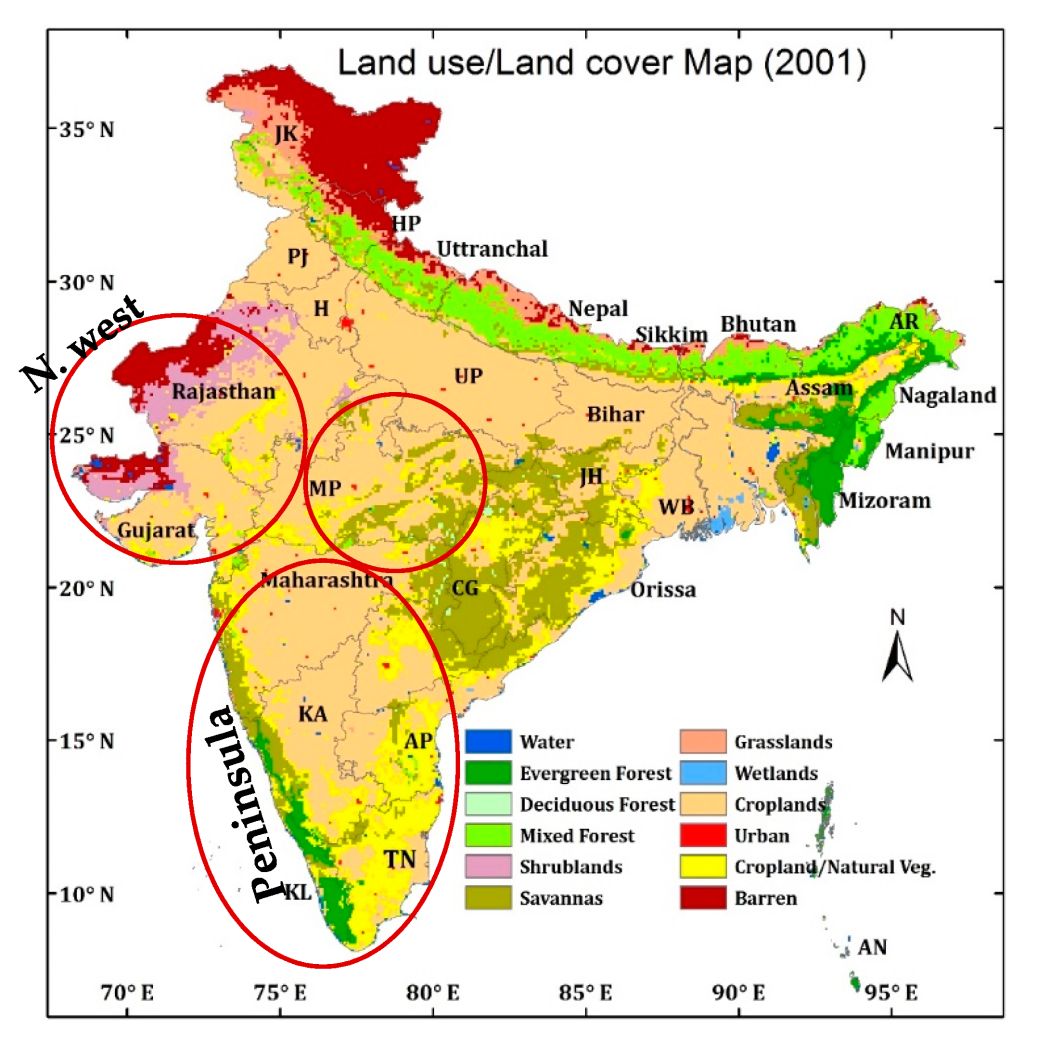
| 15:06, 18. Mai 2021 | India land-use 2001.jpg (Datei) |  |
148 KB | Dieter Kasang (Diskussion | Beiträge) | Landnutzung und Landbedeckung in Indien 2001 ==Lizenzhinweis== {| style="border:1px solid #8888aa; background-color:#f7f8ff;padding:5px;font-size:95%;" | Quelle: Parida, B.R., A.C. Pandey, N.R. Patel (2020): Greening and Browning Trends of Vegetation in India and Their Responses to Climatic and Non-Climatic Drivers. Climate. 2020; 8(8):92. https://doi.org/10.3390/cli8080092 <br>[http://www.grida.no/publications/425 GRID Arendal] <br /> Lizenz: CC BY https://creativecommons.org/licenses/by/4.0/… | 1 |
| 15:48, 14. Mai 2021 | Global drylands subtypes.jpg (Datei) |  |
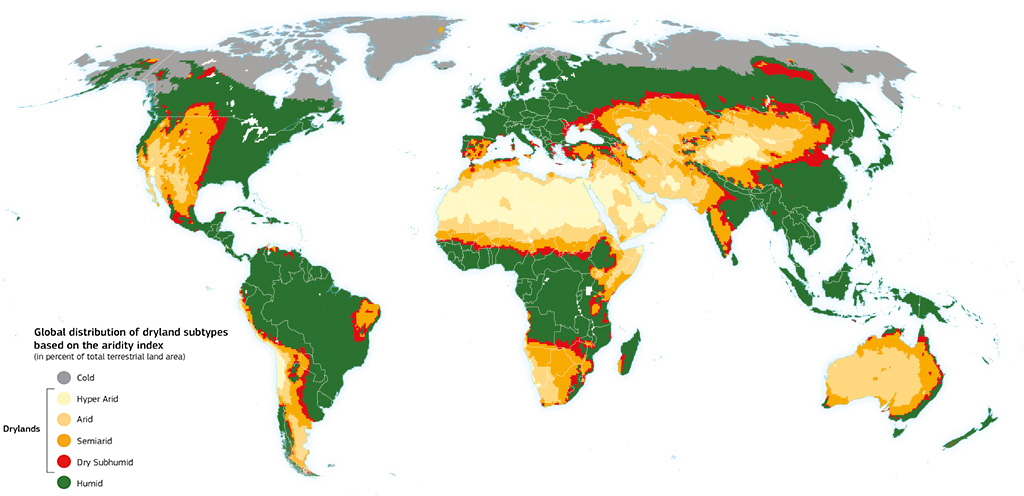
237 KB | Dieter Kasang (Diskussion | Beiträge) | == Beschreibung == Globale Trockengebiete == Lizenzhinweis == {| style="border:1px solid #8888aa; background-color:#f7f8ff;padding:5px;font-size:95%;" | Quelle: McSweeney, CarbonBrief (2019): ‘Desertification’ and the role of climate change https://www.carbonbrief.org/explainer-desertification-and-the-role-of-climate-change <br> Lizenz: CC BY-NC-ND 4.0 https://creativecommons.org/licenses/by-nc-nd/4.0/legalcode |} | 1 |
| 15:41, 14. Mai 2021 | Drylands land use.jpg (Datei) |  |
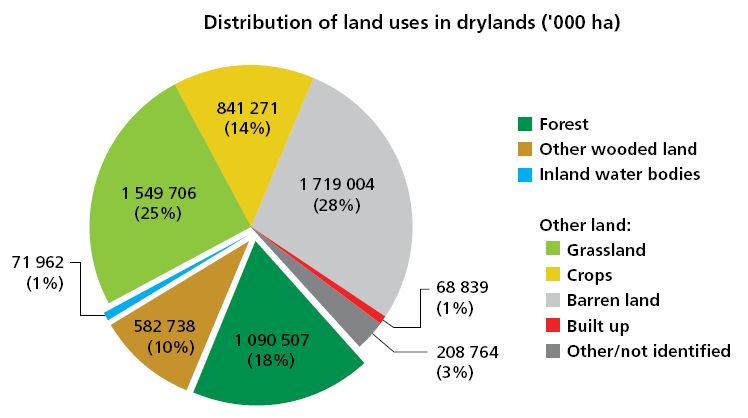
37 KB | Dieter Kasang (Diskussion | Beiträge) | Landnutzung in Trockengebieten in 1000 ha und in %. == Lizenzhinweis == {| style="border:1px solid #8888aa; background-color:#f7f8ff;padding:5px;font-size:95%;" | Quelle: FAO (2019): Trees, forests and land use in drylands: the first global assessment – Full report. FAO Forestry Paper No. 184. Rome.<br> Lizenz: CC [https://creativecommons.org/licenses/by-nc-sa/4.0/ BY-NC-SA] |} | 1 |
| 08:28, 10. Mai 2021 | Spitzbergen Ablationszone 2005-2012 2013.jpg (Datei) |  |
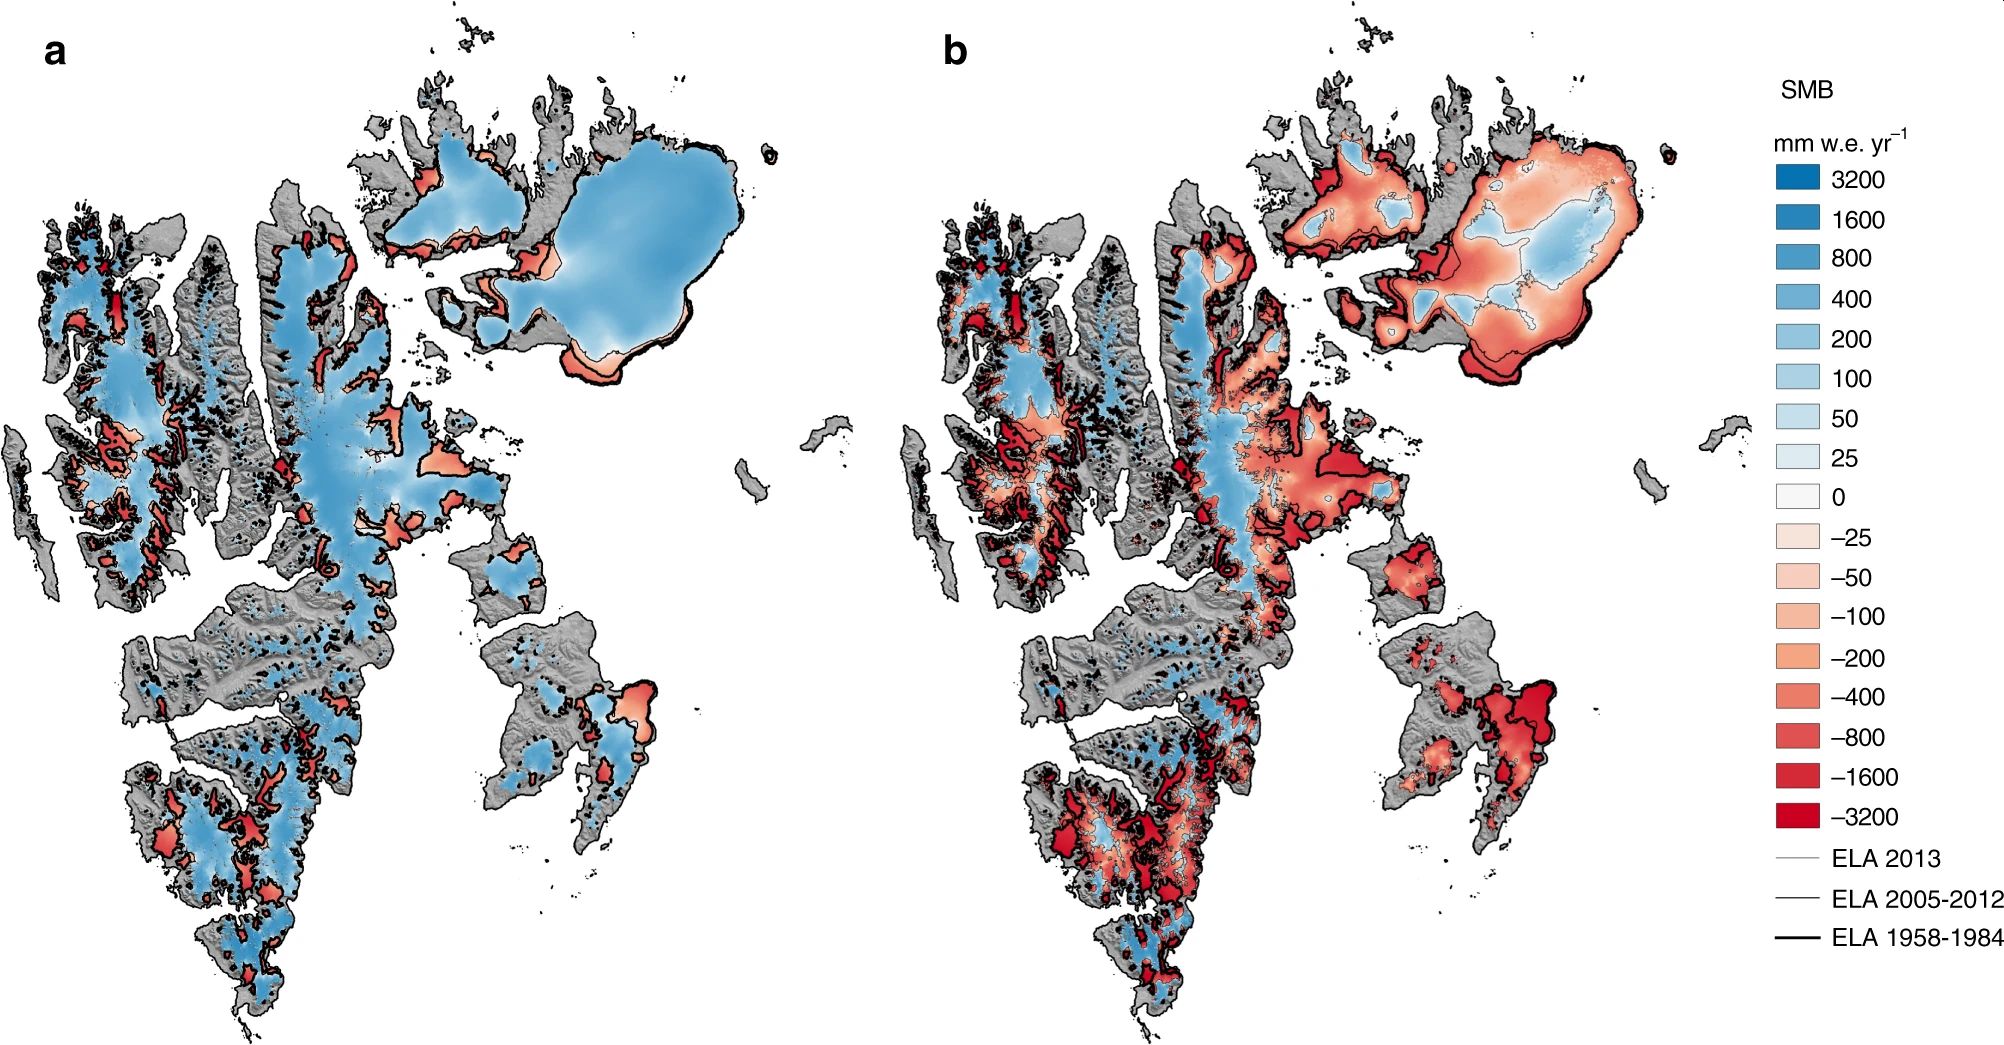
322 KB | Dieter Kasang (Diskussion | Beiträge) | == Beschreibung == Oberflächenmassenbilanz (SMB) in mm Wasseräquivalent/Jahr (mm w.e. yr-1) 2005-2012 und 2013 sowie die Lage der Gleichgewichtszone (ELA) ==Lizenzhinweis== {| style="border:1px solid #8888aa; background-color:#f7f8ff;padding:5px;font-size:95%;" | Quelle: Noël, B., Jakobs, C.L., van Pelt, W.J.J. et al. (2020): [https://doi.org/10.1038/s41467-020-18356-1 Low elevation of Svalbard glaciers drives high mass loss variability]. Nat Commun 11, 4597, suppl. information<br /> Lizenz: [h… | 1 |
| 11:13, 7. Mai 2021 | Svalbard MB discharge.jpg (Datei) |  |
93 KB | Dieter Kasang (Diskussion | Beiträge) | == Beschreibung == Oberflächenmassenbilanz (SMB), Eisabfluss und gesamte Massenbilanz 1958-2018 ==Lizenzhinweis== {| style="border:1px solid #8888aa; background-color:#f7f8ff;padding:5px;font-size:95%;" | Quelle: Noël, B., Jakobs, C.L., van Pelt, W.J.J. et al. (2020): [https://doi.org/10.1038/s41467-020-18356-1 Low elevation of Svalbard glaciers drives high mass loss variability]. Nat Commun 11, 4597, suppl. information<br /> Lizenz: [http://creativecommons.org/licenses/by/4.0/ CC BY] |} | 1 |
| 11:11, 7. Mai 2021 | Svalbard SMB 1958-2018.jpg (Datei) |  |
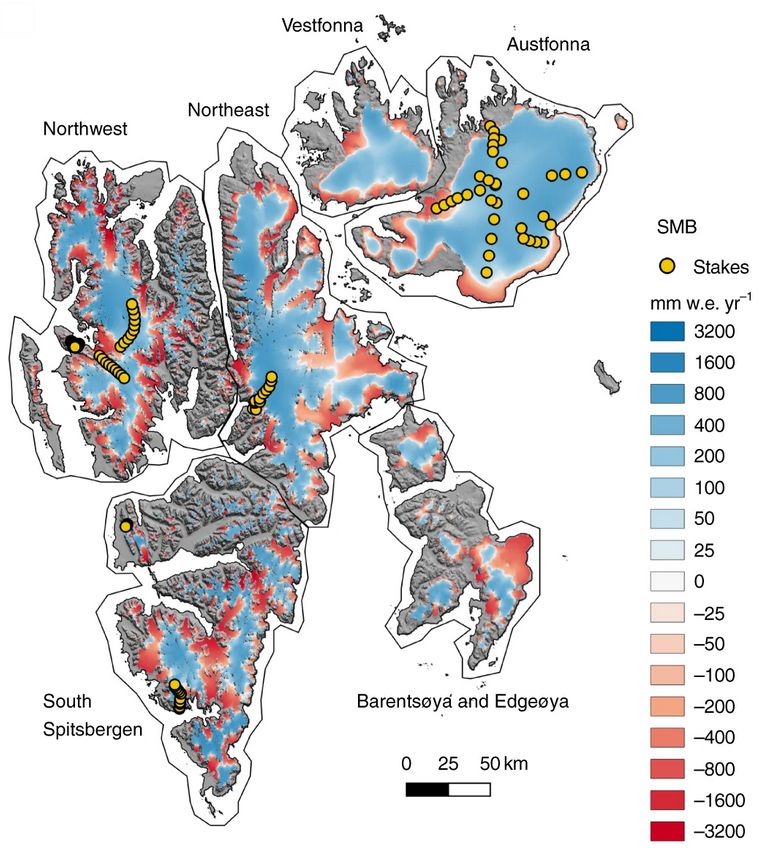
129 KB | Dieter Kasang (Diskussion | Beiträge) | == Beschreibung == Oberflächenmassenbilanz (SMB) in mm Wasseräquivalent/Jahr (mm w.e. yr-1) 1958-2018 ==Lizenzhinweis== {| style="border:1px solid #8888aa; background-color:#f7f8ff;padding:5px;font-size:95%;" | Quelle: Noël, B., Jakobs, C.L., van Pelt, W.J.J. et al. (2020): [https://doi.org/10.1038/s41467-020-18356-1 Low elevation of Svalbard glaciers drives high mass loss variability]. Nat Commun 11, 4597, suppl. information<br /> Lizenz: [http://creativecommons.org/licenses/by/4.0/ CC BY] |} | 1 |
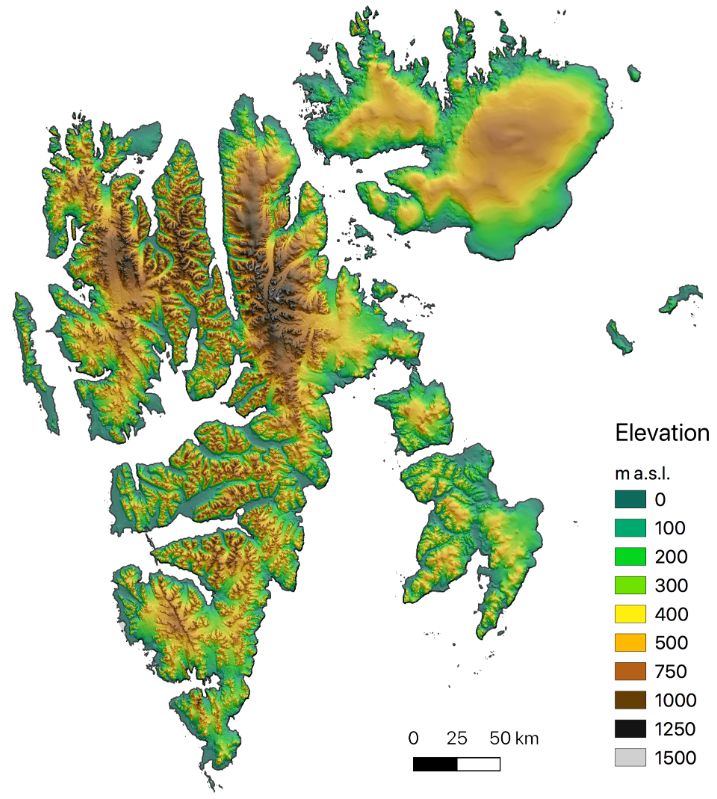
| 11:07, 7. Mai 2021 | Svalbard elevation.jpg (Datei) |  |
104 KB | Dieter Kasang (Diskussion | Beiträge) | Höhenkarte von Spitzbergen ==Lizenzhinweis== {| style="border:1px solid #8888aa; background-color:#f7f8ff;padding:5px;font-size:95%;" | Quelle: Noël, B., Jakobs, C.L., van Pelt, W.J.J. et al. (2020): Low elevation of Svalbard glaciers drives high mass loss variability. Nat Commun 11, 4597, suppl. information. https://doi.org/10.1038/s41467-020-18356-1 <br /> Lizenz: CC BY http://creativecommons.org/licenses/by/4.0/ |} | 1 |
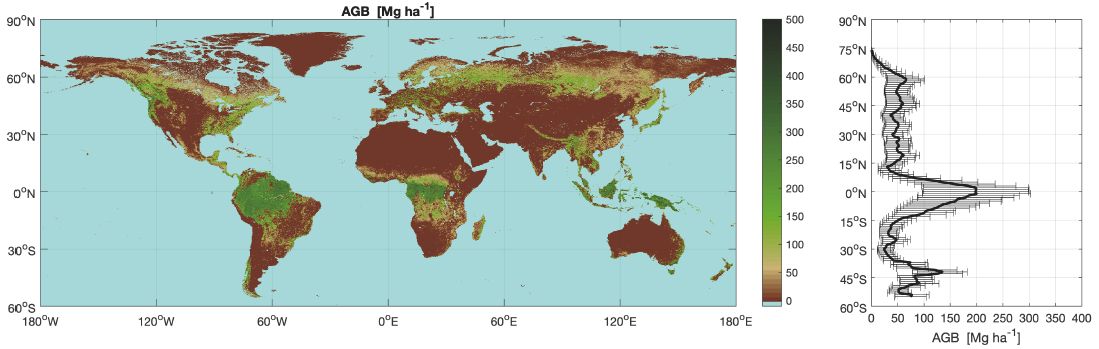
| 18:13, 6. Mai 2021 | Above Ground Biomasse.jpg (Datei) |  |
61 KB | Dieter Kasang (Diskussion | Beiträge) | == Beschreibung == Oberirdische Biomasse (AGB=Above Ground Biomass) in Mg C (t Kohlenstoff) pro ha in 2010 (Karte) und nach Breitengrad (rechts). == Lizenzhinweis == {| style="border:1px solid #8888aa; background-color:#f7f8ff;padding:5px;font-size:95%;" | Quelle: Santoro, M., O. Cartus, N. Carvalhais et al. (2020): The global forest above-ground biomass pool for 2010 estimated from high-resolution satellite observations, Earth Syst. Sci. Data Discuss. [preprint], https://doi.org/10.5194/essd… | 1 |
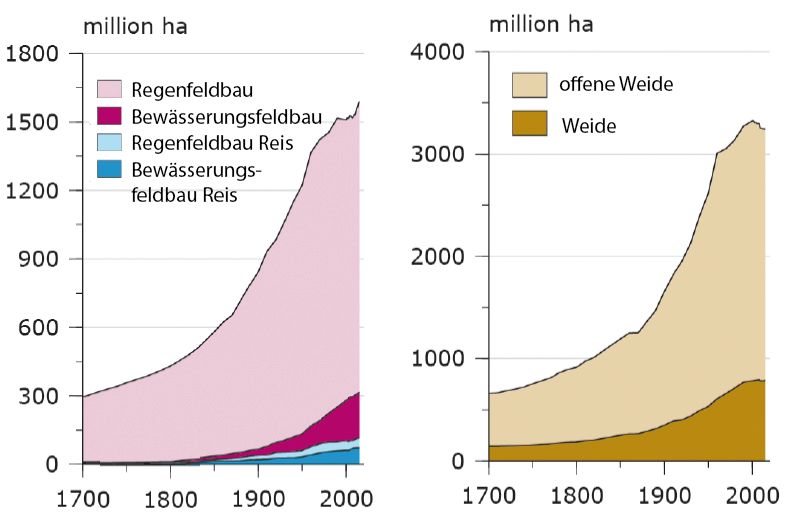
| 18:09, 6. Mai 2021 | Anbauland Weide 1700-2010.jpg (Datei) |  |
42 KB | Dieter Kasang (Diskussion | Beiträge) | == Beschreibung == Anbaufläche, Weideland (rangeland) und Wiesen (pasture) 1700 bis 2010 == Lizenzhinweis == {| style="border:1px solid #8888aa; background-color:#f7f8ff;padding:5px;font-size:95%;" | Quelle: Klein Goldewijk, K., Beusen, A., Doelman, J., and Stehfest, E.: [https://doi.org/10.5194/essd-9-927-2017 Anthropogenic land use estimates for the Holocene – HYDE 3.2], Earth Syst. Sci. Data, 9, 927–953<br> Lizenz: [https://creativecommons.org/licenses/by/3.0/ CC BY] |} | 1 |
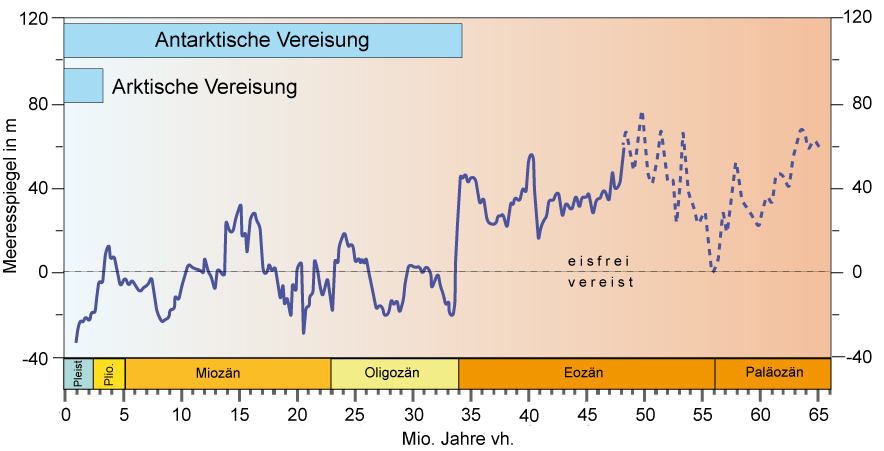
| 18:15, 5. Mai 2021 | Meeresspiegel 65Mio Jahre.jpg (Datei) |  |
140 KB | Dieter Kasang (Diskussion | Beiträge) | Veränderung des Meeresspiegels über die letzten 65 Mio. Jahre (Känozoikum). Gestrichelte Linie: unsichere Datenlage. ==Lizenzhinweis== {| style="border:1px solid #8888aa; background-color:#f7f8ff;padding:5px;font-size:95%;" |Quelle: Miller, K.G., W.J. Schmelz, J.V. Browning et al. (2020): Ancient Sea Level as Key to Future, Oceanography 33, 2, 33-41<br> Lizenz: CC BY https://creativecommons.org/licenses/by/4.0/ |} | 1 |
| 14:20, 21. Apr. 2021 | Rangeland-pasture-6000-2000.jpg (Datei) |  |
93 KB | Dieter Kasang (Diskussion | Beiträge) | == Beschreibung == Weideland (rangeland) und Wiesen (pasture) 8000 vh. bis 2010 == Lizenzhinweis == {| style="border:1px solid #8888aa; background-color:#f7f8ff;padding:5px;font-size:95%;" | Quelle: Klein Goldewijk, K., Beusen, A., Doelman, J., and Stehfest, E.: [https://doi.org/10.5194/essd-9-927-2017 Anthropogenic land use estimates for the Holocene – HYDE 3.2], Earth Syst. Sci. Data, 9, 927–953<br> Lizenz: [https://creativecommons.org/licenses/by/3.0/ CC BY] |} | 1 |
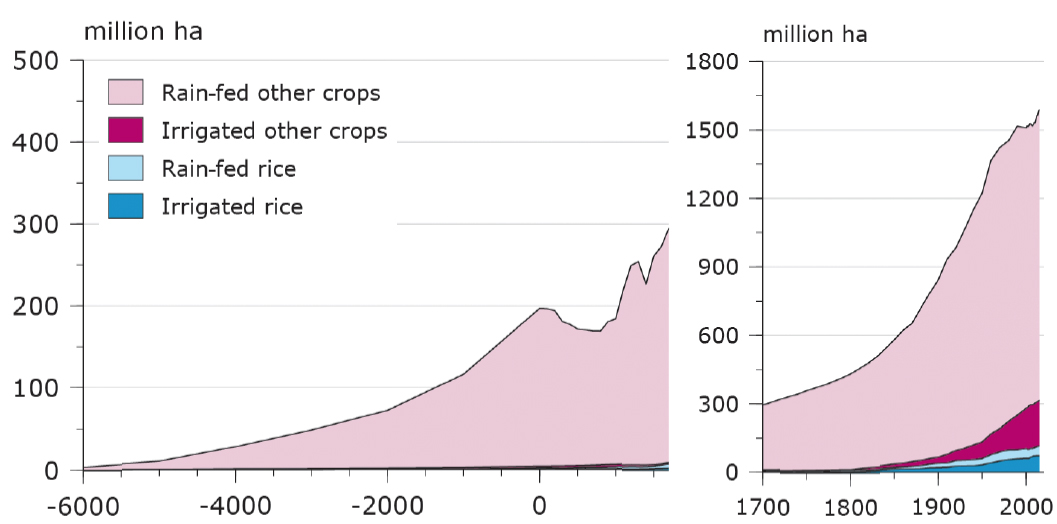
| 14:14, 21. Apr. 2021 | Cropland-6000-2000.jpg (Datei) |  |
101 KB | Dieter Kasang (Diskussion | Beiträge) | == Beschreibung == Anbaufläche 8000 vh. bis 2010 == Lizenzhinweis == {| style="border:1px solid #8888aa; background-color:#f7f8ff;padding:5px;font-size:95%;" | Quelle: Klein Goldewijk, K., Beusen, A., Doelman, J., and Stehfest, E.: Anthropogenic land use estimates for the Holocene – HYDE 3.2, Earth Syst. Sci. Data, 9, 927–953, https://doi.org/10.5194/essd-9-927-2017<br> Lizenz: CC BY https://creativecommons.org/licenses/by/3.0/ |} | 1 |
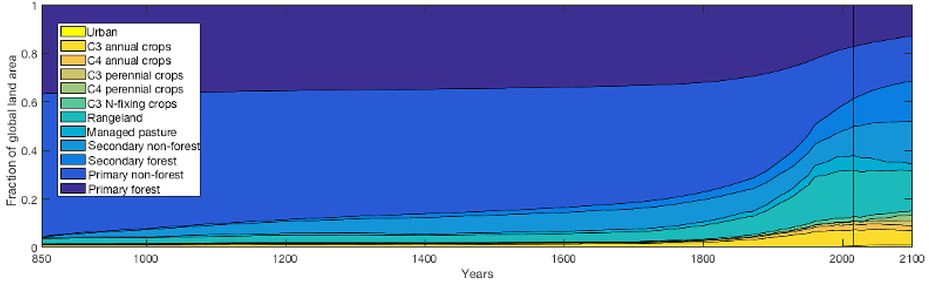
| 13:28, 21. Apr. 2021 | Land-use change850-2100.jpg (Datei) |  |
33 KB | Dieter Kasang (Diskussion | Beiträge) | == Beschreibung == Landnutzungsänderungen 850-2100. Nach 2015 nach dem Szenario SSP1. == Lizenzhinweis == {| style="border:1px solid #8888aa; background-color:#f7f8ff;padding:5px;font-size:95%;" | Quelle: Hurtt, G.C., Chini, L.P., Frolking, S. et al. (2011): [https://doi.org/10.1007/s10584-011-0153-2 Harmonization of land-use scenarios for the period 1500–2100: 600 years of global gridded annual land-use transitions, wood harvest, and resulting secondary lands.] Climatic Change 109, 117<br> Li… | 1 |
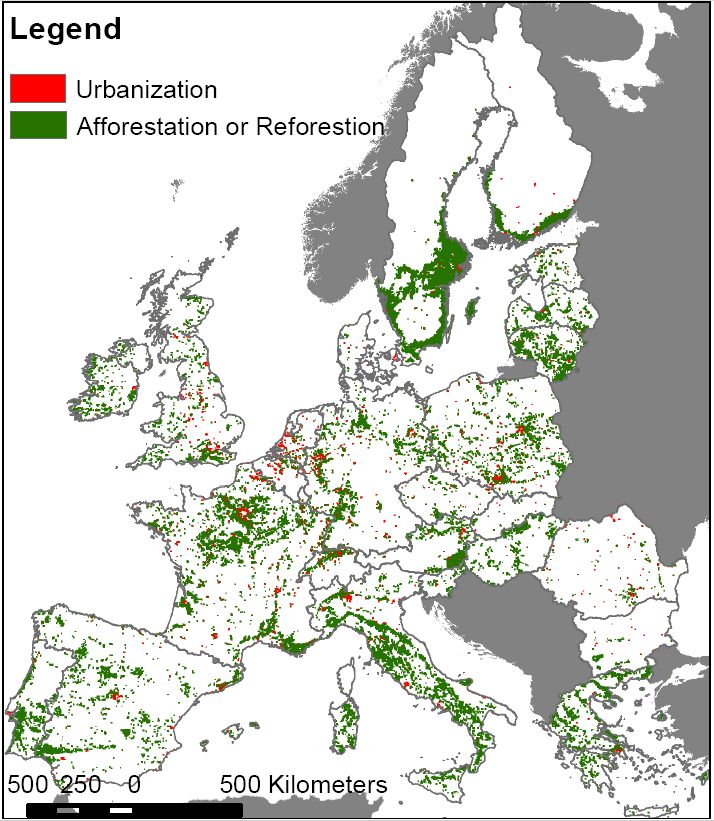
| 10:34, 17. Mär. 2021 | EU forestation1950-2020.jpg (Datei) |  |
135 KB | Dieter Kasang (Diskussion | Beiträge) | == Beschreibung == Waldausdehnung und Wiederbewaldung in der EU und der Schweiz 1950-2010 == Lizenzhinweis == {| style="border:1px solid #8888aa; background-color:#f7f8ff;padding:5px;font-size:95%;" | Quelle: Fuchs, R., M. Herold, P.H. Verburg, and J.G.P.W. Clevers (2013): A high-resolution and harmonized model approach for reconstructing and analysing historic land changes in Europe, Biogeosciences, 10, 1543–1559, https://doi.org/10.5194/bg-10-1543-2013<br> Lizenz: CC BY 3.0 |} | 1 |
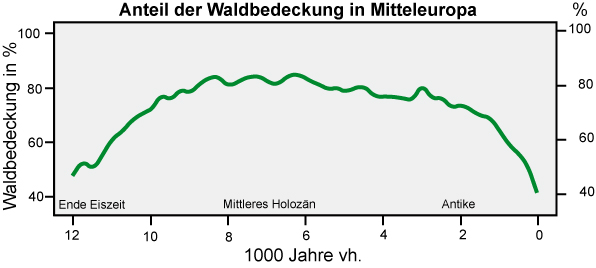
| 18:52, 15. Mär. 2021 | Waldbedeckung Mitteleuropa Holozän.jpg (Datei) |  |
41 KB | Dieter Kasang (Diskussion | Beiträge) | == Beschreibung == Gegenwärtige Waldbedeckung in Europa == Lizenzhinweis == {| style="border:1px solid #8888aa; background-color:#f7f8ff;padding:5px;font-size:95%;" | Quelle: Zanon M, Davis BAS, Marquer L, Brewer S and Kaplan JO (2018): European Forest Cover During the Past 12,000 Years: A Palynological Reconstruction Based on Modern Analogs and Remote Sensing. Front. Plant Sci. 9:253. doi: 10.3389/fpls.2018.00253<br> Lizenz: CC BY |} | 1 |
| 15:53, 15. Mär. 2021 | Forest cover present large.jpg (Datei) |  |
834 KB | Dieter Kasang (Diskussion | Beiträge) | Gegenwärtige Waldbedeckung in Europa == Lizenzhinweis == {| style="border:1px solid #8888aa; background-color:#f7f8ff;padding:5px;font-size:95%;" | Quelle: Zanon M, Davis BAS, Marquer L, Brewer S and Kaplan JO (2018): European Forest Cover During the Past 12,000 Years: A Palynological Reconstruction Based on Modern Analogs and Remote Sensing. Front. Plant Sci. 9:253. doi: 10.3389/fpls.2018.00253<br> Lizenz: CC BY |} | 1 |
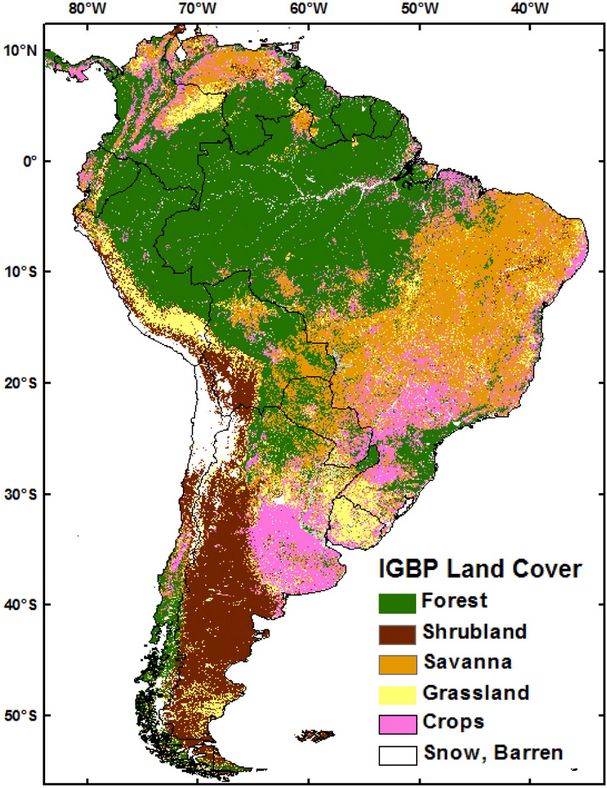
| 11:23, 24. Feb. 2021 | S-America land-cover2001.jpg (Datei) |  |
113 KB | Dieter Kasang (Diskussion | Beiträge) | == Beschreibung == Landbedeckung von Südamerika im Jahr 2001. == Lizenzhinweis == {| style="border:1px solid #8888aa; background-color:#f7f8ff;padding:5px;font-size:95%;" | Quelle: Powell, R.L., E.-H. Yoo, C.J. Still (2012): Vegetation and soil carbon-13 isoscapes for South America: integrating remote sensing and ecosystem isotope measurements, Ecosphere 3, 1-25, https://doi.org/10.1890/ES12-00162.1<br> Lizenz: [http://creativecommons.org/licenses/by/3.0/ CC BY] |} | 1 |
| 11:13, 24. Feb. 2021 | W-Africa humid savanna.jpg (Datei) |  |
49 KB | Dieter Kasang (Diskussion | Beiträge) | == Beschreibung == Feuchtsavanne in Westafrika in der mittleren (links) und späten Trockenzeit (rechts) == Lizenzhinweis == {| style="border:1px solid #8888aa; background-color:#f7f8ff;padding:5px;font-size:95%;" | Quelle: N’Dri, A.B., Soro, T.D., Gignoux, J. et al. Season affects fire behavior in annually burned humid savanna of West Africa. fire ecol 14, 5 (2018). https://doi.org/10.1186/s42408-018-0005-9<br> Lizenz: CC BY http://creativecommons.org/licenses/by/4.0/ |} | 1 |
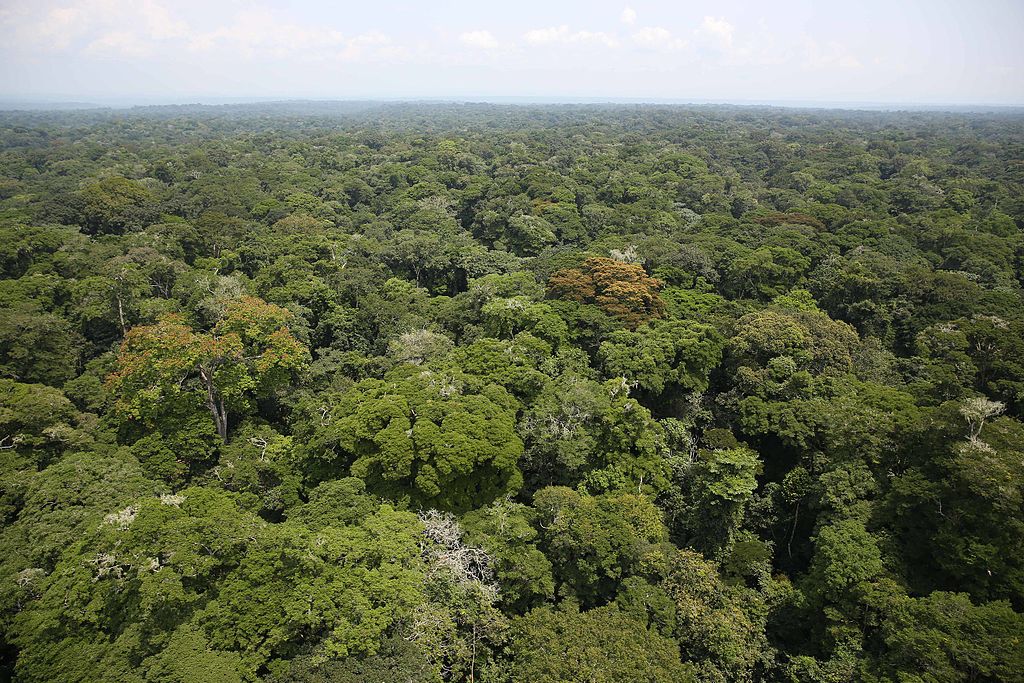
| 11:01, 24. Feb. 2021 | Rainforest Congo.jpg (Datei) |  |
239 KB | Dieter Kasang (Diskussion | Beiträge) | == Beschreibung == Tropischer Regenwald in der Demokratischen Republik Kongo == Lizenzhinweis == {| style="border:1px solid #8888aa; background-color:#f7f8ff;padding:5px;font-size:95%;" | Quelle: Wikimedia Commons (2015): Rainforest Ituri, Autor: MONUSCO Photos https://www.flickr.com/people/67163702@N07, https://commons.wikimedia.org/wiki/File:Rainforest_-_Ituri_(20874628148).jpg<br> Lizenz: [http://creativecommons.org/licenses/by/4.0/ CC BY] |} | 1 |
