Dateiliste
Aus Klimawandel
Diese Spezialseite listet alle hochgeladenen Dateien auf.
| Datum | Name | Vorschaubild | Größe | Benutzer | Beschreibung | Versionen |
|---|---|---|---|---|---|---|
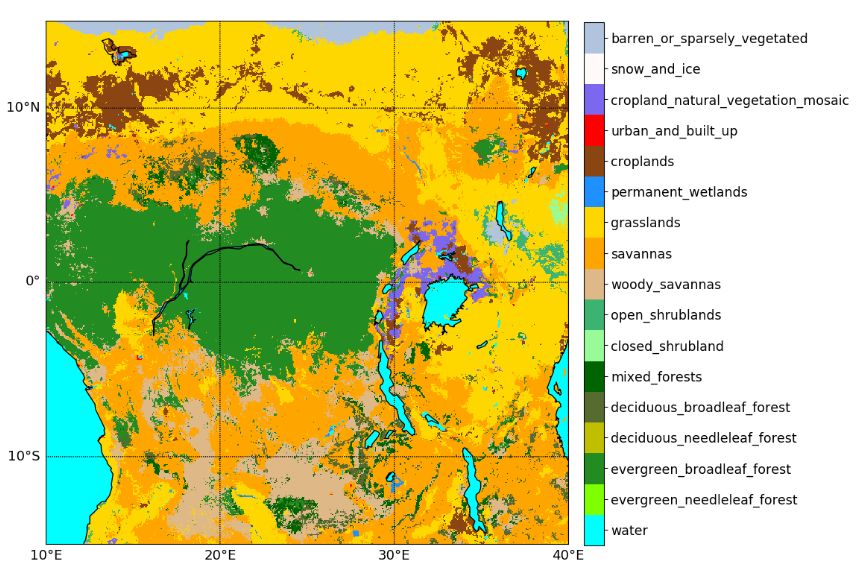
| 10:43, 24. Feb. 2021 | Central Africa land cover2010.jpg (Datei) |  |
115 KB | Dieter Kasang (Diskussion | Beiträge) | == Beschreibung == Landbedeckung in Zentralafrika == Lizenzhinweis == {| style="border:1px solid #8888aa; background-color:#f7f8ff;padding:5px;font-size:95%;" | Quelle: Jiang, Y., and L. Zhou and A. Raghavendra (2020): Observed changes in fire patterns and possible drivers over Central Africa, Environmental Research Letters 15, 9, https://doi.org/10.1088/1748-9326/ab9db2<br> Lizenz: [http://creativecommons.org/licenses/by/4.0/ CC BY] |} | 1 |
| 10:36, 24. Feb. 2021 | Africa land cover2002-2017.jpg (Datei) |  |
98 KB | Dieter Kasang (Diskussion | Beiträge) | Landbedeckung in Afrika südlich der Sahara == Lizenzhinweis == {| style="border:1px solid #8888aa; background-color:#f7f8ff;padding:5px;font-size:95%;" | Quelle: van Wees, D., und G.R. van der Werf (2019): Modelling biomass burning emissions and the effect of spatial resolution: a case study for Africa based on the Global Fire Emissions Database (GFED), Geosci. Model Dev., 12, 4681–4703, https://doi.org/10.5194/gmd-12-4681-2019<br> Lizenz: CC BY http://creativecommons.org/licenses/by/4.0/ |} | 1 |
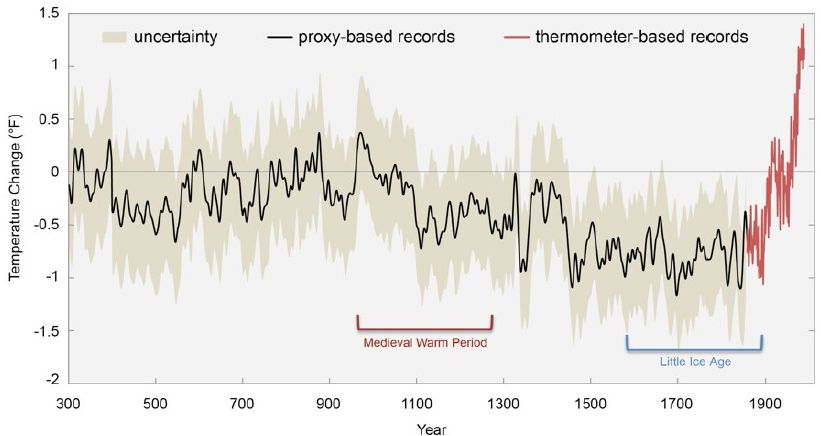
| 11:00, 23. Feb. 2021 | Temp NH 300-2010.jpg (Datei) |  |
41 KB | Dieter Kasang (Diskussion | Beiträge) | == Beschreibung == Temperatur der letzten 1700 Jahre in °F (1 °F Differenz = 0,56 °C Differenz) ==Lizenzhinweis== {| style="border:1px solid #8888aa; background-color:#f7f8ff;padding:5px;font-size:95%;" |Quelle: USGCRP (2017): Climate Science Special Report: Fourth National Climate Assessment, Volume I [Wuebbles, D.J., D.W. Fahey, K.A. Hibbard, D.J. Dokken, B.C. Stewart, and T.K. Maycock (eds.)]. U.S. Global Change Research Program<br> Lizenz: In all cases, permissions were secured by the U.S.… | 1 |
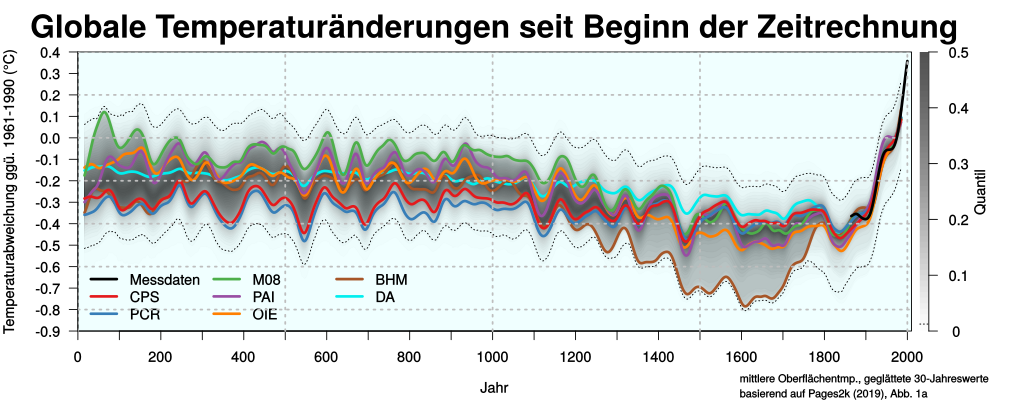
| 10:53, 23. Feb. 2021 | Temp global 0-2000.png (Datei) |  |
228 KB | Dieter Kasang (Diskussion | Beiträge) | Temperaturänderungen der letzten 2000 Jahre ==Lizenzhinweis== {| style="border:1px solid #8888aa; background-color:#f7f8ff;padding:5px;font-size:95%;" |Quelle: Wikimedia Commons (Autor: DeWikiMan) : Temperaturanomalien der letzten 2000 Jahr, basierend auf Daten und Berechnungen von Pages2K (2019), doi:10.1038/s41561-019-0400-0, in Anlehnung an Abb. 1a, https://commons.wikimedia.org/wiki/File:Temp_anomalies_2000yrs_pages2k-de.svg<br> Lizenz: CC BY-SA https://creativecommons.org/licenses/by-sa/4… | 1 |
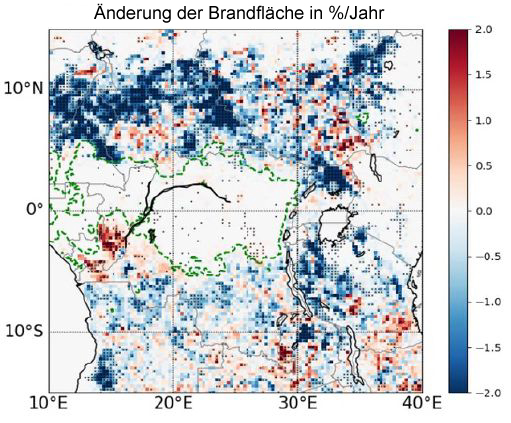
| 20:17, 22. Feb. 2021 | Central Africa burned area trends.jpg (Datei) |  |
163 KB | Dieter Kasang (Diskussion | Beiträge) | Änderung der jährlichen Brandflächen in Zentralafrika in % der Gitterzellen (0,25° x 0,25°) zwischen 2003 und 2017 nach Global Fire Emission Database (GFED4s) == Lizenzhinweis == {| style="border:1px solid #8888aa; background-color:#f7f8ff;padding:5px;font-size:95%;" | Quelle: Jiang, Y., L. Zhou and A. Raghavendra (2020): Observed changes in fire patterns and possible drivers over Central Africa, Environmental Research Letters 15, 9, https://iopscience.iop.org/article/10.1088/1748-9326/ab9db2… | 1 |
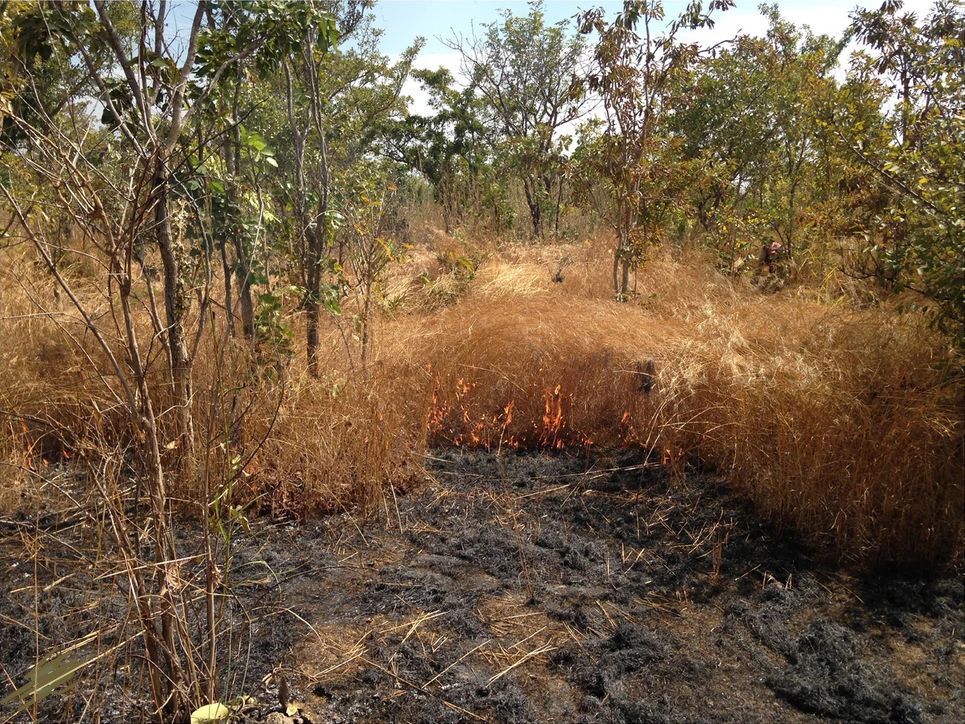
| 20:04, 22. Feb. 2021 | Mali savanna fire.jpg (Datei) |  |
551 KB | Dieter Kasang (Diskussion | Beiträge) | Feuer in der Savanne in Mali 2016 ==Lizenzhinweis== {| style="border:1px solid #8888aa; background-color:#f7f8ff;padding:5px;font-size:95%;" |Quelle: Laris, P., Jacobs, R., Koné, M. et al. Determinants of fire intensity in working landscapes of an African savanna. fire ecol 16, 27 (2020). https://doi.org/10.1186/s42408-020-00085-x Lizenz: CC BY 4.0 http://creativecommons.org/licenses/by/4.0/ |} | 1 |
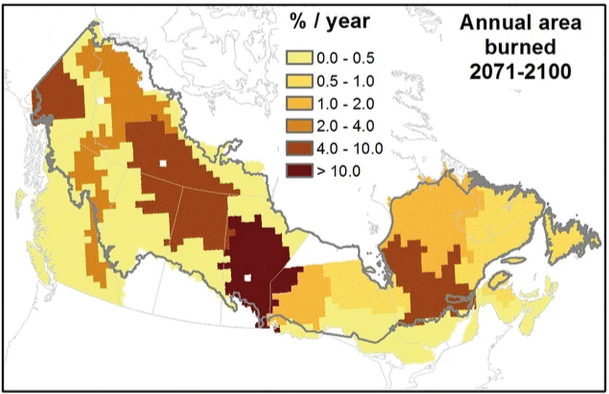
| 09:49, 20. Feb. 2021 | Canada area burned2071-2100.jpg (Datei) |  |
142 KB | Dieter Kasang (Diskussion | Beiträge) | == Beschreibung == Feuerfläche in Kanada 2071-2100 in % der Gitterzelle pro Jahr ==Lizenzhinweis== {| style="border:1px solid #8888aa; background-color:#f7f8ff;padding:5px;font-size:95%;" |Quelle: Boucher, D., Gauthier, S., Thiffault, N. et al. (2020): [https://doi.org/10.1007/s11056-019-09745-6 How climate change might affect tree regeneration following fire at northern latitudes: a review.] New Forests 51, 543–571 </br> Lizenz: [https://creativecommons.org/licenses/by/4.0/ CC BY 4.0] |} | 1 |
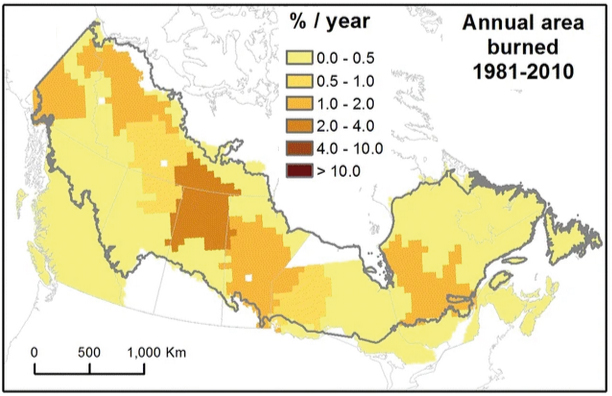
| 09:44, 20. Feb. 2021 | Canada area burned1981-2010.jpg (Datei) |  |
133 KB | Dieter Kasang (Diskussion | Beiträge) | Feuerfläche in Kanada 1981-2010 in % der Gitterzellen pro Jahr ==Lizenzhinweis== {| style="border:1px solid #8888aa; background-color:#f7f8ff;padding:5px;font-size:95%;" |Quelle: Boucher, D., Gauthier, S., Thiffault, N. et al. (2020): How climate change might affect tree regeneration following fire at northern latitudes: a review. New Forests 51, 543–571 https://doi.org/10.1007/s11056-019-09745-6</br> Lizenz: CC BY 4.0 https://creativecommons.org/licenses/by/4.0/ |} | 1 |
| 20:14, 7. Feb. 2021 | Rice climate change.jpg (Datei) |  |
124 KB | Dieter Kasang (Diskussion | Beiträge) | == Beschreibung == Einfluss des Klimawandels auf die Erträge von Reis 1974-2013 in t/ha/Jahr == Lizenzhinweis == {| style="border:1px solid #8888aa; background-color:#f7f8ff;padding:5px;font-size:95%;" |Quelle: Ray, D.K., P.C. West, M. Clark, J.S. Gerber, A.V. Prishchepov, S. Chatterjee (2019): Climate change has likely already affected global food production. PLoS ONE 14(5): e0217148. https://doi.org/10.1371/journal.pone.0217148<br> Lizenz [https://creativecommons.org/licenses/by-nc/4.0/ CC… | 1 |
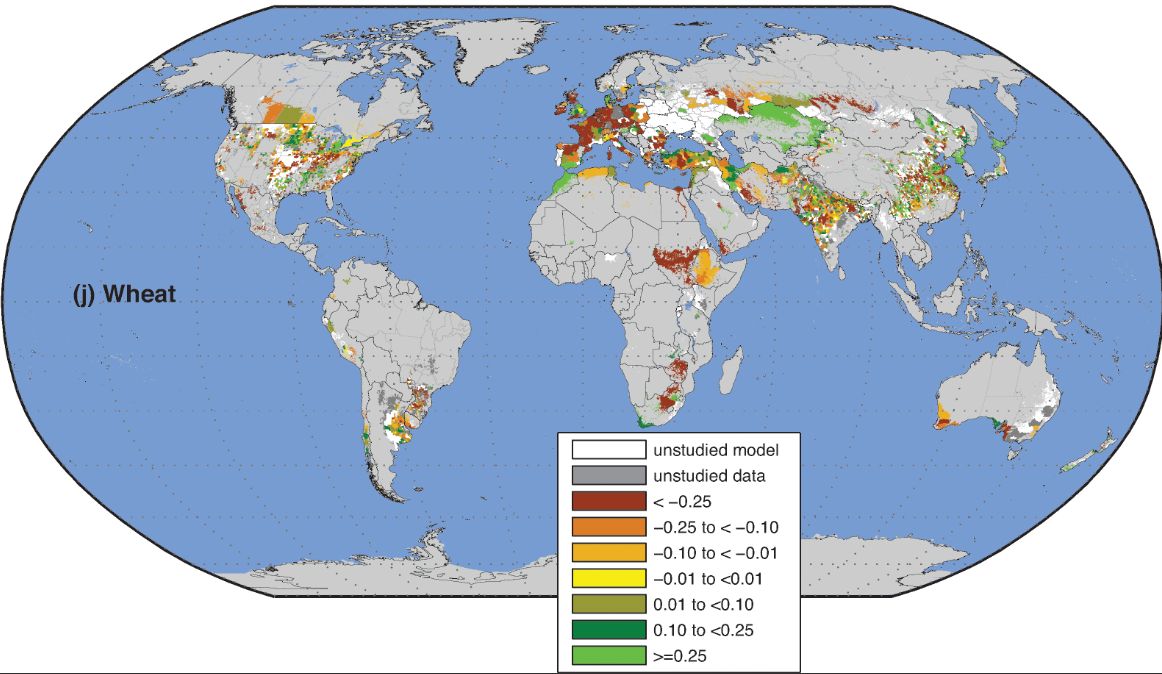
| 20:07, 7. Feb. 2021 | Wheat climate change.jpg (Datei) |  |
118 KB | Dieter Kasang (Diskussion | Beiträge) | == Beschreibung == Einfluss des Klimawandels auf die Erträge verschiedener Nutzpflanzen in Tonnen pro Hektar pro Jahr == Lizenzhinweis == {| style="border:1px solid #8888aa; background-color:#f7f8ff;padding:5px;font-size:95%;" |Ray DK, West PC, Clark M, Gerber JS, Prishchepov AV, Chatterjee S (2019): [https://journals.plos.org/plosone/article?id=10.1371/journal.pone.0217148 Climate change has likely already affected global food production. PLoS ONE 14(5)] Lizenz [https://creativecommons.org/li… | 1 |
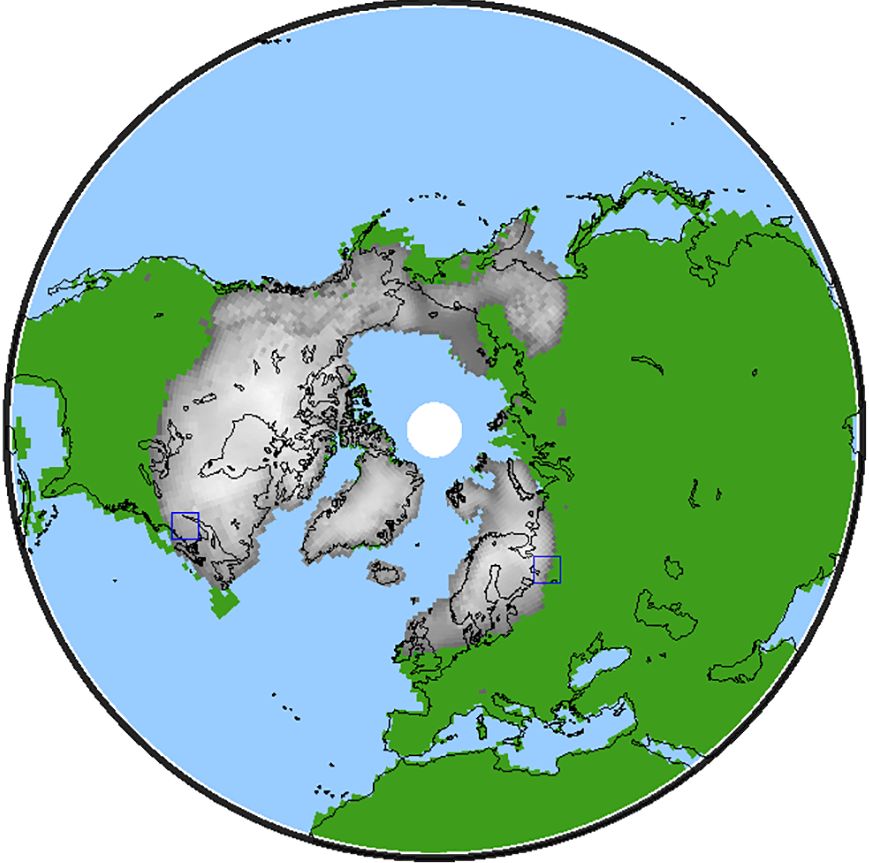
| 19:24, 7. Feb. 2021 | LGM Ice-Sheets NH.jpg (Datei) |  |
92 KB | Dieter Kasang (Diskussion | Beiträge) | == Beschreibung == Ausdehnung der Eisschilde auf der Nordhalbkugel während des Höhepunkts der letzten Eiszeit vor 21000 Jahren ==Lizenzhinweis== {| style="border:1px solid #8888aa; background-color:#f7f8ff;padding:5px;font-size:95%;" | '''Quelle:''' Willeit, M. and Ganopolski, A.: The importance of snow albedo for ice sheet evolution over the last glacial cycle, Clim. Past, 14, 697–707, https://doi.org/10.5194/cp-14-697-2018 <br /> '''Lizenz:''' [https://creativecommons.org/licenses/by/4.0/ CC… | 1 |
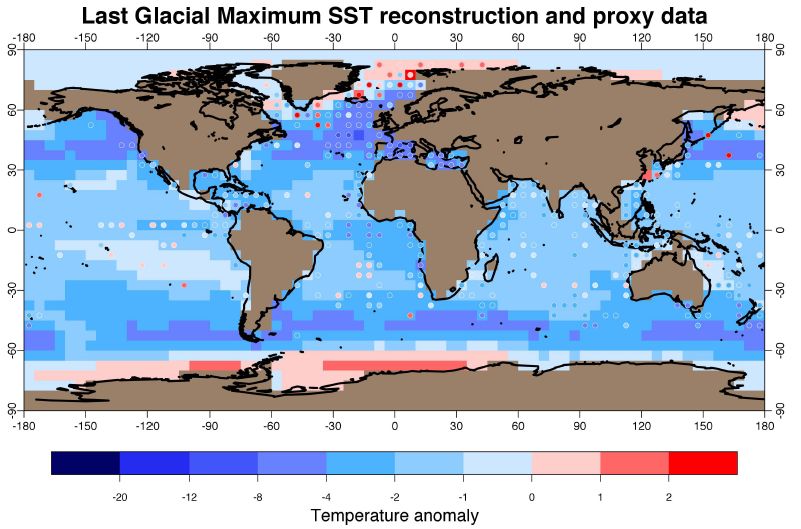
| 19:21, 7. Feb. 2021 | LGM SST.jpg (Datei) |  |
78 KB | Dieter Kasang (Diskussion | Beiträge) | == Beschreibung == Abweichungen der bodennahen Meeresoberflächentemperatur während des Höhepunkts der letzten Eiszeit als Abweichungen vom vorindustriellen Klima ==Lizenzhinweis== {| style="border:1px solid #8888aa; background-color:#f7f8ff;padding:5px;font-size:95%;" | '''Quelle:''' Annan, J. D. and Hargreaves, J. C.: A new global reconstruction of temperature changes at the Last Glacial Maximum, Clim. Past, 9, 367–376, https://doi.org/10.5194/cp-9-367-2013 <br /> '''Lizenz:''' [https://creati… | 1 |
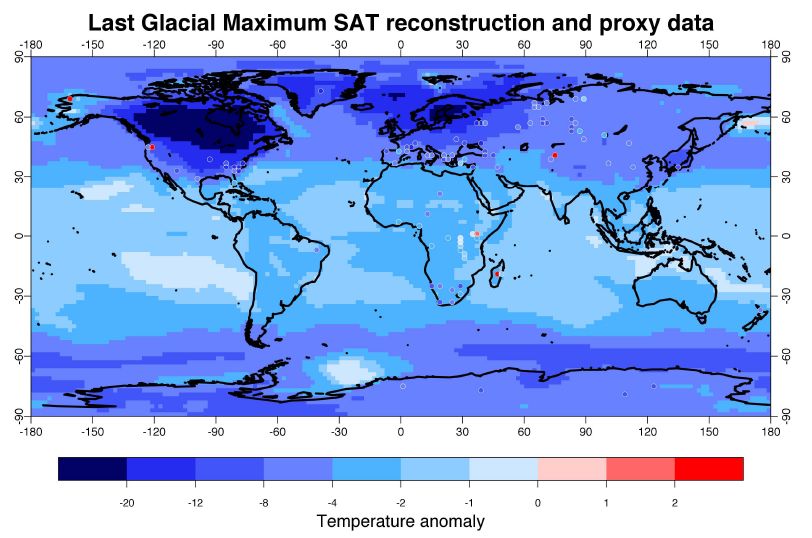
| 19:19, 7. Feb. 2021 | LGM Temp.jpg (Datei) |  |
75 KB | Dieter Kasang (Diskussion | Beiträge) | == Beschreibung == Abweichungen der bodennahen Lufttemperatur während des Höhepunkts der letzten Eiszeit als Abweichungen vom vorindustriellen Klima ==Lizenzhinweis== {| style="border:1px solid #8888aa; background-color:#f7f8ff;padding:5px;font-size:95%;" | '''Quelle:''' Annan, J. D. and Hargreaves, J. C.: A new global reconstruction of temperature changes at the Last Glacial Maximum, Clim. Past, 9, 367–376, https://doi.org/10.5194/cp-9-367-2013 <br /> '''Lizenz:''' [https://creativecommons.org… | 1 |
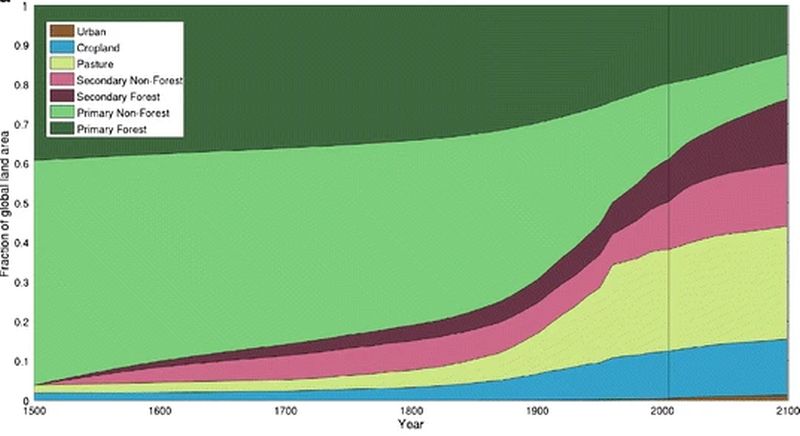
| 16:41, 6. Feb. 2021 | Landnutzung 1500-2100.jpg (Datei) |  |
36 KB | Dieter Kasang (Diskussion | Beiträge) | Änderung der Landnutzung 1500-2100. (von unten nach oben) Braun: Stadtgebiete, blau: Anbaugebiete, gelb: Weideland, lila hell: sekundär nicht bewaldet*, dunkel lila: Sekundärwald, hellgrün: primär nicht bewaldet, dunkelgrün: Primärwald. “nicht bewaldet”= weniger als 2 kg C/m2 Biomasse == Lizenzhinweis == {| style="border:1px solid #8888aa; background-color:#f7f8ff;padding:5px;font-size:95%;" | Quelle: Hurtt, G.C., Chini, L.P., Frolking, S. et al. (2011): Harmonization of land-use scenarios for… | 1 |
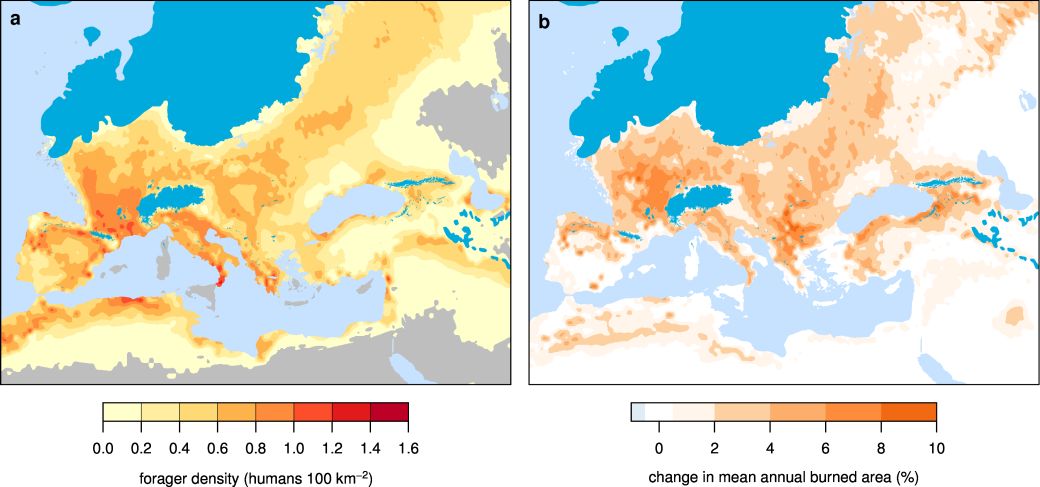
| 12:37, 2. Feb. 2021 | LGM population fire.jpg (Datei) |  |
71 KB | Dieter Kasang (Diskussion | Beiträge) | Bevölkerungsdichte (a) und die anthropogene Änderung der natürlichen Feueraktivität (b) während des Höhepunkts der letzten Eiszeit um 21 000 Jahren vh. Dunkelblau: Eisbedeckung; hellblau: Wasser. ==Lizenzhinweis== {| style="border:1px solid #8888aa; background-color:#f7f8ff;padding:5px;font-size:95%;" | '''Quelle:''' Kaplan, J.O., M. PfeifferJ.C.A. Kolen, B.A.S. Davis (2016): Large Scale Anthropogenic Reduction of Forest Cover in Last Glacial Maximum Europe. PLoS ONE 11(11): e0166726. doi:10.13… | 1 |
| 16:38, 1. Feb. 2021 | Land-area exposed drought heat.jpg (Datei) |  |
208 KB | Dieter Kasang (Diskussion | Beiträge) | == Beschreibung == Landgebiete, die bei einer globalen Erwärmung von 2 °C von Dürren und Hitzewellen betroffen sind, in % der Gitterzelle (0,5°x0,5°). ==Lizenzhinweis== {| style="border:1px solid #8888aa; background-color:#f7f8ff;padding:5px;font-size:95%;" | Quelle: Lange, S., Volkholz, J., Geiger, T., Zhao, F., Vega, I., Veldkamp, T., et al. (2020). Projecting exposure to extreme climate impact events across six event categories and three spatial scales. Earth's Future, 11, e2020EF001616. ht… | 1 |
| 16:32, 1. Feb. 2021 | Land-area exposed flood TC fire.jpg (Datei) |  |
221 KB | Dieter Kasang (Diskussion | Beiträge) | == Beschreibung == Landgebiete, die bei einer globalen Erwärmung von 3 °C von Flussüberschwemmungen, Ernteausfällen, tropischen Wirbelstürmen und Waldbränden betroffen sind, in % der Gitterzelle (0,5°x0,5°) ==Lizenzhinweis== {| style="border:1px solid #8888aa; background-color:#f7f8ff;padding:5px;font-size:95%;" | Quelle: Lange, S., Volkholz, J., Geiger, T., Zhao, F., Vega, I., Veldkamp, T., et al. (2020). Projecting exposure to extreme climate impact events across six event categories and thre… | 1 |
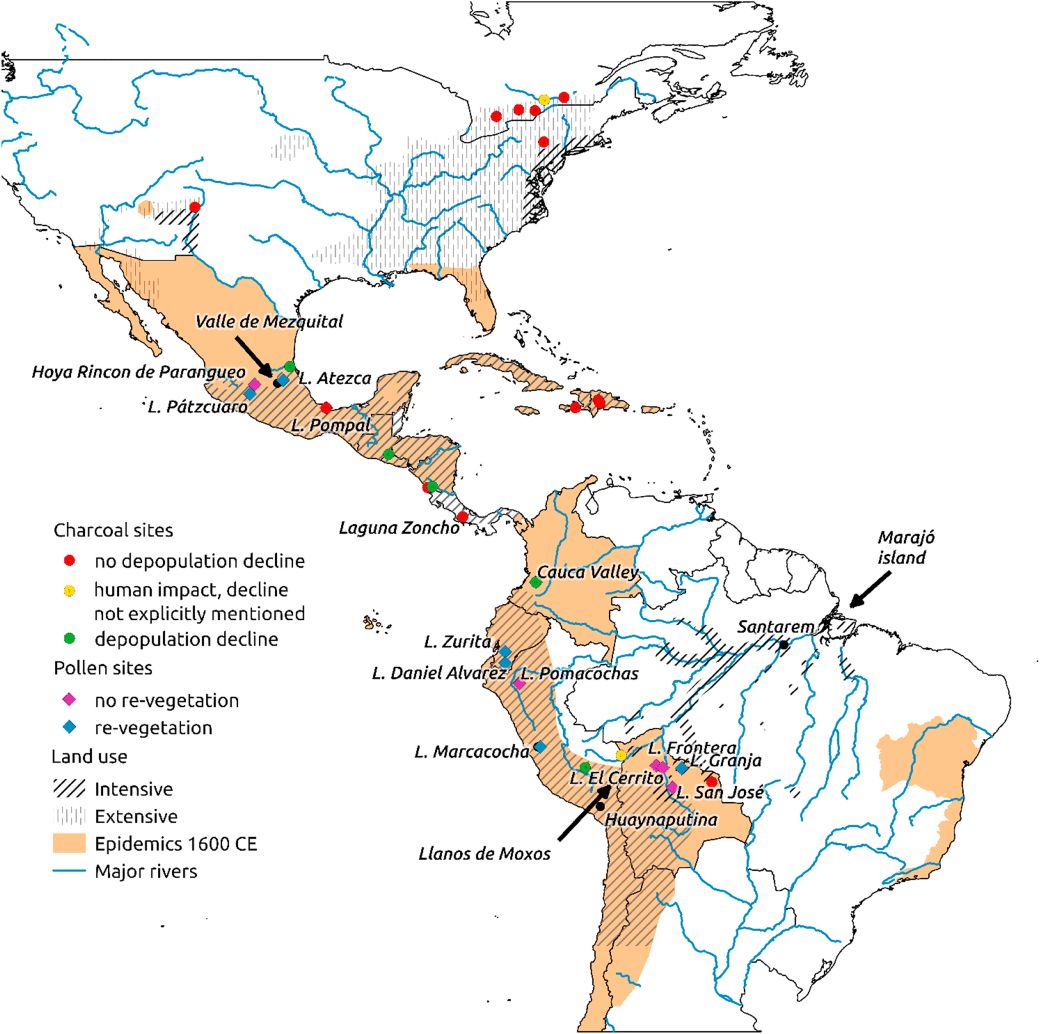
| 19:36, 26. Jan. 2021 | Americas land-use colonization.jpg (Datei) |  |
154 KB | Dieter Kasang (Diskussion | Beiträge) | Vorkoloniale Landnutzung, Epidemien um 1600 und die Folgen == Lizenzhinweis == {| style="border:1px solid #8888aa; background-color:#f7f8ff;padding:5px;font-size:95%;" | Quelle: Koch, A., C. Brierley, M.M. Maslin, S.L. Lewis (2019): Earth system impacts of the European arrival and Great Dying in the Americas after 1492, Quaternary Science Reviews 207, 13-36, ISSN 0277-3791, https://doi.org/10.1016/j.quascirev.2018.12.004. <br> Lizenz: [http://creativecommons.org/licenses/by/4.0/ CC BY] |} | 1 |
| 19:33, 26. Jan. 2021 | Brazil land cover change2001 2017.jpg (Datei) |  |
83 KB | Dieter Kasang (Diskussion | Beiträge) | Landnutzung im Staat Mato Grosso, Brasilien, 2001 und 2017 == Lizenzhinweis == {| style="border:1px solid #8888aa; background-color:#f7f8ff;padding:5px;font-size:95%;" | Quelle: Maciel, A.M., M.C.A. Picol, L. Vinhas, G. Camara (2020): Identifying Land Use Change Trajectories in Brazil’s Agricultural Frontier. Land. 2020; 9(12):506. https://doi.org/10.3390/land9120506 <br> Lizenz: CC BY http://creativecommons.org/licenses/by/4.0/ |} | 1 |
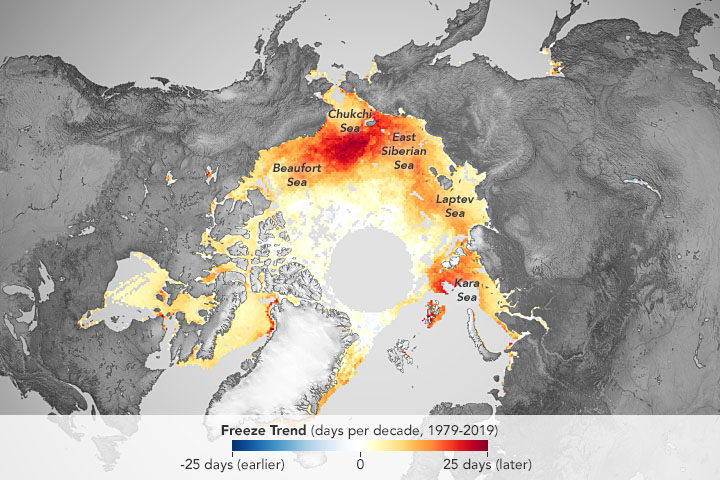
| 15:37, 11. Jan. 2021 | Arctic Sea Ice freeze-date.jpg (Datei) |  |
125 KB | Dieter Kasang (Diskussion | Beiträge) | == Beschreibung == Änderung des Gefrierdatums in der Arktis 1979-2019. Angegeben ist die Anzahl der Tage pro Jahrzehnt, um die sich das Gefrierdatum verschiebt. == Lizenzhinweis == {| style="border:1px solid #8888aa; background-color:#f7f8ff;padding:5px;font-size:95%;" | Quelle: NASA, Visible Earth (2021): The Long Decline of Arctic Sea Ice, https://visibleearth.nasa.gov/images/147746/the-long-decline-of-arctic-sea-ice/147746f <br> Lizenz: public domain |} | 1 |
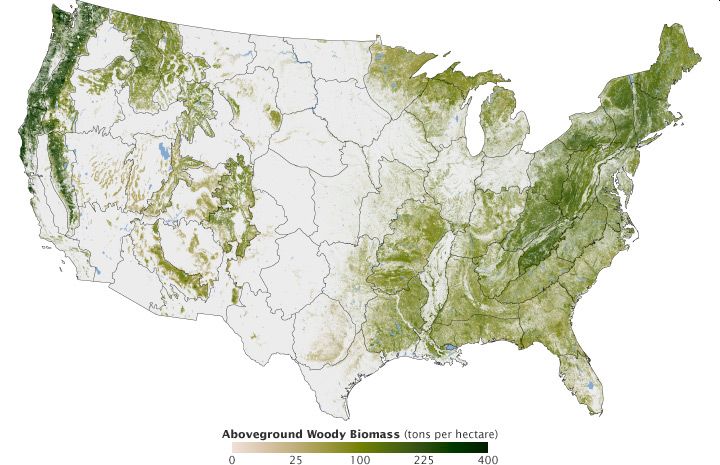
| 15:07, 11. Jan. 2021 | USA woody biomass.jpg (Datei) |  |
64 KB | Dieter Kasang (Diskussion | Beiträge) | Oberirdische Holz-Biomasse in t/ha in den USA 2011 == Lizenzhinweis == {| style="border:1px solid #8888aa; background-color:#f7f8ff;padding:5px;font-size:95%;" | Quelle: NASA Earth Observatory (2012): [https://earthobservatory.nasa.gov/features/ForestCarbon Seeing Forests for the Trees and the Carbon: Mapping the World’s Forests in Three Dimensions]<br> Lizenz: public domain |} | 1 |
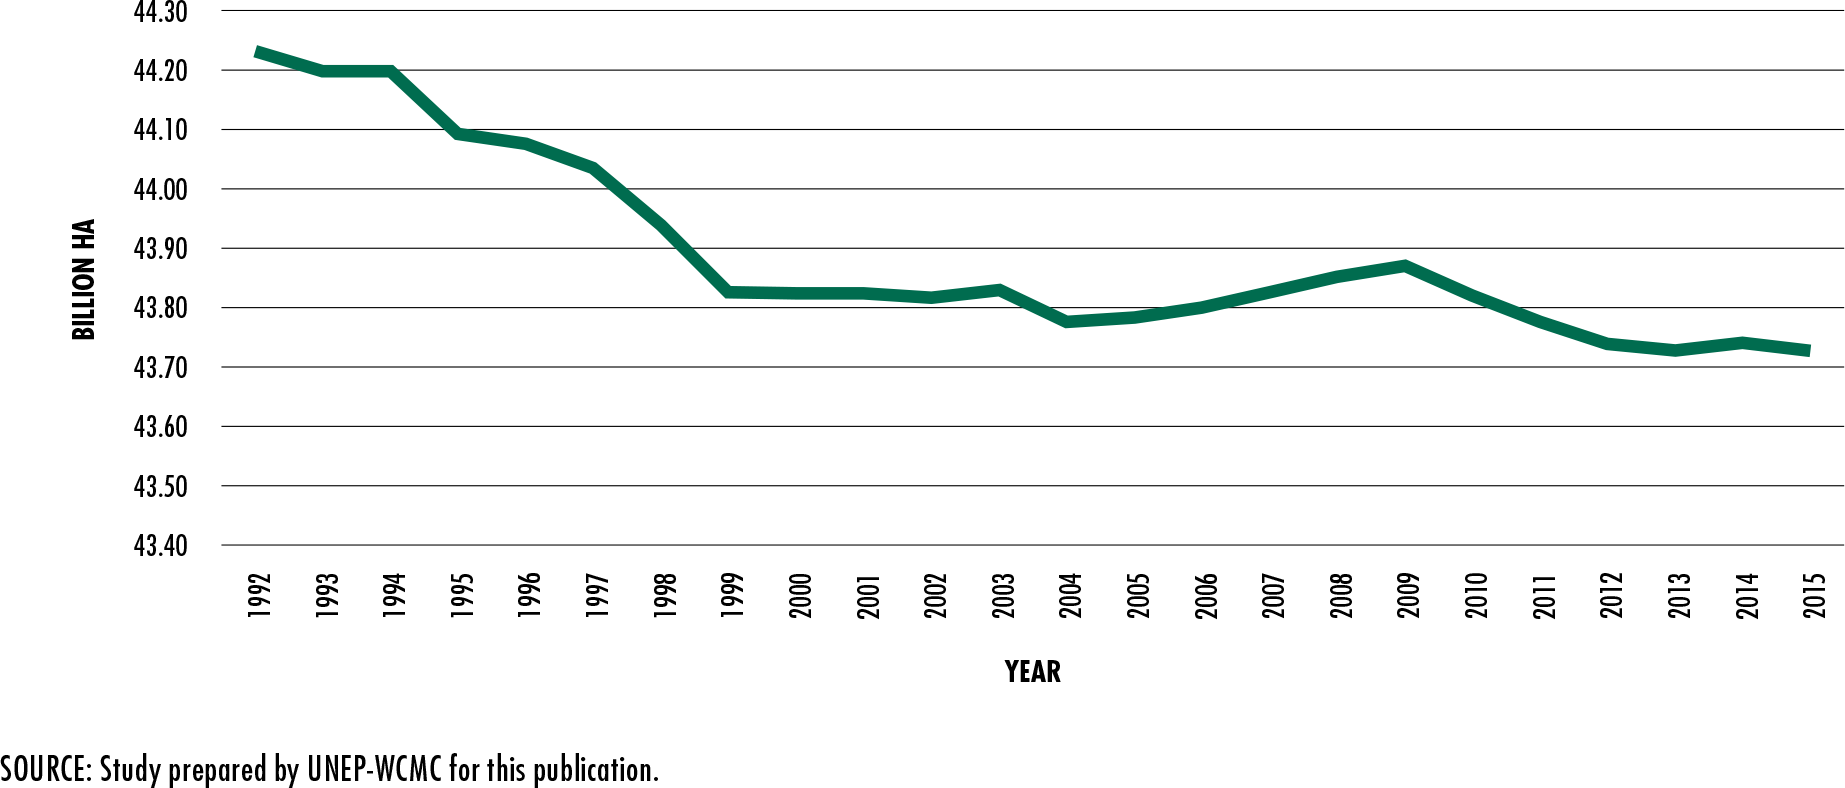
| 14:52, 11. Jan. 2021 | Global tree cover1992-2015.png (Datei) |  |
37 KB | Dieter Kasang (Diskussion | Beiträge) | == Beschreibung == Änderung der globalen Baumbedeckung 1992-2015 in Mrd. ha == Lizenzhinweis == {| style="border:1px solid #8888aa; background-color:#f7f8ff;padding:5px;font-size:95%;" | Quelle: FAO and UNEP (2020): [https://doi.org/10.4060/ca8642en The State of the World’s Forests 2020. Forests, biodiversity and people.] Rome.<br> Lizenz: [https://creativecommons.org/licenses/by-nc-sa/3.0/igo/legalcode CC BY-NC-SA] |} | 1 |
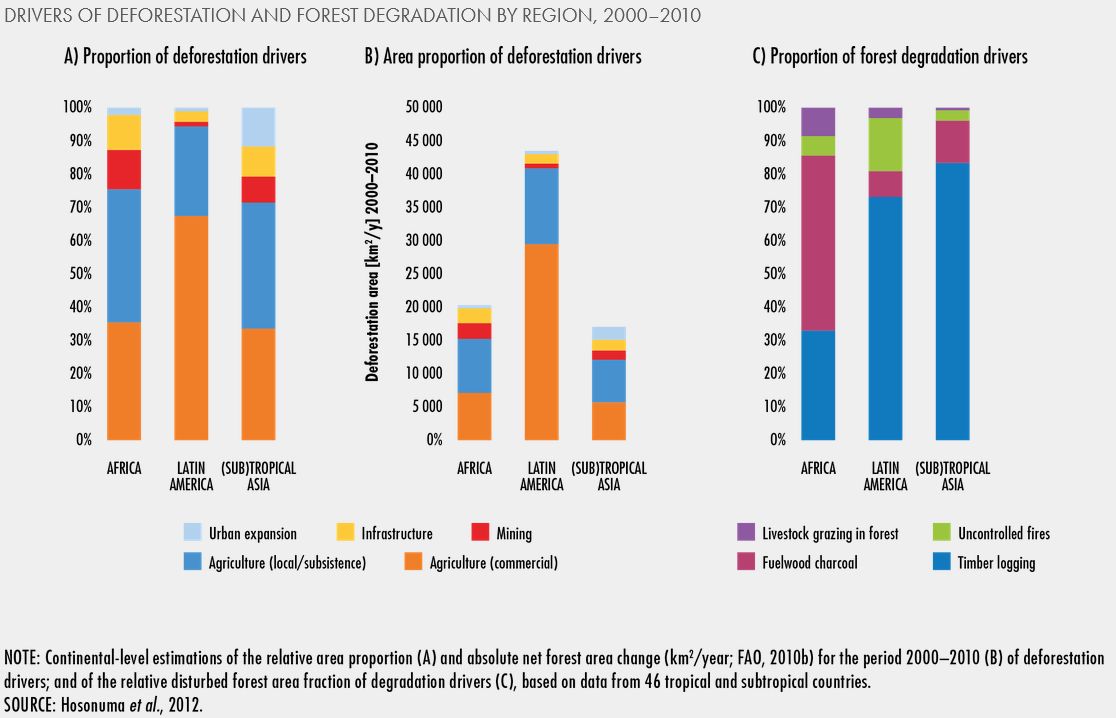
| 14:45, 11. Jan. 2021 | Deforestation drivers regions2000-2010.jpg (Datei) |  |
85 KB | Dieter Kasang (Diskussion | Beiträge) | == Beschreibung == Ursachen von Entwaldung und Degradation von Wäldern 2000-2010 == Lizenzhinweis == {| style="border:1px solid #8888aa; background-color:#f7f8ff;padding:5px;font-size:95%;" | Quelle: FAO and UNEP (2020): [https://doi.org/10.4060/ca8642en The State of the World’s Forests 2020. Forests, biodiversity and people.] Rome.<br> Lizenz: [https://creativecommons.org/licenses/by-nc-sa/3.0/igo/legalcode CC BY-NC-SA] |} | 1 |
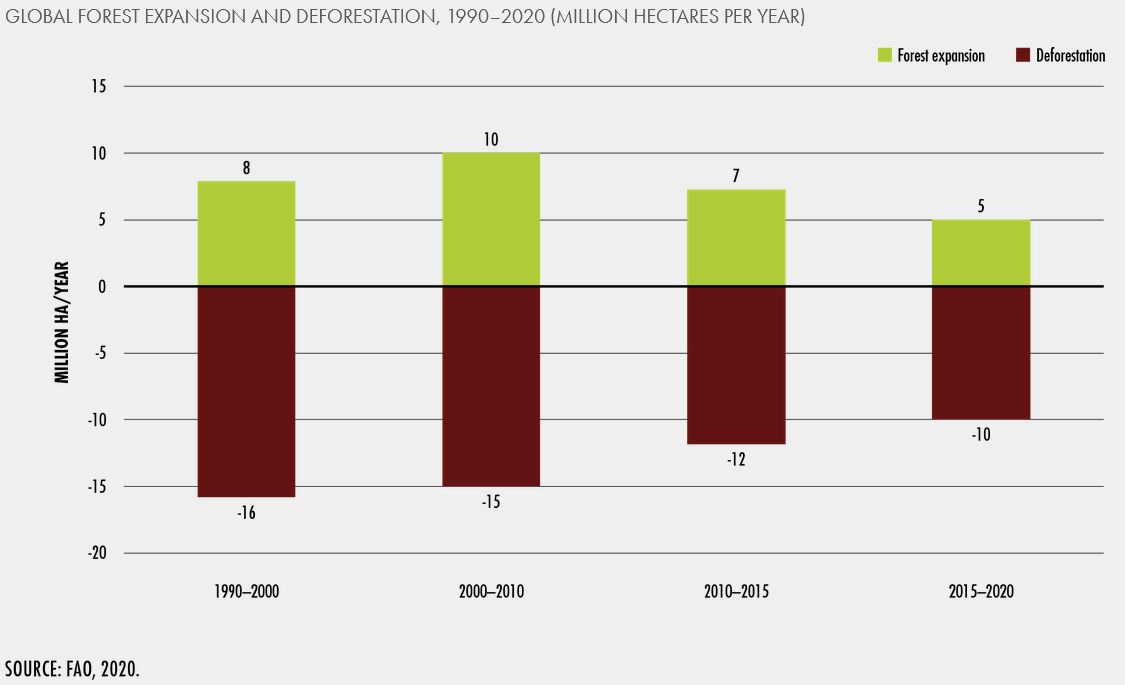
| 14:26, 11. Jan. 2021 | Deforestation expansion1990-2020.jpg (Datei) |  |
37 KB | Dieter Kasang (Diskussion | Beiträge) | Entwaldung und Ausdehnung von Wäldern 1990 bis 2020 in Mio. ha/Jahr == Lizenzhinweis == {| style="border:1px solid #8888aa; background-color:#f7f8ff;padding:5px;font-size:95%;" | Quelle: FAO and UNEP (2020): The State of the World’s Forests 2020. Forests, biodiversity and people. Rome. https://doi.org/10.4060/ca8642en ]<br> Lizenz: CC BY-NC-SA, https://creativecommons.org/licenses/by-nc-sa/3.0/igo/legalcode |} | 1 |
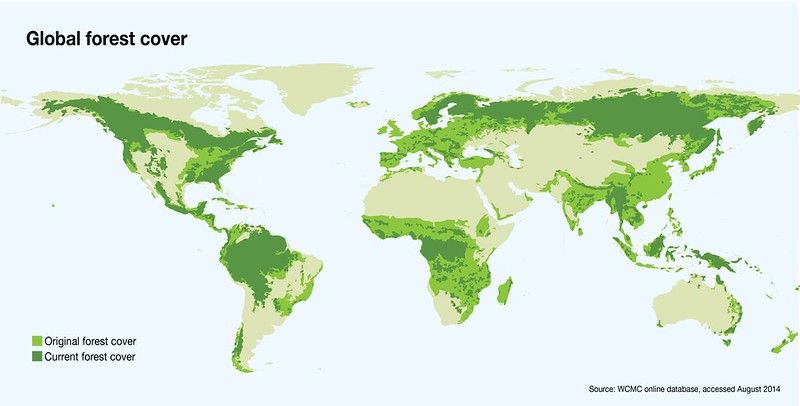
| 14:17, 11. Jan. 2021 | Global forest cover.jpg (Datei) |  |
38 KB | Dieter Kasang (Diskussion | Beiträge) | == Beschreibung == Ursprüngliche und aktuelle globale Waldbedeckung == Lizenzhinweis == {| style="border:1px solid #8888aa; background-color:#f7f8ff;padding:5px;font-size:95%;" | Quelle: Flickr (2015): Global Forest Cover, https://www.flickr.com/photos/gridarendal/31550395483/in/album-72157675508945334/ ; auch: GRID-Arendal, http://www.grida.no/resources/6959 <br> Lizenz: CC BY-NC-SA |} | 1 |
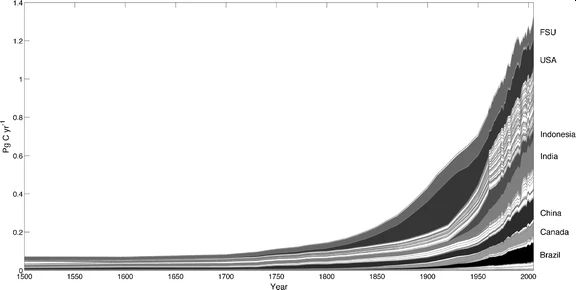
| 14:10, 11. Jan. 2021 | Wood harvest1500-2005.jpg (Datei) |  |
15 KB | Dieter Kasang (Diskussion | Beiträge) | == Beschreibung == Holzernte 1500-2005 nach Staaten == Lizenzhinweis == {| style="border:1px solid #8888aa; background-color:#f7f8ff;padding:5px;font-size:95%;" | Quelle: Hurtt, G.C., Chini, L.P., Frolking, S. et al. (2011): Harmonization of land-use scenarios for the period 1500–2100: 600 years of global gridded annual land-use transitions, wood harvest, and resulting secondary lands. Climatic Change 109, 117 https://doi.org/10.1007/s10584-011-0153-2<br> Lizenz: CC BY-NC https://creativecommon… | 1 |
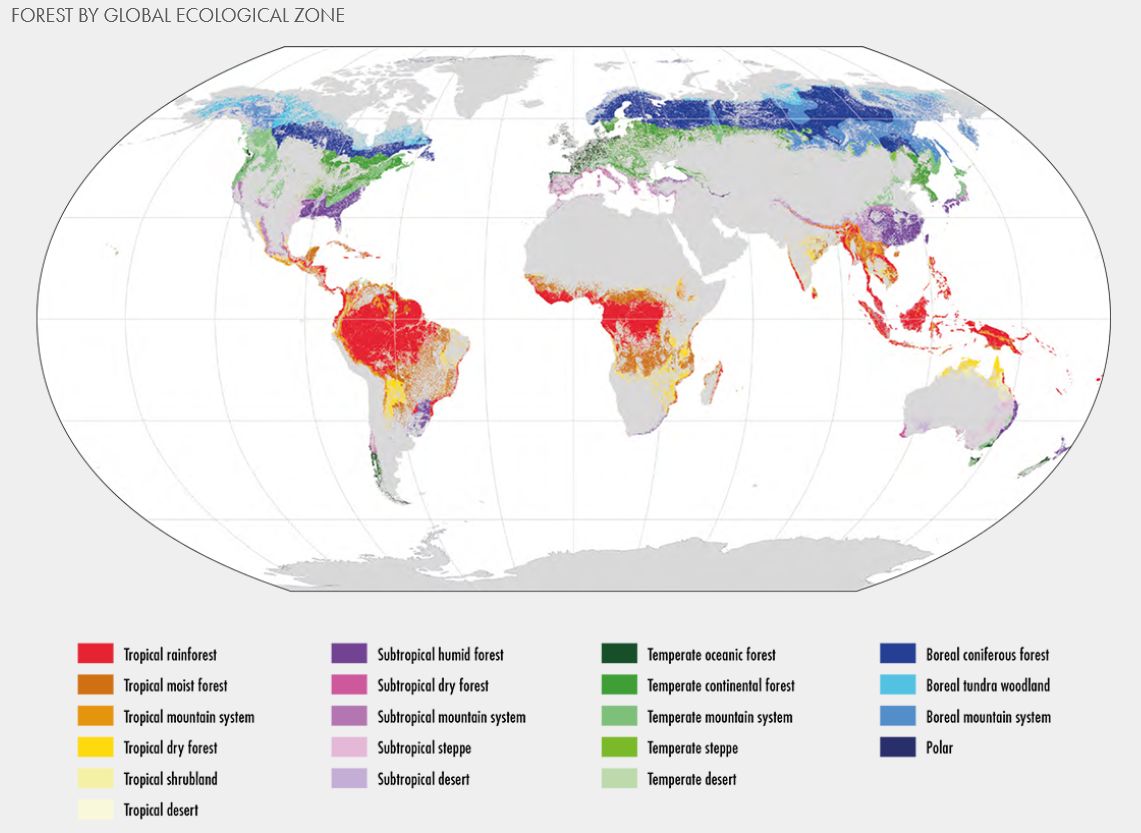
| 13:55, 11. Jan. 2021 | Global forests ecological zones.jpg (Datei) |  |
92 KB | Dieter Kasang (Diskussion | Beiträge) | Globale Waldbedeckung nach ökologischen Zonen, 2020 == Lizenzhinweis == {| style="border:1px solid #8888aa; background-color:#f7f8ff;padding:5px;font-size:95%;" | Quelle: FAO and UNEP. 2020. The State of the World’s Forests 2020. Forests, biodiversity and people. Rome. https://doi.org/10.4060/ca8642en <br> Lizenz: CC BY-NC-SA, https://creativecommons.org/licenses/by-nc-sa/3.0/igo/legalcode |} | 1 |
| 20:19, 10. Jan. 2021 | Tropical forests C storage.jpg (Datei) |  |
159 KB | Dieter Kasang (Diskussion | Beiträge) | == Beschreibung == Speicherung und Emission von Kohlenstoff durch tropische Wälder == Lizenzhinweis == {| style="border:1px solid #8888aa; background-color:#f7f8ff;padding:5px;font-size:95%;" | Quelle: Flickr (2015): How Much, Tropical Forests Absorb and Store Carbon, https://www.flickr.com/photos/gridarendal/31550389533/in/album-72157675508945334/ ; auch: GRID-Arendal, http://www.grida.no/resources/6948 <br> Lizenz: CC BY |} | 1 |
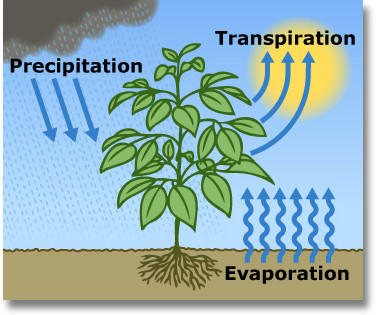
| 20:15, 10. Jan. 2021 | Evapotranspiration.png (Datei) | 322 KB | Dieter Kasang (Diskussion | Beiträge) | == Beschreibung == Evapotranspiration bei Wald- und Grasbewuchs == Lizenzhinweis == {| style="border:1px solid #8888aa; background-color:#f7f8ff;padding:5px;font-size:95%;" | Quelle: Wikimedis Commons (2007): Conceptual diagram of near-surface hydrology, showing evapotranspiration, evaporation, transpiration, runoff, and recharge processes. https://commons.wikimedia.org/wiki/File:Surface_water_cycle.svg <br> Lizenz: CC BY |} | 1 | |
| 20:07, 10. Jan. 2021 | Cycle-evapotranspiration.jpg (Datei) | 29 KB | Dieter Kasang (Diskussion | Beiträge) | Transpiration und Evaporation (Verdunstung) == Lizenzhinweis == {| style="border:1px solid #8888aa; background-color:#f7f8ff;padding:5px;font-size:95%;" | Quelle: USGS: Evapotranspiration is the sum of plant transpiration and evaporation, https://www.usgs.gov/media/images/evapotranspiration-sum-plant-transpiration-and-evaporation<br> Lizenz: CC BY |} | 1 | |
| 19:57, 10. Jan. 2021 | Wald ackerland albedo.jpg (Datei) |  |
136 KB | Dieter Kasang (Diskussion | Beiträge) | Unterschied der Albedo bei Waldbedeckung und Ackerfläche ==Lizenzhinweis== {{Bild-Lizenz}} | 2 |
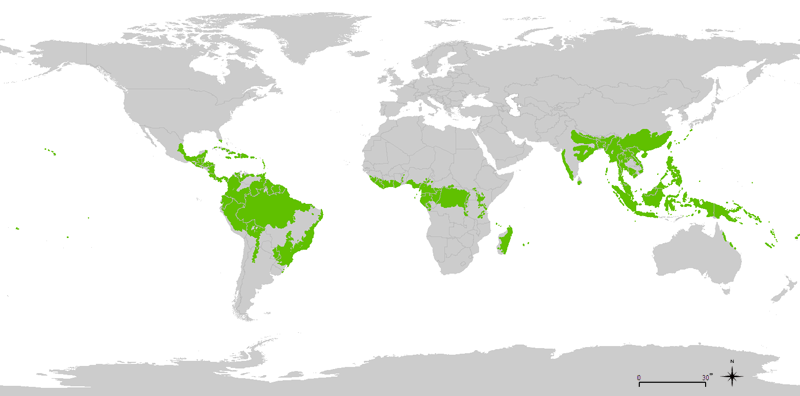
| 11:49, 10. Jan. 2021 | Regenwald - Geographie.png (Datei) |  |
93 KB | Dieter Kasang (Diskussion | Beiträge) | ==Lizenzhinweis== {| style="border:1px solid #8888aa; background-color:#f7f8ff;padding:5px;font-size:95%;" | Wikimedia Commons: [http://commons.wikimedia.org/wiki/Image:800px-tropical_wet_forests.png Tropical wet forests]<br> Lizenz: public domain |} | 2 |
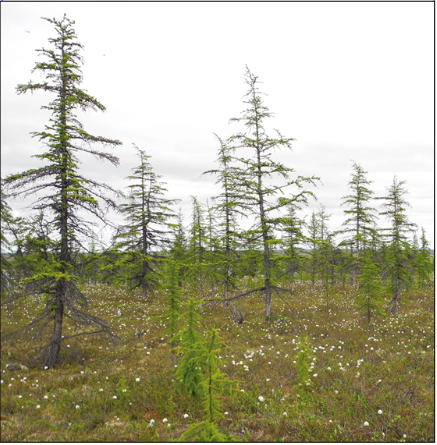
| 16:01, 3. Jan. 2021 | Forest-line Taimyr Sibiria.jpg (Datei) |  |
182 KB | Dieter Kasang (Diskussion | Beiträge) | == Beschreibung == Waldgrenze auf der Taimyr-Halbinsel, Juli 2013 (Foto S. Kruse) ==Lizenzhinweis== {| style="border:1px solid #8888aa; background-color:#f7f8ff;padding:5px;font-size:95%;" | Quelle: Kruse, S., Gerdes, A., Kath, N. J., Epp, L. S., Stoof-Leichsenring, K. R., Pestryakova, L. A., and Herzschuh, U. (2019): Dispersal distances and migration rates at the arctic treeline in Siberia – a genetic and simulation-based study, Biogeosciences, 16, 1211–1224, https://doi.org/10.5194/bg-16-1211… | 1 |
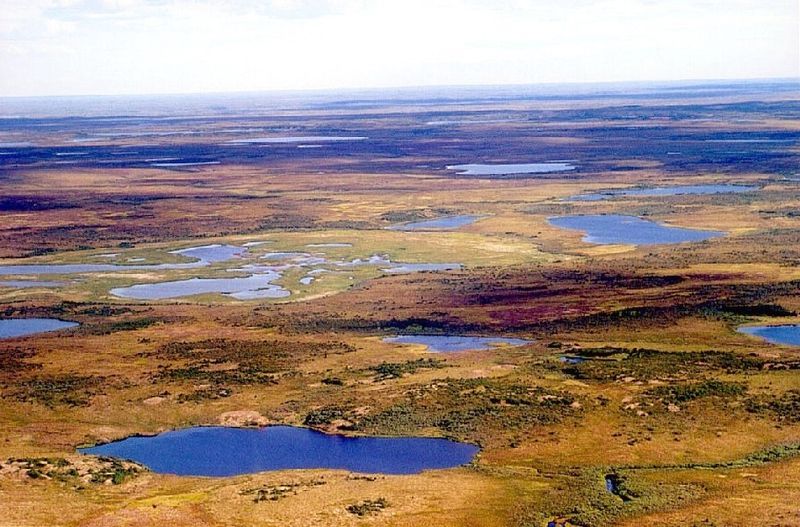
| 12:44, 3. Jan. 2021 | Tundra Sibirien.jpg (Datei) |  |
106 KB | Dieter Kasang (Diskussion | Beiträge) | == Beschreibung == Tundra in Sibirien am Jenissej ==Lizenzhinweis== {| style="border:1px solid #8888aa; background-color:#f7f8ff;padding:5px;font-size:95%;" | Quelle: Wikimedia Commons (2000): Tundra bei Dudinka am Jenissej in Sibirien; Urheber: Dr. Andreas Hugentobler, https://de.wikipedia.org/wiki/Datei:Tundra_in_Siberia.jpg <br /> Lizenz: [http://creativecommons.org/licenses/by/4.0/ CC BY 4.0] |} | 1 |
| 12:26, 3. Jan. 2021 | Alaska greening browning.jpg (Datei) |  |
87 KB | Dieter Kasang (Diskussion | Beiträge) | == Beschreibung == Greening und Browning im Yukon-Kuskokwim-Delta in Alaska. Links: dichte Wiesen in einem ehemaligen Seebecken, das nach Trockenlegung in den 1990er Jahren stark grüner wurde. Rechts: geschädigte Grasvegetation durch Überflutung von Küstenwiesen in den 2000er Jahren mit Salzwasser (Browning). . ==Lizenzhinweis== {| style="border:1px solid #8888aa; background-color:#f7f8ff;padding:5px;font-size:95%;" | Quelle: Beamish, A., M.K. Raynolds, H. Epstein, G.V. Frost, et al. (2020): R… | 1 |
| 12:22, 3. Jan. 2021 | Arctic tundra1950-2015.jpg (Datei) |  |
190 KB | Dieter Kasang (Diskussion | Beiträge) | == Beschreibung == Änderung der klimatischen Tundragrenze 1950-2015. ==Lizenzhinweis== {| style="border:1px solid #8888aa; background-color:#f7f8ff;padding:5px;font-size:95%;" | Quelle: Liu, Y., Xue, Y. Expansion of the Sahara Desert and shrinking of frozen land of the Arctic. Sci Rep 10, 4109 (2020). https://doi.org/10.1038/s41598-020-61085-0<br /> Lizenz: CC BY 4.0 http://creativecommons.org/licenses/by/4.0/ |} | 1 |
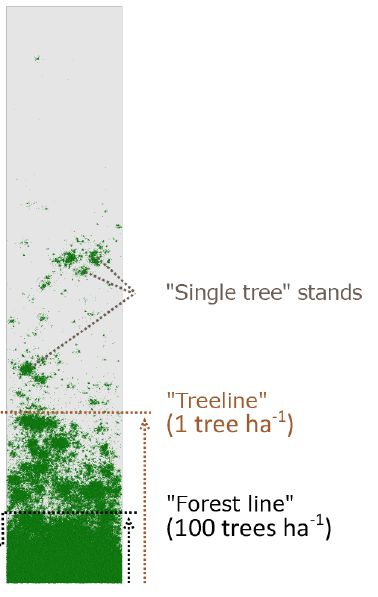
| 12:10, 3. Jan. 2021 | Waldgrenze Baumgrenze.jpg (Datei) |  |
26 KB | Dieter Kasang (Diskussion | Beiträge) | Übergangszone zwischen Taiga und Tundra: Waldgrenze und Baumgrenze ==Lizenzhinweis== {| style="border:1px solid #8888aa; background-color:#f7f8ff;padding:5px;font-size:95%;" | Quelle: Kruse, S., Gerdes, A., Kath, N. J., Epp, L. S., Stoof-Leichsenring, K. R., Pestryakova, L. A., and Herzschuh, U. (2019): Dispersal distances and migration rates at the arctic treeline in Siberia – a genetic and simulation-based study, Biogeosciences, 16, 1211–1224, https://doi.org/10.5194/bg-16-1211-2019<br /> Liz… | 1 |
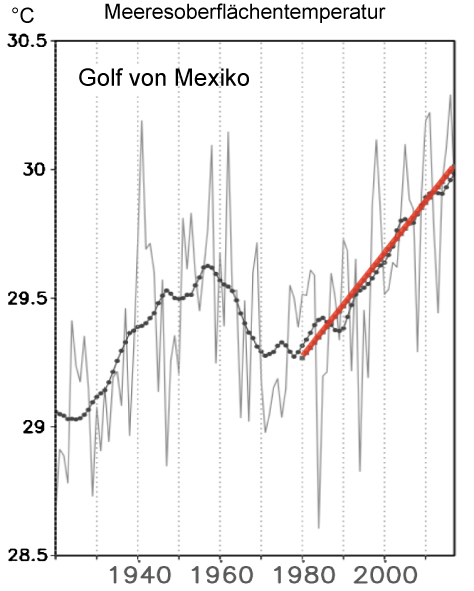
| 16:14, 13. Dez. 2020 | SST Golf von Mexiko.jpg (Datei) |  |
91 KB | Dieter Kasang (Diskussion | Beiträge) | == Beschreibung == Änderung der Meeresoberflächentemperatur im Golf von Mexiko im August ==Lizenzhinweis== {| style="border:1px solid #8888aa; background-color:#f7f8ff;padding:5px;font-size:95%;" | Quelle: Wang, S. Y. et al. (2018): Quantitative attribution of climate effects on hurricane Harvey’s extreme rainfall in Texas. Environ. Res. Lett. 13, 054014Wang, S. Y. et al. Quantitative attribution of climate effects on hurricane Harvey’s extreme rainfall in Texas. Environ. Res. Lett. 13, 054014<… | 1 |
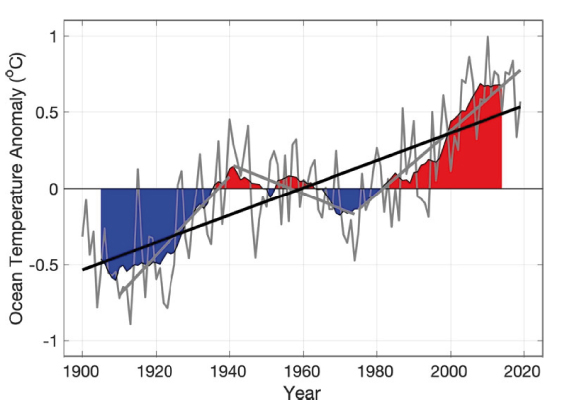
| 14:20, 13. Dez. 2020 | Atlantic Ocean temp1900-2020.jpg (Datei) |  |
65 KB | Dieter Kasang (Diskussion | Beiträge) | == Beschreibung == Änderung der Meeresoberflächentemperaturen 1900 bis 2020 im Atlantik ==Lizenzhinweis== {| style="border:1px solid #8888aa; background-color:#f7f8ff;padding:5px;font-size:95%;" | Quelle: NOAA, State of the Science Fact Sheet (2020): Atlantic Hurricanes and Climate, https://nrc.noaa.gov/Portals/0/SOS%20Atlantic%20Hurricanes%20and%20Climate%20FINAL%2005.27.20.pdf?ver=2020-05-29-151601-380<br> Lizenz: public domain |} | 1 |
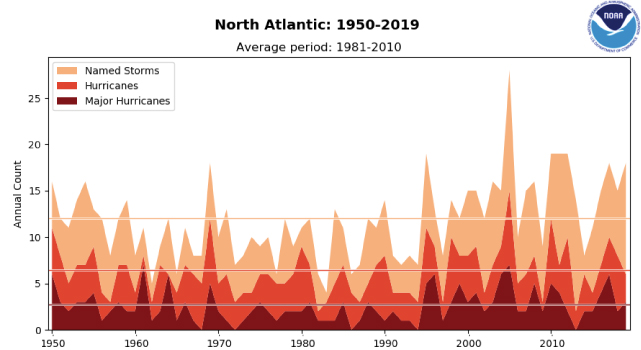
| 13:16, 13. Dez. 2020 | Hurricanes Storms1950-2019.jpg (Datei) |  |
94 KB | Dieter Kasang (Diskussion | Beiträge) | == Beschreibung == Benannte tropische Stürme, Hurrikane und starke (Kategorie 3-5) Hurrikane ==Lizenzhinweis== {| style="border:1px solid #8888aa; background-color:#f7f8ff;padding:5px;font-size:95%;" | Quelle: NOAA National Hurricane Center (2020): [https://www.ncdc.noaa.gov/sotc/tropical-cyclones/201913 Hurricanes and Tropical Storms] <br> Lizenz: public domain |} | 1 |
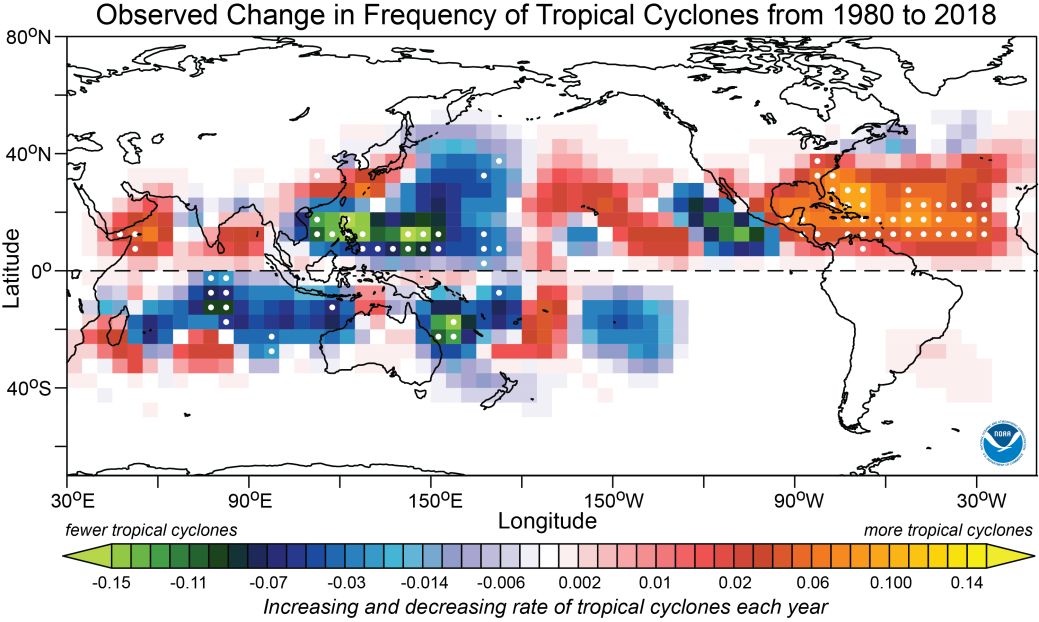
| 13:01, 13. Dez. 2020 | TC frequency 1980-2018.jpg (Datei) |  |
119 KB | Dieter Kasang (Diskussion | Beiträge) | == Beschreibung == Veränderung der Häufigkeit von tropischen Wirbelstürmen zwischen 1980 und 2018 (Anzahl pro Jahr) ==Lizenzhinweis== {| style="border:1px solid #8888aa; background-color:#f7f8ff;padding:5px;font-size:95%;" | Quelle: Murakami, H., Delworth, T. L., Cooke, W. F., Zhao, M., Xiang, B., & Hsu, P.‐C. (2020). Detected climatic change in global distribution of tropical cyclones. Proceedings of the National Academy of Sciences of the United States of America, 117(20), 10706–10714. https:… | 1 |
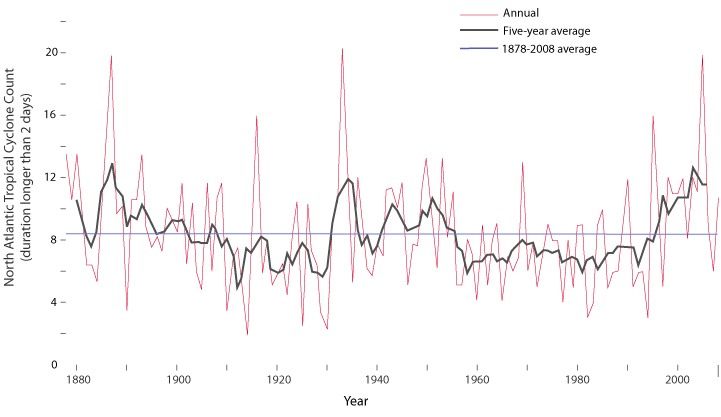
| 12:51, 13. Dez. 2020 | AdjustedTCCount 1878-2008.png (Datei) |  |
34 KB | Dieter Kasang (Diskussion | Beiträge) | Jährliche tropische Wirbelstürme im tropischen N-Atlantik 1878-2010. Stürme von weniger als 2 Tagen wurden ausgelassen und Stürme, die vor der Satellitenbeobachtung nicht erfasst wurden, hinzugefügt (s. Text). Rote Linie: Jahresmittel, schwarze Linie: 5-Jahresmittel, blaue Linie: Durchschnitt der Periode 1878-2008 ==Lizenzhinweis== {| style="border:1px solid #8888aa; background-color:#f7f8ff;padding:5px;font-size:95%;" | Quelle: Scott, M., NOAA Climate.gov (2010): Will Hurricanes Change as the… | 1 |
| 10:06, 13. Dez. 2020 | Hurricane Ophelia Ireland.jpg (Datei) |  |
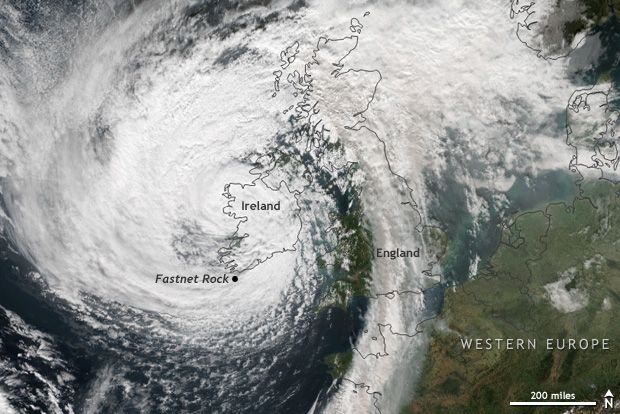
64 KB | Dieter Kasang (Diskussion | Beiträge) | Ex-Hurrikan Ophelia über Irland am 16.10.2017 ==Lizenzhinweis== {| style="border:1px solid #8888aa; background-color:#f7f8ff;padding:5px;font-size:95%;" | Quelle: Di Liberto, T. (2017): Former hurricane Ophelia batters Ireland https://www.climate.gov/news-features/event-tracker/former-hurricane-ophelia-batters-ireland<br> Lizenz: NASA [https://earthobservatory.nasa.gov/ImageUse/ public domain] |} | 1 |
| 19:56, 12. Dez. 2020 | Hurricanes tropical-storms.jpg (Datei) |  |
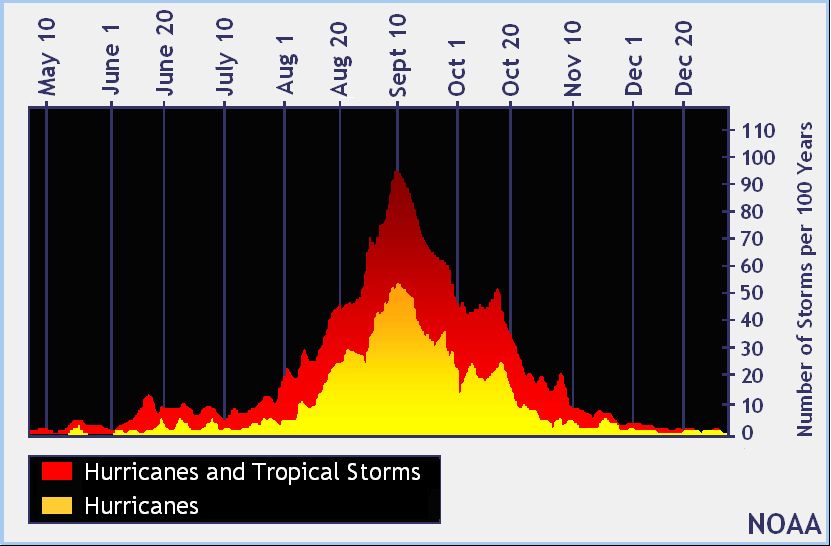
55 KB | Dieter Kasang (Diskussion | Beiträge) | Anzahl von Hurrikanen (gelb, ab 116 km/h) und Tropischen Stürmen (rot, 56-117 km/h) nach Jahreszeit in 100 Jahren ==Lizenzhinweis== {| style="border:1px solid #8888aa; background-color:#f7f8ff;padding:5px;font-size:95%;" | Quelle: NOAA National Hurricane Center (o.J.): Tropical Cyclone Climatology, https://www.nhc.noaa.gov/climo/<br> Lizenz: public domain |} | 1 |
| 03:30, 9. Dez. 2020 | Drought china fut2.jpg (Datei) |  |
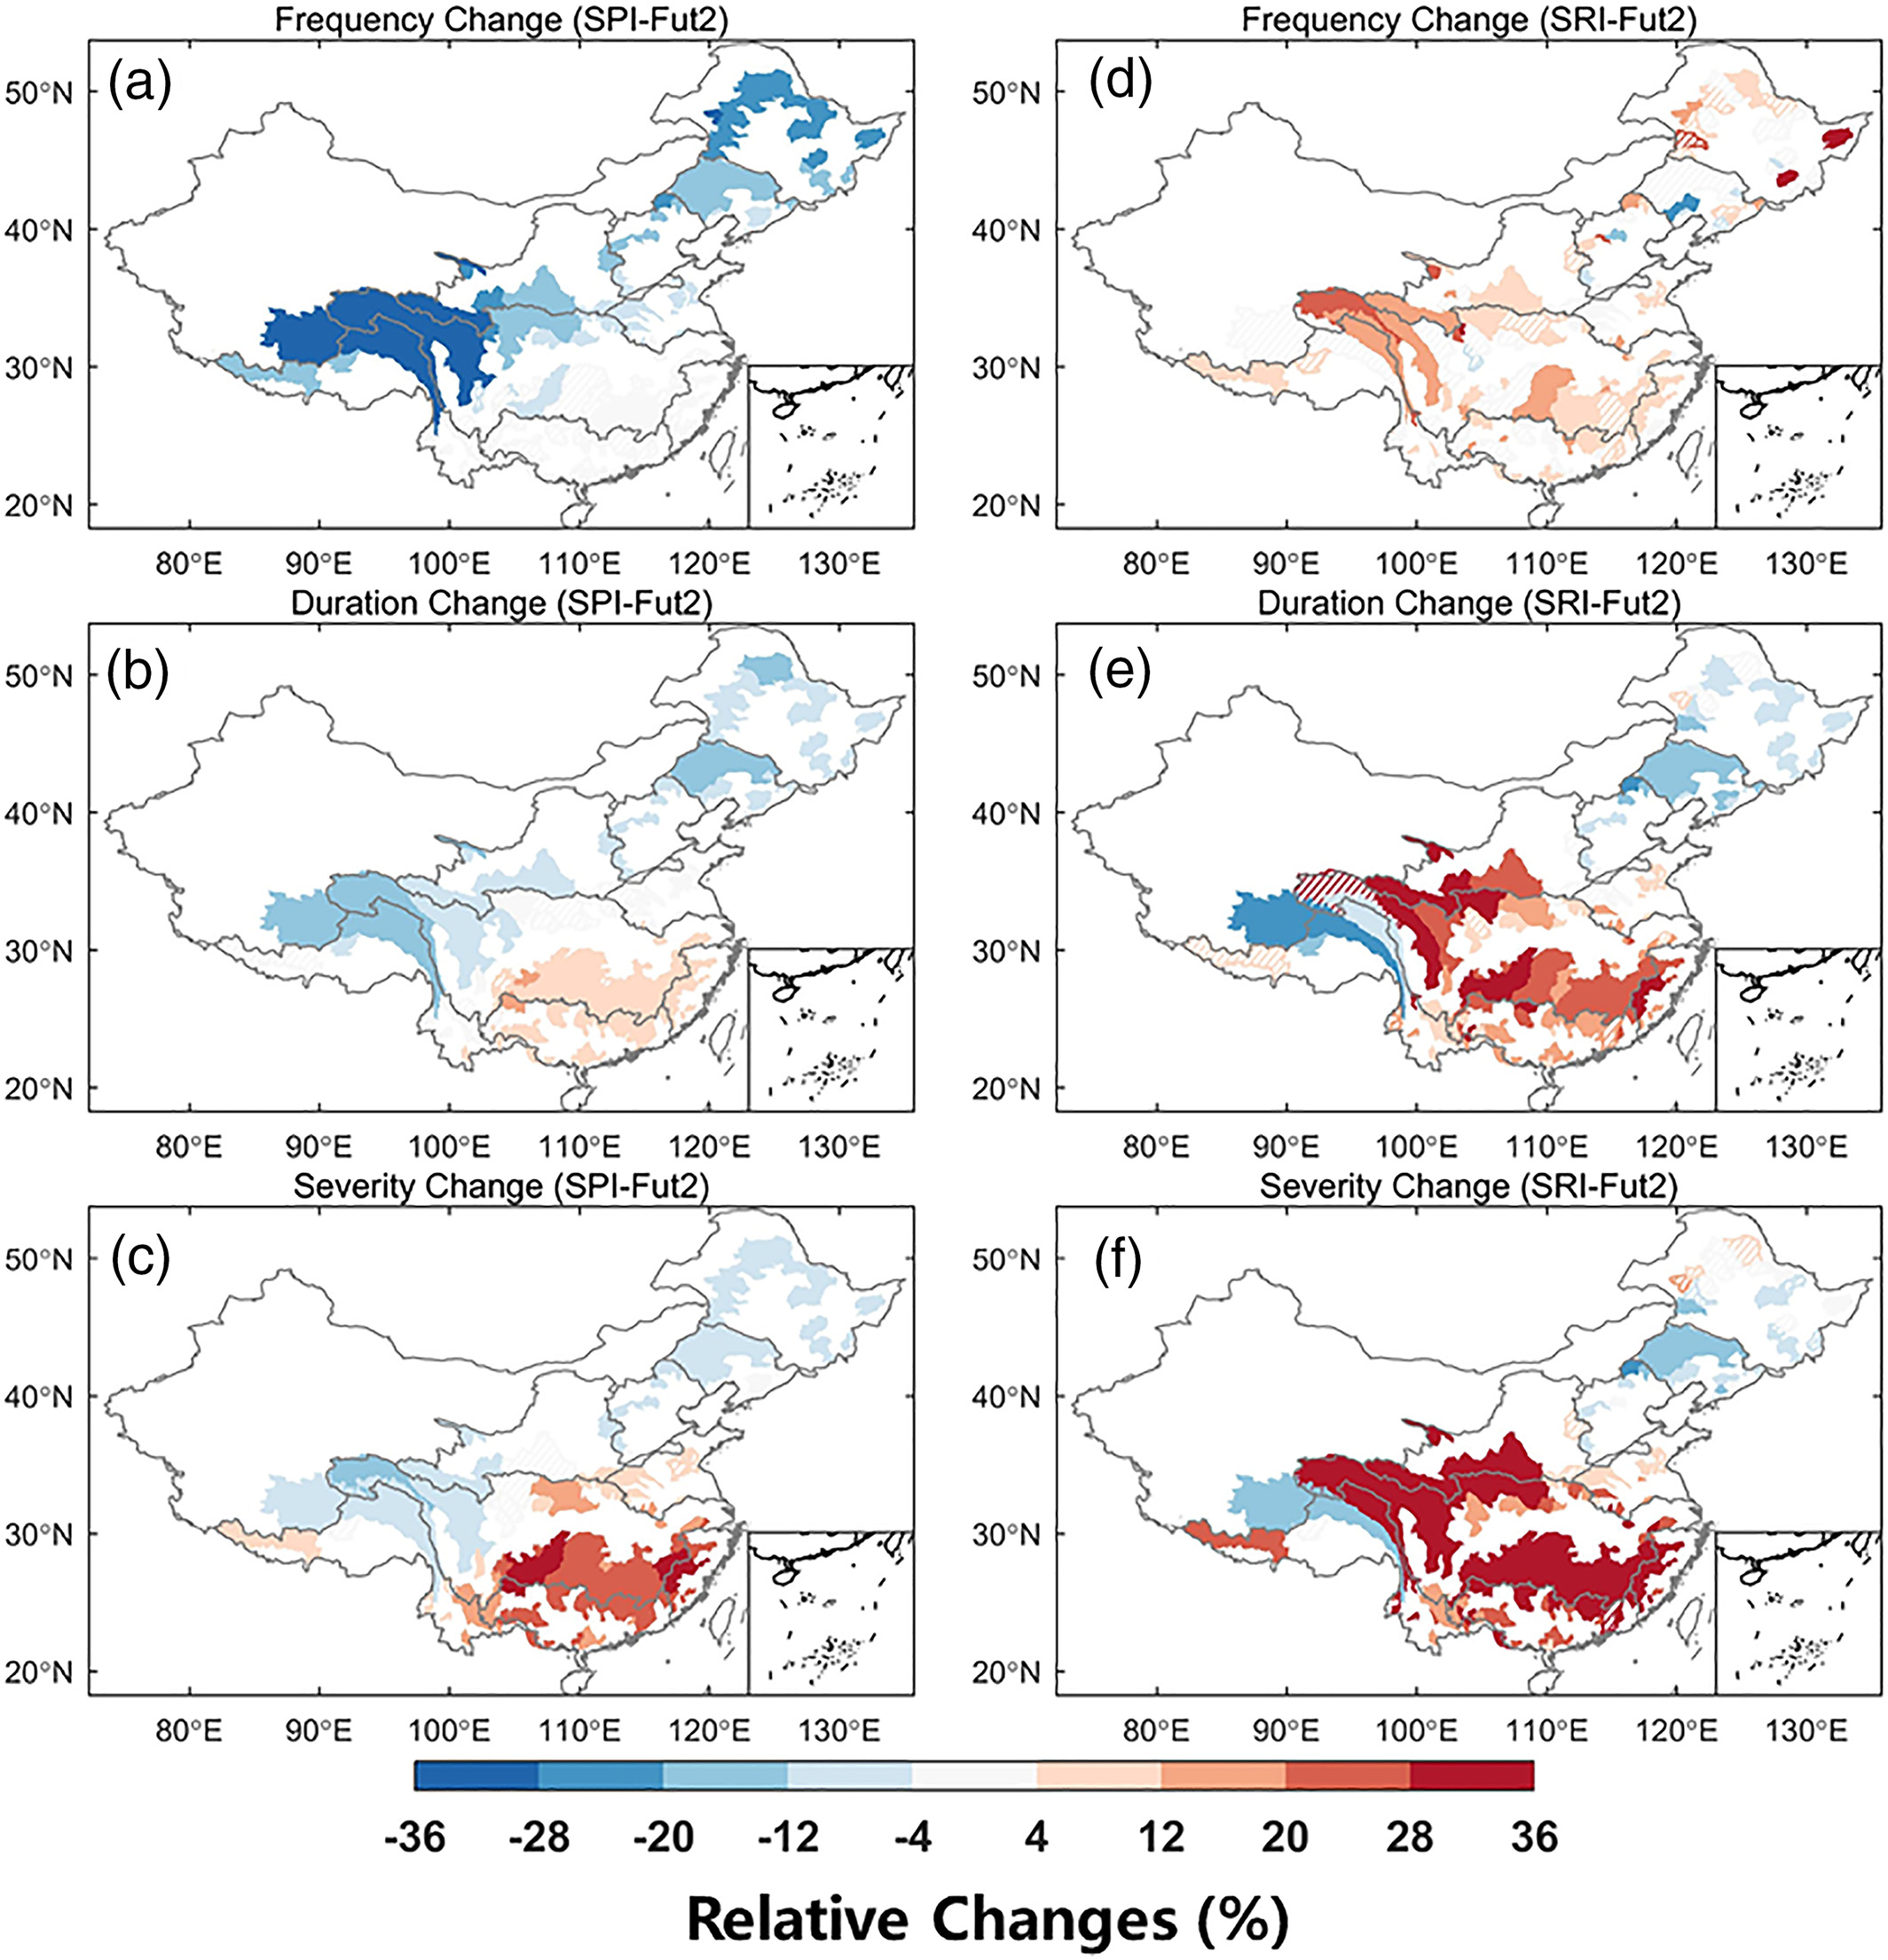
743 KB | Lina Teckentrup (Diskussion | Beiträge) | Änderung in meteorologischen (SPI) und hydrologischen (SRI) Dürrecharakteristika für die nahe Zukunft (2056–20100 im Vergleich zu 1961-2005) nach dem RCP8.5-Szenario: Häufigkeit von Dürren (a, d), Dauer von Dürren (b, e) und die Schwere der Dürre (c, f). Die schraffierten Bereiche zeigen eine niedrige Wahrscheinlichkeit der Ergebnisse an (weniger als 60% der Modelle projizieren die gleiche Änderung). | 1 |
| 03:27, 9. Dez. 2020 | Drought china fut1.jpg (Datei) |  |
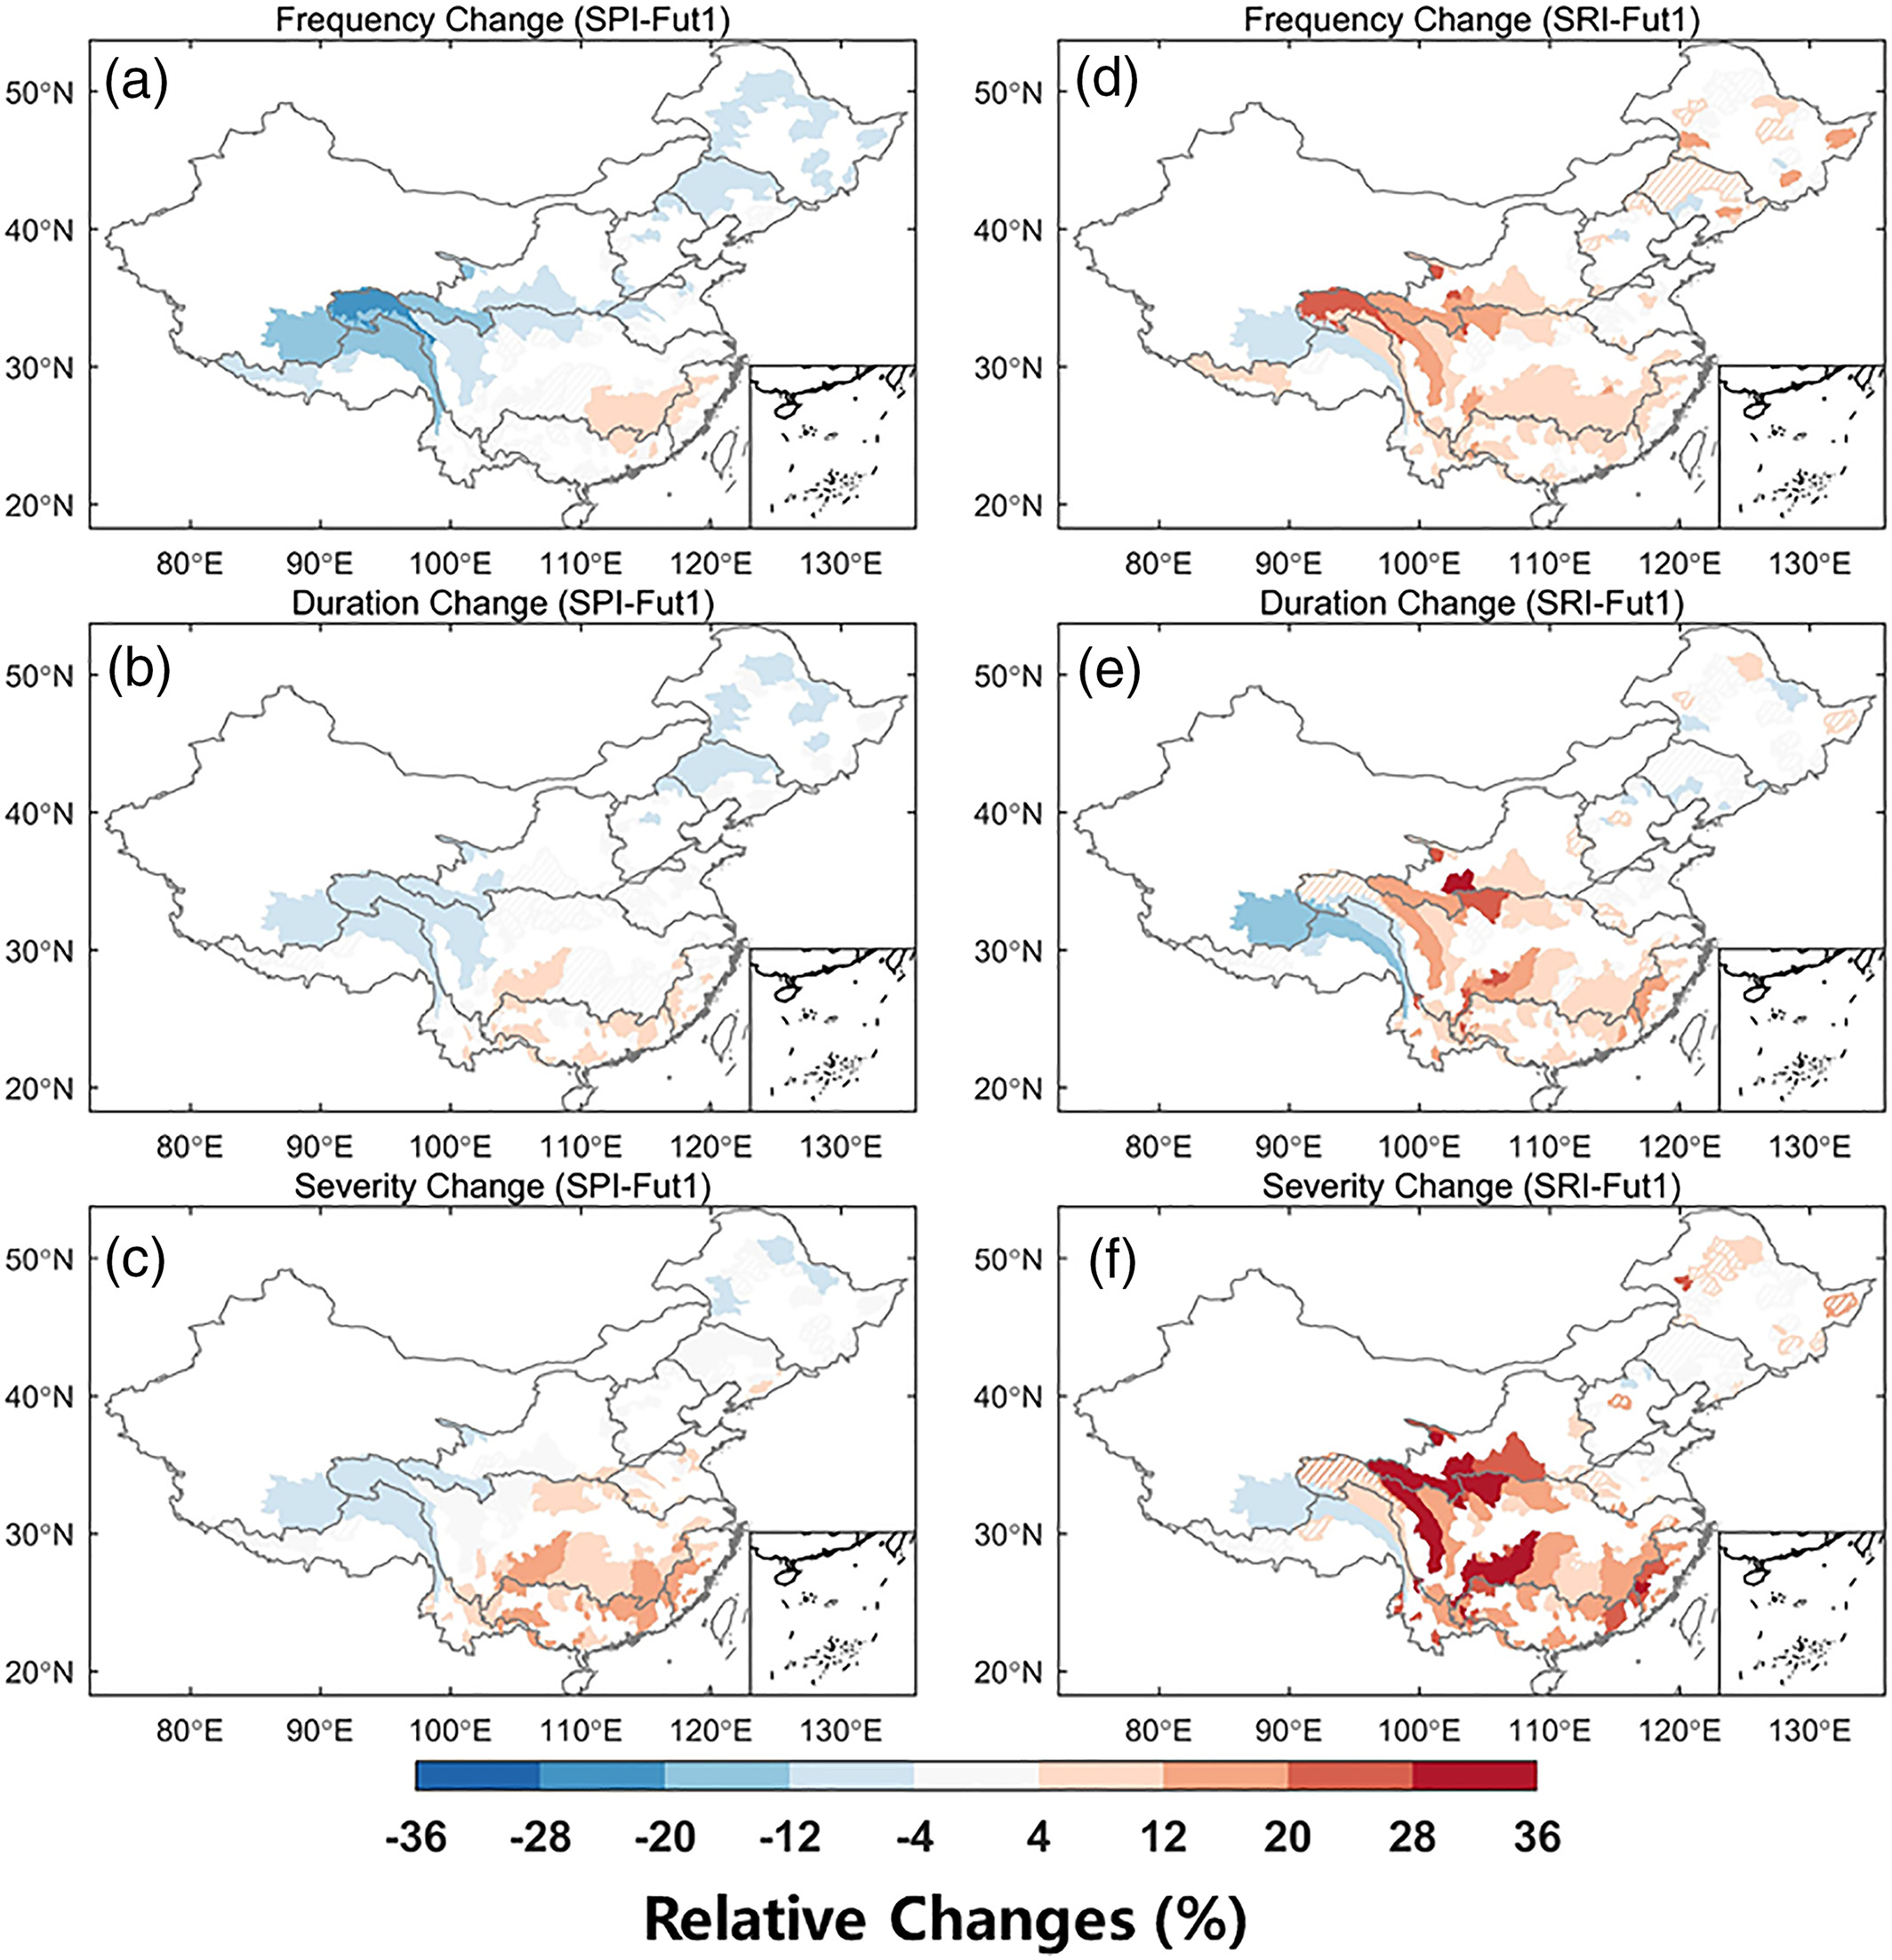
695 KB | Lina Teckentrup (Diskussion | Beiträge) | Änderung in meteorologischen (SPI) und hydrologischen (SRI) Dürrecharakteristika für die nahe Zukunft (2011–2055 im Vergleich zu 1961-2005): Häufigkeit von Dürren (a, d), Dauer von Dürren (b, e) und die Schwere der Dürre (c, f). Die schraffierten Bereiche zeigen eine niedrige Wahrscheinlichkeit der Ergebnisse an (weniger als 60% der Modelle projizieren die gleiche Änderung). | 1 |
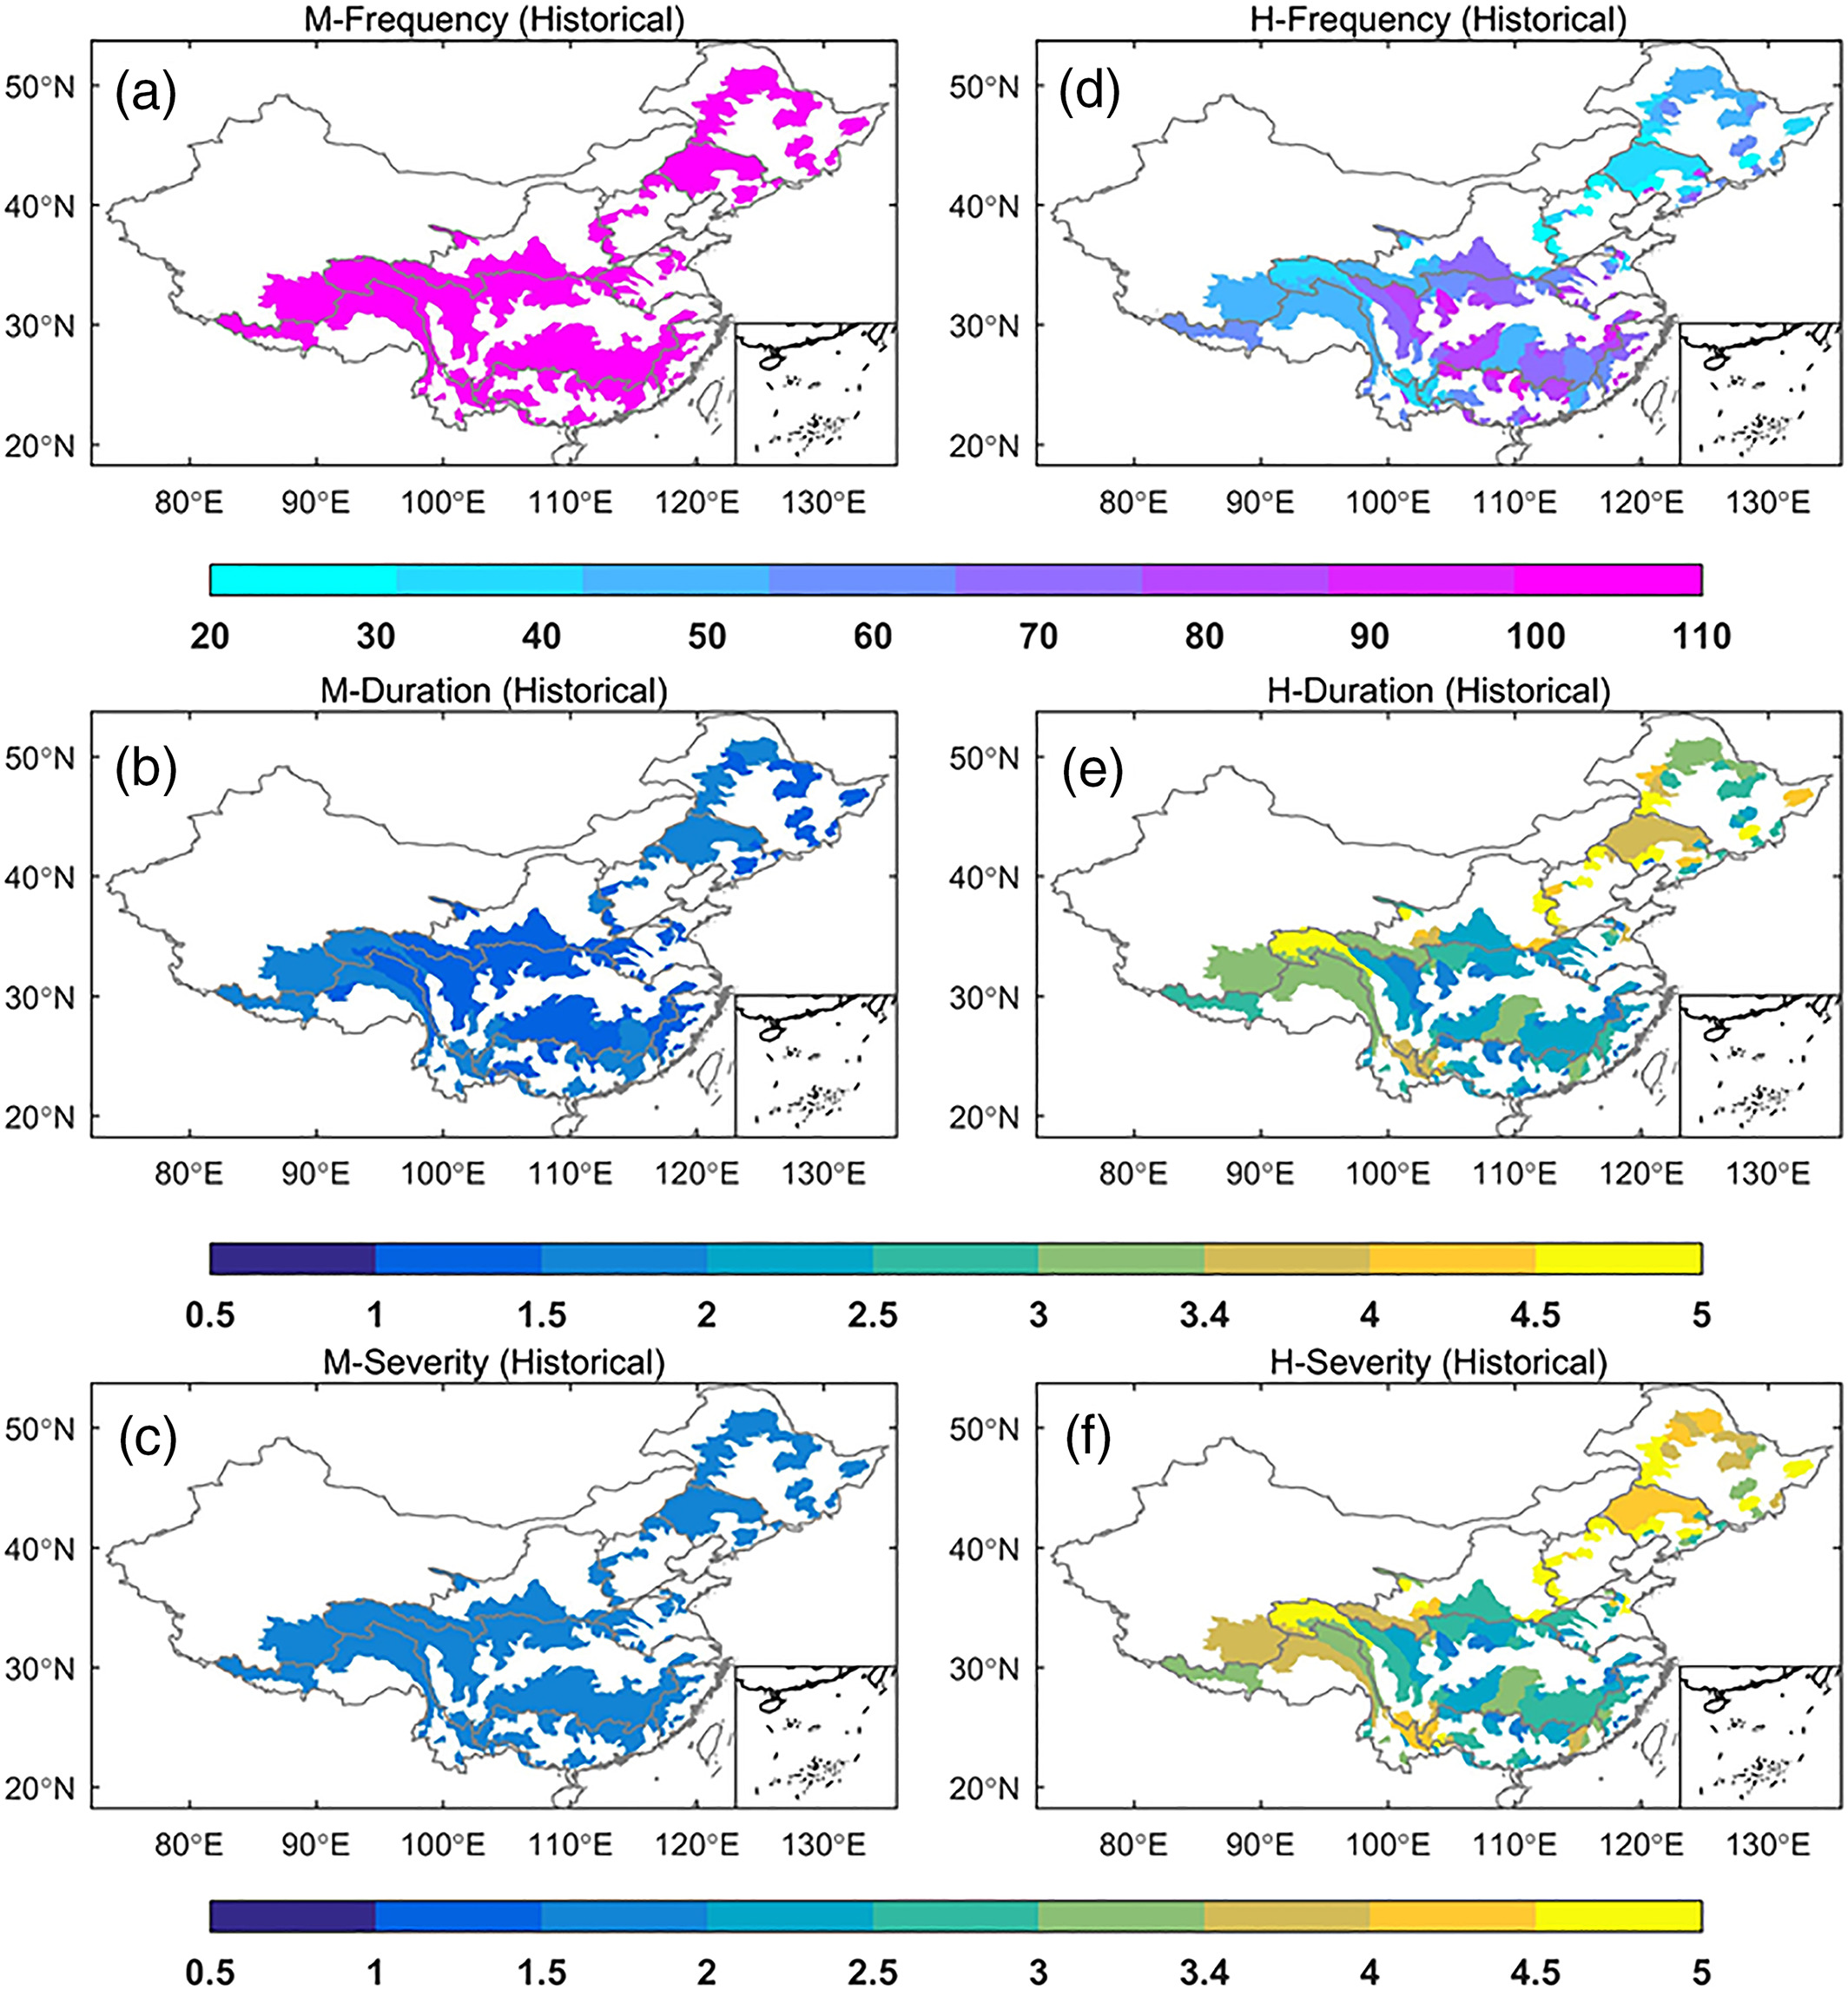
| 03:21, 9. Dez. 2020 | China drought hist.jpg (Datei) |  |
849 KB | Lina Teckentrup (Diskussion | Beiträge) | Meteorologische und hydrologische Dürrecharakteristika während des historischen Zeitraums (1961–2005): Häufigkeit von Dürren (a, d), Dauer von Dürren (b, e) und die Schwere der Dürre (c, f). | 1 |
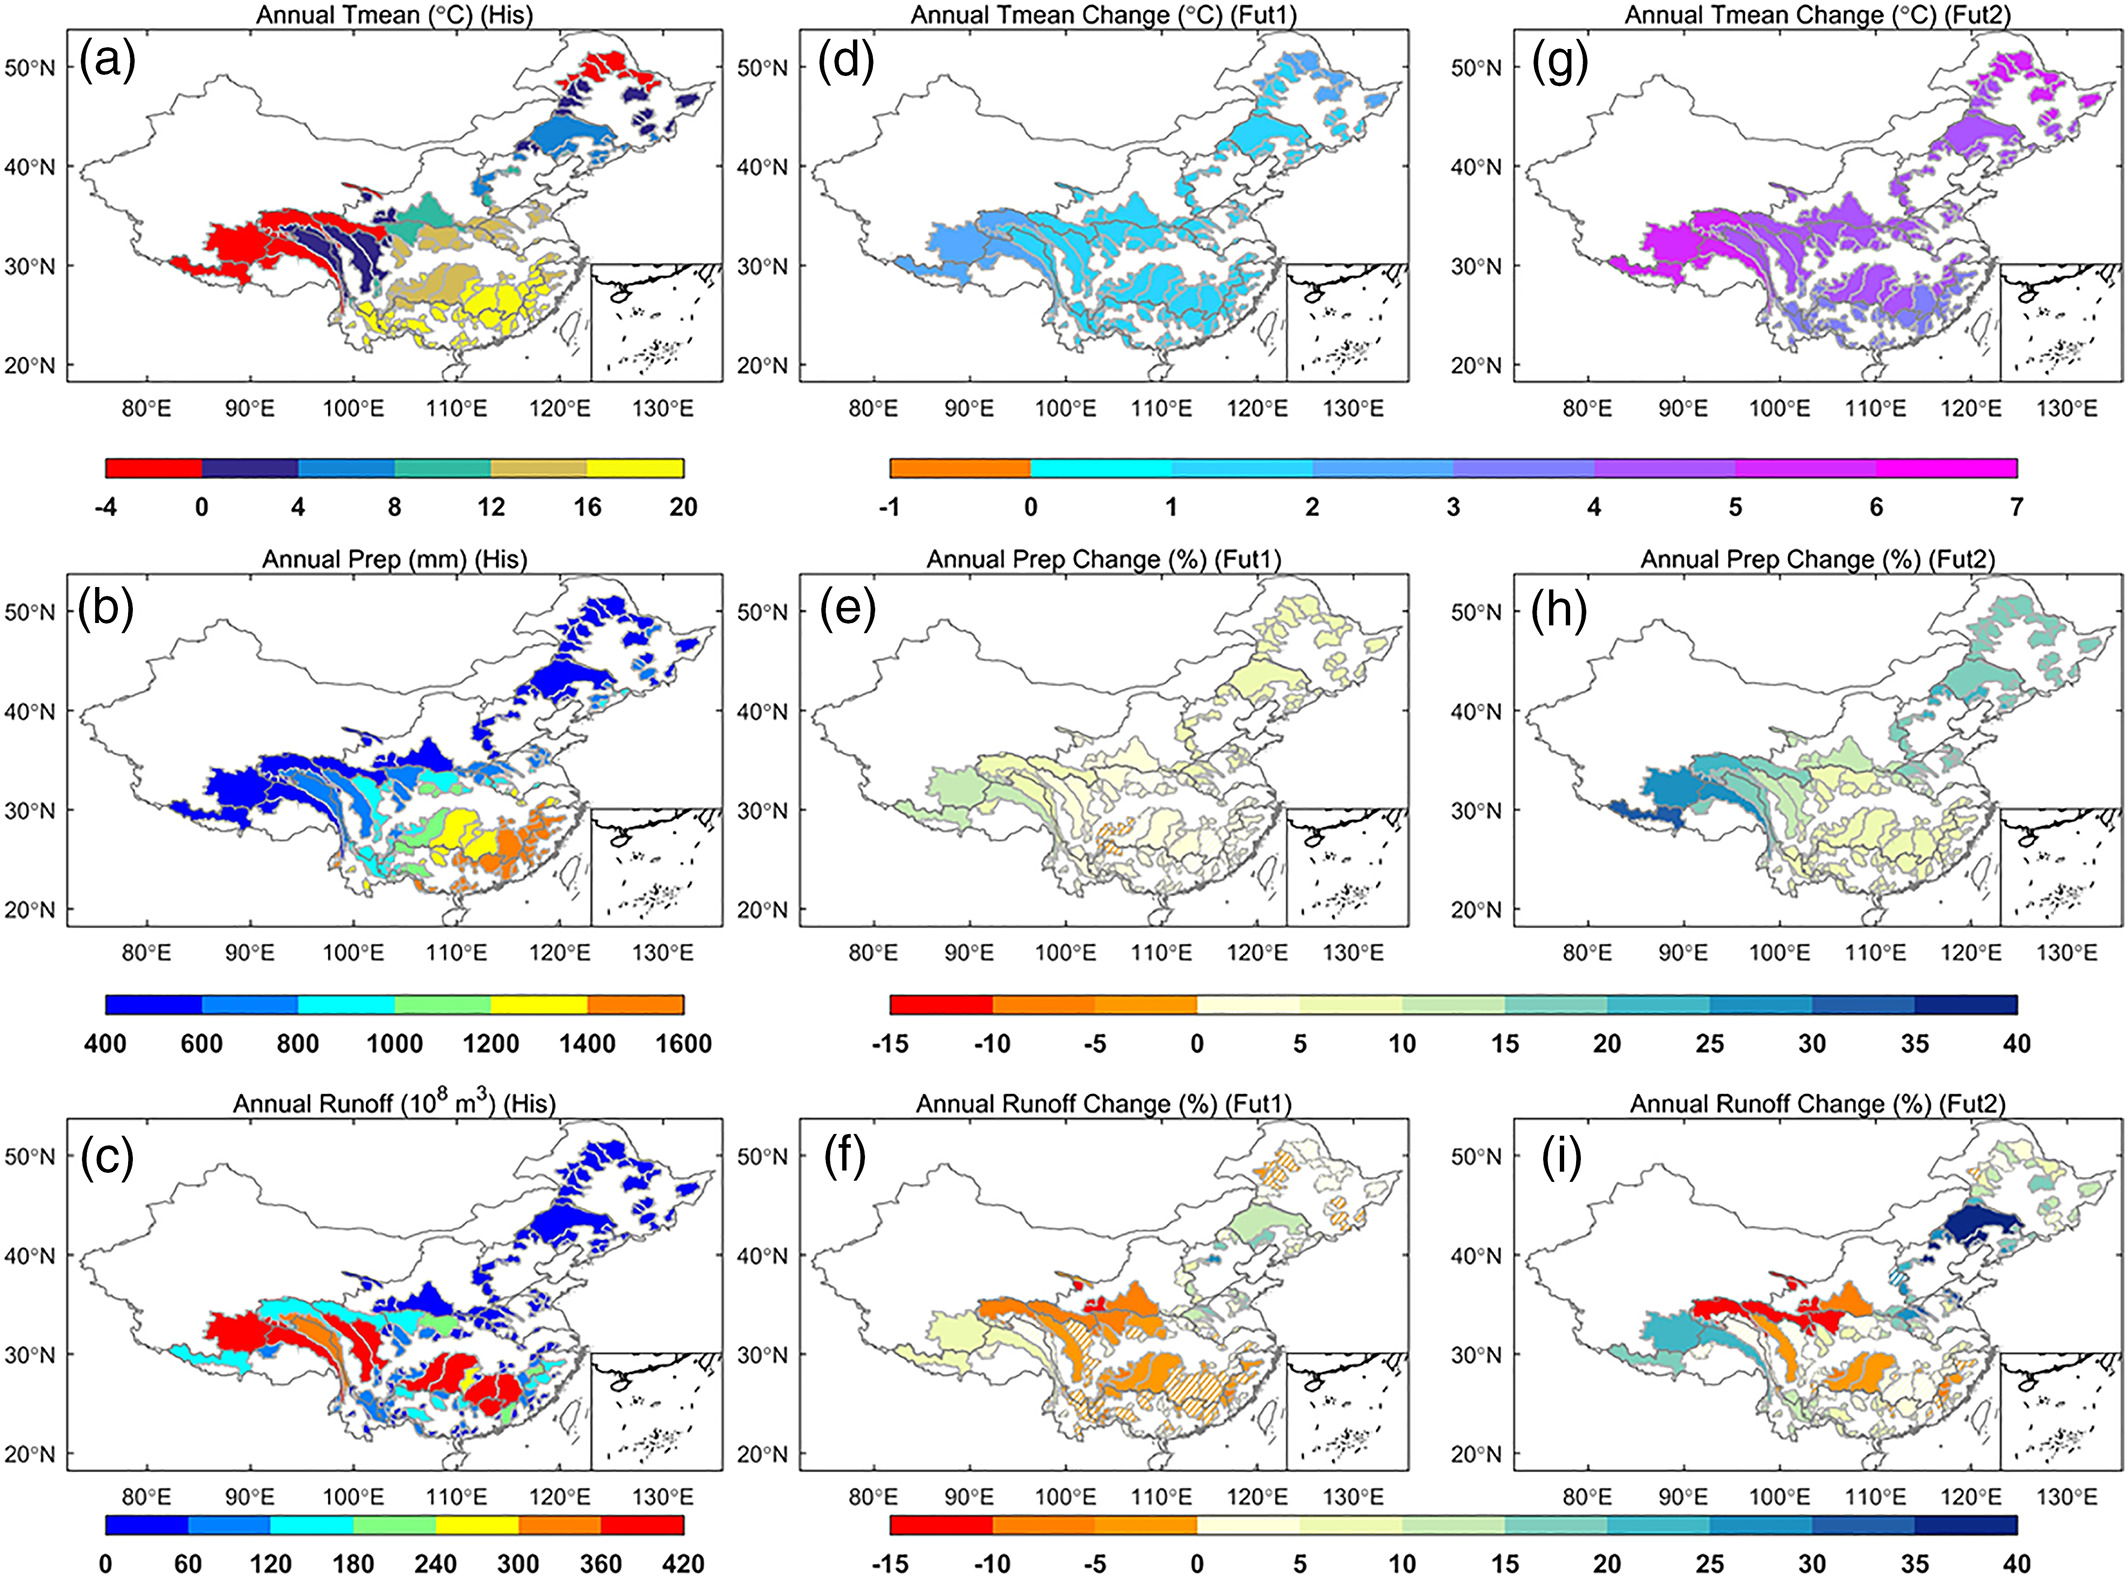
| 03:09, 9. Dez. 2020 | China tmean precip runoff.jpg (Datei) |  |
773 KB | Lina Teckentrup (Diskussion | Beiträge) | Klimatologische und hydrologische Projektionen für den historischen Zeitraum (1961-2005; a-c) und die absolute Änderung für die mittlere Temperatur bzw. die relative Änderung für Niederschlag und Abfluss unter dem RCP8.5-Szenario für die nahe Zukunft ('fut1', 2011-2055; d-f) und die ferne Zukunft ('fut2', 2056-2100; g-i). Die schraffierten Bereiche zeigen eine niedrige Wahrscheinlichkeit der Ergebnisse an (weniger als 60% der Modelle projizieren die gleiche Änderung). | 1 |
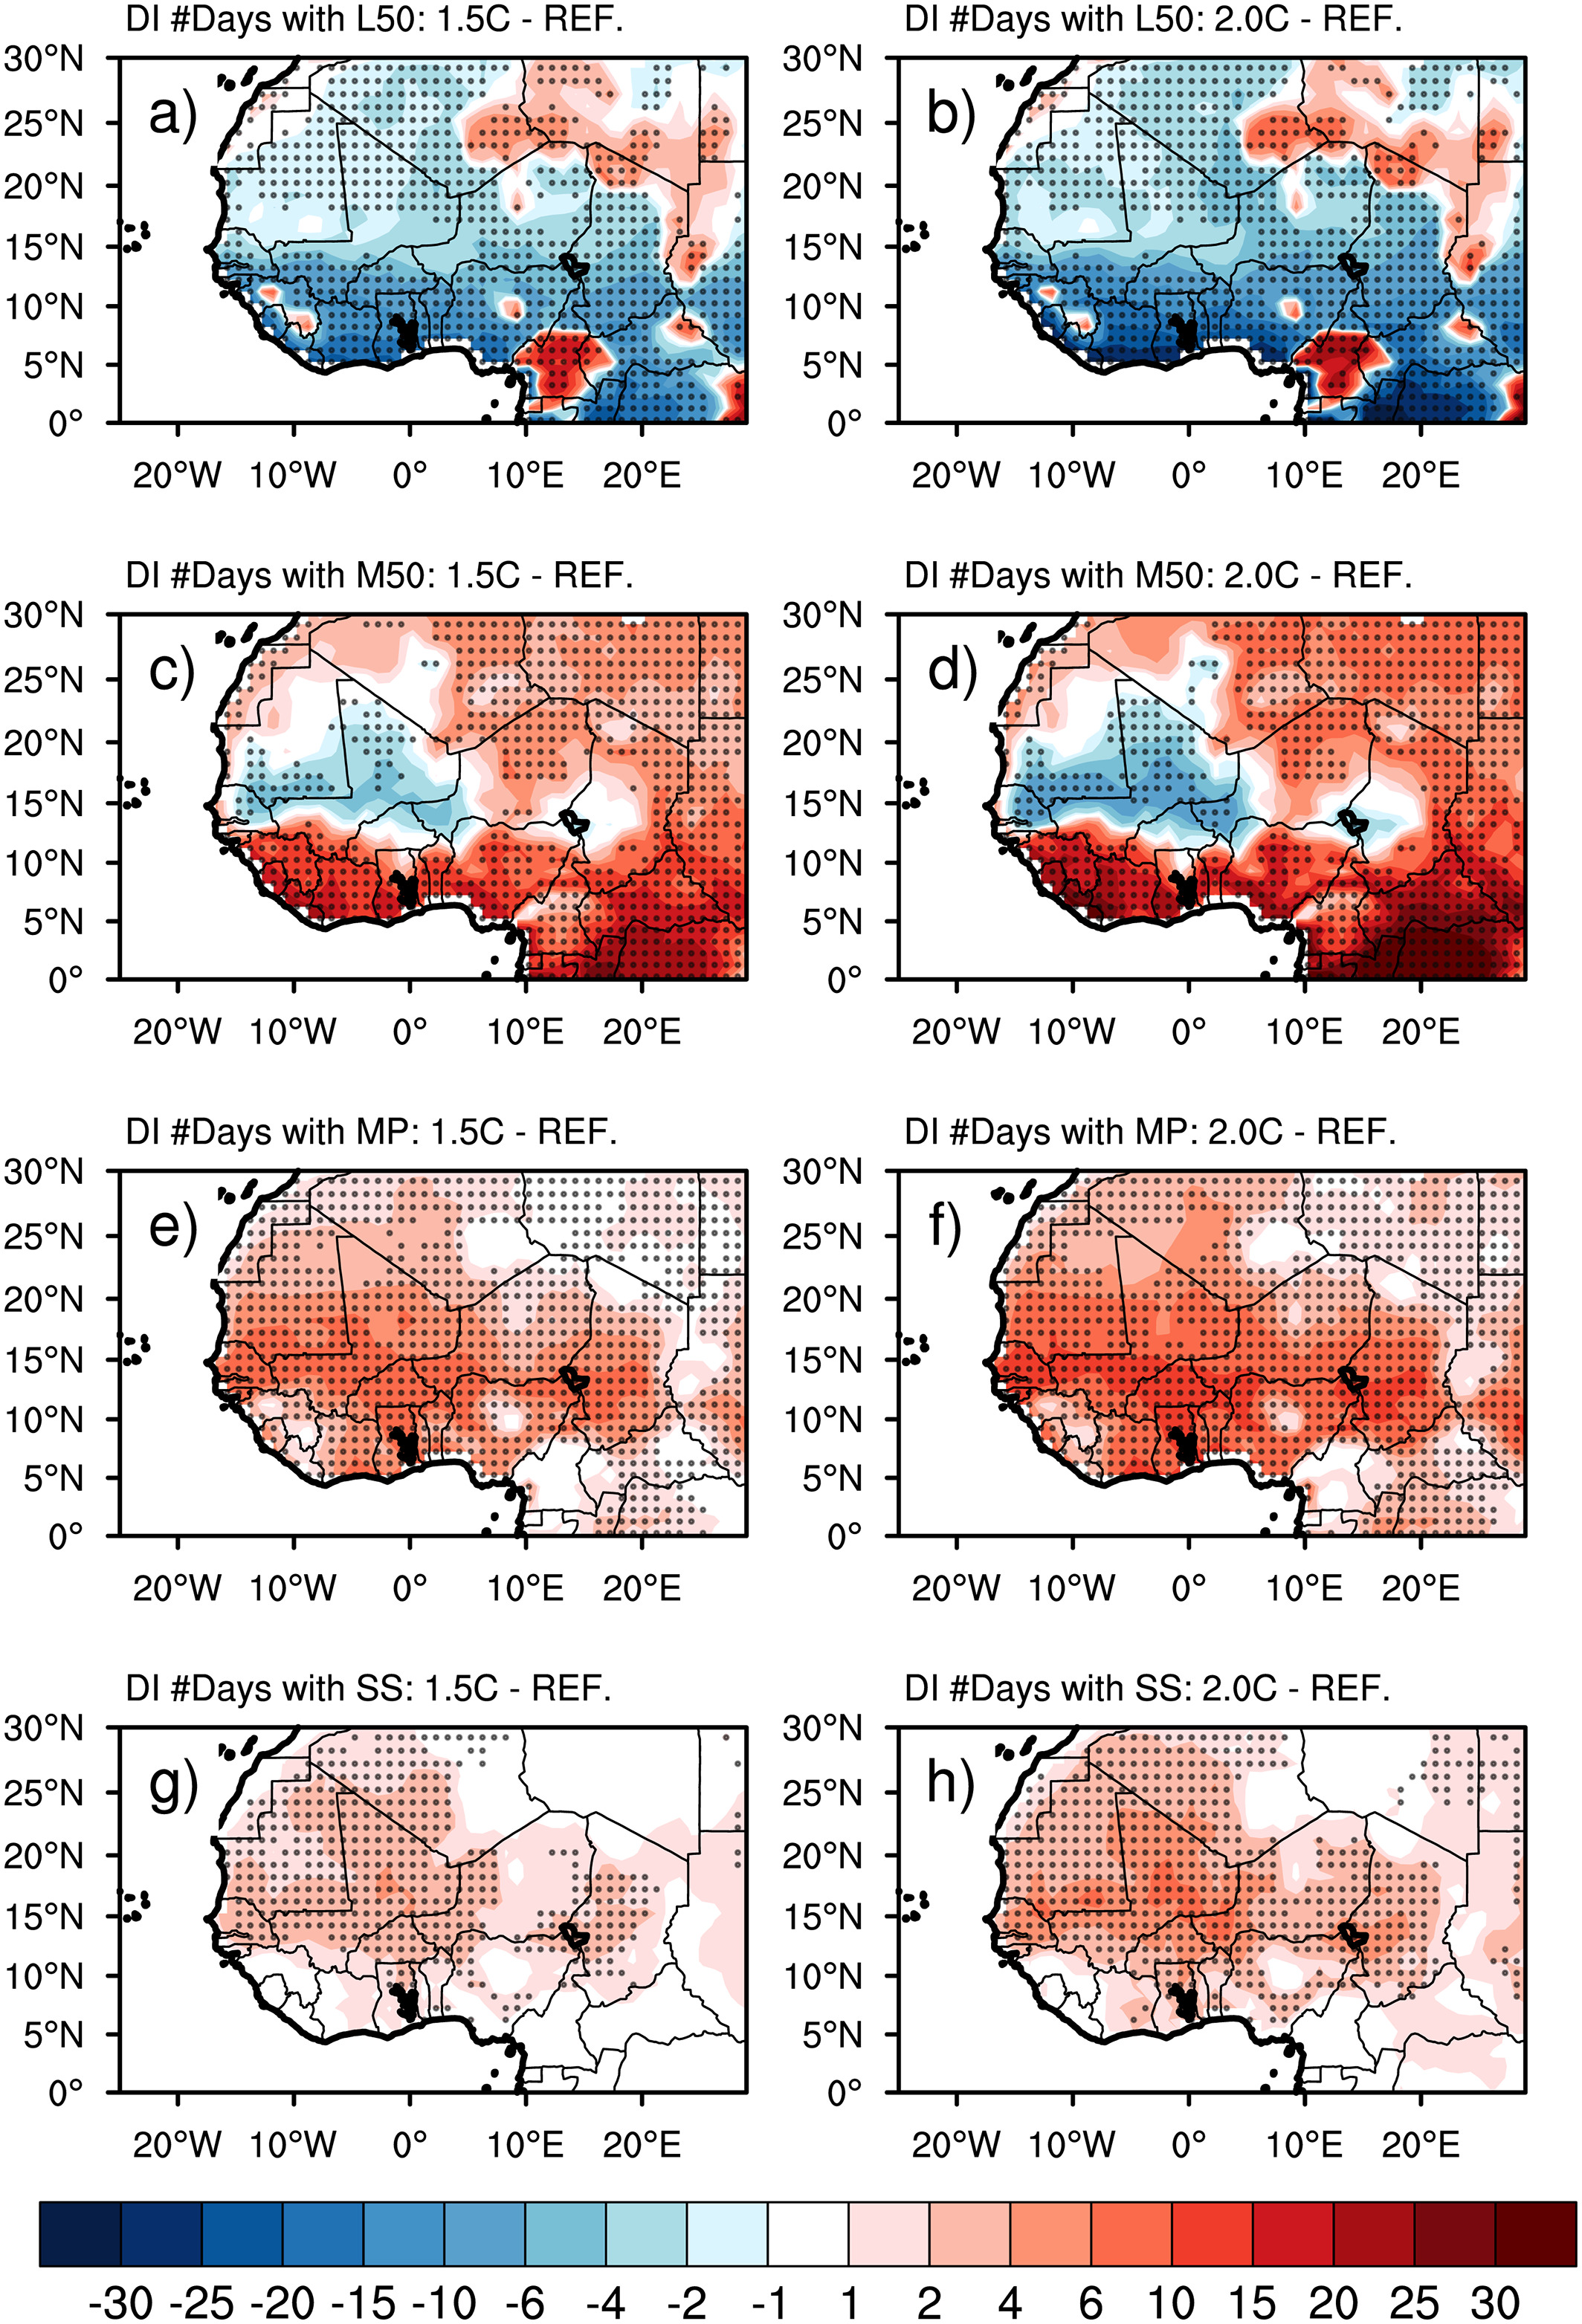
| 05:26, 4. Dez. 2020 | Change di west africa.jpg (Datei) |  |
1,84 MB | Lina Teckentrup (Diskussion | Beiträge) | Änderung der Unbehaglichkeit (discomfort index; 'DI') für das 1.5 °C globale Erwärmungszenario und für das 2 °C globale Erwärmungsszenario. Die Panel zeigen die Änderung von Tagen an denen sich weniger als 50% der Bevölkerung unwohl fühlt (L50), an denen sich mehr als 50% der Bevölkerung unwohl fühlt (M50), und an denen sich der Großteil der Bevölkerung unwohl fühlt (MP). | 1 |
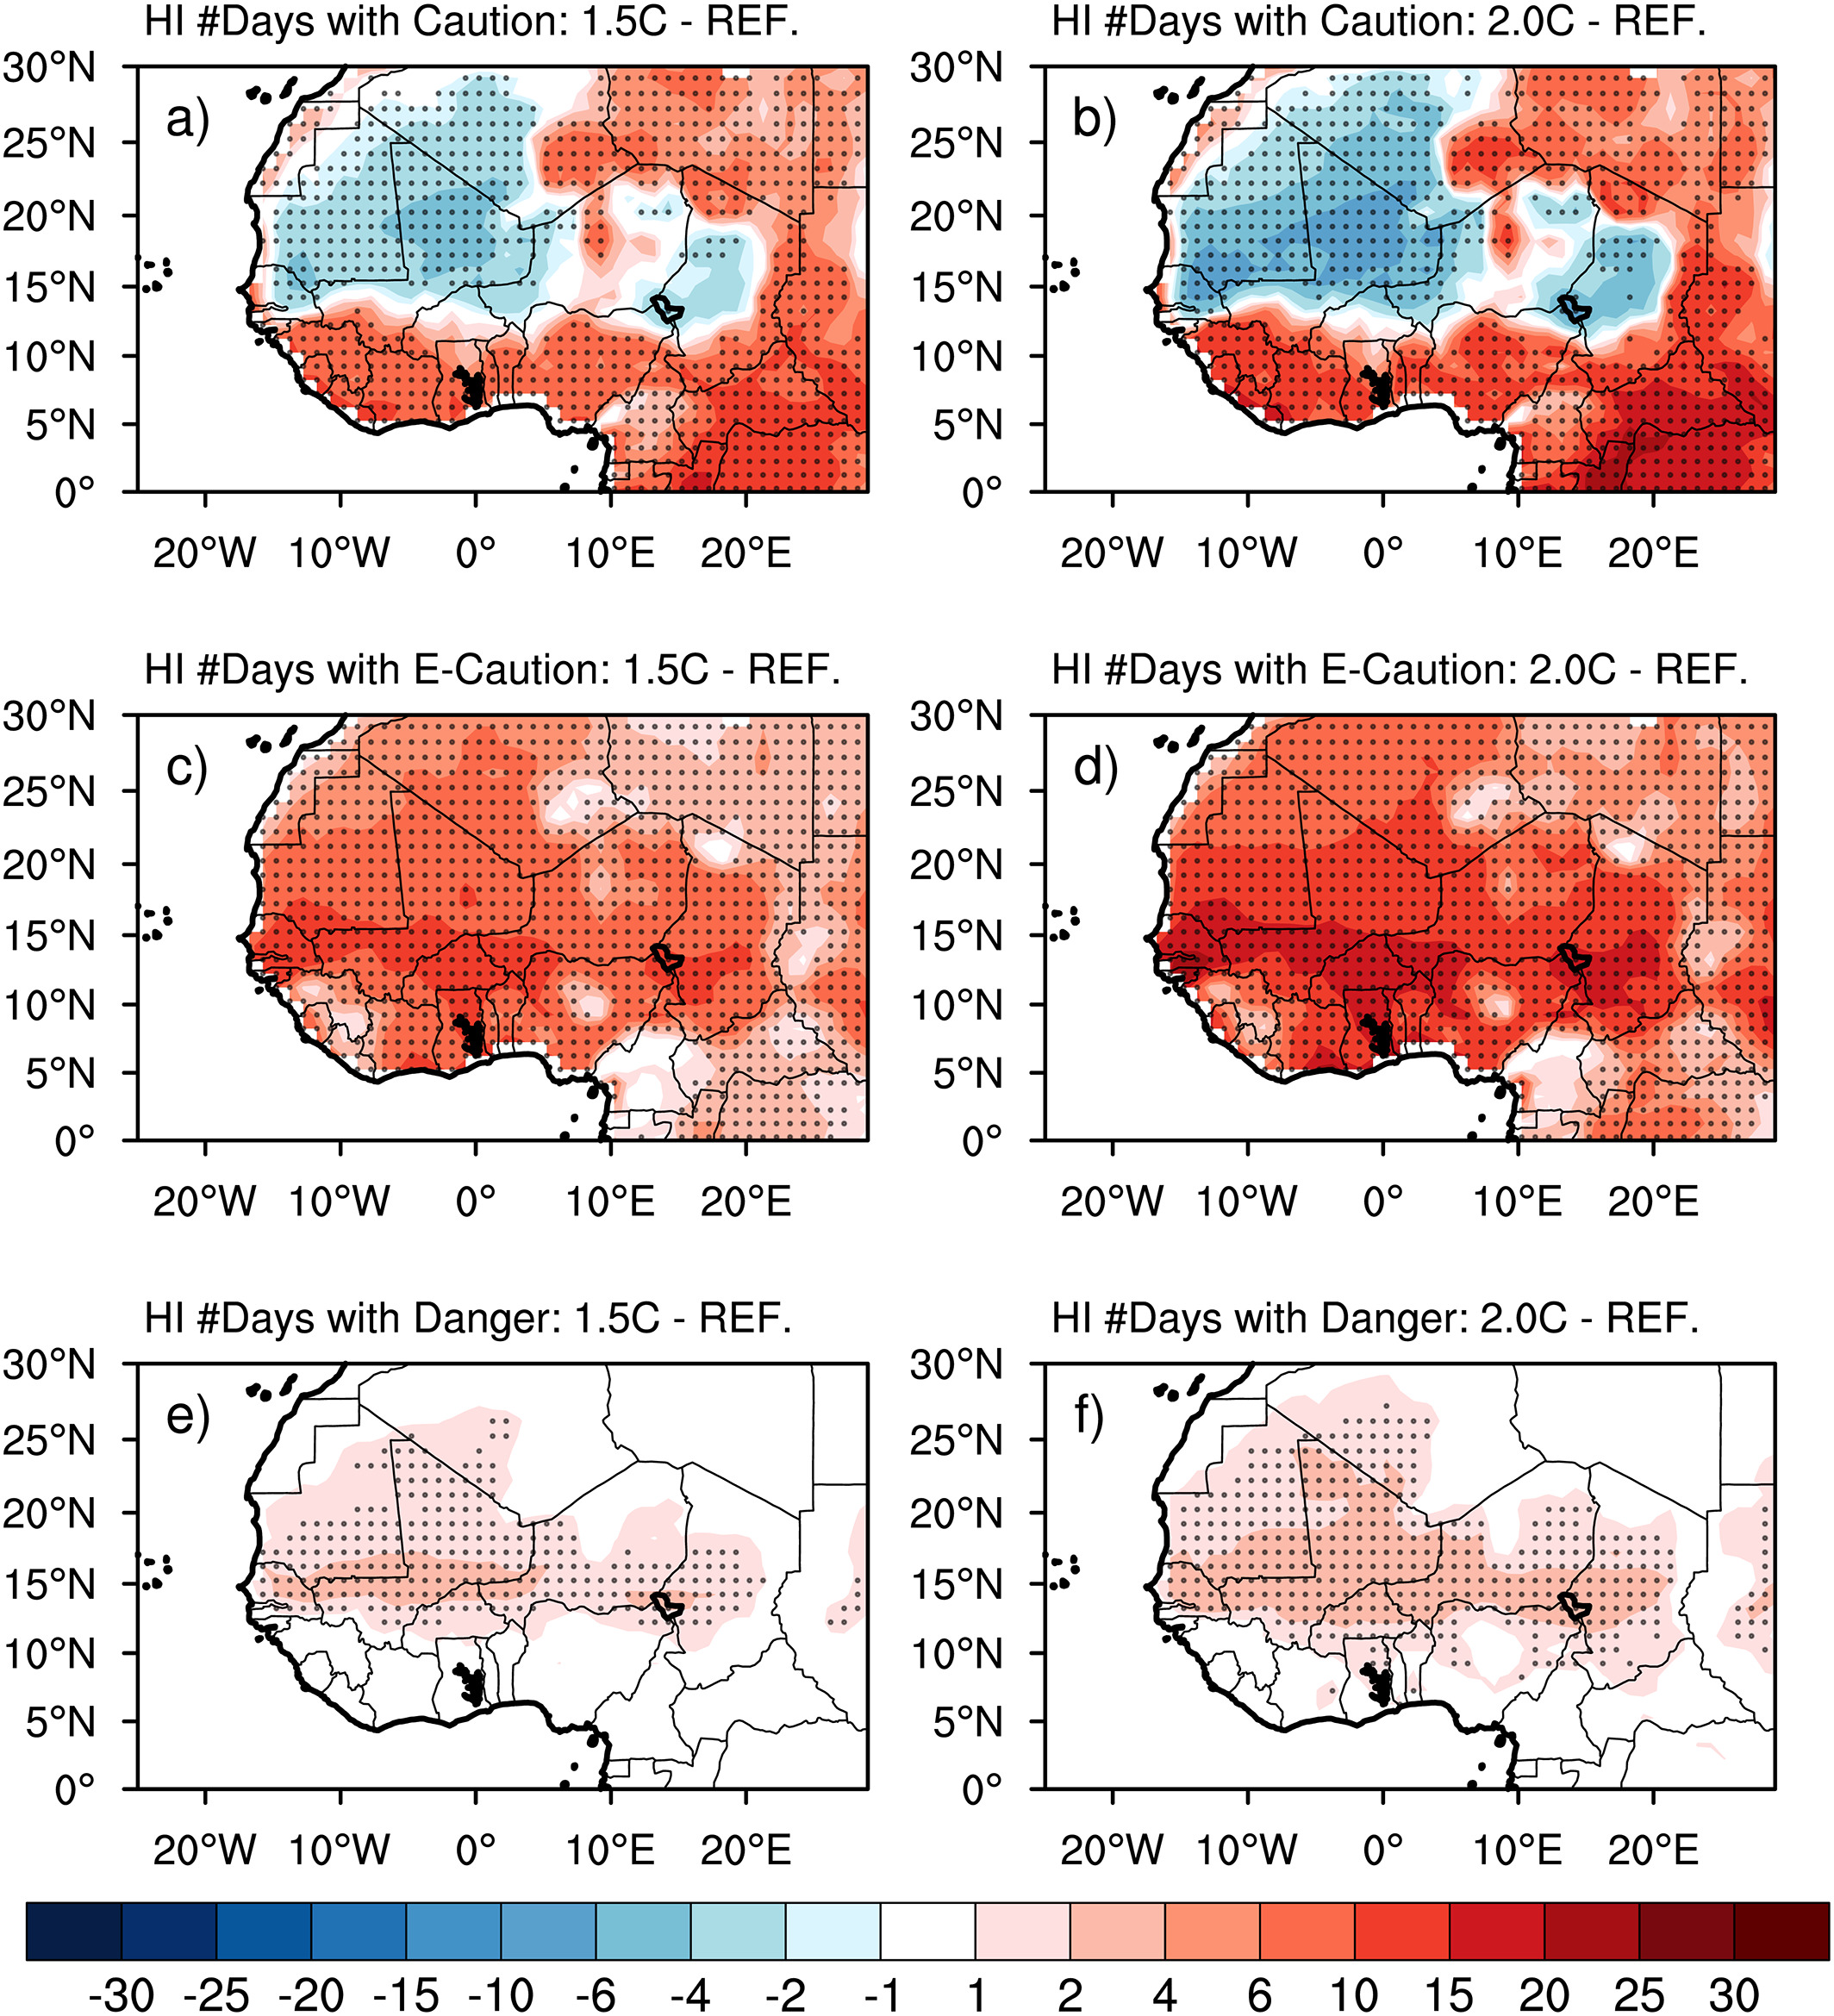
| 05:19, 4. Dez. 2020 | Change heatindex west africa.jpg (Datei) |  |
1,37 MB | Lina Teckentrup (Diskussion | Beiträge) | Änderung in der Anzahl von Tagen mit Hitzestress für das 1.5 °C globale Erwärmungszenario, und für das 2 °C globale Erwärmungsszenario. HI steht für Hitzeindex und die Panel zeigen die Änderung von Tagen mit der Risikokategorie Warnung (Caution), Extremwarnung (E‐Caution) und Gefahr (Danger). | 1 |
