Dateiliste
Aus Klimawandel
Diese Spezialseite listet alle hochgeladenen Dateien auf.
| Datum | Name | Vorschaubild | Größe | Benutzer | Beschreibung | Versionen |
|---|---|---|---|---|---|---|
| 14:59, 14. Aug. 2024 | Share-of-cumulative-co2.jpg (Datei) |  |
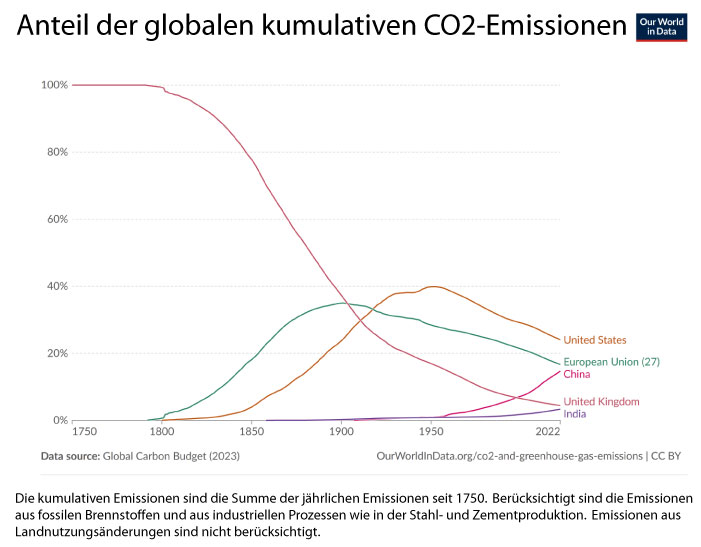
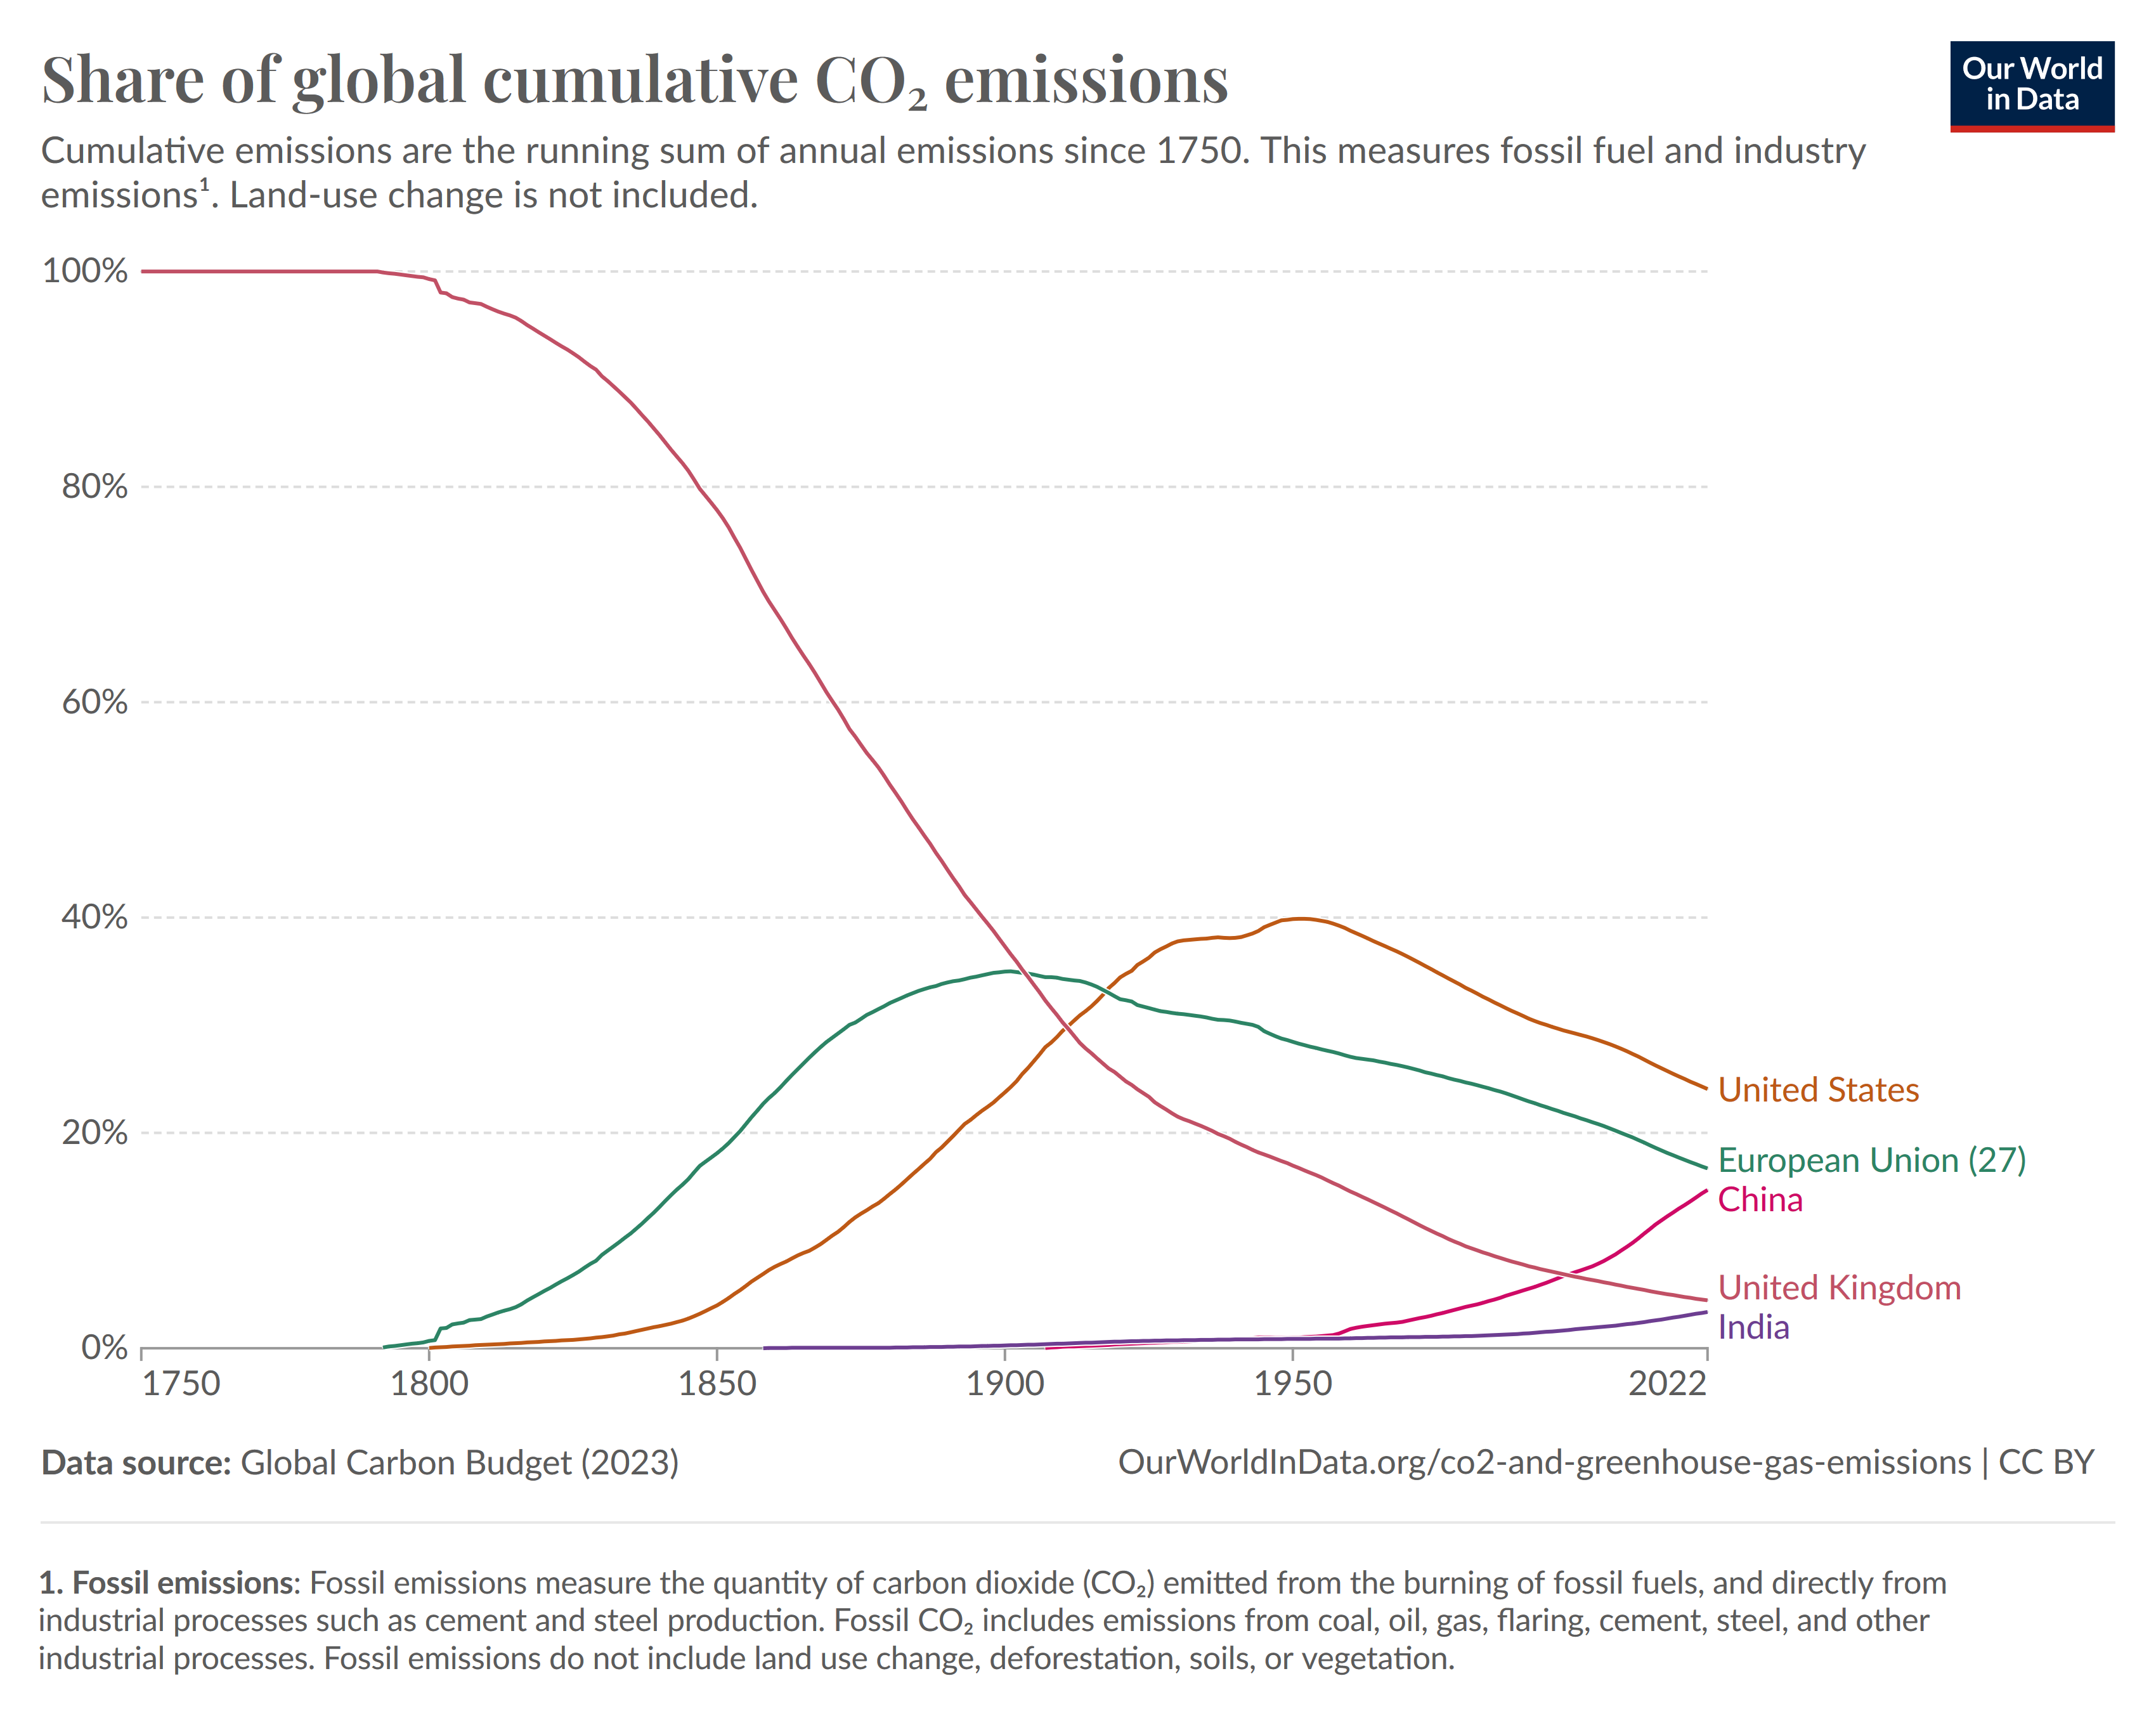
51 KB | Dieter Kasang (Diskussion | Beiträge) | == Beschreibung == Anteil an den kumulativen globalen CO2-Emissionen in %. ==Lizenzhinweis== {| style="border:1px solid #8888aa; background-color:#f7f8ff;padding:5px;font-size:95%;" | Quelle: Richie, H., P. Rosado and M. Roser – Our World in Data (2023): Per capita, national, historical: how do countries compare on CO2 metrics? https://ourworldindata.org/co2-emissions-metrics <br> Lizenz: CC BY http://creativecommons.org/licenses/by/4.0 |} | 1 |
| 14:41, 14. Aug. 2024 | Share-of-cumulative-co2.png (Datei) |  |
612 KB | Dieter Kasang (Diskussion | Beiträge) | == Beschreibung == Anteil an den kumulativen globalen CO2-Emissionen in %. ==Lizenzhinweis== {| style="border:1px solid #8888aa; background-color:#f7f8ff;padding:5px;font-size:95%;" | Quelle: Richie, H., P. Rosado and M. Roser – Our World in Data (2023): Per capita, national, historical: how do countries compare on CO2 metrics? https://ourworldindata.org/co2-emissions-metrics <br> Lizenz: CC BY http://creativecommons.org/licenses/by/4.0 |} | 1 |
| 11:31, 12. Aug. 2024 | GHG emission 2021 lg.jpg (Datei) |  |
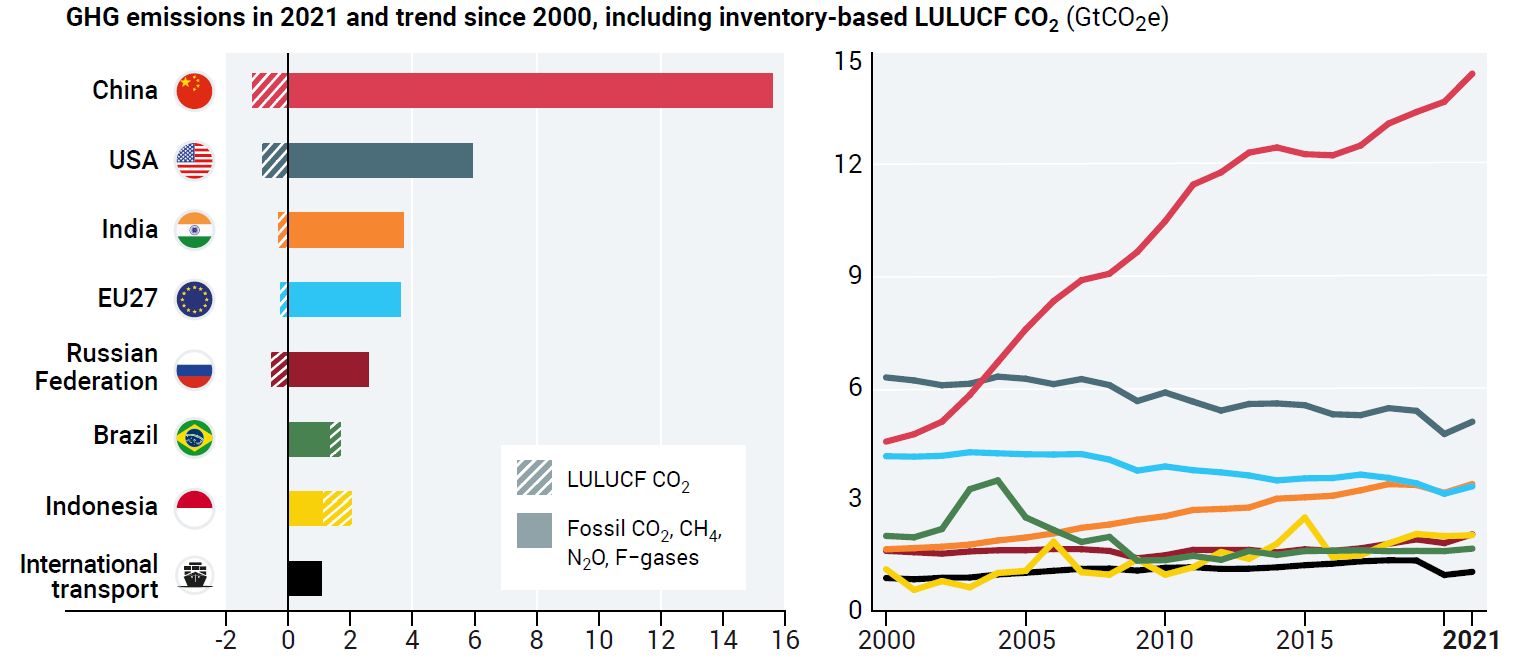
98 KB | Dieter Kasang (Diskussion | Beiträge) | == Beschreibung == Treibhausgasemissionen 2021 und der Trend seit 2000 nach Staaten in GtCO2-Äquivalente (mit Landnutzung) ==Lizenzhinweis== {| style="border:1px solid #8888aa; background-color:#f7f8ff;padding:5px;font-size:95%;" | Quelle: UNEP, United Nations Environment Programme (2023): Emissions Gap Report 2023: Broken Record – Temperatures hit new highs, yet world fails to cut emissions (again). Nairobi<br> Lizenz: This publication may be reproduced in whole or in part and in any form for… | 1 |
| 16:03, 11. Aug. 2024 | CO2 Emissionen Senken 2023.jpg (Datei) |  |
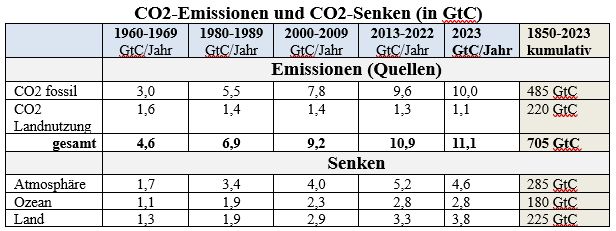
39 KB | Dieter Kasang (Diskussion | Beiträge) | == Beschreibung == CO2-Emissionen und CO2-Senken in GtC ==Lizenzhinweis== {| style="border:1px solid #8888aa; background-color:#f7f8ff;padding:5px;font-size:95%;" | Quelle: Friedlingstein, P., M. O'Sullivan, M.W. Jones et al. (2023): Global Carbon Budget 2023, Earth Syst. Sci. Data, 15, 5301–5369, Table 1<br> Lizenz: CC BY |} | 1 |
| 15:45, 11. Aug. 2024 | CO2 Einheiten.jpg (Datei) | 25 KB | Dieter Kasang (Diskussion | Beiträge) | == Beschreibung == Einheiten und Umwandlungsfaktoren von Kohlenstoffverbindungen ==Lizenzhinweis== {| style="border:1px solid #8888aa; background-color:#f7f8ff;padding:5px;font-size:95%;" | Quelle: Friedlingstein, P., M. O'Sullivan, M.W. Jones et al. (2023): Global Carbon Budget 2023, Earth Syst. Sci. Data, 15, 5301–5369, https://doi.org/10.5194/essd-15-5301-2023 , Table 1<br> Lizenz: CC BY |} | 1 | |
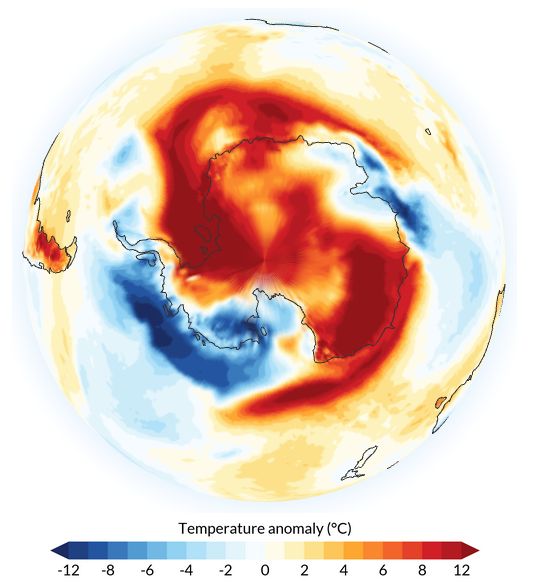
| 14:29, 11. Aug. 2024 | Antarctic warming22.7.2024.jpg (Datei) |  |
38 KB | Dieter Kasang (Diskussion | Beiträge) | == Beschreibung == Lufttemperatur am 22.7.2024 über der Antarktis als Abweichung vom Mittel 1991-2020, in °C nach ERA5-Daten. ==Lizenzhinweis== {| style="border:1px solid #8888aa; background-color:#f7f8ff;padding:5px;font-size:95%;" | Quelle: C3S/ECMWF, Climate Pulse (2024): Arctic Siberia’s unusual warm spell continues, https://pulse.climate.copernicus.eu/<br> Lizenz: [https://climate.copernicus.eu/data-protection-and-privacy-statement Reproduction of the publicly available content of this… | 1 |
| 18:57, 10. Aug. 2024 | Arctic temp 1900-2023.jpg (Datei) |  |
79 KB | Dieter Kasang (Diskussion | Beiträge) | == Beschreibung == Änderung der mittleren Jahrestemperatur in der Arktis 1900-2021 ==Lizenzhinweis== {| style="border:1px solid #8888aa; background-color:#f7f8ff;padding:5px;font-size:95%;" | Quelle: Rohde, R. (2022): [http://berkeleyearth.org/global-temperature-report-for-2021/ Global Temperature Report for 2021] <br /> Lizenz: [https://creativecommons.org/licenses/by/4.0/ CC BY 4.0] |} | 1 |
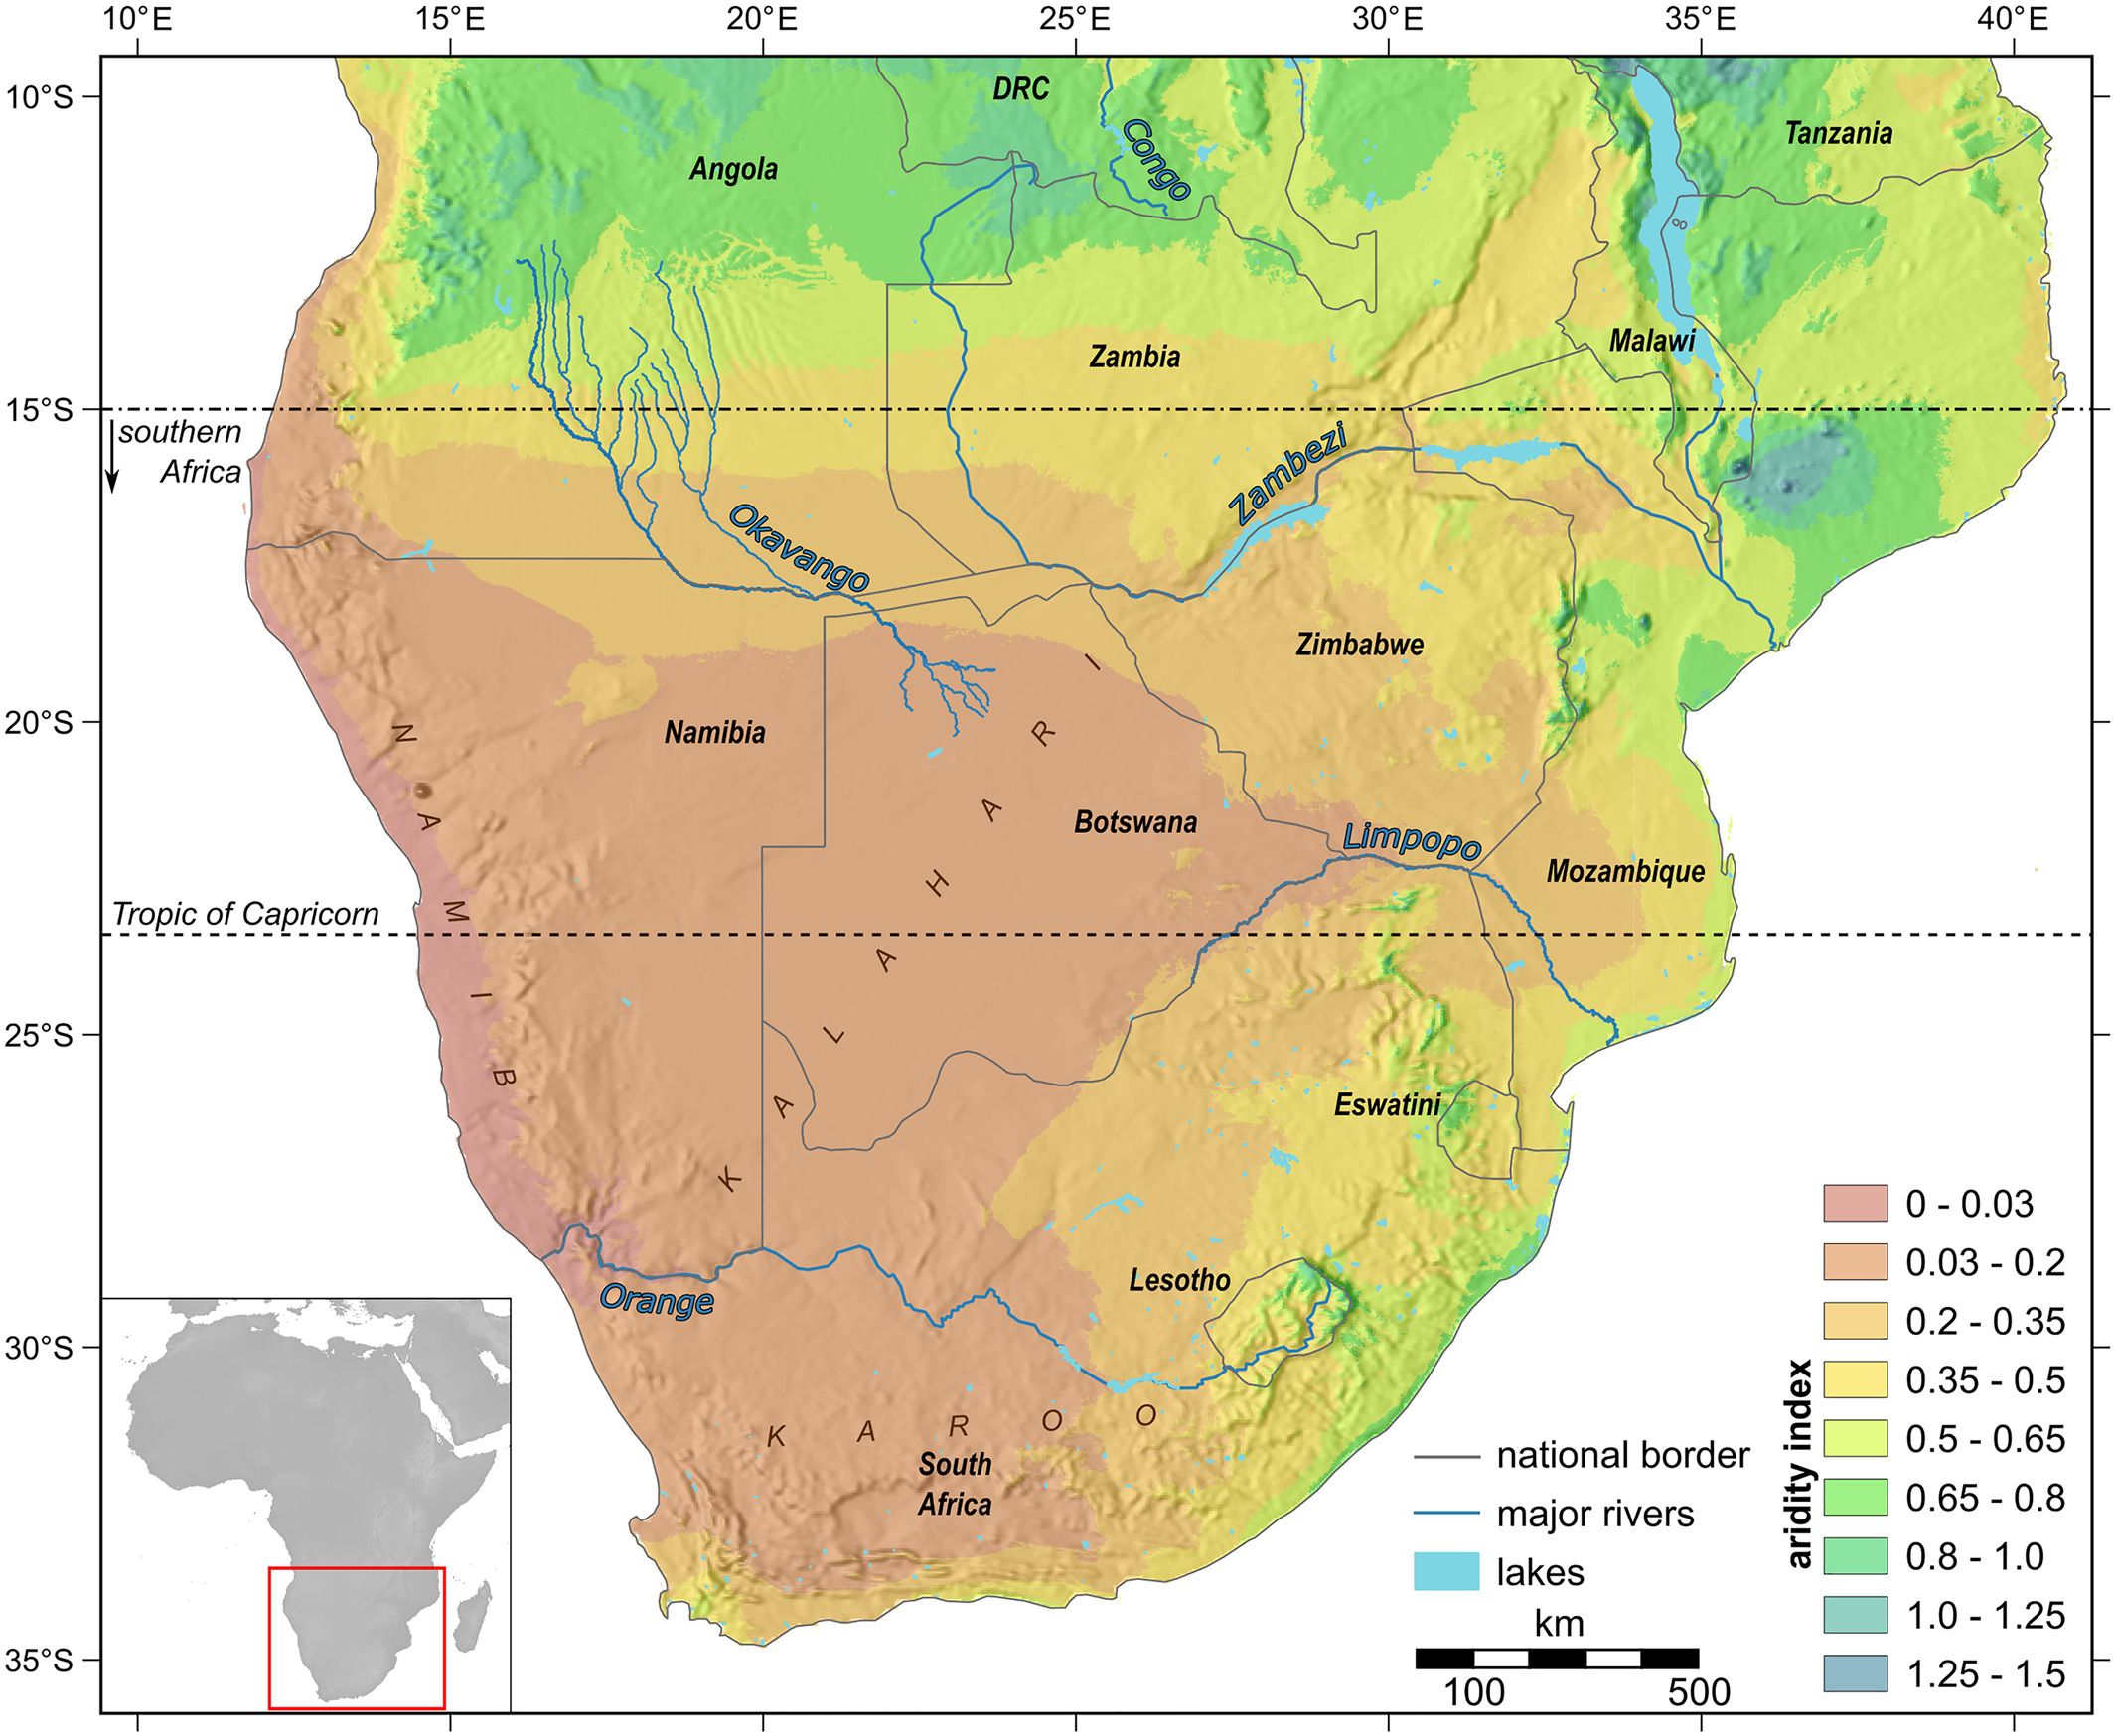
| 20:05, 8. Aug. 2024 | S. Africa aridity index.jpg (Datei) |  |
364 KB | Dieter Kasang (Diskussion | Beiträge) | == Beschreibung == Ariditäts-Index für das Südliche Afrika ==Lizenzhinweis== {| style="border:1px solid #8888aa; background-color:#f7f8ff;padding:5px;font-size:95%;" | Quelle: Geppert, M., K. Hartmann, I. Kirchner et al. (2022): Precipitation over southern Africa: Moisture sources and isotopic composition. Journal of Geophysical Research: Atmospheres, 127(21), e2022JD037005. https://doi.org/10.1029/2022jd037005<br /> Lizenz: [http://creativecommons.org/licenses/by/4.0/ CC BY] |} | 1 |
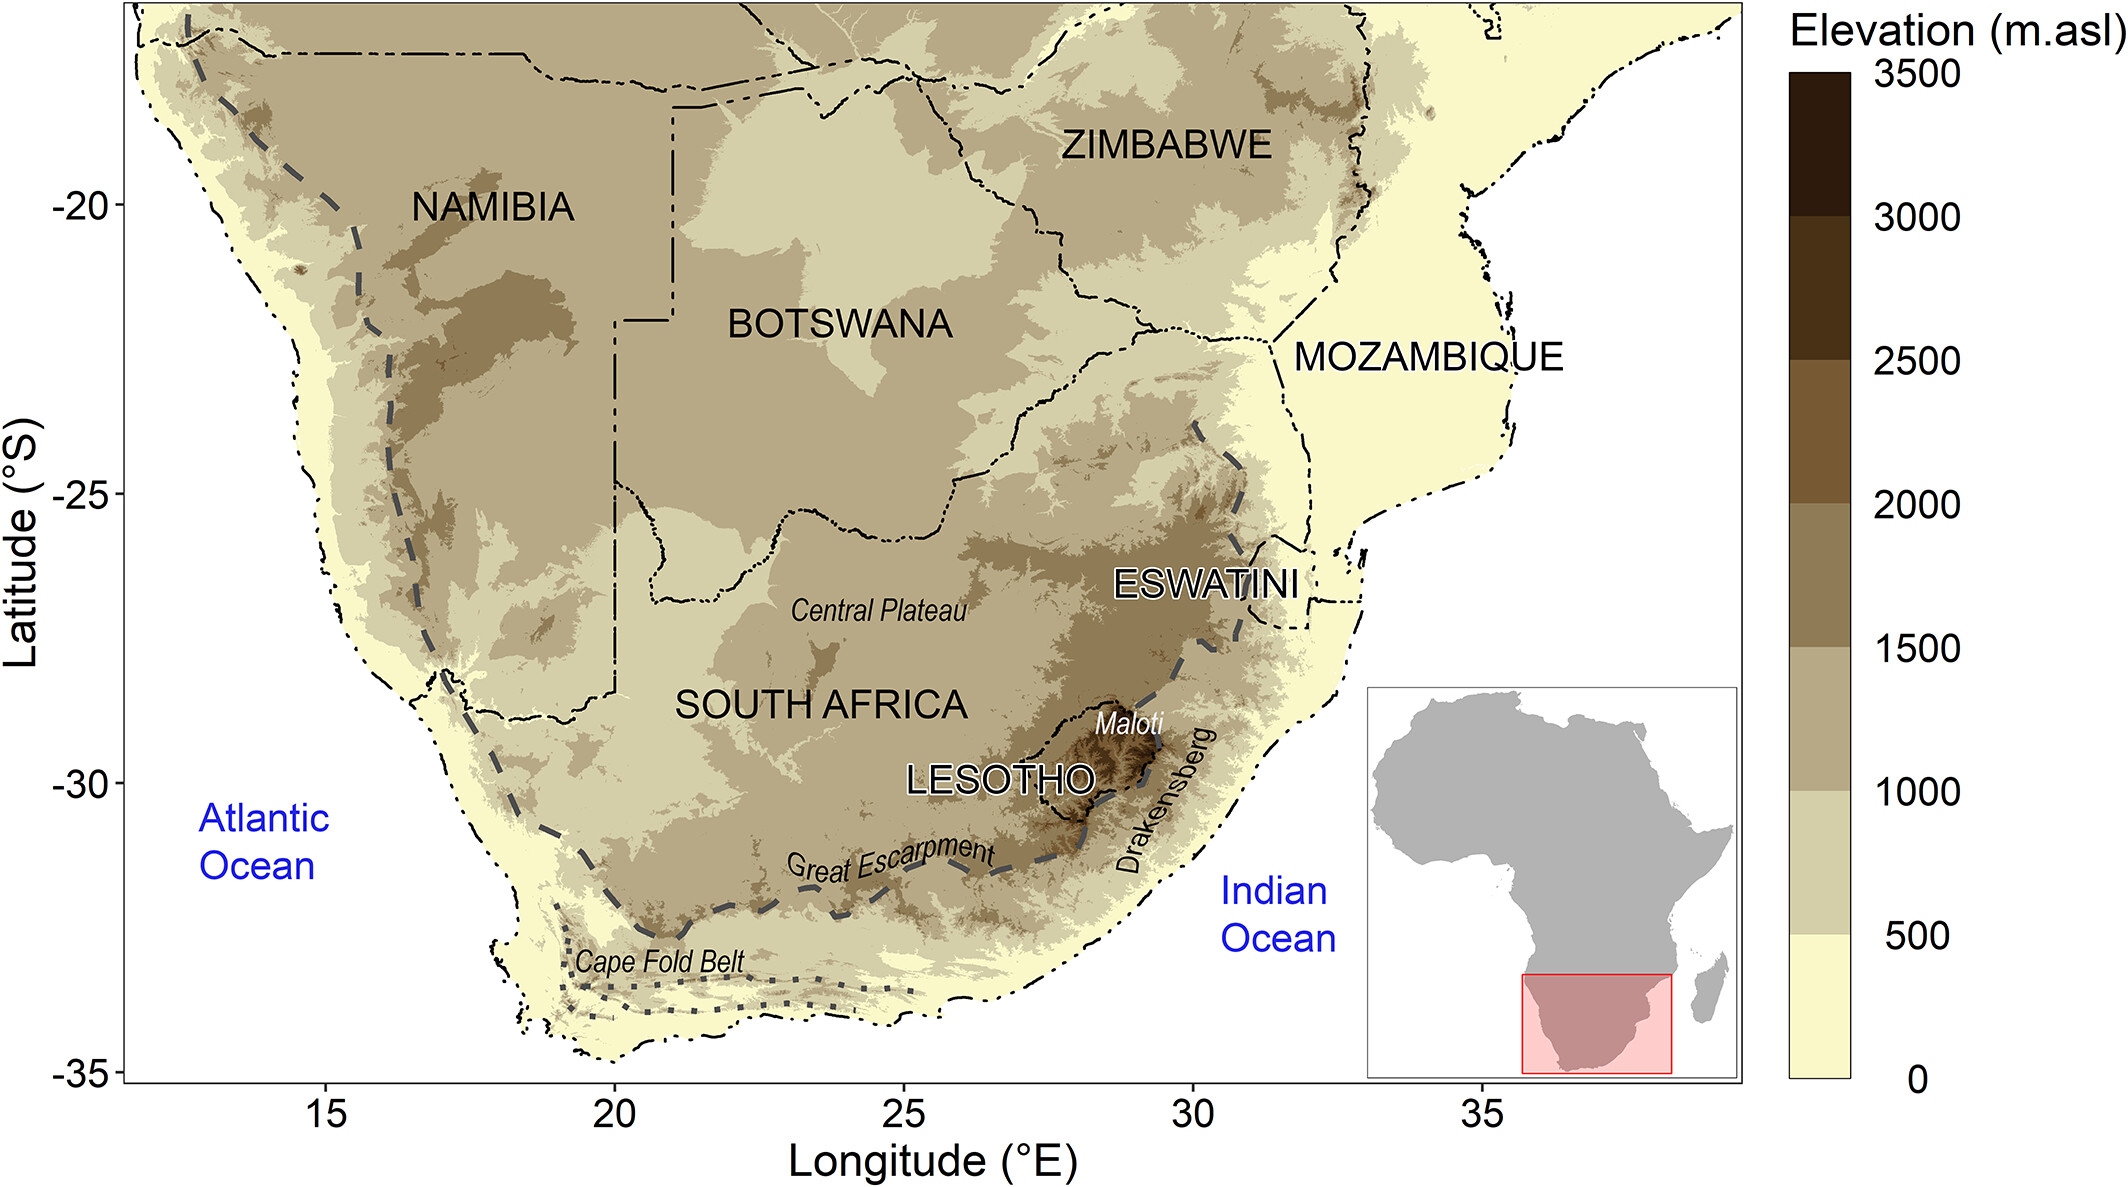
| 19:56, 8. Aug. 2024 | Southern Africa Topography sm.jpg (Datei) |  |
196 KB | Dieter Kasang (Diskussion | Beiträge) | == Beschreibung == Topographische Karte des Südlichen Afrika ==Lizenzhinweis== {| style="border:1px solid #8888aa; background-color:#f7f8ff;padding:5px;font-size:95%;" | Quelle: Xulu, N.G., H. Chikoore, M.-J.M. Bopape & N.S. Nethengwe (2020): Climatology of the Mascarene High and Its Influence on Weather and Climate over Southern Africa. Climate 8, 86. https://doi.org/10.3390/cli8070086<br /> Lizenz: CC BY http://creativecommons.org/licenses/by/4.0/ |} | 1 |
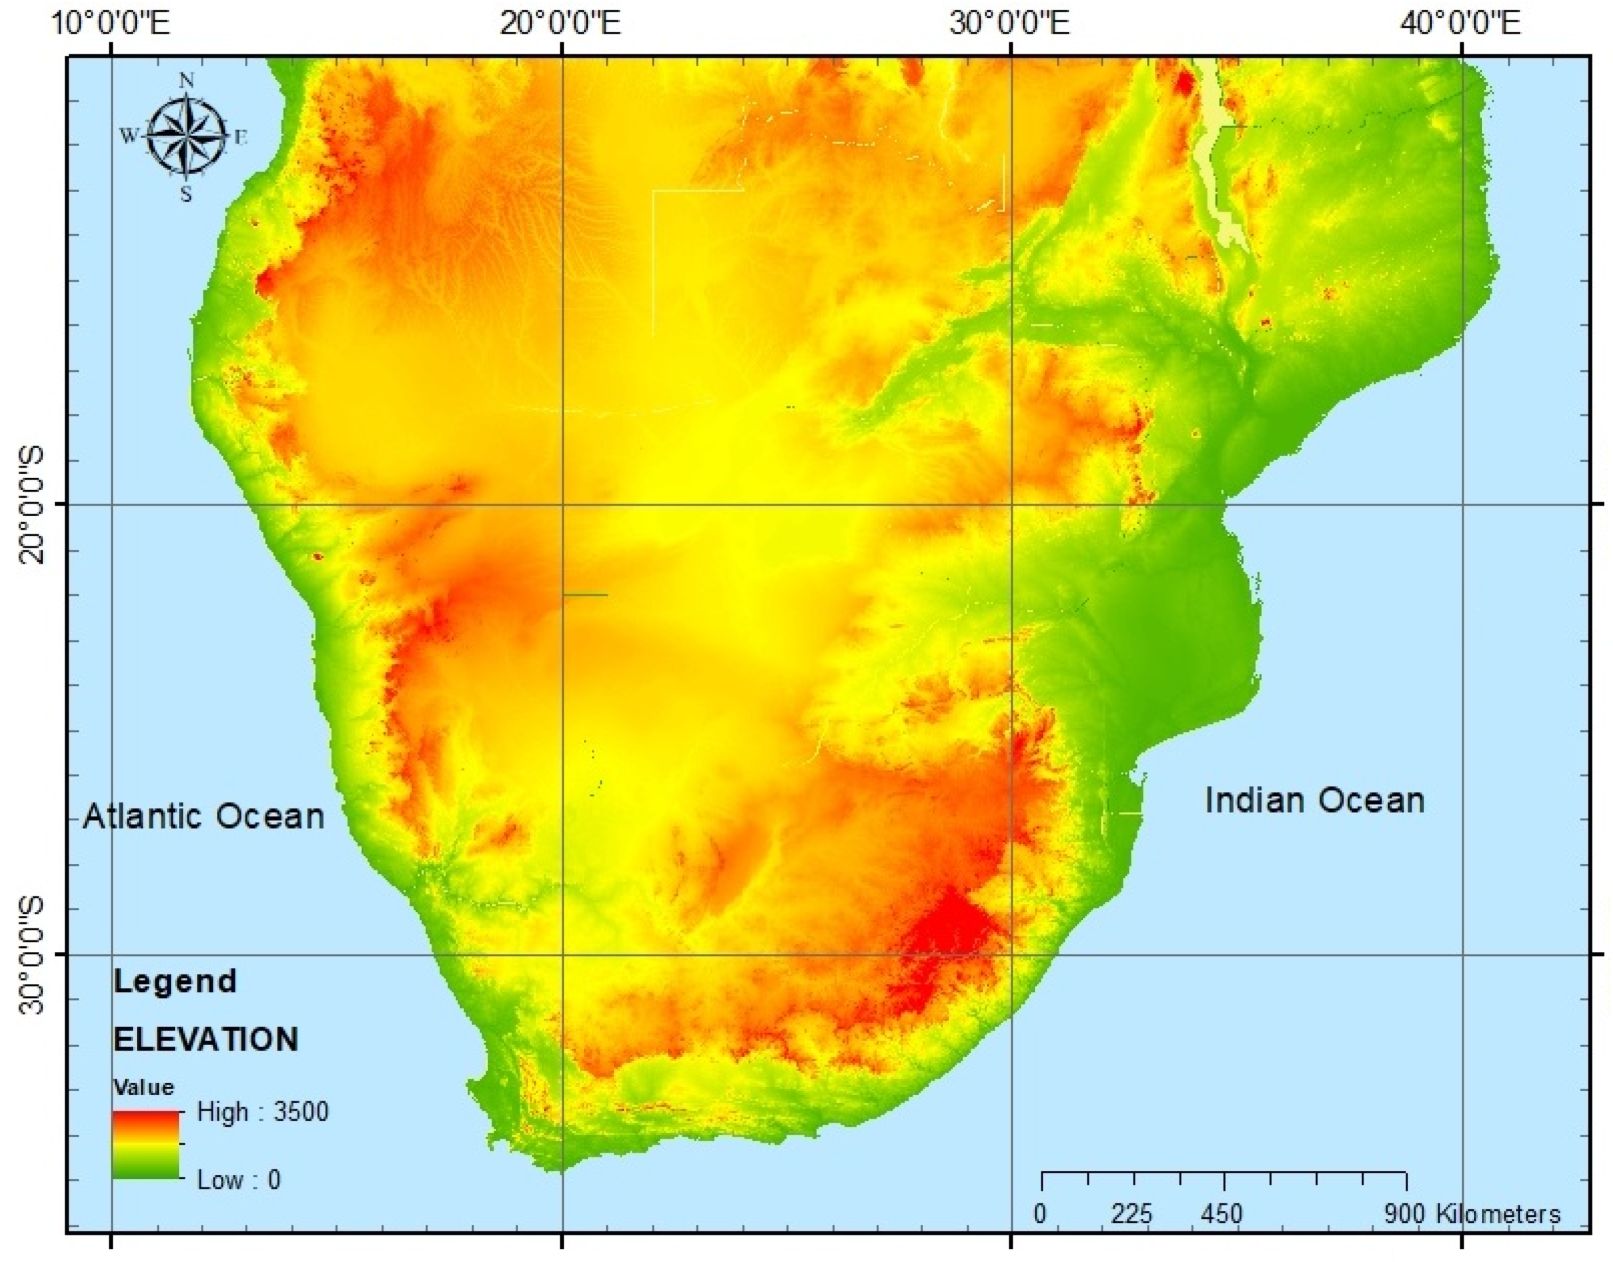
| 19:49, 8. Aug. 2024 | Elevation southern Africa.jpg (Datei) |  |
347 KB | Dieter Kasang (Diskussion | Beiträge) | == Beschreibung == Topographische Karte des Südlichen Afrika ==Lizenzhinweis== {| style="border:1px solid #8888aa; background-color:#f7f8ff;padding:5px;font-size:95%;" | Quelle: Roffe, S.R., A.J. van der Walt, J.M. Fitchett (2023): Spatiotemporal characteristics of human thermal comfort across southern Africa: An analysis of the Universal Thermal Climate Index for 1971–2021, International Journal of Climatology 43, 6, https://doi.org/10.1002/joc.8009<br /> Lizenz: CC BY NC http://creativecommon… | 1 |
| 10:06, 8. Aug. 2024 | Southern Africa prec annual.jpg (Datei) |  |
81 KB | Dieter Kasang (Diskussion | Beiträge) | 2 | |
| 15:30, 7. Aug. 2024 | Hottest day per year 1974-2024.jpg (Datei) |  |
52 KB | Dieter Kasang (Diskussion | Beiträge) | == Beschreibung == Die heißesten Tage im Jahr in den letzten 50 Jahren (1974-2024) ==Lizenzhinweis== {| style="border:1px solid #8888aa; background-color:#f7f8ff;padding:5px;font-size:95%;" | Quelle: Copernicus Climate Change Service (2024): [https://climate.copernicus.eu/new-record-daily-global-average-temperature-reached-july-2024 New record daily global average temperature reached in July 2024]<br> Lizenz: [https://climate.copernicus.eu/data-protection-and-privacy-statement Reproduction o… | 1 |
| 16:08, 5. Aug. 2024 | ICON global ocean.jpg (Datei) |  |
199 KB | Dieter Kasang (Diskussion | Beiträge) | Links: globales ICON-Modell mit einheitlichem Gitter in der Atmosphäre und im Ozean, rechts: ICON mit einem verfeinerten Ozean-Gitter. ==Lizenzhinweis== {| style="border:1px solid #8888aa; background-color:#f7f8ff;padding:5px;font-size:95%;" | Quelle: Hohenegger, C., P. Korn, L. Linardakis et al. (2023): ICON-Sapphire: simulating the components of the Earth system and their interactions at kilometer and subkilometer scales, Geosci. Model Dev., 16, 779–811, https://doi.org/10.5194/gmd-16-779-202… | 1 |
| 09:53, 5. Aug. 2024 | Global-temp-1940-2024.jpg (Datei) |  |
110 KB | Dieter Kasang (Diskussion | Beiträge) | 3 | |
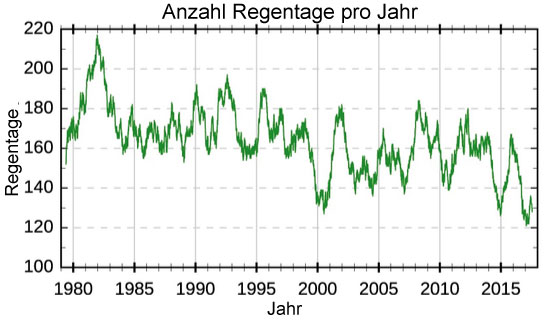
| 10:37, 3. Aug. 2024 | Regentage-Kap-Region.jpg (Datei) |  |
37 KB | Dieter Kasang (Diskussion | Beiträge) | == Beschreibung == Anzahl der Regentage pro Jahr 1979-2017 in der Region um Kapstadt ==Lizenzhinweis== {| style="border:1px solid #8888aa; background-color:#f7f8ff;padding:5px;font-size:95%;" | Quelle: Burls, N.J., R.C. Blamey, B.A. Cash et al. (2029): The Cape Town “Day Zero” drought and Hadley cell expansion. npj Clim Atmos Sci 2, 27. https://doi.org/10.1038/s41612-019-0084-6 <br /> Lizenz: [http://creativecommons.org/licenses/by/4.0/ CC BY] |} | 1 |
| 10:24, 3. Aug. 2024 | Klimafaktoren-südl-Afrika.jpg (Datei) |  |
96 KB | Dieter Kasang (Diskussion | Beiträge) | == Beschreibung == Wichtige Klimafaktoren für das Südliche Afrika. WRZ: Winterniederschläge, SRZ: Sommerniederschläge, YRZ: Niederschläge während des ganzen Jahres, AL: Angola-Hitzetief, BH: Botswana-Hoch, NEM: Ostafrikanischer Monsun. ==Lizenzhinweis== {| style="border:1px solid #8888aa; background-color:#f7f8ff;padding:5px;font-size:95%;" | Quelle: Geppert, M., K. Hartmann, I. Kirchner et al. (2022): Precipitation over southern Africa: Moisture sources and isotopic composition. Journal of Geo… | 1 |
| 10:37, 2. Aug. 2024 | IOC neg.png (Datei) |  |
388 KB | Dieter Kasang (Diskussion | Beiträge) | == Beschreibung == Negative Phase des Indian Ocean Dipole (IOD) ==Lizenzhinweis== {| style="border:1px solid #8888aa; background-color:#f7f8ff;padding:5px;font-size:95%;" | Quelle: Johnson, N., NOAA Climate.gov (2020): [https://www.climate.gov/news-features/blogs/enso/meet-enso%E2%80%99s-neighbor-indian-ocean-dipole Meet ENSO’s neighbor, the Indian Ocean Dipole]<br /> Lizenz: public domain |} | 1 |
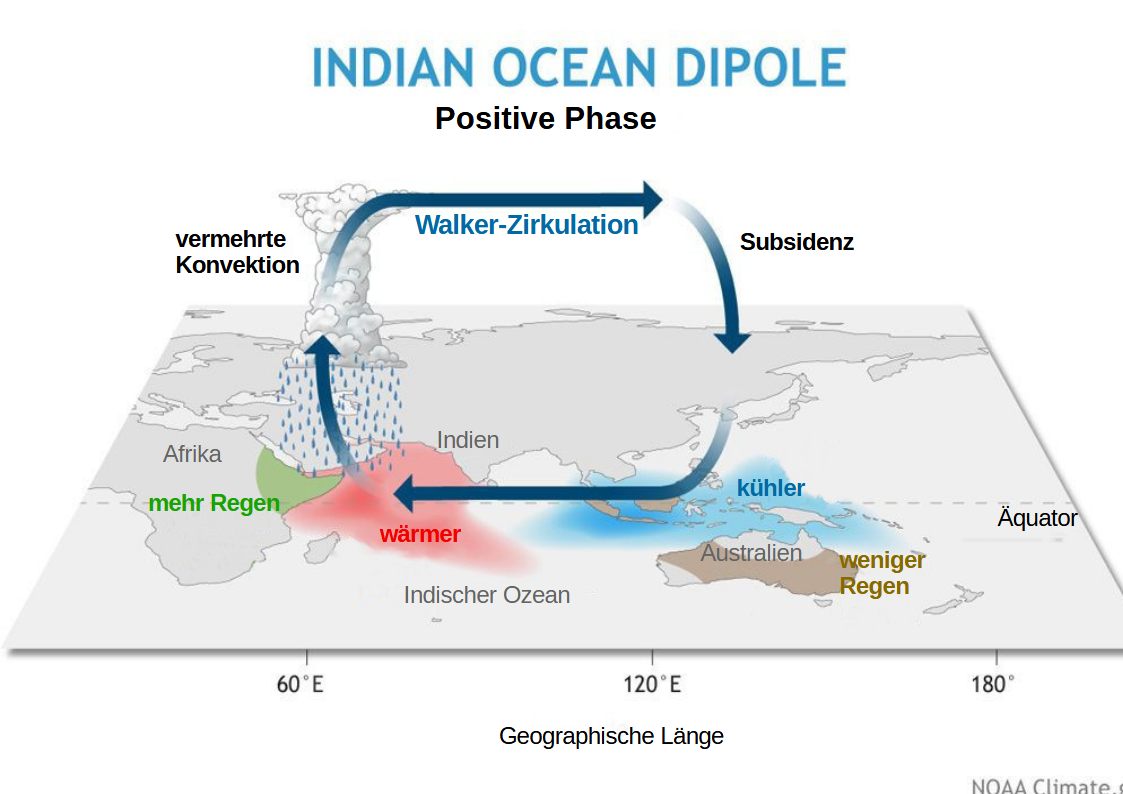
| 10:35, 2. Aug. 2024 | IOC pos.png (Datei) |  |
373 KB | Dieter Kasang (Diskussion | Beiträge) | == Beschreibung == Positive Phase des Indian Ocean Dipole (IOD) ==Lizenzhinweis== {| style="border:1px solid #8888aa; background-color:#f7f8ff;padding:5px;font-size:95%;" | Quelle: Johnson, N., NOAA Climate.gov (2020): Meet ENSO’s neighbor, the Indian Ocean Dipole, https://www.climate.gov/news-features/blogs/enso/meet-enso%E2%80%99s-neighbor-indian-ocean-dipole<br /> Lizenz: public domain |} | 1 |
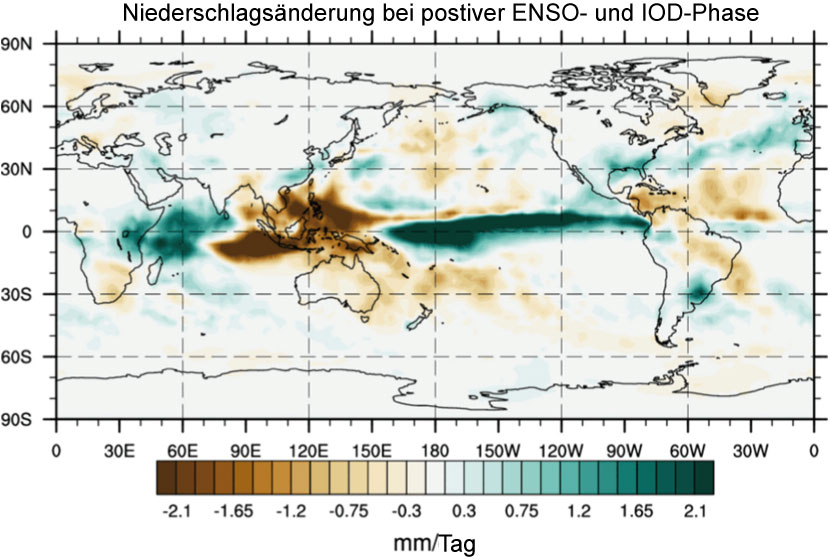
| 12:49, 24. Jul. 2024 | Prec-positive-ENSO-IOD.jpg (Datei) |  |
93 KB | Dieter Kasang (Diskussion | Beiträge) | == Beschreibung == Änderung der Niederschläge in mm/Tag im Vergleich zum Mittel 1991-2020 in Jahren mit positiver ENSO- und IOD-Phase während der kleinen Regenzeit (Okt.-Dez.) in Ostafrika. ==Lizenzhinweis== {| style="border:1px solid #8888aa; background-color:#f7f8ff;padding:5px;font-size:95%;" | Quelle: Roy, I., & A. Troccoli (2024): [https://doi.org/10.1016/j.scitotenv.2023.169615 Identifying important drivers of East African October to December rainfall season]. Sci Total Environ 914:169615… | 1 |
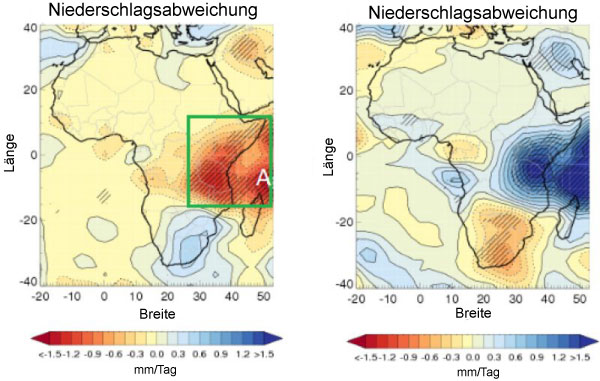
| 19:18, 23. Jul. 2024 | Prec-anomaly-OND-E-Africa.jpg (Datei) |  |
58 KB | Dieter Kasang (Diskussion | Beiträge) | == Beschreibung == Niederschlagsabweichungen vom Mittel bei negativen (a) und positiven (b) ENSO- und IOD-Phasen in der kleinen Regenzeit. Die Region A markiert das Gebiet mit der stärksten Abweichung. ==Lizenzhinweis== {| style="border:1px solid #8888aa; background-color:#f7f8ff;padding:5px;font-size:95%;" | Quelle: Roy, I., & A. Troccoli (2024): Identifying important drivers of East African October to December rainfall season. Sci Total Environ 914:169615, https://doi.org/10.1016/j.scitotenv.… | 1 |
| 17:47, 23. Jul. 2024 | Rain-Kenia-seasons-1975-201.jpg (Datei) |  |
77 KB | Dieter Kasang (Diskussion | Beiträge) | == Beschreibung == Änderung der saisonalen Niederschläge zwischen 1975 und 2017 in Kenia ==Lizenzhinweis== {| style="border:1px solid #8888aa; background-color:#f7f8ff;padding:5px;font-size:95%;" | Quelle: Lawrence, T.J., J.M. Vilbig, G. Kangogo et al. (2023): Shifting climate zones and expanding tropical and arid climate regions across Kenya (1980–2020). Reg Environ Change 23, 59 https://doi.org/10.1007/s10113-023-02055-w<br /> Lizenz: CC BY |} | 1 |
| 16:59, 23. Jul. 2024 | Ostafrika Regen1985-2018.jpg (Datei) |  |
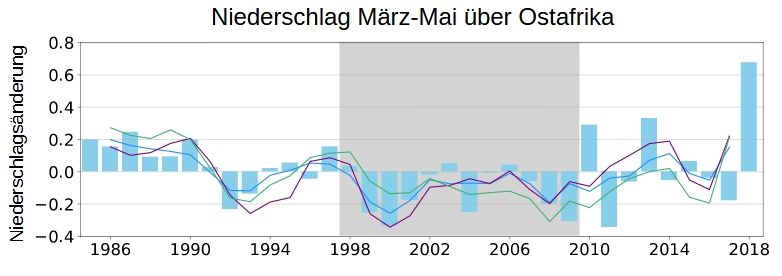
31 KB | Dieter Kasang (Diskussion | Beiträge) | == Beschreibung == Änderung des Niederschlags in der langen Regenzeit März-Mai in Ostafrika 1985-2018 nach verschiedenen Datensätzen als Abweichung zum Mittel 1986-1997. Der graue Bereich zeigt die besonders trockene Periode 1998-2009 ==Lizenzhinweis== {| style="border:1px solid #8888aa; background-color:#f7f8ff;padding:5px;font-size:95%;" | Quelle: Wainwright, C.M., J.H. Marsham, R.J. Keane et al. (2019): Eastern African Paradox’ rainfall decline due to shorter not less intense Long Rains. npj… | 1 |
| 15:04, 23. Jul. 2024 | Rainfall Rwanda month 1981-2020.jpg (Datei) |  |
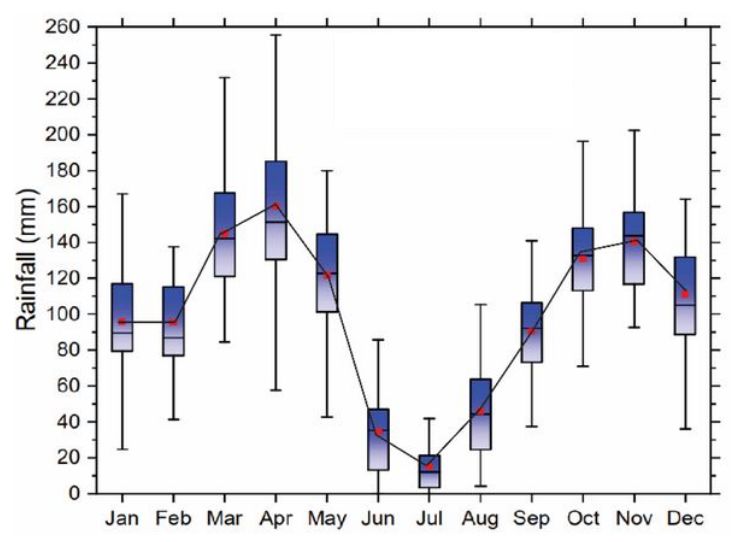
36 KB | Dieter Kasang (Diskussion | Beiträge) | == Beschreibung == Monatliche Niederschläge in Ruanda gemittelt über den Zeitraum 1981-2020. Die Boxen geben die 25% bis 75% häufigsten Werte an, die senkrechten Balken zeigen die höchsten und niedrigsten 25 Prozent der Werte. ==Lizenzhinweis== {| style="border:1px solid #8888aa; background-color:#f7f8ff;padding:5px;font-size:95%;" | Quelle: Uwimbabazi, J., Y. Jing, V. Iyakaremye et al. 82022): Observed Changes in Meteorological Drought Events during 1981–2020 over Rwanda, East Africa, Sustaina… | 1 |
| 14:55, 23. Jul. 2024 | Kenia temp 1975-2019.jpg (Datei) |  |
18 KB | Dieter Kasang (Diskussion | Beiträge) | == Beschreibung == Änderung der Jahresmitteltemperatur zwischen 1975 und 2019 in Kenia ==Lizenzhinweis== {| style="border:1px solid #8888aa; background-color:#f7f8ff;padding:5px;font-size:95%;" | Quelle: Lawrence, T.J., J.M. Vilbig, G. Kangogo et al. (2023): Shifting climate zones and expanding tropical and arid climate regions across Kenya (1980–2020). Reg Environ Change 23, 59 https://doi.org/10.1007/s10113-023-02055-w<br /> Lizenz: [http://creativecommons.org/licenses/by/4.0/ CC BY] |} | 1 |
| 14:49, 23. Jul. 2024 | E-Africa temp max min.jpg (Datei) |  |
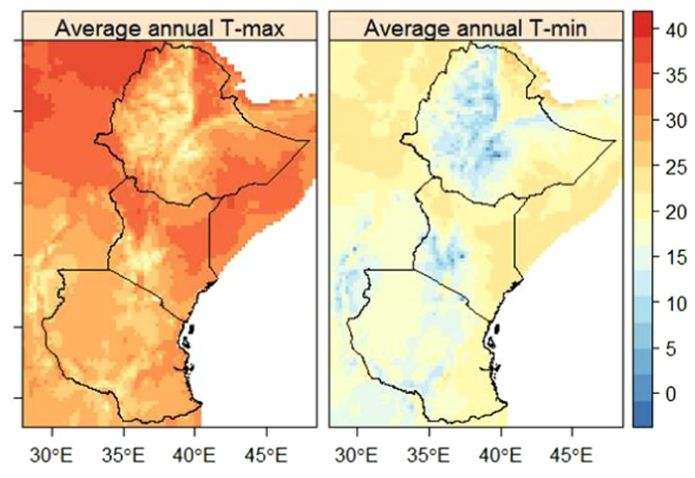
48 KB | Dieter Kasang (Diskussion | Beiträge) | == Beschreibung == Topographische Karte Ostafrikas ==Lizenzhinweis== {| style="border:1px solid #8888aa; background-color:#f7f8ff;padding:5px;font-size:95%;" | Quelle: Gebrechorkos, S.H., S. Hülsmann & C. Bernhofer (2019): Long-term trends in rainfall and temperature using high-resolution climate datasets in East Africa. Sci Rep 9, 11376 (2019). https://doi.org/10.1038/s41598-019-47933-8<br /> Lizenz: CC BY http://creativecommons.org/licenses/by/4.0/ |} | 1 |
| 13:07, 16. Jul. 2024 | Prec-highland-Ethiopia1970-.jpg (Datei) |  |
60 KB | Dieter Kasang (Diskussion | Beiträge) | == Beschreibung == Niederschlagsänderung 1970-2050 im Hochland von Äthiopien nach CMIP5 und CMIP6-Modellsimulationen. Verändert, übersetzt. ==Lizenzhinweis== {| style="border:1px solid #8888aa; background-color:#f7f8ff;padding:5px;font-size:95%;" | Quelle: Choi, Y.W., D. Campbell & E. Eltahir (2023): Near-term regional climate change in East Africa. Clim Dyn 61, 961–978 (2023). https://doi.org/10.1007/s00382-022-06591-9 <br /> Lizenz: CC BY http://creativecommons.org/licenses/by/4.0/ |} | 1 |
| 15:48, 15. Jul. 2024 | Flooding Kampala 2023.jpg (Datei) |  |
273 KB | Dieter Kasang (Diskussion | Beiträge) | == Beschreibung == Hochwasser in einer informellen Siedlung in Kampala, Uganda, Oktober 2018 ==Lizenzhinweis== {| style="border:1px solid #8888aa; background-color:#f7f8ff;padding:5px;font-size:95%;" | Quelle: Wikipedia, Autor: Jameswasswa (2023): A flooding in Kampala around Bwaise in 2023, https://en.wikipedia.org/wiki/2020_East_Africa_floods<br /> Lizenz: Lizenz: CC BY SA, https://creativecommons.org/licenses/by-sa/2.0/deed.en |} | 1 |
| 15:41, 15. Jul. 2024 | E-Africa OND rainfall 2019.jpg (Datei) |  |
62 KB | Dieter Kasang (Diskussion | Beiträge) | == Beschreibung == Starkniederschläge in der kurzen Regenzeit (Oktober-Dezember) 2019 in Ostafrika gegenüber dem Mittel der Niederschläge 1985-2019 ==Lizenzhinweis== {| style="border:1px solid #8888aa; background-color:#f7f8ff;padding:5px;font-size:95%;" | Quelle: Wainwright, C. M., D.L. Finney, M. Kilavi et al. (2021): Extreme Rainfall in East Africa, October 2019–January 2020 and Context under Future Climate Change, Weather, 76, 26–31, https://doi.org/10.1002/wea.3824 <br /> Lizenz: CC BY ht… | 1 |
| 15:26, 15. Jul. 2024 | E-Africa-rainfall-2013-2022.jpg (Datei) |  |
59 KB | Dieter Kasang (Diskussion | Beiträge) | == Beschreibung == Regionale Verteilung der 5% stärksten Niederschläge in Ostafrika 2013-2022 ==Lizenzhinweis== {| style="border:1px solid #8888aa; background-color:#f7f8ff;padding:5px;font-size:95%;" | Quelle: Taye, M.T., & E. Dyer (2024): Hydrologic Extremes in a Changing Climate: a Review of Extremes in East Africa. Curr Clim Change Rep 10, 1–11. https://doi.org/10.1007/s40641-024-00193-9<br /> Lizenz: CC BY http://creativecommons.org/licenses/by/4.0/ |} | 1 |
| 15:05, 15. Jul. 2024 | Abb.1 Nairobi rain temp.jpg (Datei) |  |
36 KB | Dieter Kasang (Diskussion | Beiträge) | == Beschreibung == Mittlere monatliche Niederschläge, Minimal- und Maximal-Temperaturen; Daten jeweils gemittelt über die 30-Jahresperiode 1971-2000 ==Lizenzhinweis== {| style="border:1px solid #8888aa; background-color:#f7f8ff;padding:5px;font-size:95%;" | Quelle: World Meteorological Organization, http://worldweather.wmo.int/en/city.html?cityId=251 <br /> Lizenz: Reproduction of short excerpts of WMO materials, figures and photographs on this website is authorized free of charge and without… | 1 |
| 16:57, 10. Jul. 2024 | IOD1982-2019.jpg (Datei) |  |
52 KB | Dieter Kasang (Diskussion | Beiträge) | == Beschreibung == Positiver Indian Ocean Dipole {| style="border:1px solid #8888aa; background-color:#f7f8ff;padding:5px;font-size:95%;" | Quelle: Wainwright, C. M., D.L. Finney, M. Kilavi et al. (2021): [https://doi.org/10.1002/wea.3824 Extreme Rainfall in East Africa, October 2019–January 2020 and Context under Future Climate Change], Weather, 76, 26–31 <br> Lizenz: [http://creativecommons.org/licenses/by/4.0/ CC BY] | |} | 1 |
| 16:53, 10. Jul. 2024 | Positive IOP.jpg (Datei) |  |
70 KB | Dieter Kasang (Diskussion | Beiträge) | Positiver Indian Ocean Dipole {| style="border:1px solid #8888aa; background-color:#f7f8ff;padding:5px;font-size:95%;" | Quelle: Wainwright, C. M., D.L. Finney, M. Kilavi et al. (2021): Extreme Rainfall in East Africa, October 2019–January 2020 and Context under Future Climate Change, Weather, 76, 26–31, https://doi.org/10.1002/wea.3824 Lizenz: CC BY http://creativecommons.org/licenses/by/4.0/ | |} | 1 |
| 07:58, 10. Jul. 2024 | Größter-Waldbrand-2023-Kana.jpg (Datei) |  |
197 KB | Dieter Kasang (Diskussion | Beiträge) | == Beschreibung == Das größte Feuer der kanadischen Waldbrände, in Quebec ==Lizenzhinweis== {| style="border:1px solid #8888aa; background-color:#f7f8ff;padding:5px;font-size:95%;" |Quelle: NASA Earth Observatory (2023): Tracking Canada’s Extreme 2023 Fire Season, https://earthobservatory.nasa.gov/images/151985/tracking-canadas-extreme-2023-fire-season <br> Lizenz: public domain |} | 1 |
| 07:51, 10. Jul. 2024 | Canada fire smoke Europe.jpg (Datei) |  |
84 KB | Dieter Kasang (Diskussion | Beiträge) | == Beschreibung == Rauch der kanadischen Waldbrände 2023 erreicht die Westküste der Iberischen Halbinsel. ==Lizenzhinweis== {| style="border:1px solid #8888aa; background-color:#f7f8ff;padding:5px;font-size:95%;" |Quelle: NASA Earth Observatory (2023): Canadian Smoke Reaches Europe, https://earthobservatory.nasa.gov/images/151507/canadian-smoke-reaches-europe <br> Lizenz: public domain |} | 1 |
| 07:49, 10. Jul. 2024 | Canada fire smoke Atlantic.jpg (Datei) |  |
78 KB | Dieter Kasang (Diskussion | Beiträge) | == Beschreibung == Rauch der kanadischen Waldbrände 2023 breitet sich über den Nordatlantik aus. ==Lizenzhinweis== {| style="border:1px solid #8888aa; background-color:#f7f8ff;padding:5px;font-size:95%;" |Quelle: NASA Earth Observatory (2023): Canadian Smoke Reaches Europe, https://earthobservatory.nasa.gov/images/151507/canadian-smoke-reaches-europe Lizenz: public domain |} | 1 |
| 07:40, 10. Jul. 2024 | Canada wildfire area 1983-2023.jpg (Datei) |  |
130 KB | Dieter Kasang (Diskussion | Beiträge) | == Beschreibung == Fläche der Waldbrände 1983 bis Oktober 2023 in Kanada in Mio. ha bzw. acres ==Lizenzhinweis== {| style="border:1px solid #8888aa; background-color:#f7f8ff;padding:5px;font-size:95%;" |Quelle: Human influence on climate led to several major weather extremes in 2016, https://www.climate.gov/news-features/understanding-climate/human-influence-climate-led-several-major-weather-extremes-2016 Lizenz: CC BY-ND, https://creativecommons.org/licenses/by-nd/2.0/ |} | 1 |
| 07:28, 10. Jul. 2024 | Arctic C-emissions 2003-2020.jpg (Datei) |  |
23 KB | Dieter Kasang (Diskussion | Beiträge) | == Beschreibung == Kohlenstoffemissionen durch Waldbrände in der Arktis 2003-2020 ==Lizenzhinweis== {| style="border:1px solid #8888aa; background-color:#f7f8ff;padding:5px;font-size:95%;" |Quelle: Copernicus Atmosphere Monitoring Service (2020): Another active year for Arctic wildfires, https://atmosphere.copernicus.eu/another-active-year-arctic-wildfires </br> Lizenz: Lizenz: Reproduction of the publically available content of this website is authorised, provided the source is acknowledged,… | 1 |
| 08:52, 2. Jul. 2024 | Jetstream-winter-stark-schwach.png (Datei) |  |
295 KB | Dieter Kasang (Diskussion | Beiträge) | Starker und schwacher Jetstream im Winter ==Lizenzhinweis== {| style="border:1px solid #8888aa; background-color:#f7f8ff;padding:5px;font-size:95%;" | Quelle: Jaiser, R. & J. Kandarr (2019): Wie beeinflusst der Klimawandel den Jetstream? Earth System Knowledge Platform [www.eskp.de], 6. doi:10.2312/eskp.010, https://www.eskp.de/klimawandel/wie-beeinflusst-der-klimawandel-den-jetstream-9351059/ Lizenz: CC BY |} | 1 |
| 11:57, 23. Jun. 2024 | Temperatur 2023.jpg (Datei) |  |
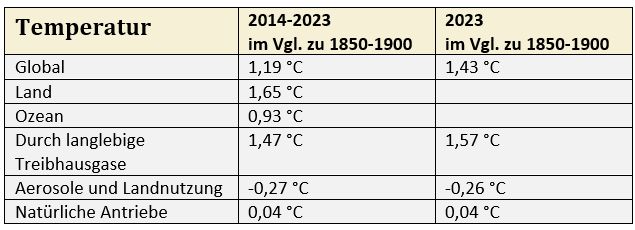
30 KB | Dieter Kasang (Diskussion | Beiträge) | == Beschreibung == Die globale Mitteltemperatur 2013-2023 und 2023 im Vergleich zur vorindustriellen Zeit 1850-1900 == Lizenzhinweis == {| style="border:1px solid #8888aa; background-color:#f7f8ff;padding:5px;font-size:95%;" | Quelle: Forster, P. M., C.J. Smith, T. Walsh et al. (2024): Indicators of Global Climate Change 2022: Annual update of large-scale indicators of the state of the climate system and the human influence, Earth System Science Data, https://doi.org/10.5194/essd-16-2625-2024 <… | 1 |
| 10:59, 23. Jun. 2024 | Temp global 1850-2023 WMO.jpg (Datei) |  |
64 KB | Dieter Kasang (Diskussion | Beiträge) | == Beschreibung == Globale Jahresmitteltemperatur 1850-2023, relativ zum Mittel 1850-1900 (vorindustriell) nach 6 Datensätzen. == Lizenzhinweis == {| style="border:1px solid #8888aa; background-color:#f7f8ff;padding:5px;font-size:95%;" | Quelle: World Meteorological Organization, WMO (2024): State of the global climate 2023, https://library.wmo.int/records/item/68835-state-of-the-global-climate-2023 Lizenz: Short extracts from WMO publications may be reproduced without authorization, provide… | 1 |
| 10:21, 23. Jun. 2024 | Strahlungsantrieb 1750-2023.jpg (Datei) |  |
34 KB | Dieter Kasang (Diskussion | Beiträge) | == Beschreibung == Anthropogener Strahlungsantrieb 1750 bis 2023 ==Lizenzhinweis== {| style="border:1px solid #8888aa; background-color:#f7f8ff;padding:5px;font-size:95%;" | Quelle: Forster, P. M., C.J. Smith, T. Walsh et al. (2024): Indicators of Global Climate Change 2023: Annual update of large-scale indicators of the state of the climate system and the human influence, Earth System Science Data, https://doi.org/10.5194/essd-16-2625-2024<br> Lizenz: [https://creativecommons.org/licenses/b… | 1 |
| 10:12, 23. Jun. 2024 | Radiative-forcing-1750-2023.jpg (Datei) |  |
101 KB | Dieter Kasang (Diskussion | Beiträge) | == Beschreibung == Historischer Strahlungsantrieb durch Treibhausgase, Landnutzung, Aerosole und die Sonne 1750 bis 2023 == Lizenzhinweis == {| style="border:1px solid #8888aa; background-color:#f7f8ff;padding:5px;font-size:95%;" | Quelle: Forster, P. M., C.J. Smith, T. Walsh et al. (2024): Indicators of Global Climate Change 2022: Annual update of large-scale indicators of the state of the climate system and the human influence, Earth System Science Data, https://doi.org/10.5194/essd-16-2625-… | 1 |
| 09:55, 23. Jun. 2024 | THG-Konzentration1984-2022dt.jpg (Datei) |  |
64 KB | Dieter Kasang (Diskussion | Beiträge) | == Beschreibung == Änderung der globalen Konzentration der drei wichtigsten Treibhausgase Kohlendioxid (CO<sub>2</sub>), Methan (CH<sub>4</sub>) und Distickstoffoxid (N<sub>2</sub>O) 1984 bis 2022. ==Lizenzhinweis== {| style="border:1px solid #8888aa; background-color:#f7f8ff;padding:5px;font-size:95%;" | Quelle: World Meteorological Organization, WMO (2023): [https://library.wmo.int/records/item/68835-state-of-the-global-climate-2023 State of the global climate 2023]<br> Lizenz: Short extra… | 1 |
| 09:26, 23. Jun. 2024 | THG-Emissionen 2000-2022.jpg (Datei) | 21 KB | Dieter Kasang (Diskussion | Beiträge) | == Beschreibung == Mittlere Treibhausgasemissionen 2000-2009, 2013-2022 und 2022 in Gt CO<sub>2</sub>-Äquivalent ==Lizenzhinweis== {| style="border:1px solid #8888aa; background-color:#f7f8ff;padding:5px;font-size:95%;" | Quelle: Forster, P. M., C.J. Smith, T. Walsh et al. (2024): Indicators of Global Climate Change 2022: Annual update of large-scale indicators of the state of the climate system and the human influence, Earth System Science Data, https://doi.org/10.5194/essd-16-2625-2024<br>… | 1 | |
| 12:48, 17. Jun. 2024 | Wald-Komp. N-Amerika.jpg (Datei) |  |
70 KB | Dieter Kasang (Diskussion | Beiträge) | == Beschreibung == Änderung der Zusammensetzung der Wälder in Alaska und Kanada nach Waldbränden == Lizenzhinweis == {| style="border:1px solid #8888aa; background-color:#f7f8ff;padding:5px;font-size:95%;" | Quelle: Kim, J. E., J.A. Wang, Y. Li, C.L. Czimczik & J.T. Randerson (2024): Wildfire-induced increases in photosynthesis in boreal forest ecosystems of North America. Global Change Biology, 30, e17151. https://doi.org/10.1111/gcb.17151 <br> Lizenz: CC BY http://creativecommons.org/license… | 1 |
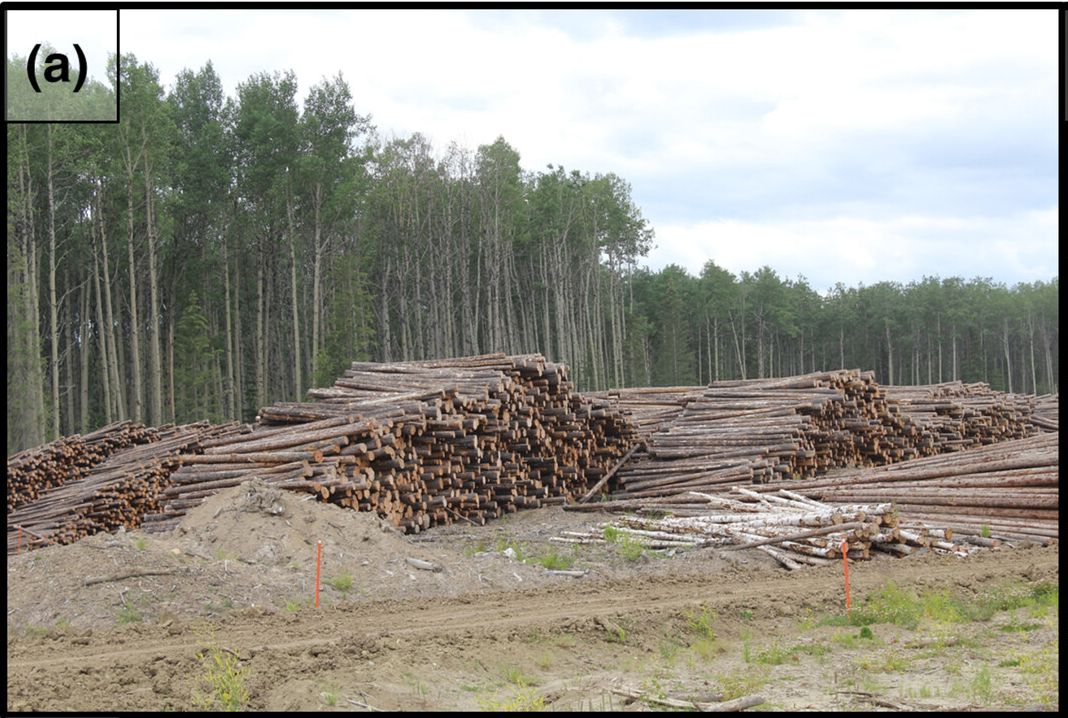
| 12:40, 17. Jun. 2024 | Kahlschlag in Kanada.jpg (Datei) |  |
160 KB | Dieter Kasang (Diskussion | Beiträge) | == Beschreibung == Kahlschlag-Fläche in im borealen Waldgürtel in Kanada == Lizenzhinweis == {| style="border:1px solid #8888aa; background-color:#f7f8ff;padding:5px;font-size:95%;" | Quelle: Gundale, M.J., E.P. Axelsson, E. P., V. Buness et al. (2024): The biological controls of soil carbon accumulation following wildfire and harvest in boreal forests: A review. Global Change Biology, 30, e17276. https://doi.org/10.1111/gcb.17276 <br> Lizenz: CC BY-NC-ND http://creativecommons.org/licenses/by-… | 1 |
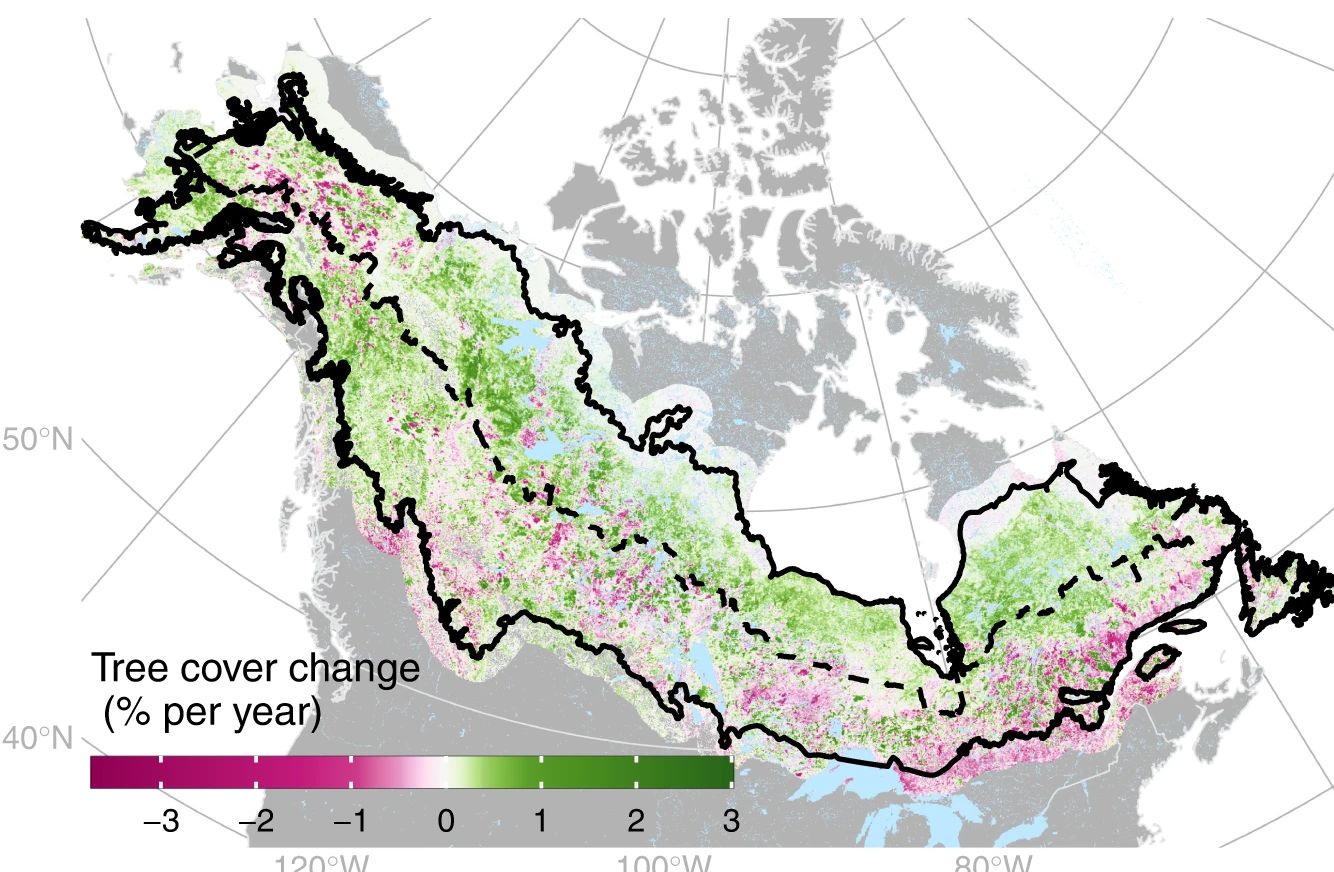
| 12:32, 17. Jun. 2024 | Tree cover change boreal N-America.jpg (Datei) |  |
199 KB | Dieter Kasang (Diskussion | Beiträge) | == Beschreibung == Änderung der Waldbedeckung in der borealen Zone Nordamerikas 2000-2019 == Lizenzhinweis == {| style="border:1px solid #8888aa; background-color:#f7f8ff;padding:5px;font-size:95%;" | Quelle: Rotbarth, R., E.H. Van Nes, M. Scheffer et al. (2023): Northern expansion is not compensating for southern declines in North American boreal forests. Nat Commun 14, 3373 (2023). https://doi.org/10.1038/s41467-023-39092-2<br> Lizenz: CC BY http://creativecommons.org/licenses/by/4.0/ |} | 1 |
| 12:26, 17. Jun. 2024 | Weißfichte in Tundra.jpg (Datei) |  |
182 KB | Dieter Kasang (Diskussion | Beiträge) | == Beschreibung == Junge Weißfichte als Pionierpflanze in der Tunda, Alaska == Lizenzhinweis == {| style="border:1px solid #8888aa; background-color:#f7f8ff;padding:5px;font-size:95%;" | Quelle: CSU MarComm Staff (2023): The world’s boreal forests may be shrinking as climate change pushes them northward, https://source.colostate.edu/the-worlds-boreal-forests-may-be-shrinking-as-climate-change-pushes-them-northward/<br> Lizenz: CC BY-ND |} | 1 |
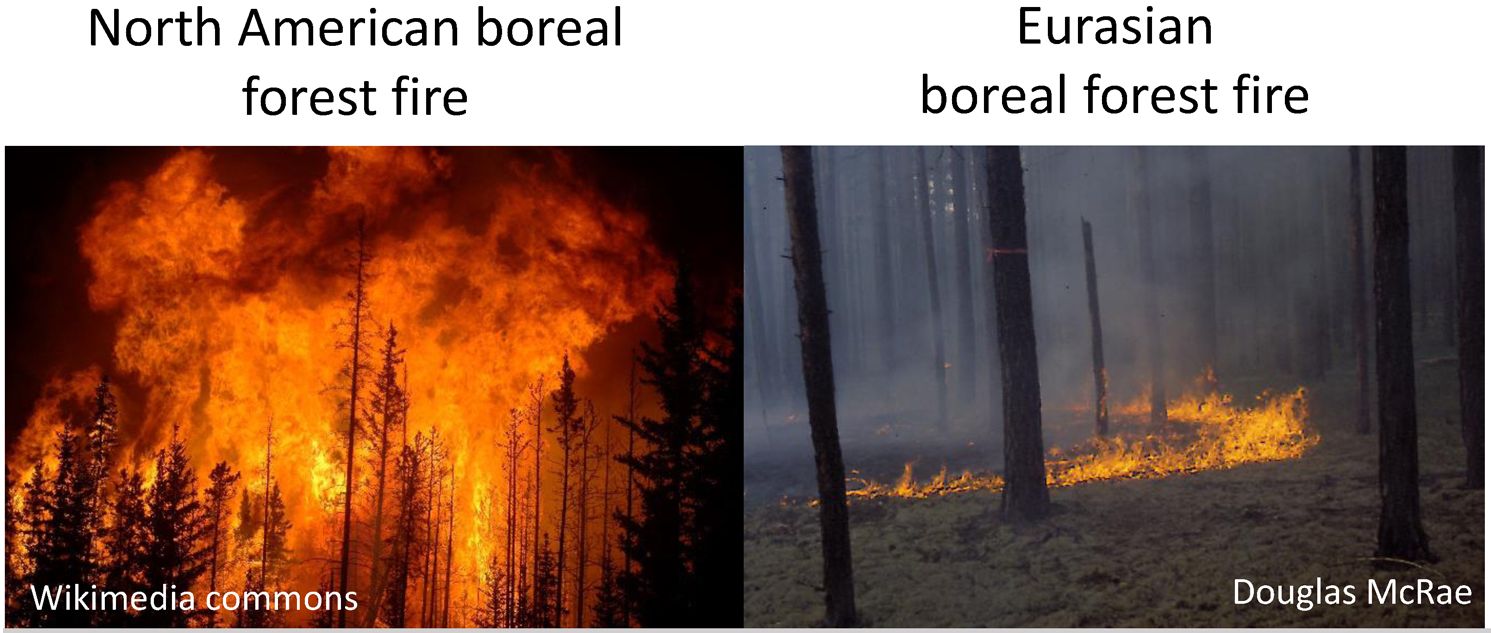
| 12:15, 17. Jun. 2024 | N-America Eurasia boreal fire.jpg (Datei) |  |
108 KB | Dieter Kasang (Diskussion | Beiträge) | 2 | |
| 10:00, 17. Jun. 2024 | Taiga Kanada.jpg (Datei) |  |
183 KB | Dieter Kasang (Diskussion | Beiträge) | == Beschreibung == Taiga im östlichen kanadischen Schild == Lizenzhinweis == {| style="border:1px solid #8888aa; background-color:#f7f8ff;padding:5px;font-size:95%;" | Quelle: Wikipedia (2010): Caniapiscau Reservoir seen from Transtaïga Road, Autor: Axel Drainville https://commons.wikimedia.org/wiki/File:R%C3%A9servoir_Caniapiscau_vu_de_la_route_Transta%C3%AFga.jpg<br> Lizenz: CC BY https://creativecommons.org/licenses/by/2.0/deed.en |} | 1 |