Von Anja hochgeladene Dateien
Aus Klimawandel
Diese Spezialseite listet alle hochgeladenen Dateien auf.
| Datum | Name | Vorschaubild | Größe | Beschreibung | Versionen |
|---|---|---|---|---|---|
| 11:44, 13. Mai 2008 | Albedo-Werte.gif (Datei) |  |
79 KB | ({{Information |Description=to be done |Author=~~~~ |Permission=share alike, attribution required (Creative Commons CC-BY-SA-2.5) |other_versions= }} {{self|cc-by-sa-2.5}}) | 1 |
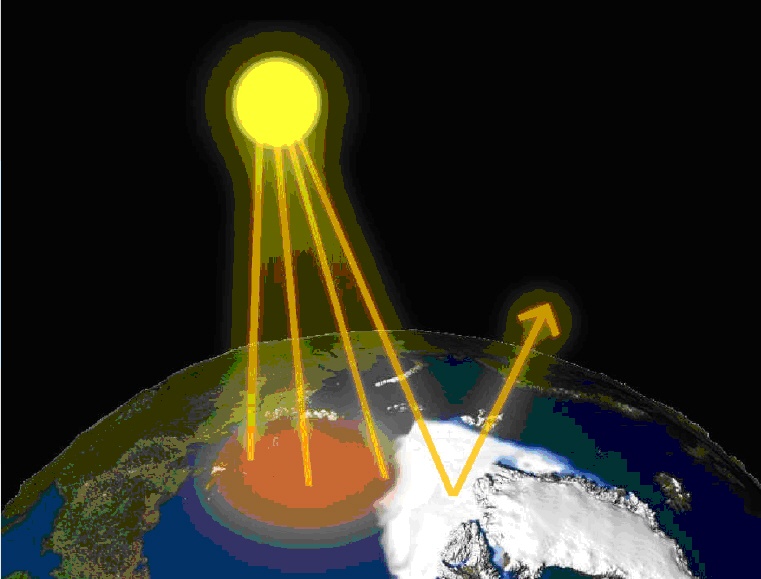
| 10:12, 20. Jun. 2008 | Albedo-Eis.jpg (Datei) |  |
96 KB | Schematische Darstellung des Einflusses der Albedo auf das Klima | 1 |
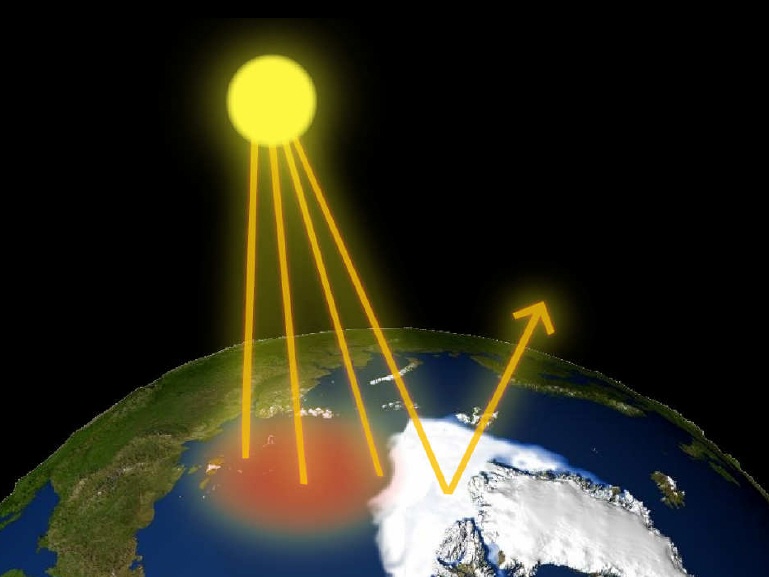
| 10:13, 20. Jun. 2008 | Albedo-Eis2.jpg (Datei) |  |
97 KB | Wirkung der Änderung der Albedo auf das Klima | 1 |
| 10:23, 20. Jun. 2008 | Eis-Albedo3.jpg (Datei) |  |
74 KB | 1 | |
| 11:11, 22. Jun. 2008 | Nao abb1.gif (Datei) |  |
18 KB | Positive NAO-Lage (Winter): Der Luftdruckgegensatz zwischen Islandtief und Azorenhoch ist größer als normal, und die Westwinde über dem nördlichen Atlantik sind stärker | 1 |
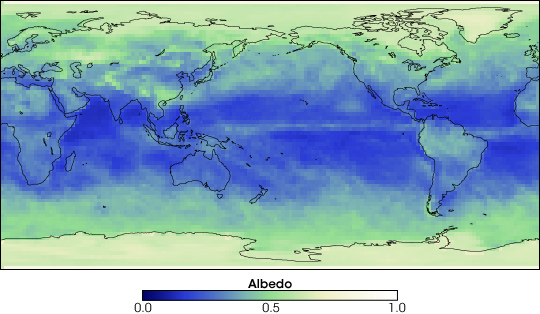
| 16:34, 26. Jun. 2008 | Albedo erde.jpg (Datei) |  |
105 KB | Albedowerte der Erde | 1 |
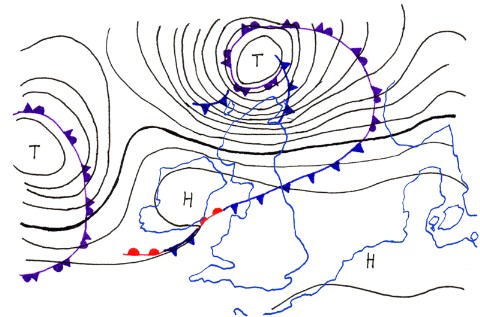
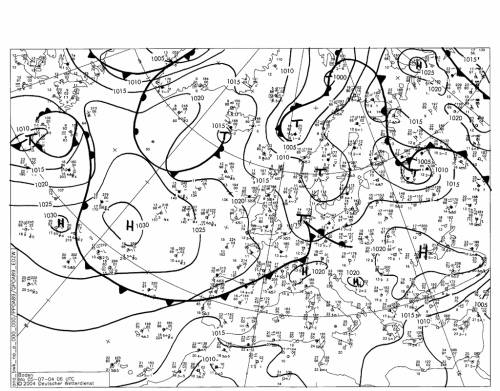
| 09:47, 2. Jul. 2008 | Isobaren bei Orkan.jpg (Datei) |  |
58 KB | Isobaren während eines Orkans über England {{Vorlage:Bild}} | 1 |
| 10:25, 2. Jul. 2008 | Tagesgang-luftdruck.jpg (Datei) |  |
71 KB | Beispiel für einen Tagesgang des Luftdrucks über Norddeutschland. | 1 |
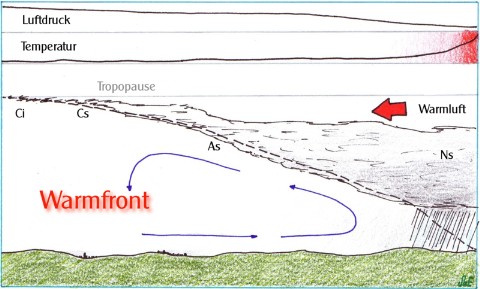
| 14:10, 3. Jul. 2008 | Warmfront.jpg (Datei) |  |
46 KB | Schematische Darstellung einer Warmfront ==Lizenzhinweis== http://de.wikipedia.org/wiki/Bild:Warmfront3.png | 1 |
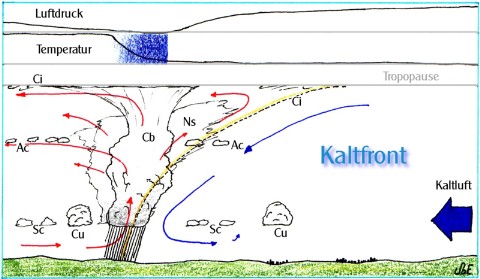
| 14:24, 3. Jul. 2008 | Kaltfront.jpg (Datei) |  |
48 KB | Schematische Darstellung einer Kaltfront | 1 |
| 14:37, 3. Jul. 2008 | Kaltfront2.jpg (Datei) |  |
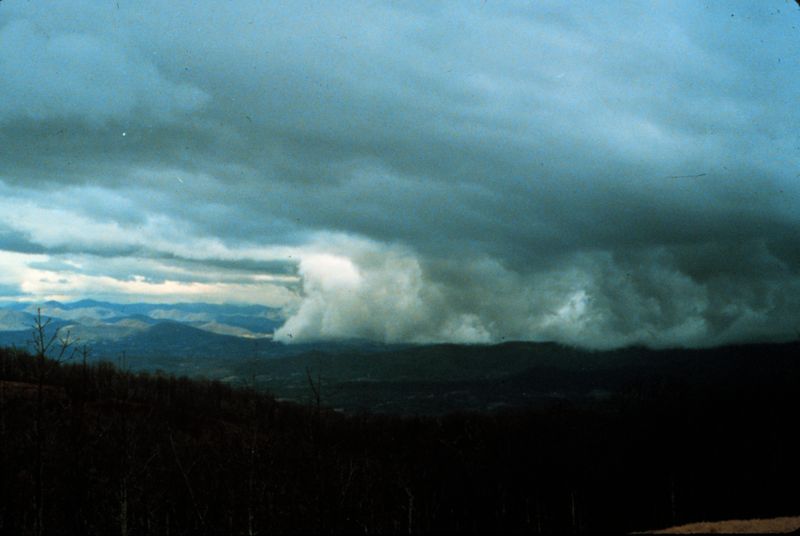
37 KB | Wolkenwand (Anzeichen für eine sich schnell bewegende Kaltfront) == Lizenzhinweis == http://de.wikipedia.org/wiki/Bild:Cloud_wall_associated_with_fast_moving_cold_front_-_NOAA.jpg | 1 |
| 16:10, 3. Jul. 2008 | Senegal reforestation.jpg (Datei) |  |
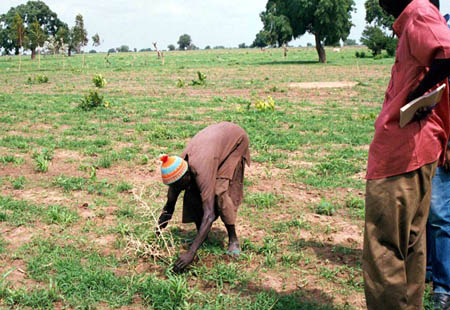
87 KB | Wiederaufforstungsprojekt in Senegal, um die Desertifikation aufzuhalten ==Lizenzhinweis== http://de.wikipedia.org/wiki/Bild:Senegal_reforestation.jpg | 1 |
| 16:17, 3. Jul. 2008 | Aralship2.jpg (Datei) |  |
90 KB | Ausgetrockneter Aralsee ==Lizenzhinweis== http://de.wikipedia.org/wiki/Bild:Aralship2.jpg | 1 |
| 15:44, 4. Jul. 2008 | Indien.jpg (Datei) |  |
45 KB | Mögliche Einflussfaktoren auf den indischen Monsun: 1) Die El-Niño-bedingten absinkenden Luftmassen über Indonesien beeinflussen die Monsunzirkulation. 2) Die Erwärmung des eurasischen Kontinents (möglicherweise durch den anthropogenen Treibhauseffek | 1 |
| 22:14, 5. Jul. 2008 | Nordamerika.jpg (Datei) |  |
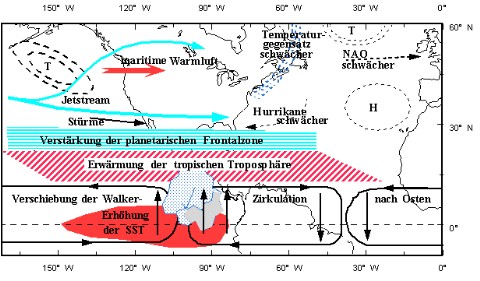
62 KB | Teleconnections während eines El-Niño-Ereignisses: Gezeigt sind die Verschiebung der Walker-Zelle nach Osten, die troposphärische Erwärmung und die Verstärkung der planetarischen Frontalzone, die Ausprägung des Jetstreams, die Verstärkung des Alëu | 1 |
| 16:13, 9. Jul. 2008 | MeteoLaNina.jpg (Datei) |  |
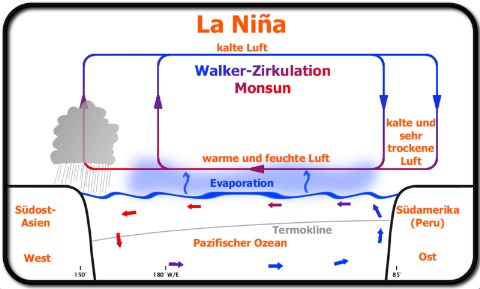
40 KB | Veranschaulichung eines La Niña Ereignisses == Lizenzhinweis == | 1 |
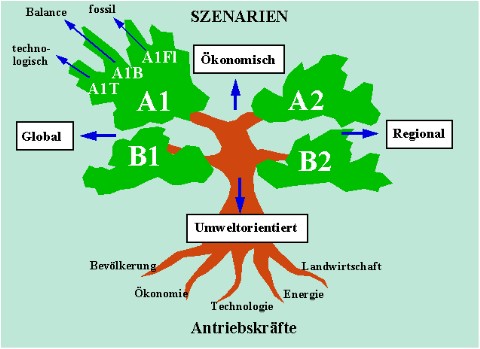
| 17:12, 9. Jul. 2008 | Szenarien1.jpg (Datei) |  |
46 KB | Anschauliche Darstellung der IPCC Szenarien == Lizenzhinweis == | 1 |
| 19:11, 17. Jul. 2008 | Modellaufloesung.jpg (Datei) |  |
65 KB | Europa und der Nordatlantik bei unterschiedlicher Modellauflösung. ==Lizenzhinweis== {| style="border:1px solid #8888aa; background-color:#f7f8ff;padding:5px;font-size:95%;" | Quelle: das Bild [http://www.hamburger-bildungsserver.de/index.phtml?site=the | 1 |
| 19:16, 17. Jul. 2008 | Modellstruktur.jpg (Datei) |  |
34 KB | Schema eines gekoppelten Ozean-Atmosphäremodells mit weiteren angegliederten Modellen ==Lizenzhinweis== {| style="border:1px solid #8888aa; background-color:#f7f8ff;padding:5px;font-size:95%;" | Quelle: |} | 1 |
| 17:47, 18. Jul. 2008 | Anvil shaped cumulus panorama edit crop.jpg (Datei) |  |
50 KB | Cumuluswolken, im Hintergrund Amboss eines Cumulonimbus == Lizenzhinweis == {| style="border:1px solid #8888aa; background-color:#f7f8ff;padding:5px;font-size:95%;" | Quelle: Bild [http://de.wikipedia.org/w/index.php?title=Bild:Anvil_shaped_cumulus_pan | 1 |
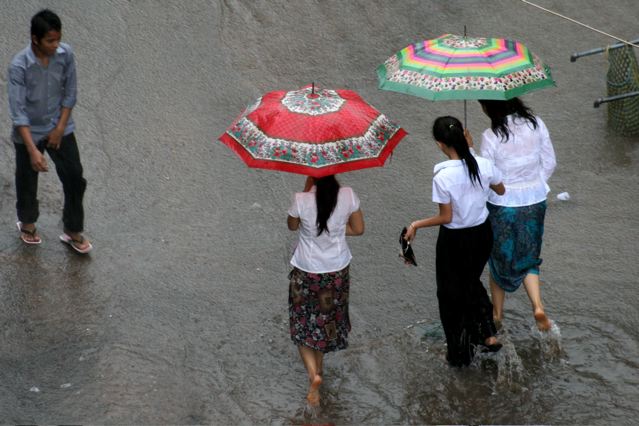
| 12:54, 20. Jul. 2008 | Cambodia monsoon July 2007.jpg (Datei) |  |
58 KB | Monsun in Kambodscha im Juli 2001 == Lizenzhinweis == {| style="border:1px solid #8888aa; background-color:#f7f8ff;padding:5px;font-size:95%;" | Quelle: Bild [http://de.wikipedia.org/w/index.php?title=Bild:Cambodia_monsoon_July_2007.jpg&filetimestamp=2 | 1 |
| 13:13, 20. Jul. 2008 | Modelle4.gif (Datei) |  |
26 KB | Einbettung von dynamischen regionalen Klimamodellen mit viel Detailinformation aus ihrer Umgebung in die globalen Modelle. == Lizenzhinweis == {| style="border:1px solid #8888aa; background-color:#f7f8ff;padding:5px;font-size:95%;" | |} | 1 |
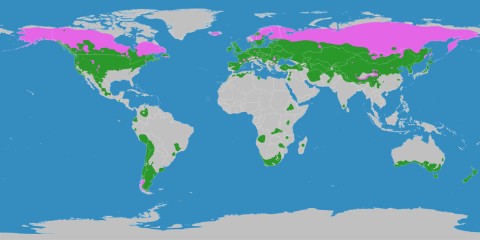
| 13:59, 21. Jul. 2008 | Klimagürtel-der-erde-gemäßigte-zone.jpg (Datei) |  |
29 KB | Gemäßigte Klimazone der Erde ██ Kaltgemäßigtes (boreales) Klima ██ Warmgemäßigtes Klima == Lizenzhinweis == | 1 |
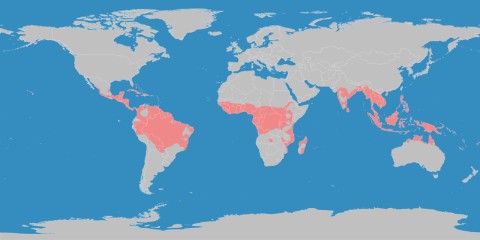
| 14:40, 21. Jul. 2008 | Klimagürtel-der-erde-tropen.jpg (Datei) |  |
27 KB | pink: Tropische Klimazone der Erde == Lizenzhinweis == {| style="border:1px solid #8888aa; background-color:#f7f8ff;padding:5px;font-size:95%;" | Quelle: Bild [http://de.wikipedia.org/w/index.php?title=Bild:Klimag%C3%BCrtel-der-erde-tropen.png&filetimest | 1 |
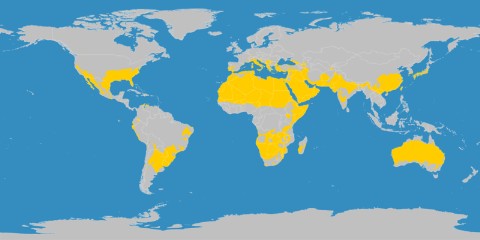
| 14:58, 21. Jul. 2008 | Klimagürtel-der-erde-subtropen.jpg (Datei) |  |
28 KB | gelb: Subtropische Klimazone der Erde == Lizenzhinweis == {| style="border:1px solid #8888aa; background-color:#f7f8ff;padding:5px;font-size:95%;" | Quelle: Bild [http://de.wikipedia.org/w/index.php?title=Bild:Klimag%C3%BCrtel-der-erde-subtropen.png&file | 1 |
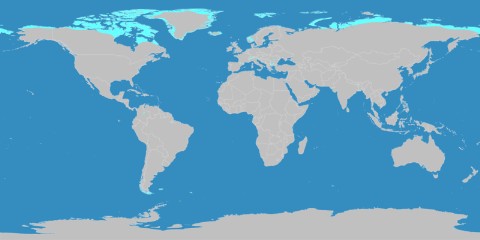
| 11:49, 23. Jul. 2008 | Klimagürtel-der-erde-tundra.jpg (Datei) |  |
26 KB | ==Lizenzhinweis== {| style="border:1px solid #8888aa; background-color:#f7f8ff;padding:5px;font-size:95%;" | Quelle: Bild [http://de.wikipedia.org/wiki/Bild:Klimag%C3%BCrtel-der-erde-tundra.png Tundra] aus der freien Mediendatenbank [http://de.wikipedi | 1 |
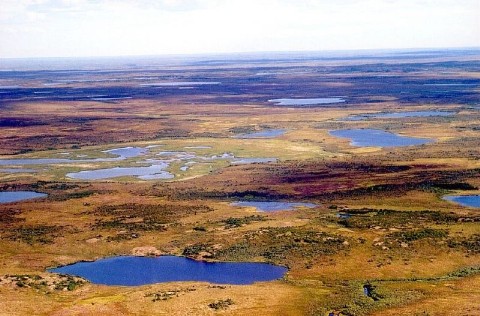
| 12:12, 23. Jul. 2008 | Ru200008050084.jpg (Datei) |  |
66 KB | Tundra bei Dudinka am Jenissej in Sibirien ==Lizenzhinweis== {| style="border:1px solid #8888aa; background-color:#f7f8ff;padding:5px;font-size:95%;" | Quelle: Bild [http://de.wikipedia.org/w/index.php?title=Bild:Ru200008050084.jpg&filetimestamp=20060 | 1 |
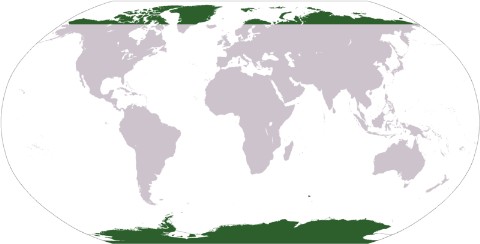
| 08:55, 24. Jul. 2008 | LocationPolarRegions.jpg (Datei) |  |
24 KB | Lage der Polargebiete auf der Erde == Lizenzhinweis == {| style="border:1px solid #8888aa; background-color:#f7f8ff;padding:5px;font-size:95%;" | Quelle: Bild [http://de.wikipedia.org/w/index.php?title=Bild:LocationPolarRegions.png&filetimestamp=20060 | 1 |
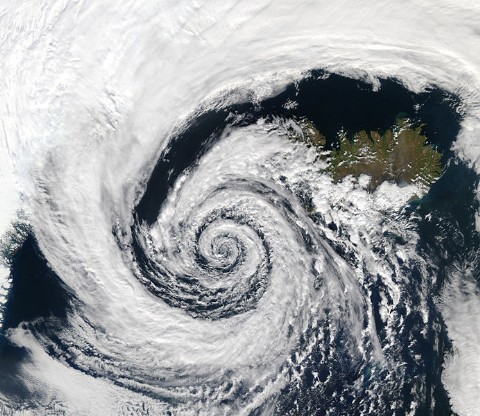
| 09:25, 24. Jul. 2008 | Low pressure system over Iceland.jpg (Datei) |  |
84 KB | Tiefdruckgebiet über Island == Lizenzhinweis == {| style="border:1px solid #8888aa; background-color:#f7f8ff;padding:5px;font-size:95%;" | Quelle: Bild [http://commons.wikimedia.org/wiki/Image:Low_pressure_system_over_Iceland.jpg Tiefdruckgebiet] aus de | 1 |
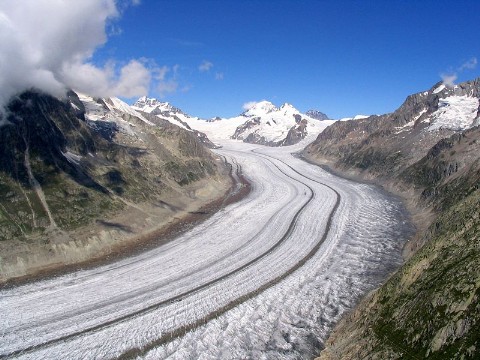
| 10:14, 30. Jul. 2008 | Grosser Aletschgletscher 3196.jpg (Datei) |  |
70 KB | Großer Aletschgletscher == Lizenzhinweis == {| style="border:1px solid #8888aa; background-color:#f7f8ff;padding:5px;font-size:95%;" | Quelle: Bild [http://de.wikipedia.org/wiki/Bild:Grosser_Aletschgletscher_3196.JPG Großer Aletschgletscher] aus der fr | 1 |
| 11:34, 1. Aug. 2008 | IntertropicalConvergenceZone-EO.jpg (Datei) |  |
56 KB | Die Stürme der Innertropischen Konvergenzzone im Ostpazifik. == Lizenzhinweis == {| style="border:1px solid #8888aa; background-color:#f7f8ff;padding:5px;font-size:95%;" | Quelle: Bild [http://de.wikipedia.org/wiki/Bild:IntertropicalConvergenceZone-E | 1 |
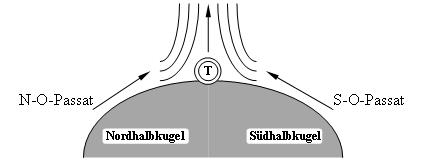
| 11:43, 1. Aug. 2008 | ITC.jpg (Datei) |  |
26 KB | Die Innertropische Konvergenzzone == Lizenzhinweis == {| style="border:1px solid #8888aa; background-color:#f7f8ff;padding:5px;font-size:95%;" | Quelle: Bild [http://de.wikipedia.org/wiki/Bild:ITC.jpg ITC] aus der freien Mediendatenbank [http://de.wiki | 1 |
| 12:06, 5. Aug. 2008 | Wetterkarte genau.jpg (Datei) |  |
53 KB | Wetterkarte == Lizenzhinweis == {| style="border:1px solid #8888aa; background-color:#f7f8ff;padding:5px;font-size:95%;" | Quelle: Bild [http://de.wikipedia.org/wiki/Bild:Wetterkarte_genau.jpg Wetterkarte] aus der freien Mediendatenbank [http://de.wikip | 1 |
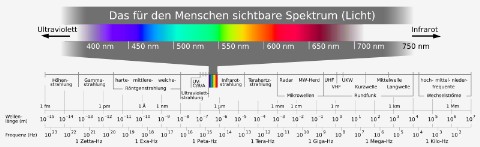
| 13:19, 13. Aug. 2008 | Electromagnetic spectrum c svg.jpg (Datei) |  |
28 KB | Das elektromagnetische Spektrum == Lizenzhinweis == {| style="border:1px solid #8888aa; background-color:#f7f8ff;padding:5px;font-size:95%;" | Quelle: Bild [http://de.wikipedia.org/wiki/Bild:Electromagnetic_spectrum_c.svg Elektromagnetisches Spektrum] a | 1 |
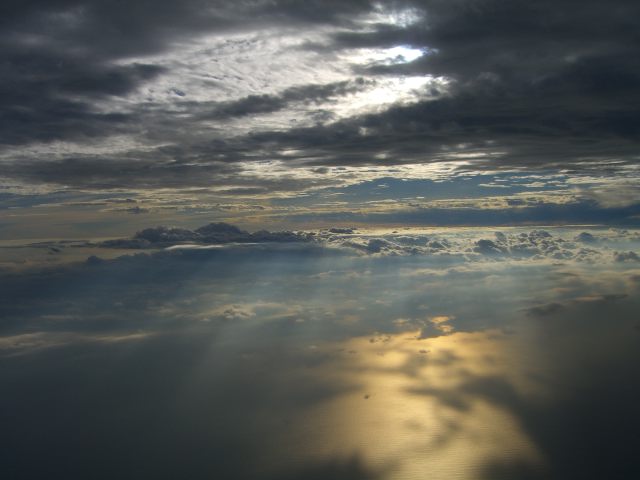
| 21:51, 2. Dez. 2008 | Troposphere CIMG1853.jpg (Datei) |  |
68 KB | Die Troposphäre der Erde aus der Sicht eines Flugzeuges == Lizenzhinweis == {| style="border:1px solid #8888aa; background-color:#f7f8ff;padding:5px;font-size:95%;" | Quelle: Bild [http://en.wikipedia.org/wiki/Image:Troposphere_CIMG1853.JPG] aus der f | 1 |
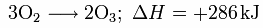
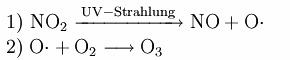
| 22:12, 7. Dez. 2008 | Ozon1.png (Datei) | 4 KB | 1 | ||
| 14:30, 14. Dez. 2008 | Ozon2.png (Datei) | 5 KB | 1 | ||
| 14:31, 14. Dez. 2008 | Ozon3.png (Datei) | 4 KB | 1 | ||
| 14:32, 14. Dez. 2008 | Ozon4.png (Datei) | 4 KB | 1 | ||
| 15:10, 21. Dez. 2008 | Tropen Zenit.jpg (Datei) |  |
1,07 MB | == Lizenzhinweis == {| style="border:1px solid #8888aa; background-color:#f7f8ff;padding:5px;font-size:95%;" | Quelle: Bild [http://de.wikipedia.org/w/index.php?title=Bild:Tropical-area-mactan-philippines&filetimestamp=20071015152610 Sonneneinstrahlung in | 1 |
| 19:42, 27. Dez. 2008 | Nildelta.jpg (Datei) |  |
54 KB | Das Nildelta stellt das Mündungsdelta des afrikanischen Nils dar. | 2 |
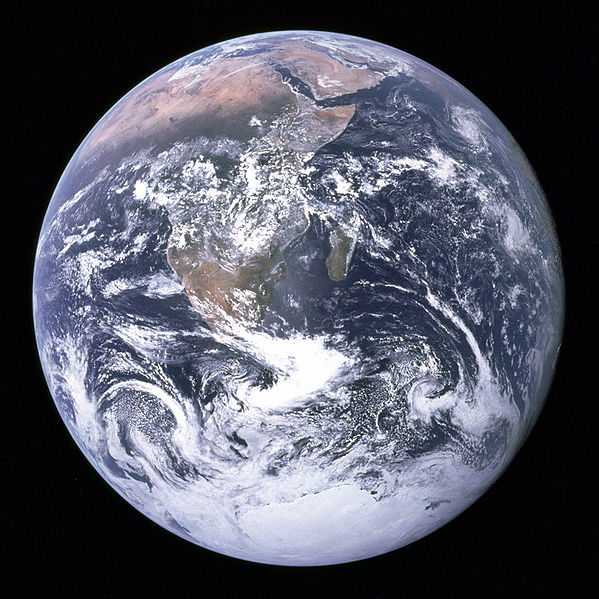
| 19:51, 4. Jan. 2009 | The Earth seen from Apollo 17.jpg (Datei) |  |
99 KB | == Lizenzhinweis == {{Vorlage:Bildlizenz}} | 1 |
| 20:41, 10. Jan. 2009 | Glacier Mass Balance Map.png (Datei) |  |
108 KB | == Lizenzhinweis == {| style="border:1px solid #8888aa; background-color:#f7f8ff;padding:5px;font-size:95%;" | Dieses Bild basiert auf dem Bild [http://www.globalwarmingart.com/wiki/Image:Glacier_Mass_Balance_Map_png ] aus der Mediendatenbank [http://www | 1 |
| 21:36, 10. Jan. 2009 | India 78 40398E 20 74980N.jpg (Datei) |  |
92 KB | == Lizenzhinweis == {| style="border:1px solid #8888aa; background-color:#f7f8ff;padding:5px;font-size:95%;" | Quelle: Bild [http://de.wikipedia.org/wiki/Bild:India_78_40398E_20_74980N.jpg Indischer Subkontinent] aus der freien Mediendatenbank [http://de. | 1 |
| 12:04, 15. Mär. 2017 | Änderungen Starkregen Sommer RCP8 5 2071 2100-1971 2000.png (Datei) |  |
229 KB | Veränderung der Anzahl der Starkregentage im Sommer nach dem Szenario RCP85, 2071-2100 minus 1971-2000, == Lizenzhinweis == {| style="border:1px solid #8888aa; background-color:#f7f8ff;padding:5px;font-size:95%;" |Eigene Darstellung, geplottet mit Pan… | 1 |
| 21:07, 15. Mär. 2017 | Starkregentage in Starkregentage DiffII Europa Som Eur Ausschnitt.png (Datei) |  |
241 KB | Veränderung der Anzahl der Starkregentage (das heißt Tage mit Niederschlagsmengen größer als 25 mm) im Sommer nach dem Szenario RCP85, 2071-2100 minus 1971-2000 | 1 |
| 15:40, 19. Mär. 2017 | Hotday in Heißetage Nordamerika rcp85 diff.png (Datei) |  |
158 KB | Veränderungen der Anzahl heißer Tage, das heißt Tage mit einer Maximumtemperatur größer als 30°C, im Sommer für den Zeitraum 2071-2100 minus 1971-2000 nach dem Szenario RCP8.5. | 1 |
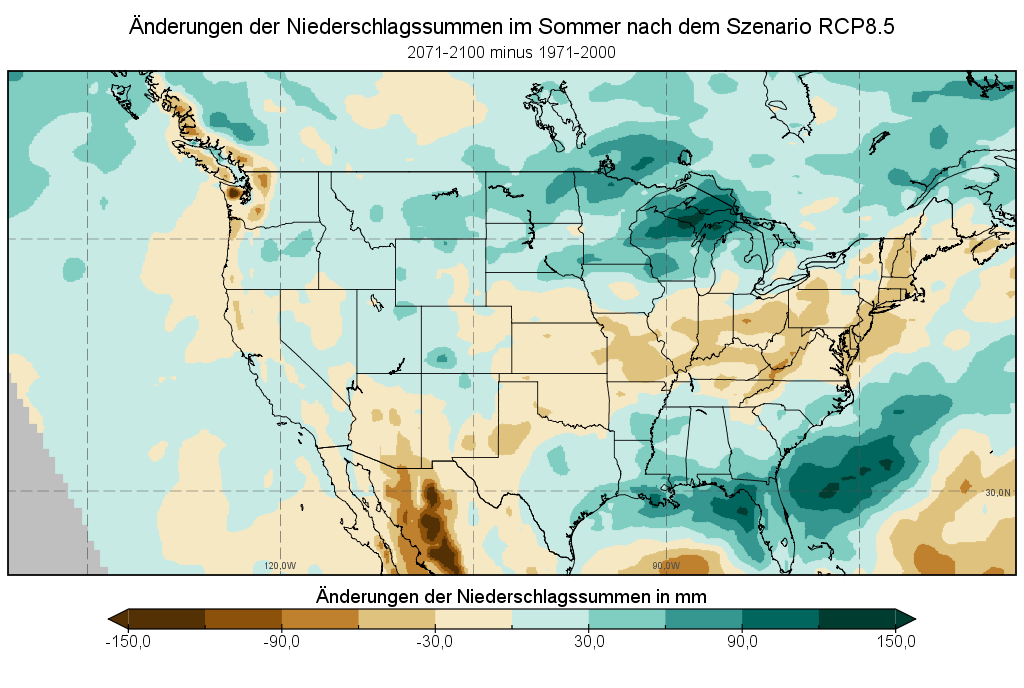
| 20:45, 19. Mär. 2017 | P in Niederschlag Nordamerika rcp85 d.png (Datei) |  |
123 KB | Niederschlagsänderungen in Nordamerika im Sommer nach dem Szenario RCP8.5. ==Lizenzhinweis== {| style="border:1px solid #8888aa; background-color:#f7f8ff;padding:5px;font-size:95%;" | Datenquelle: We acknowledge the World Climate Research Programme's… | 1 |
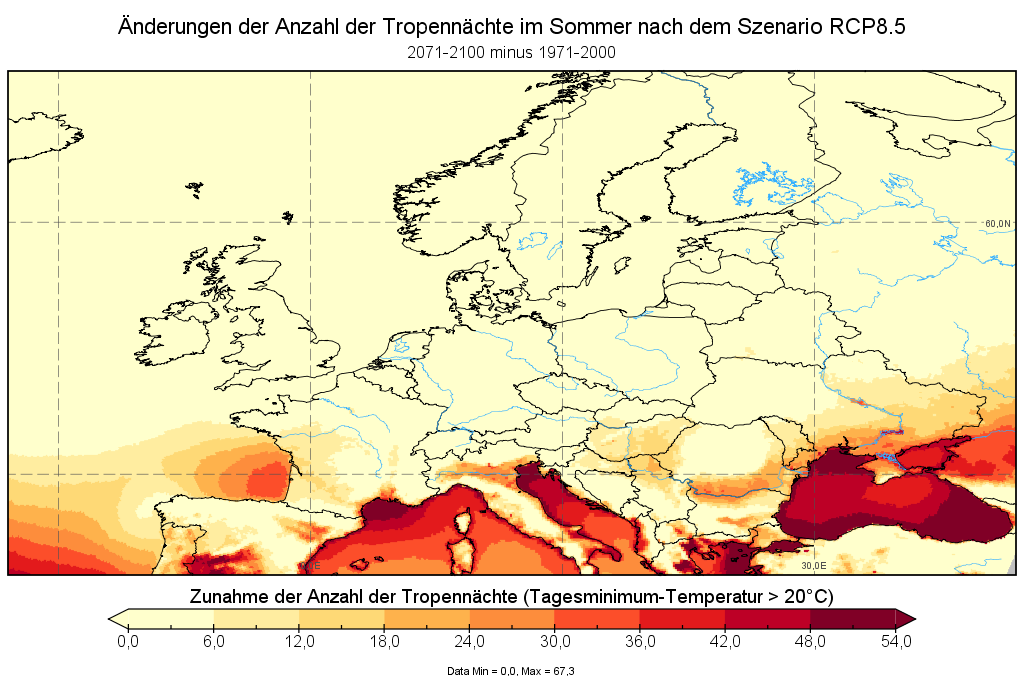
| 12:02, 21. Mär. 2017 | Tropennacht in Tropennacht DiffII Europa Sommer.png (Datei) |  |
158 KB | Änderungen der Anzahl der Tropennächte (Tage mit einer Minimumtemperatur größer als 20°C) im Sommer nach dem Szenario RCP8.5: 2071-2100 minus 1971-2000. == Lizenzhinweis == {| style="border:1px solid #8888aa; background-color:#f7f8ff;padding:5px… | 1 |
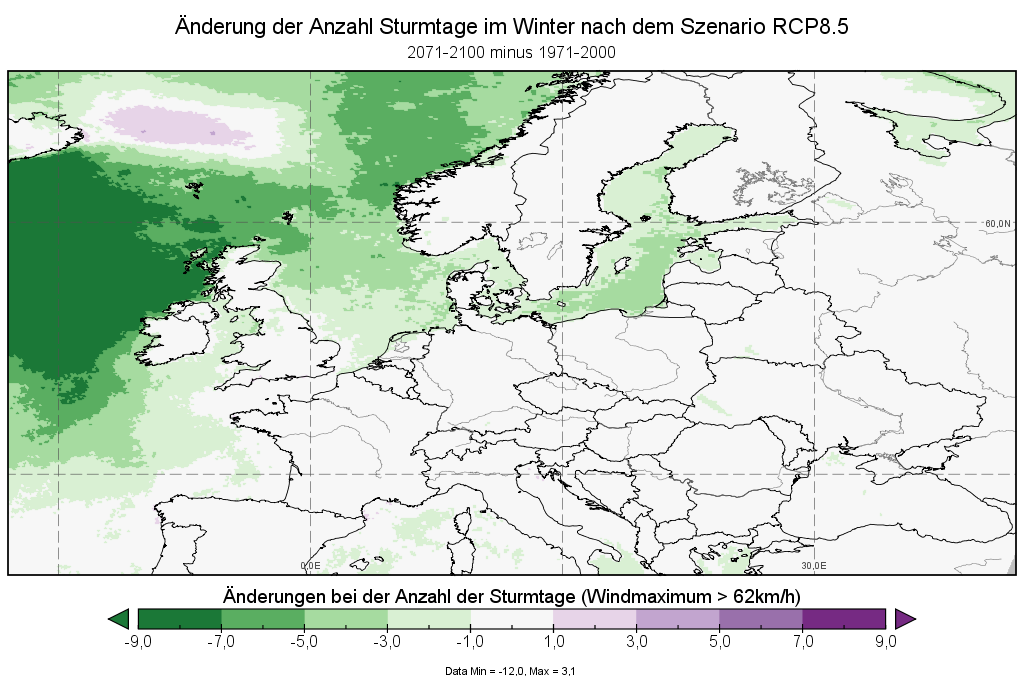
| 14:35, 21. Mär. 2017 | Sturmtage in Sturmtage DiffII Europa Winter r.png (Datei) |  |
147 KB | Änderung der Anzahl der Sturmtage im Winter nach dem Szenario RCP8.5, 2071-2100 minus 1971-2000. == Lizenzhinweis == {| style="border:1px solid #8888aa; background-color:#f7f8ff;padding:5px;font-size:95%;" |Eigene Darstellung, geplottet mit Panoply… | 1 |