Datei:Eu wet days 2020.jpg: Unterschied zwischen den Versionen
Aus Klimawandel
(== Beschreibung == Anzahl der feuchten Tage (ab 1mm Niederschlag/Tag) 2020 im Vergleich zum Mittel 1981-2010 == Lizenzhinweis == {| style="border:1px solid #8888aa; background-color:#f7f8ff;padding:5px;font-size:95%;" |Quelle: Copernicus Climate Change (2021): European state of the climate 2020, Precipitation, https://climate.copernicus.eu/esotc/2020/precipitations <br> Lizenz: Reproduction of the publically available content of this website is authorised, provided the source is acknowledged, s…) |
K (→Lizenzhinweis) |
||
| Zeile 3: | Zeile 3: | ||
== Lizenzhinweis == | == Lizenzhinweis == | ||
{| style="border:1px solid #8888aa; background-color:#f7f8ff;padding:5px;font-size:95%;" | {| style="border:1px solid #8888aa; background-color:#f7f8ff;padding:5px;font-size:95%;" | ||
|Quelle: Copernicus Climate Change (2021): | |Quelle: Copernicus Climate Change (2021): [https://climate.copernicus.eu/esotc/2020/precipitations European state of the climate 2020, Precipitation]<br> | ||
Lizenz: Reproduction of the publically available content of this website is authorised, provided the source is acknowledged, save where otherwise stated | Lizenz: Reproduction of the publically available content of this website is authorised, provided the source is acknowledged, save where otherwise stated | ||
|} | |} | ||
Version vom 3. Januar 2022, 18:19 Uhr
Beschreibung
Anzahl der feuchten Tage (ab 1mm Niederschlag/Tag) 2020 im Vergleich zum Mittel 1981-2010
Lizenzhinweis
| Quelle: Copernicus Climate Change (2021): European state of the climate 2020, Precipitation Lizenz: Reproduction of the publically available content of this website is authorised, provided the source is acknowledged, save where otherwise stated |
Dateiversionen
Klicken Sie auf einen Zeitpunkt, um diese Version zu laden.
| Version vom | Vorschaubild | Maße | Benutzer | Kommentar | |
|---|---|---|---|---|---|
| aktuell | 18:18, 3. Jan. 2022 | 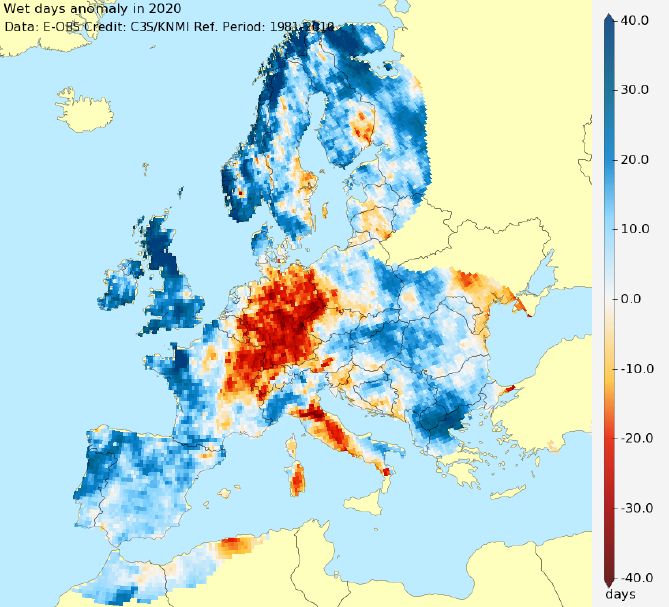 | 669 × 607 (74 KB) | Dieter Kasang (Diskussion | Beiträge) | == Beschreibung == Anzahl der feuchten Tage (ab 1mm Niederschlag/Tag) 2020 im Vergleich zum Mittel 1981-2010 == Lizenzhinweis == {| style="border:1px solid #8888aa; background-color:#f7f8ff;padding:5px;font-size:95%;" |Quelle: Copernicus Climate Change (2021): European state of the climate 2020, Precipitation, https://climate.copernicus.eu/esotc/2020/precipitations <br> Lizenz: Reproduction of the publically available content of this website is authorised, provided the source is acknowledged, s… |
Sie können diese Datei nicht überschreiben.
Dateiverwendung
Die folgenden 2 Seiten verwenden diese Datei: