Von Dieter Kasang hochgeladene Dateien
Aus Klimawandel
Diese Spezialseite listet alle hochgeladenen Dateien auf.
| Datum | Name | Vorschaubild | Größe | Beschreibung | Versionen |
|---|---|---|---|---|---|
| 08:25, 13. Okt. 2025 | Ch4-trend 1983-aktuell.png (Datei) |  |
58 KB | == Beschreibung == Globale monatliche Methan-Konzentration 1983-2025 ==Lizenzhinweis== {| style="border:1px solid #8888aa; background-color:#f7f8ff;padding:5px;font-size:95%;" | Quelle: Earth System Research Laboratory (NOAA): Trends in Atmospheric Methane, https://gml.noaa.gov/ccgg/trends_ch4/<br> Lizenz: public domain |} | 1 |
| 14:24, 11. Okt. 2025 | Solar crop production Italy2.jpg (Datei) |  |
162 KB | == Beschreibung == Photovoltaikanlage über Anbauland in Latia, Italien == Lizenzhinweis == {| style="border:1px solid #8888aa; background-color:#f7f8ff;padding:5px;font-size:95%;" |Quelle: Di Francia, G., and P. Cupo (2023): A Cost–Benefit Analysis for Utility-Scale Agrivoltaic Implementation in Italy, Energies 16, no. 7: 2991. https://doi.org/10.3390/en16072991<br> Lizenz: [https://creativecommons.org/licenses/by/4.0/ CC BY] |} | 1 |
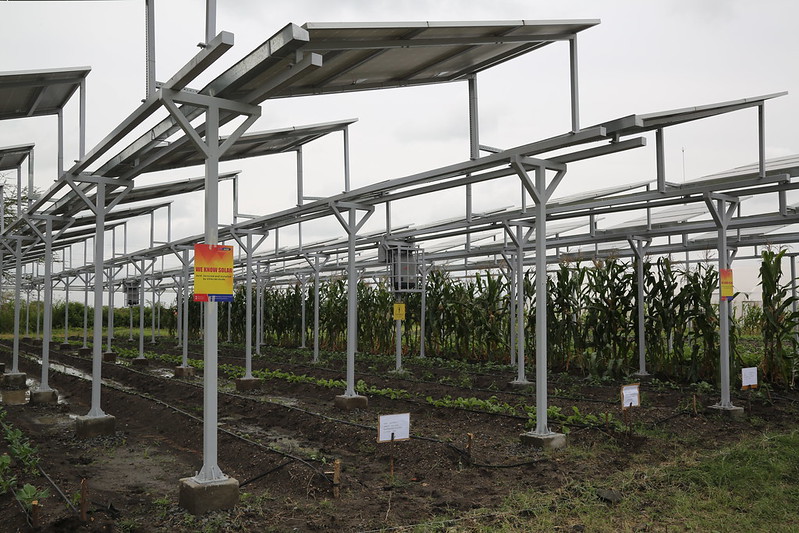
| 14:19, 11. Okt. 2025 | Agrofotovoltaic and land use.jpg (Datei) |  |
78 KB | == Beschreibung == Solarpanele als Schutz für landwirtschaftliche Maschinen == Lizenzhinweis == {| style="border:1px solid #8888aa; background-color:#f7f8ff;padding:5px;font-size:95%;" |Quelle: Hilker, J.M., M. Busse, K. Müller et al. (2024): Photovoltaics in agricultural landscapes: “Industrial land use” or a “real compromise” between renewable energy and biodiversity? Perspectives of German nature conservation associations. Energ Sustain Soc 14, 6 (2024). https://doi.org/10.1186/s13705-023-00… | 1 |
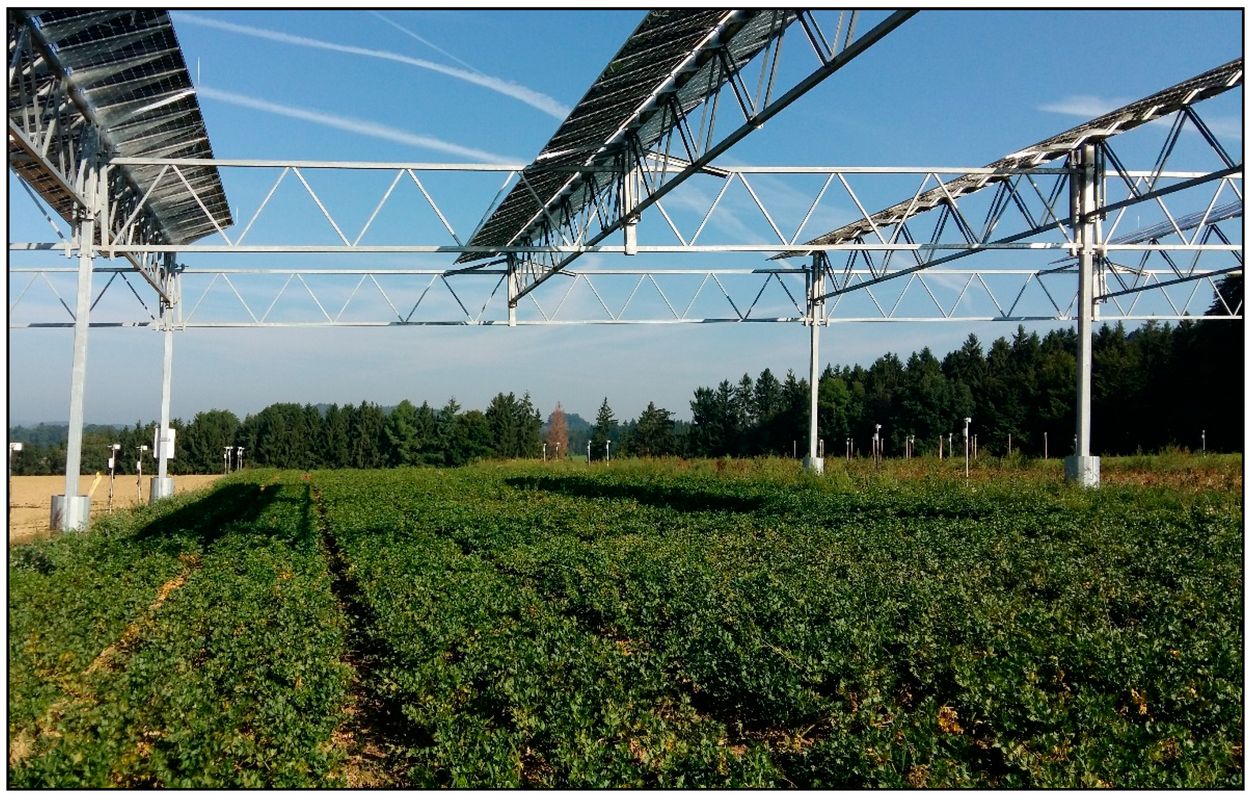
| 14:15, 11. Okt. 2025 | Weideland Agrivoltaik.jpg (Datei) |  |
201 KB | == Beschreibung == Photovoltaikananlage auf Weideland == Lizenzhinweis == {| style="border:1px solid #8888aa; background-color:#f7f8ff;padding:5px;font-size:95%;" |Quelle: Sturchio, M.A., J.E. Macknick, G.A. Barron-Gafford et al. (2022): Grassland Productivity Responds Unexpectedly To Dynamic Light and Soil Water Environments Induced by Photovoltaic Arrays. Ecosphere 13(12): e4334. https://doi.org/10.1002/ecs2.4334<br> Lizenz: [https://creativecommons.org/licenses/by/4.0/ CC BY] |} | 1 |
| 14:10, 11. Okt. 2025 | Knollensellerie unter AV.jpg (Datei) |  |
283 KB | == Beschreibung == Knollensellerie unter einer Photovoltaik-Anlage, Hohenheim == Lizenzhinweis == {| style="border:1px solid #8888aa; background-color:#f7f8ff;padding:5px;font-size:95%;" |Quelle: Weselek, A., A. Bauerle, S. Zikeli et al. (2021): Effects on Crop Development, Yields and Chemical Composition of Celeriac (Apium graveolens L. var. rapaceum) Cultivated Underneath an Agrivoltaic System, Agronomy 11, no. 4: 733. https://doi.org/10.3390/agronomy11040733 <br> Lizenz: CC BY https://creati… | 1 |
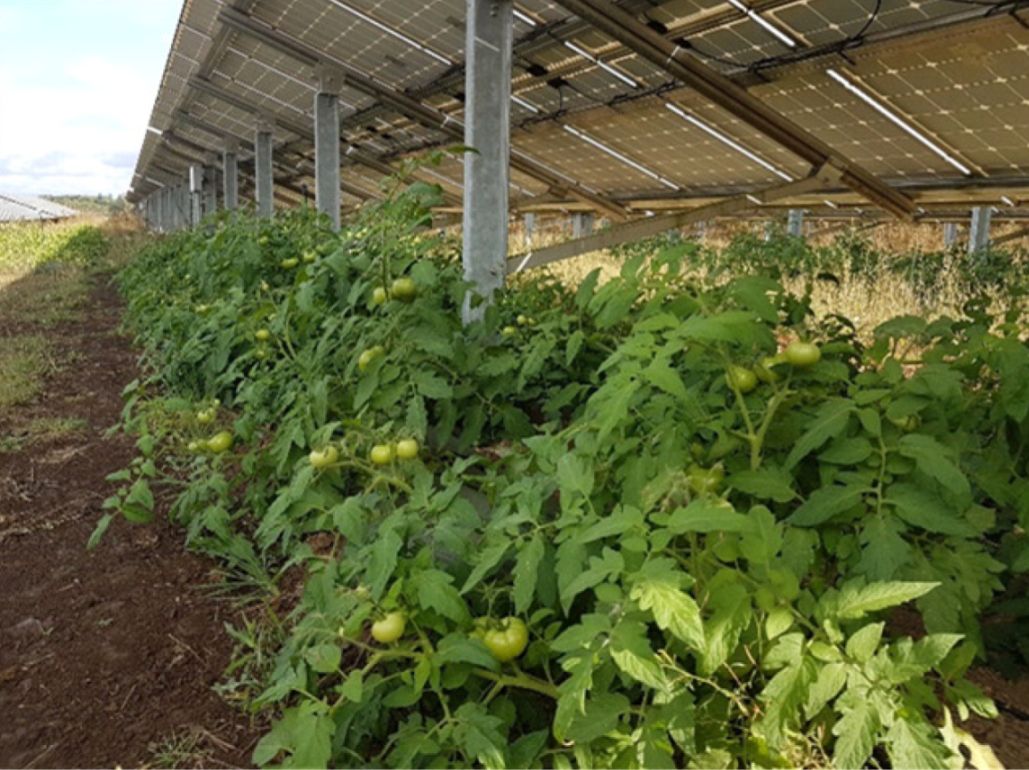
| 14:05, 11. Okt. 2025 | Agrivoltaic Tomatoes.jpg (Datei) |  |
145 KB | == Beschreibung == Tomatenanbau unter einem Photovoltaik-Dach == Lizenzhinweis == {| style="border:1px solid #8888aa; background-color:#f7f8ff;padding:5px;font-size:95%;" |Quelle: AL-agele, H.A., K. Proctor, G. Murthy and C. Higgins: (2021): A Case Study of Tomato (Solanum lycopersicon var. Legend) Production and Water Productivity in Agrivoltaic Systems, Sustainability 13, no. 5: 2850. https://doi.org/10.3390/su13052850 <br> Lizenz: CC BY http://creativecommons.org/licenses/by/4.0/ |} | 1 |
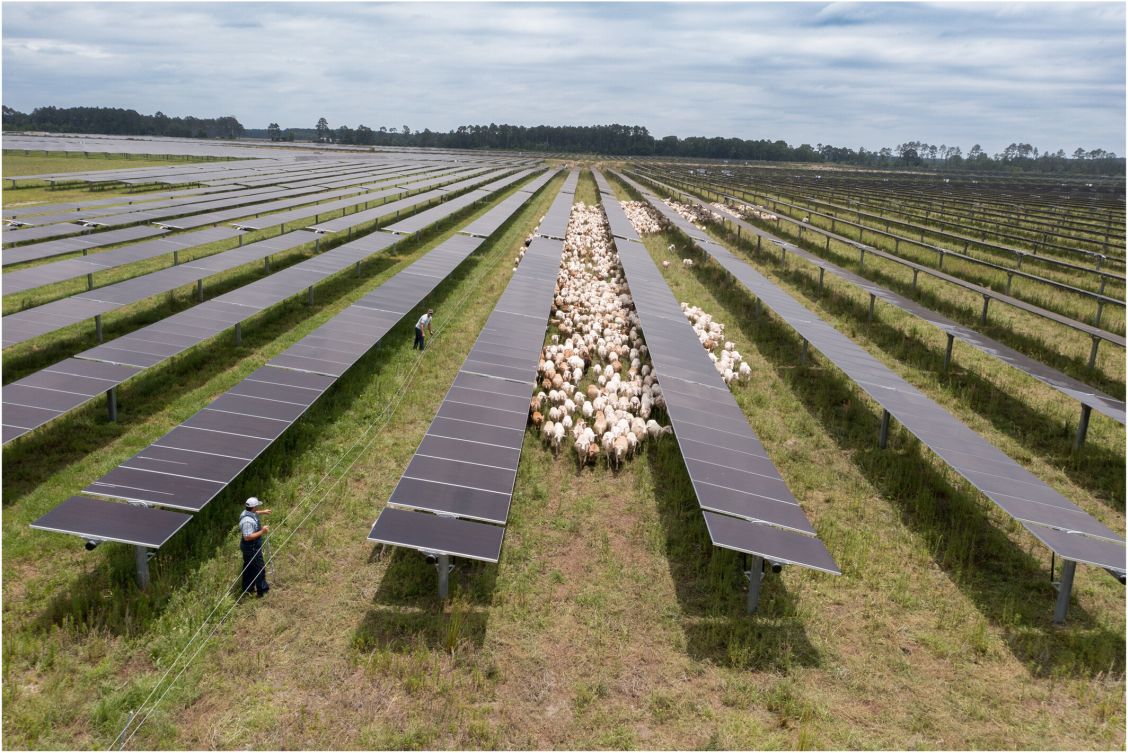
| 14:01, 11. Okt. 2025 | Agrivoltaic grazing.jpg (Datei) |  |
187 KB | == Beschreibung == Schafe weiden zwischen Solarpanelen. == Lizenzhinweis == {| style="border:1px solid #8888aa; background-color:#f7f8ff;padding:5px;font-size:95%;" |Quelle: Bacon, T., A.C. Monlezun, M. Hong et al. (2025): Agrivoltaic Grazing Systems for a Sustainable Future: A Multi‐Disciplinary Review & Gap Analysis, Earth's Future, https://doi.org/10.1029/2024EF005429<br> Lizenz: CC BY-NC-ND http://creativecommons.org/licenses/by-nc-nd/4.0/ |} | 1 |
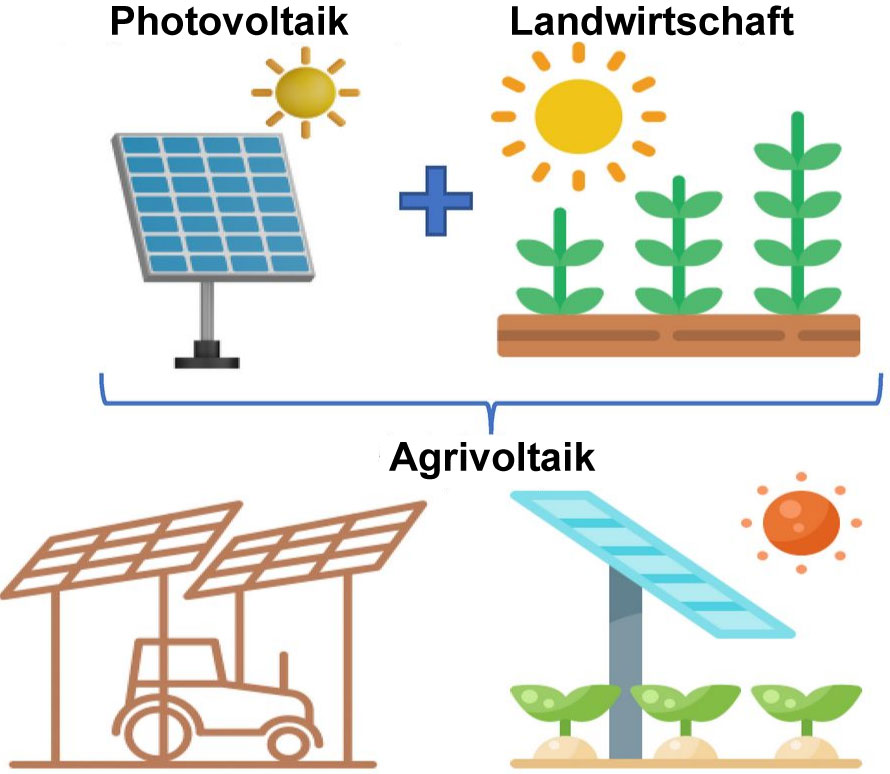
| 13:54, 11. Okt. 2025 | Photovoltaic+Landwirtschaft.jpg (Datei) |  |
87 KB | == Beschreibung == Phovoltaik + Landwirtschaft ergeben Agrivoltaik Quelle: Njema, G.G., Rono, N., Mosonik, B.C. et al. (2025): A review on advances towards achieving net-zero carbon footprint through sustainable agrivoltaic technology. Bull Natl Res Cent 49, 38 (2025). https://doi.org/10.1186/s42269-025-01331-5; übersetzt == Lizenzhinweis == {| style="border:1px solid #8888aa; background-color:#f7f8ff;padding:5px;font-size:95%;" |Quelle: Njema, G.G., Rono, N., Mosonik, B.C. et al. (2025): A r… | 1 |
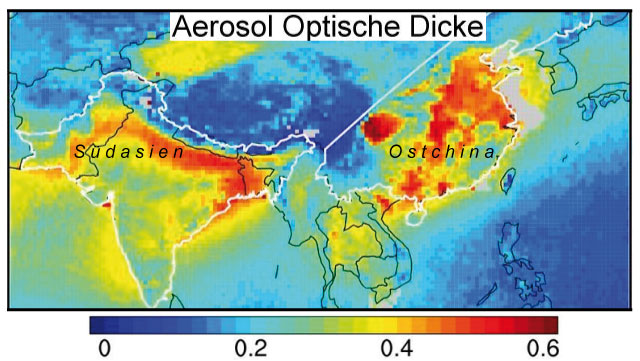
| 08:23, 9. Okt. 2025 | AOD Indien China.jpg (Datei) |  |
69 KB | 3 | |
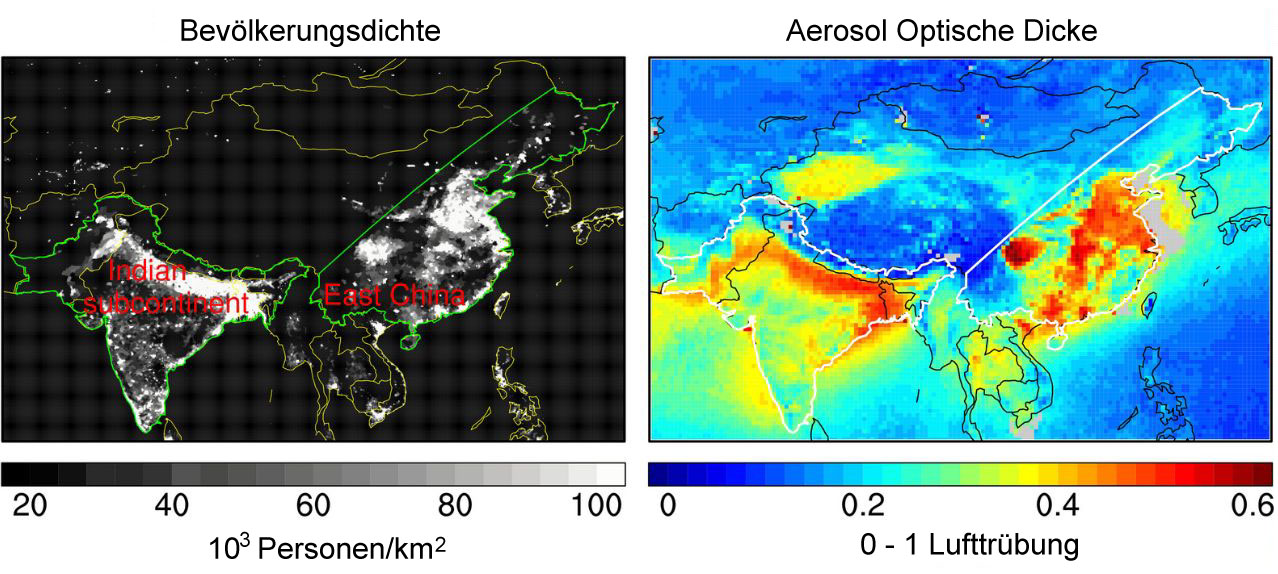
| 12:41, 8. Okt. 2025 | Indien-China population AOD.jpg (Datei) |  |
191 KB | 3 | |
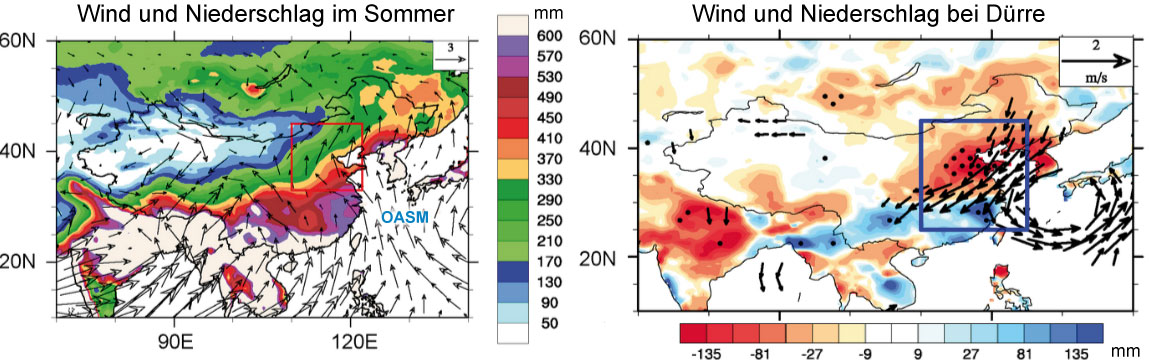
| 12:15, 8. Okt. 2025 | China-Monsun-Regen.jpg (Datei) |  |
127 KB | == Beschreibung == Monsunwinde und Niederschlag in normalen Sommern (links) sowie in den sechs trockensten Sommern in Nordchina (rechts). ==Lizenzhinweis== {| style="border:1px solid #8888aa; background-color:#f7f8ff;padding:5px;font-size:95%;" | Quelle: Zhang, L., P. Wu and T. Zhou (2017): Aerosol forcing of extreme summer drought over North China, Environmental Research Letters 12, 3, https://iopscience.iop.org/article/10.1088/1748-9326/aa5fb3 <br> Lizenz: [http://creativecommons.org/licenses… | 1 |
| 15:43, 6. Okt. 2025 | Positive Rückkopplung.jpg (Datei) |  |
61 KB | == Beschreibung == Beispiele für positive Rückkopplungen im Klimasystem ==Lizenzhinweis== {| style="border:1px solid #8888aa; background-color:#f7f8ff;padding:5px;font-size:95%;" | Quelle: Cook, J., Skeptical Science (2010): Wissenschaftlicher Leitfaden zur Klimaskepsis, https://skepticalscience.com/docs/Guide_Skepticism_German.pdf <br> Lizenz: CC BY-NC |} | 1 |
| 15:41, 6. Okt. 2025 | Positive negative Rückkopplung.jpg (Datei) |  |
81 KB | == Beschreibung == Beispiele für positive und negative Rückkopplungen im Klimasystem ==Lizenzhinweis== {| style="border:1px solid #8888aa; background-color:#f7f8ff;padding:5px;font-size:95%;" | Quelle: Cook, J., Skeptical Science (2010): Wissenschaftlicher Leitfaden zur Klimaskepsis, https://skepticalscience.com/docs/Guide_Skepticism_German.pdf <br> Lizenz: CC BY-NC |} | 1 |
| 16:45, 2. Okt. 2025 | Aerosole-Wolken-Strahlung2.jpg (Datei) |  |
68 KB | == Beschreibung == Veränderung von Wolken, Niederschlag und Strahlung durch Aerosole. Aerosole reflektieren Sonnenstrahlen (mitte) und sind fördern die Wolkenbildung, wodurch ebenfalls Sonnenstrahlung reflektiert wird (rechts). ==Lizenzhinweis== {| style="border:1px solid #8888aa; background-color:#f7f8ff;padding:5px;font-size:95%;" | Quelle: Eigene Darstellung; einige Elemente nach Zaveri, R.A., J. Wang, J. Fan et al. (2022): Rapid growth of anthropogenic organic nanoparticles greatly alters… | 1 |
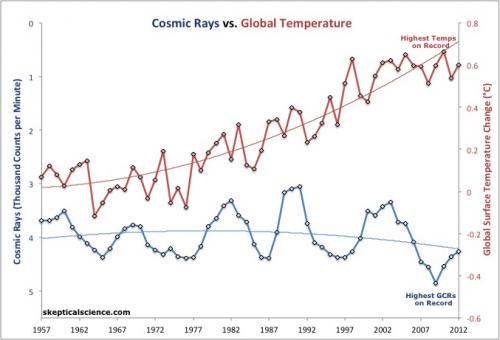
| 14:44, 25. Sep. 2025 | Cosmic rays temp.jpg (Datei) |  |
23 KB | == Beschreibung == Kosmische Strahlung und Temperaturänderung. Die kosmische Strahlung hat in den letzten Jahrzehnten leicht zugenommen. Das sollte einem verbreiteten Argument von Klimaskeptikern zufolge zu mehr Wolkenbildung und abnehmender Temperatur führen. Das Gegenteil ist jedoch der Fall. == Lizenzhinweis == {| style="border:1px solid #8888aa; background-color:#f7f8ff;padding:5px;font-size:95%;" |Quelle: SkepticalScience (o.J.): Galactic Cosmic Rays vs. Temps, https://skepticalscience.com… | 1 |
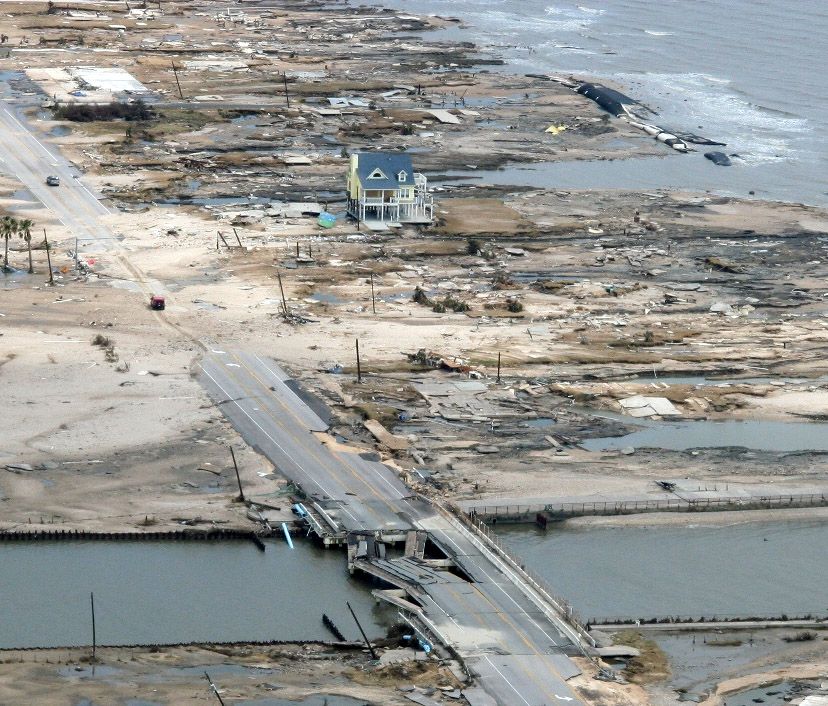
| 13:57, 25. Sep. 2025 | Dammage hurricane Ike.jpg (Datei) |  |
168 KB | Zerstörungen durch Hurrikan Ike (Sept. 2008). Ein hurrikanfestes Gebäude überstand den Sturm. ==Lizenzhinweis== {| style="border:1px solid #8888aa; background-color:#f7f8ff;padding:5px;font-size:95%;" | Quelle: NOAA (2023): Hurricane Damage Potential https://www.noaa.gov/jetstream/tc-potential<br> Lizenz: public domain |} | 1 |
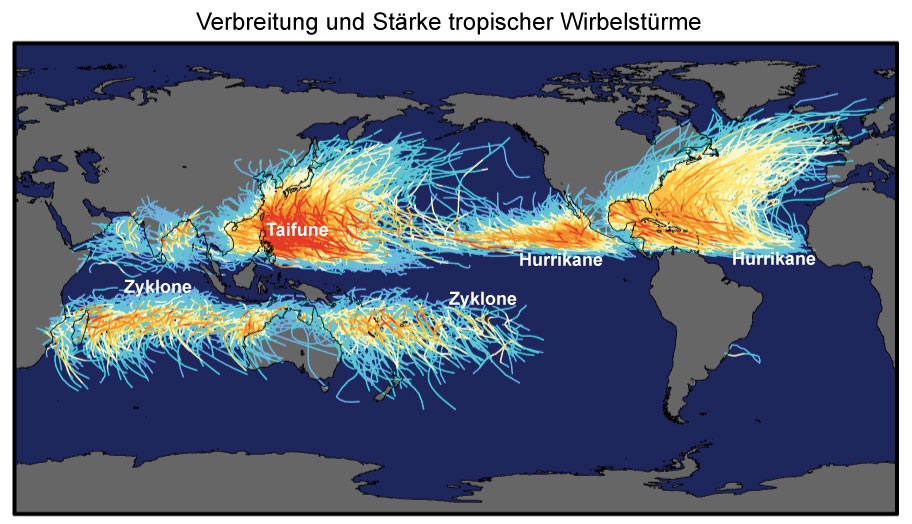
| 13:38, 25. Sep. 2025 | TC-Verbreitung.jpg (Datei) |  |
127 KB | 2 | |
| 09:59, 25. Sep. 2025 | Wiki-Statistik.jpg (Datei) |  |
40 KB | 2 | |
| 12:19, 24. Sep. 2025 | TvsTSI SkepticalScience-dt.jpg (Datei) |  |
74 KB | == Beschreibung == Änderung der globalen Mitteltemperatur (rot) und der Sonneneinstrahlung (blau) == Lizenzhinweis == {| style="border:1px solid #8888aa; background-color:#f7f8ff;padding:5px;font-size:95%;" |Quelle: SkepticalScience (o.J.): Sun & Climate: moving in opposite directions, https://skepticalscience.com/graphics.php?g=5, übersetzt<br> Lizenz: CC BY-SA |} | 1 |
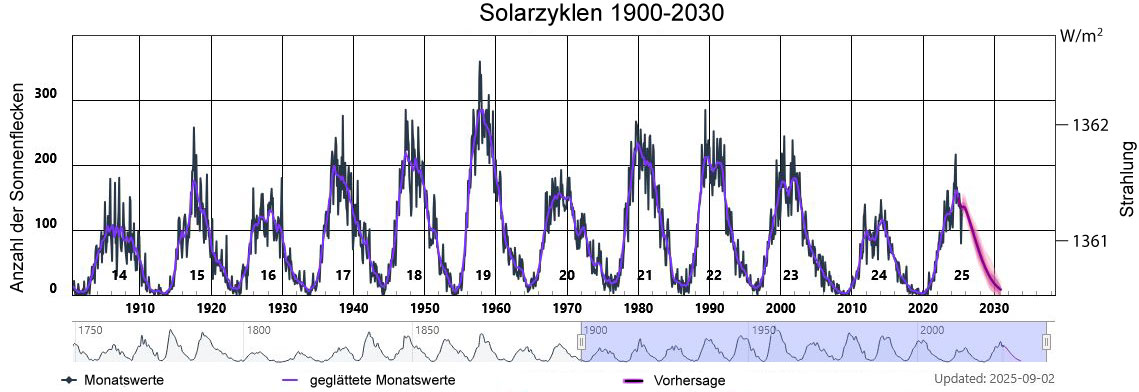
| 15:44, 22. Sep. 2025 | Solar-Cycle-Sunspot1900-2030.jpg (Datei) |  |
86 KB | == Beschreibung == Sonnenflecken und Sonnenstrahlung 1900-2030 == Lizenzhinweis == {| style="border:1px solid #8888aa; background-color:#f7f8ff;padding:5px;font-size:95%;" |Quelle: NOAA Space Weather Prediction Center (2025): Solar Cycle Progression, https://www.swpc.noaa.gov/products/solar-cycle-progression<br> Lizenz: public domain |} | 1 |
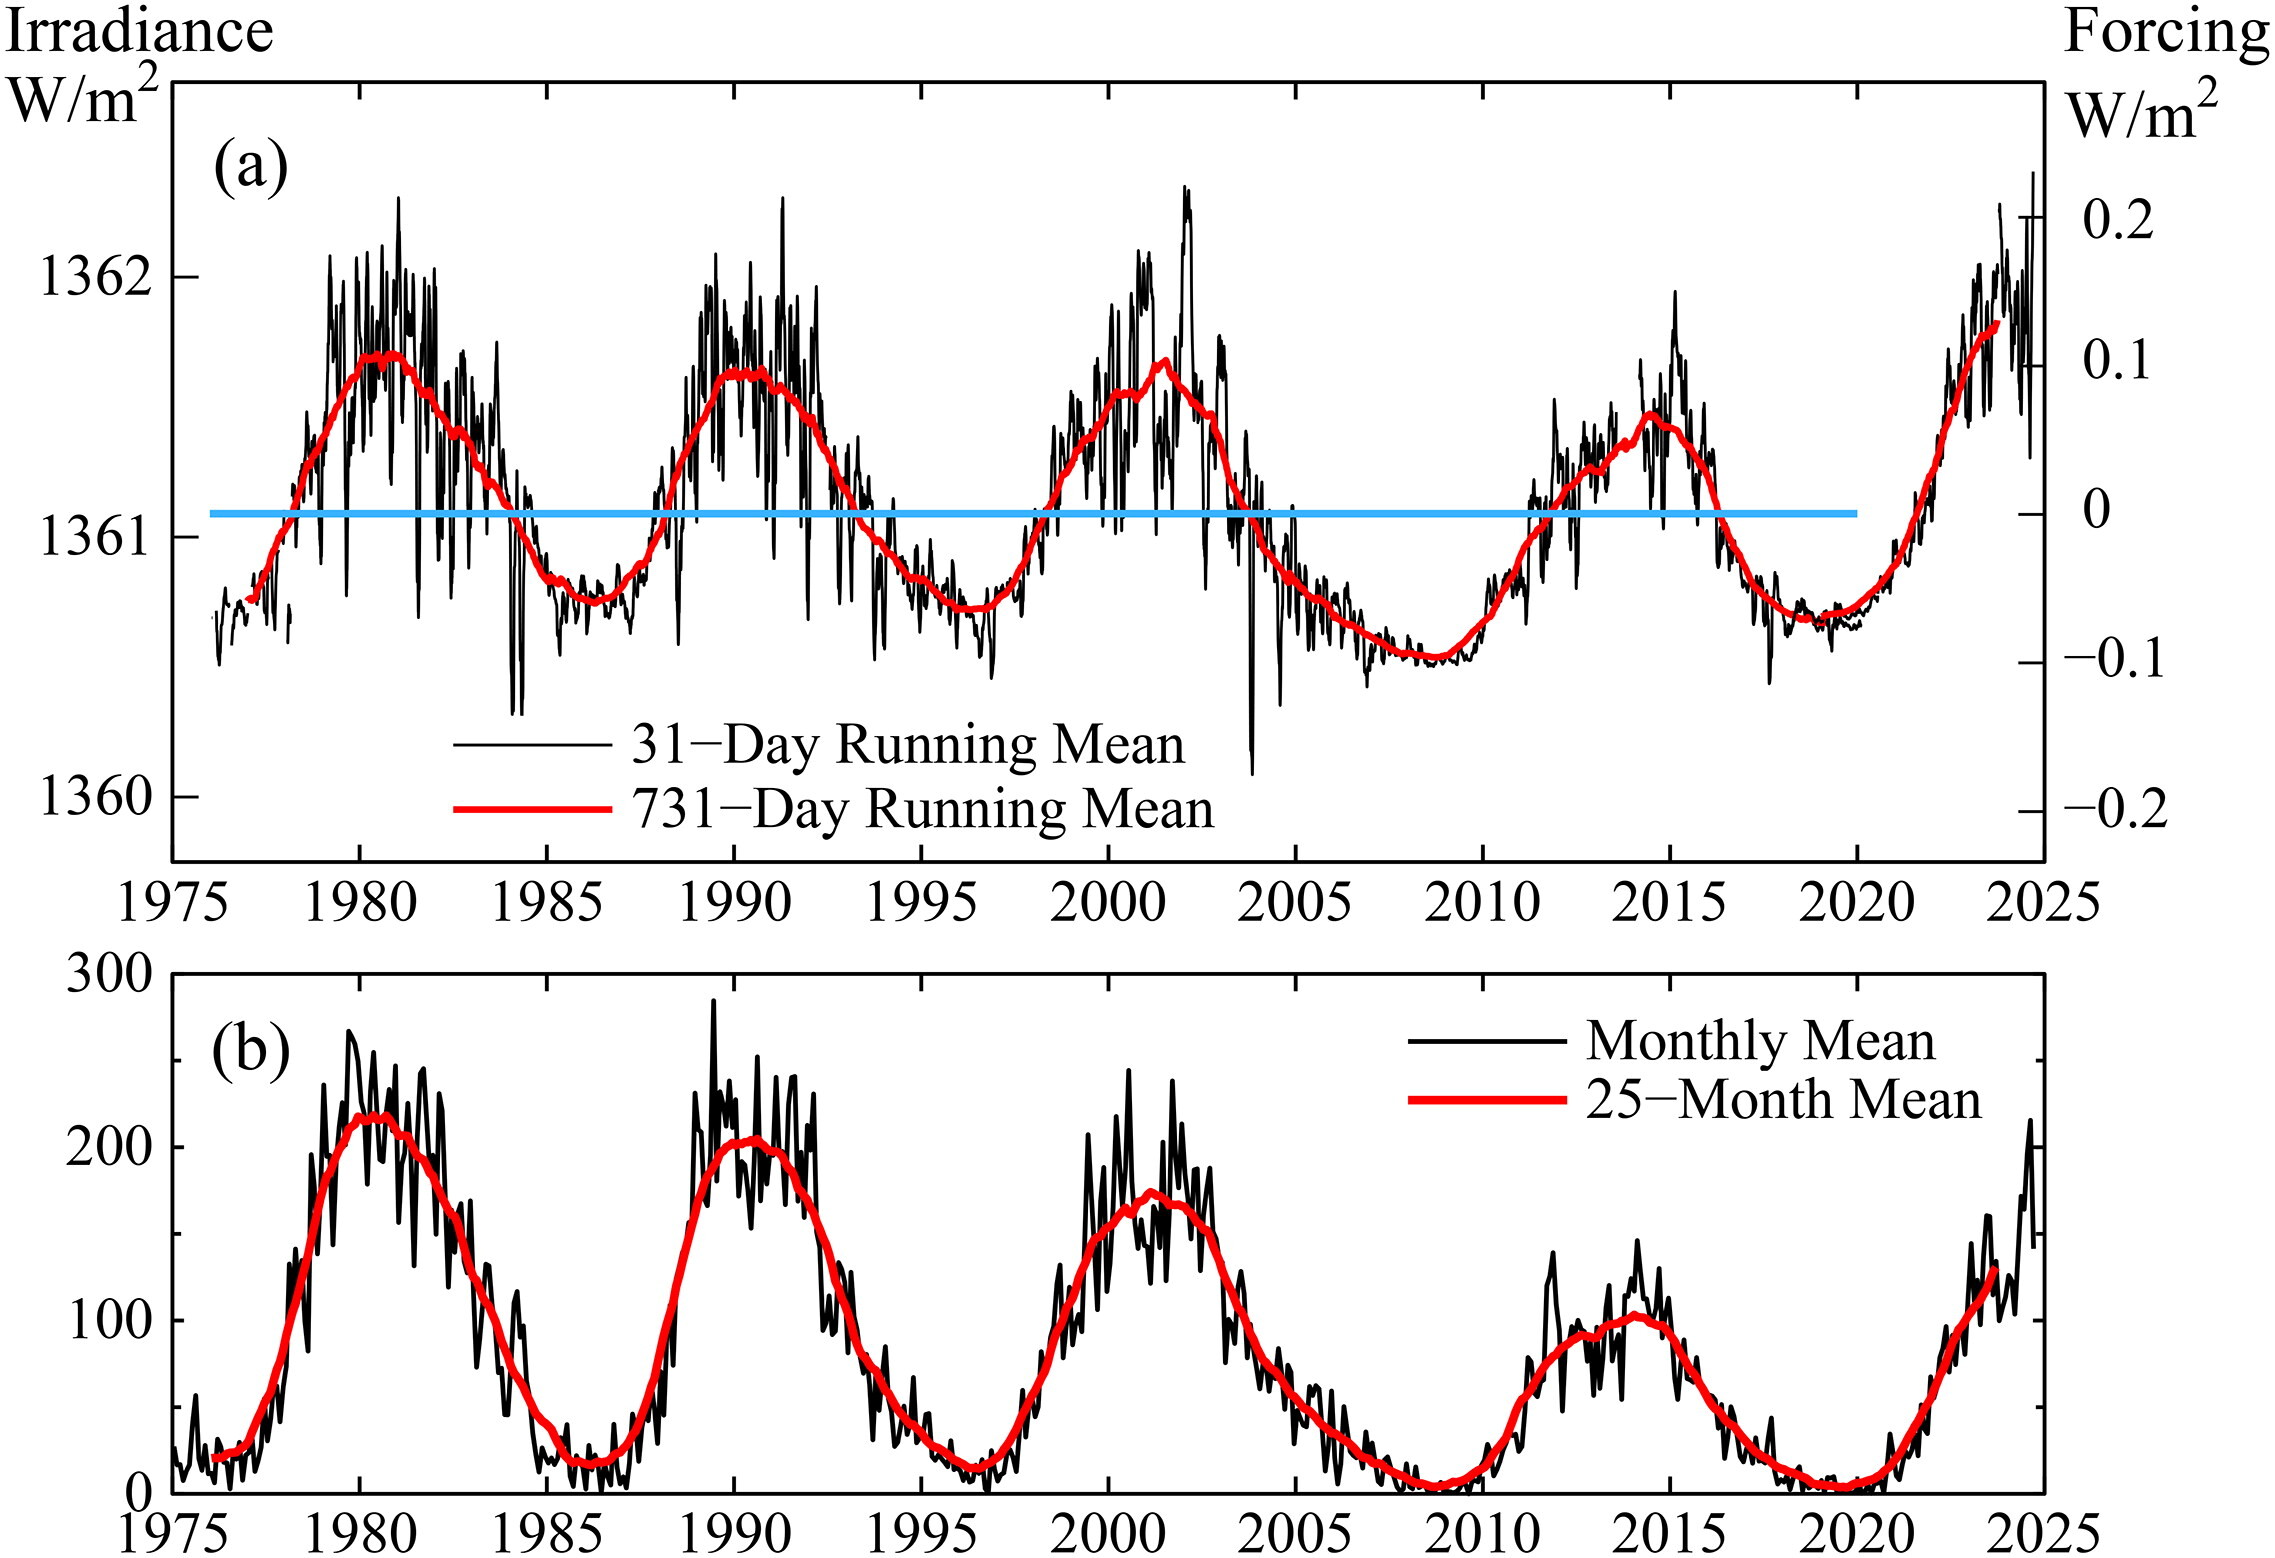
| 15:40, 22. Sep. 2025 | Solar irradiance 1975-2025.jpg (Datei) |  |
406 KB | Sonneneinstrahlung (oben) und Sonnenflecken (unten) 1975-2025 == Lizenzhinweis == {| style="border:1px solid #8888aa; background-color:#f7f8ff;padding:5px;font-size:95%;" |Quelle: Hansen, J. E., P. Kharecha, M. Sato et al. (2025): Global Warming Has Accelerated: Are the United Nations and the Public Well-Informed? Environment: Science and Policy for Sustainable Development, 67(1), 6–44. https://doi.org/10.1080/00139157.2025.2434494<br> Lizenz: CC BY http://creativecommons.org/licenses/by/4.0/… | 1 |
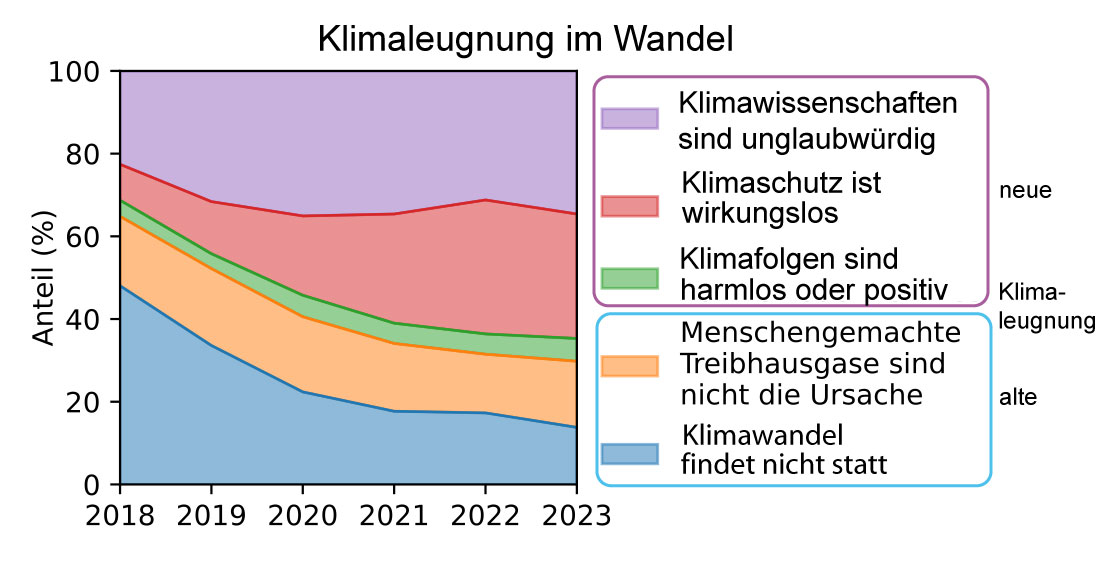
| 18:49, 21. Sep. 2025 | Klimaleugnung Wandel.jpg (Datei) |  |
86 KB | 3 | |
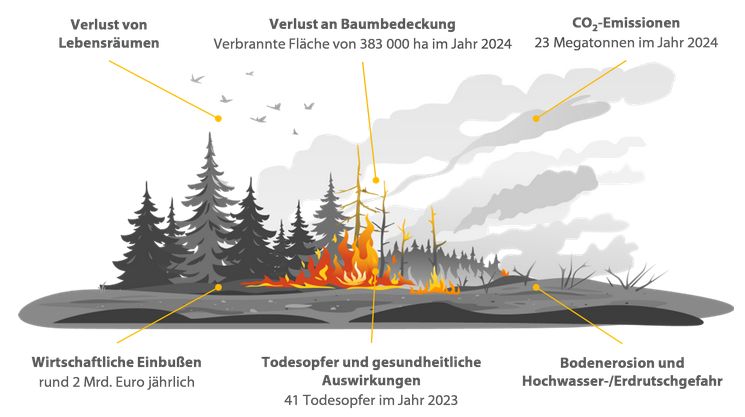
| 19:06, 20. Sep. 2025 | EU Auswirkungen Waldbrände.jpg (Datei) |  |
41 KB | == Beschreibung == Auswirkungen von Waldbränden in Europa ==Lizenzhinweis== {| style="border:1px solid #8888aa; background-color:#f7f8ff;padding:5px;font-size:95%;" | Quelle: Europäischer Rechnungshof (2025): Sonderbericht 16/2025: EU‑Mittel zur Bekämpfung von Waldbränden – Mehr Präventivmaßnahmen, aber unzureichende Belege für Ergebnisse und deren langfristige Nachhaltigkeit, https://www.eca.europa.eu/de/publications?ref=SR-2025-16 <br> Lizenz: CC BY 4.0 http://creativecommons.org/licenses/by/… | 1 |
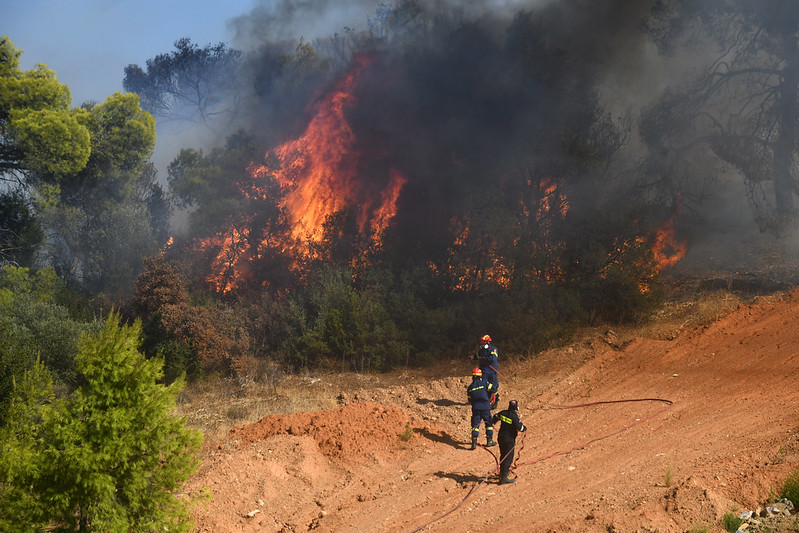
| 18:52, 20. Sep. 2025 | Fire fighting Aug 2025.jpg (Datei) |  |
171 KB | Kampf gegen das Feuer, 26.8.2025 Flickr (2025): Firefighters on standby: sharing expertise while saving lives, 26.8.2025 https://www.flickr.com/photos/eu_echo/54780045861/in/album-72177720328952615 Lizenz: https://creativecommons.org/licenses/by-nc-nd/4.0/deed.de | 1 |
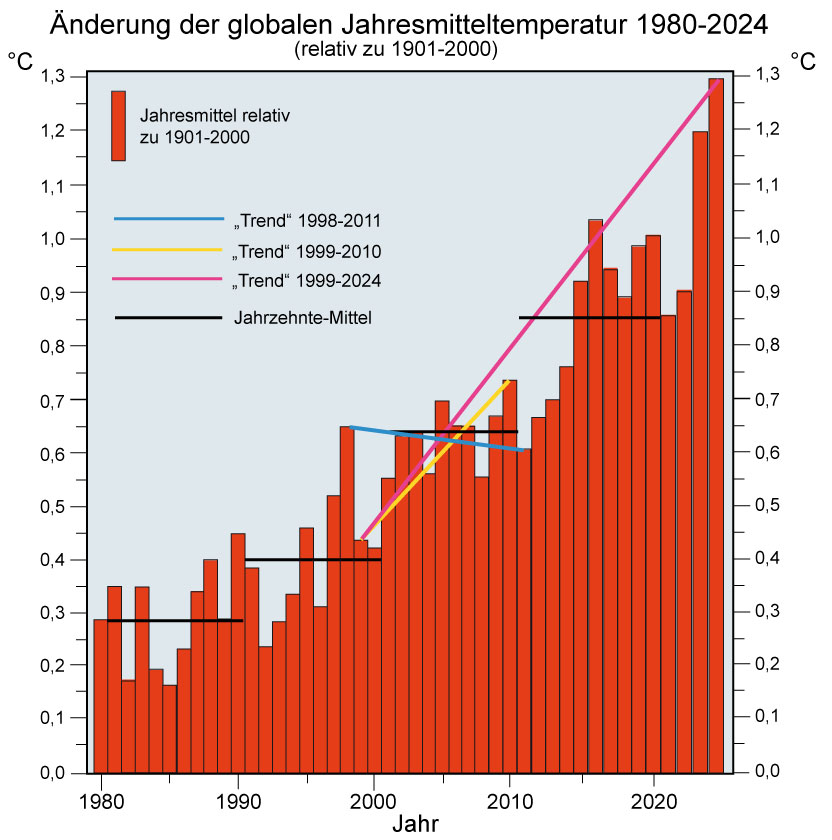
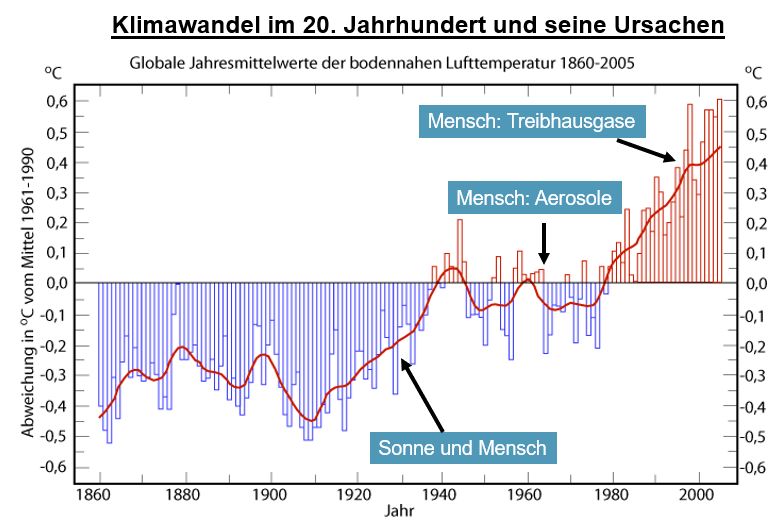
| 14:23, 19. Sep. 2025 | Temp-global-Klimapause.jpg (Datei) |  |
118 KB | == Beschreibung == Klimaänderungen im 20. Jahrhundert und ihre Ursachen == Lizenzhinweis == {| style="border:1px solid #8888aa; background-color:#f7f8ff;padding:5px;font-size:95%;" |Eigene Darstellung (D. Kasang). Daten nach National Oceanic and Atmospheric Administration: [https://www.ncdc.noaa.gov/cag/global/time-series Global Time Series] <br> Lizenz: CC BY-SA |} | 1 |
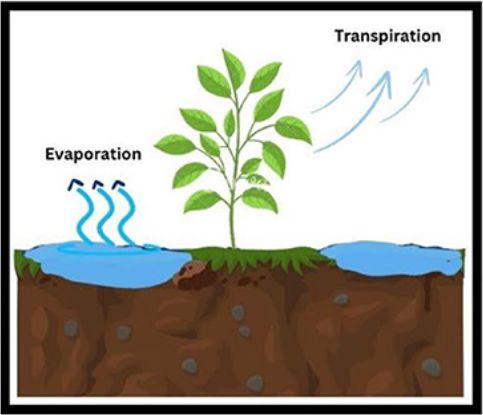
| 13:24, 18. Sep. 2025 | Evaporation-Transpiration.jpg (Datei) | 24 KB | == Beschreibung == Evapotranspiration bei Wald- und Grasbewuchs == Lizenzhinweis == {| style="border:1px solid #8888aa; background-color:#f7f8ff;padding:5px;font-size:95%;" | Quelle: Wikimedis Commons (2007): Conceptual diagram of near-surface hydrology, showing evapotranspiration, evaporation, transpiration, runoff, and recharge processes. https://commons.wikimedia.org/wiki/File:Surface_water_cycle.svg <br> Lizenz: CC BY |} | 1 | |
| 13:14, 18. Sep. 2025 | Wasserkreislauf boden.jpg (Datei) |  |
65 KB | 2 | |
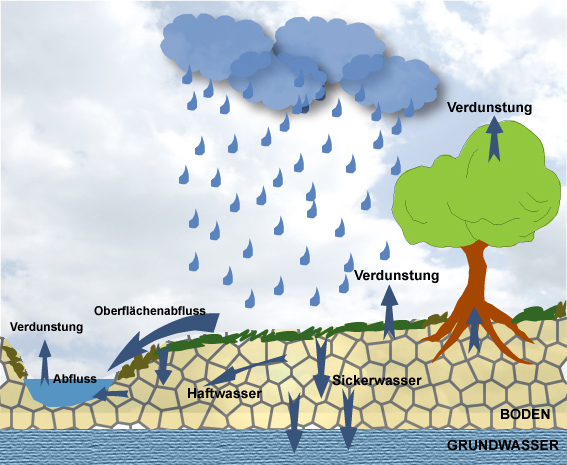
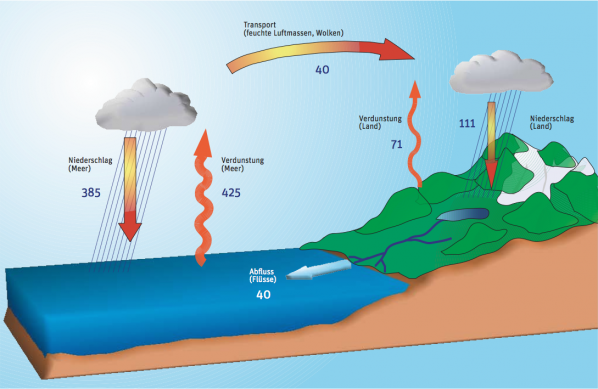
| 12:51, 18. Sep. 2025 | Wasserkreislauf klimafakten.png (Datei) |  |
270 KB | Der Wasserkreislauf bildet eine der Hauptkomponenten des irdischen Wetter- und Klimasystems. Die Zahlen bezeichnen den Wassertransport in Billionen Kubikmeter pro Jahr. ==Lizenzhinweis== {| style="border:1px solid #8888aa; background-color:#f7f8ff;padding:5px;font-size:95%;" | Quelle: Lemke, P., klimafakten.de (2015): Die Wetter- und Klimamaschine. Eine Einführung, https://www.klimafakten.de/kommunikation/die-wetter-und-klimamaschine-eine-einfuehrung <br> Lizenz: CC BY 4.0 https://creativecommo… | 1 |
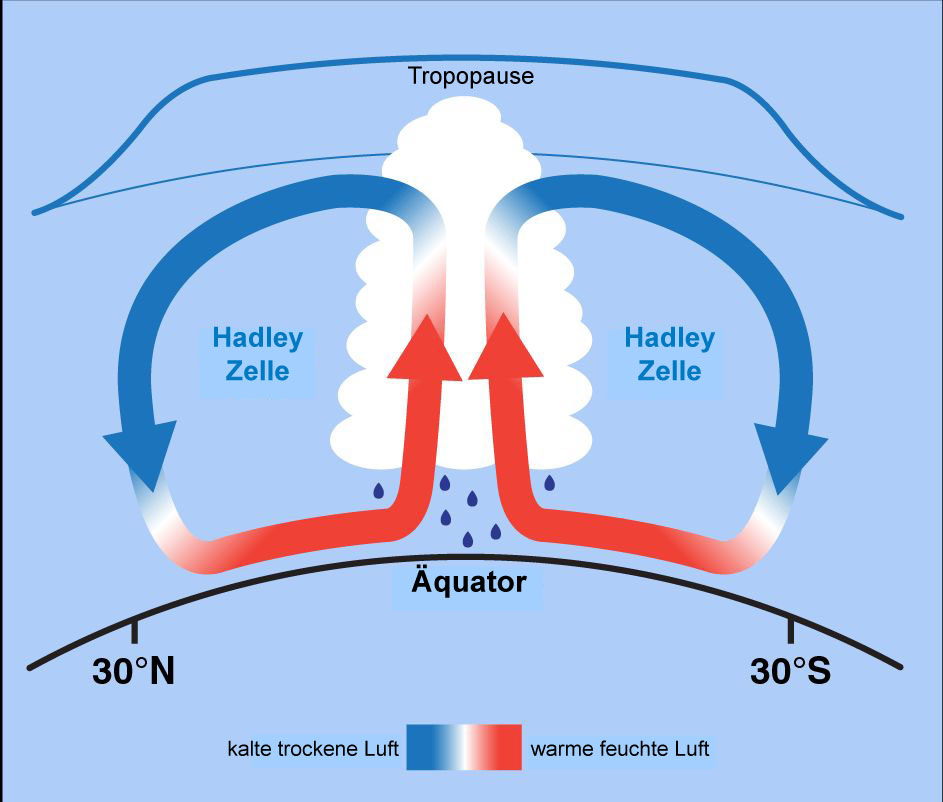
| 12:23, 18. Sep. 2025 | Hadley Zelle.jpg (Datei) |  |
77 KB | == Beschreibung == Die Hadley-Zelle ==Lizenzhinweis== {| style="border:1px solid #8888aa; background-color:#f7f8ff;padding:5px;font-size:95%;" | Quelle: NOAA SciJinks (o.J.): [https://scijinks.gov/jet-stream/ What Is the Jet Stream?]<br> Lizenz: public domain |} | 1 |
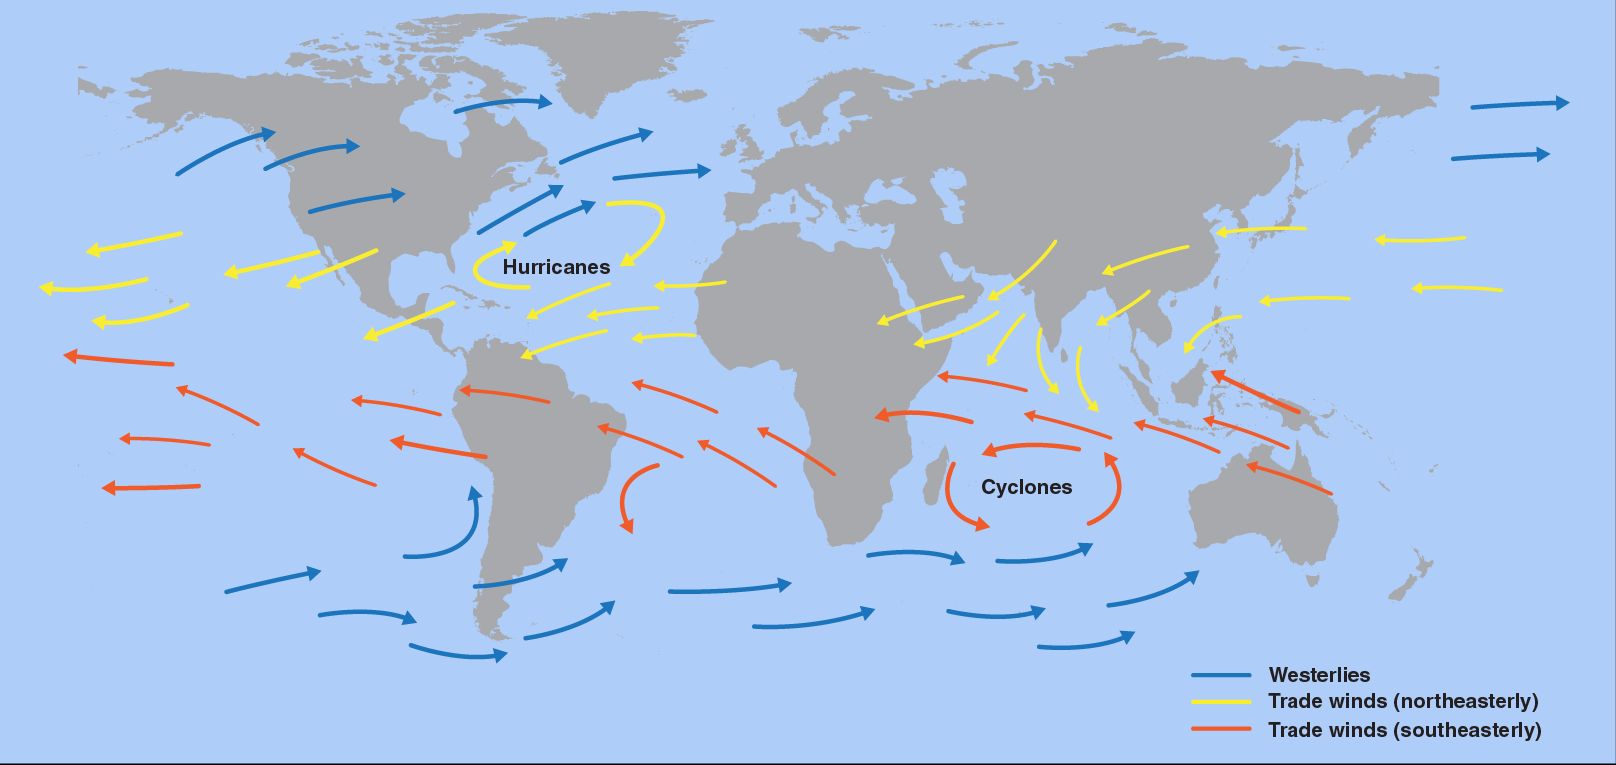
| 12:02, 18. Sep. 2025 | Passat- und Westwinde.jpg (Datei) |  |
83 KB | == Beschreibung == Wichtige Windsysteme auf der Erde: Passat- und Westwinde ==Lizenzhinweis== {| style="border:1px solid #8888aa; background-color:#f7f8ff;padding:5px;font-size:95%;" | Quelle: NOAA SciJinks (o.J.): Trade Winds https://scijinks.gov/trade-winds/ <br> Lizenz: public domain |} | 1 |
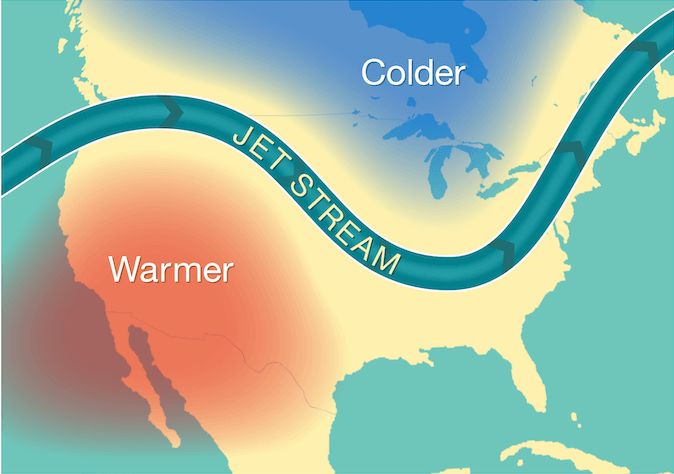
| 11:52, 18. Sep. 2025 | Jetstream over N-America.jpg (Datei) |  |
36 KB | == Beschreibung == Der Jetstream über Nordamerika ==Lizenzhinweis== {| style="border:1px solid #8888aa; background-color:#f7f8ff;padding:5px;font-size:95%;" | Quelle: NOAA SciJinks (o.J.): What Is the Jet Stream? https://scijinks.gov/jet-stream/<br> Lizenz: public domain |} | 1 |
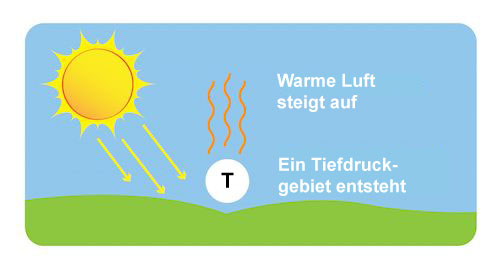
| 11:00, 18. Sep. 2025 | Tiefdruck.jpg (Datei) |  |
19 KB | 4 | |
| 10:27, 18. Sep. 2025 | Heat-distribution-on-earth.png (Datei) |  |
36 KB | Die Sonne erwärmt die Erde ungleichmäßig und erzeugt kältere Luftmassen in der Nähe der Pole und wärmere Luftmassen in der Nähe des Äquators. == Lizenzhinweis == {| style="border:1px solid #8888aa; background-color:#f7f8ff;padding:5px;font-size:95%;" |Quelle: NOAA SciJinks (2025): What Is the Jet Stream?, https://scijinks.gov/jet-stream/ (Migration nach: https://www.nesdis.noaa.gov/about/k-12-education/scijinks) <br> Lizenz: CC BY-SA https://creativecommons.org/licenses/by-sa/4.0/deed.en |} | 1 |
| 19:59, 17. Sep. 2025 | Klimawandel 20. Jahrhundert.jpg (Datei) |  |
61 KB | Klimaänderungen im 20. Jahrhundert und ihre Ursachen == Lizenzhinweis == {| style="border:1px solid #8888aa; background-color:#f7f8ff;padding:5px;font-size:95%;" |Eigene Darstellung (D. Kasang). Daten nach National Oceanic and Atmospheric Administration: [https://www.ncdc.noaa.gov/cag/global/time-series Global Time Series] <br> Lizenz: CC BY-SA |} | 1 |
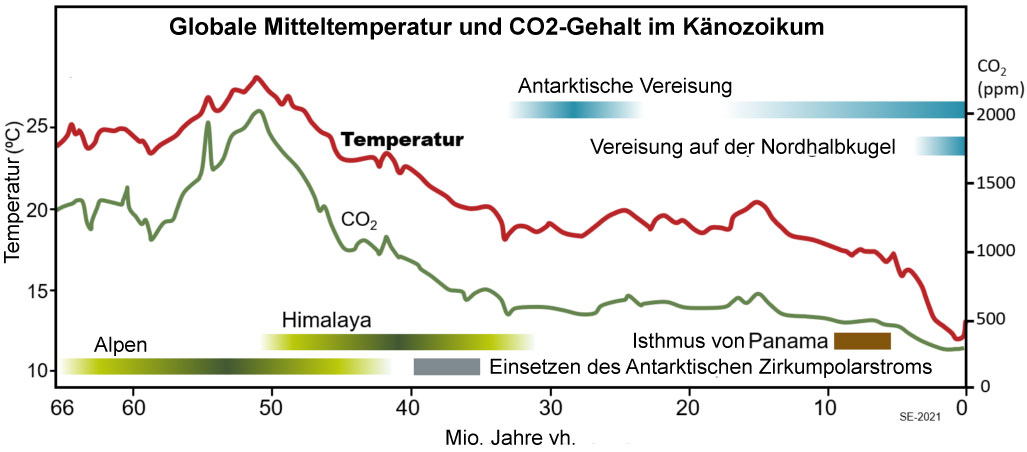
| 09:11, 17. Sep. 2025 | Temp-CO2-Erdneuzeit.jpg (Datei) |  |
69 KB | == Beschreibung == Änderung de Temperatur und des CO2-Gehalts im Kontext tektonischer Ereignisse. ==Lizenzhinweis== {| style="border:1px solid #8888aa; background-color:#f7f8ff;padding:5px;font-size:95%;" |Quelle: Earle, S.: Plate Tectonics and Climate Change, https://environmental-geol.pressbooks.tru.ca/chapter/plate-tectonics-and-climate-change/ <br> Lizenz: CC BY 4.0 https://creativecommons.org/licenses/by/4.0/ |} | 1 |
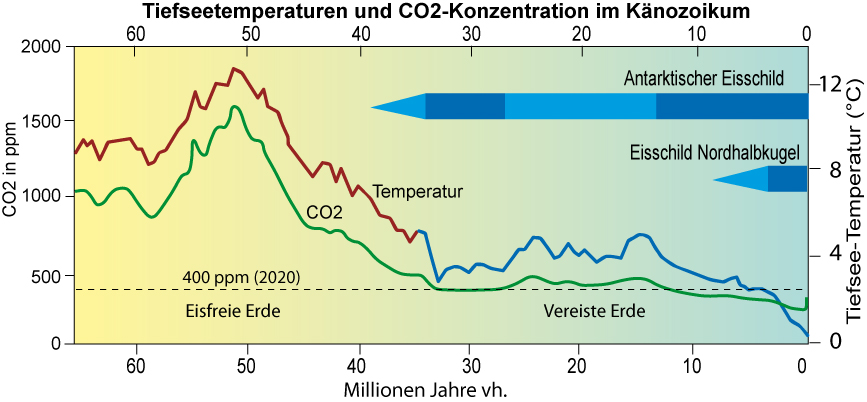
| 16:45, 16. Sep. 2025 | Temp CO2 60mio.jpg (Datei) |  |
144 KB | Der CO2-Gehalt kontrolliert langfristige Klimaänderungen. Hier ist zum Vergleich mit dem CO2-Gehalt die Tiefseetemperatur sowie die Intensität der Vereisung hoher Breiten auf beiden Erdhälften für die vergangenen etwa 65 Mill. Jahre dargestellt. (eigene Darstellung nach HANSEN et al. 2013, CC BY) ==Lizenzhinweis== {| style="border:1px solid #8888aa; background-color:#f7f8ff;padding:5px;font-size:95%;" |Quelle: Hansen, J., M. Sato, G. Russell, and P. Kharecha (2013): Climate sensitivity, sea lev… | 1 |
| 13:19, 16. Sep. 2025 | Temp-last65-Mio,years.jpg (Datei) |  |
38 KB | == Beschreibung == Globale Mitteltemperatur in den letzten 65 Mio. Jahren == Lizenzhinweis == {| style="border:1px solid #8888aa; background-color:#f7f8ff;padding:5px;font-size:95%;" |Quelle: NOAA Climate.gov (2025): What’s the hottest Earth’s ever been?, https://archive.ph/uLI64#selection-859.0-859.37 <br> Lizenz: public domain | 1 |
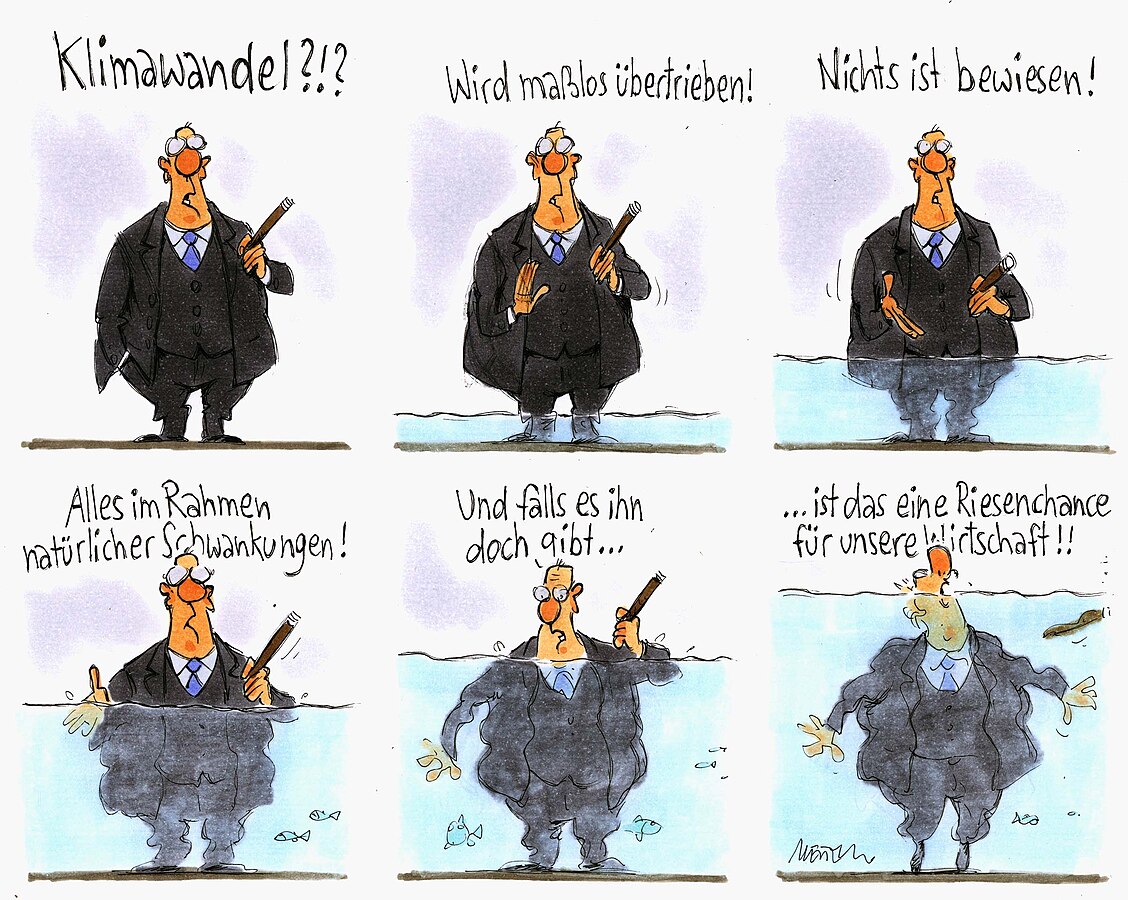
| 20:10, 15. Sep. 2025 | Karikatur Klimaleugnung.jpg (Datei) |  |
258 KB | == Beschreibung == Ein Klimawandelleugner in Not! == Lizenzhinweis == {| style="border:1px solid #8888aa; background-color:#f7f8ff;padding:5px;font-size:95%;" |Quelle: Wikipedia (2013): Karikatur von Gerhard Mester zum Klimawandel, https://de.wikipedia.org/wiki/Datei:Karikatur_von_Gerhard_Mester_zum_Thema_Klimawandel_gibt_es_nicht_O12816.jpg<br> Lizenz: CC BY-SA https://creativecommons.org/licenses/by-sa/4.0/deed.de Lizenz: [https://creativecommons.org/licenses/by-nc-nd/4.0/deed.de CC BY-NC-ND… | 1 |
| 11:03, 14. Sep. 2025 | Wildfire NW-Spain August 2025b.jpg (Datei) |  |
44 KB | == Beschreibung == Waldbrände in Nordwest-Spanien im August 2025 == Lizenzhinweis == {| style="border:1px solid #8888aa; background-color:#f7f8ff;padding:5px;font-size:95%;" |Quelle: Flickr, wckitchen (2025): [https://flickr.com/photos/wckitchen/54719407467/in/album-72177720328343379 WCK Teams Serve in Ourense Province During Wildfires]<br> Lizenz: [https://creativecommons.org/licenses/by/4.0/deed.de CC BY 4.0] |} | 1 |
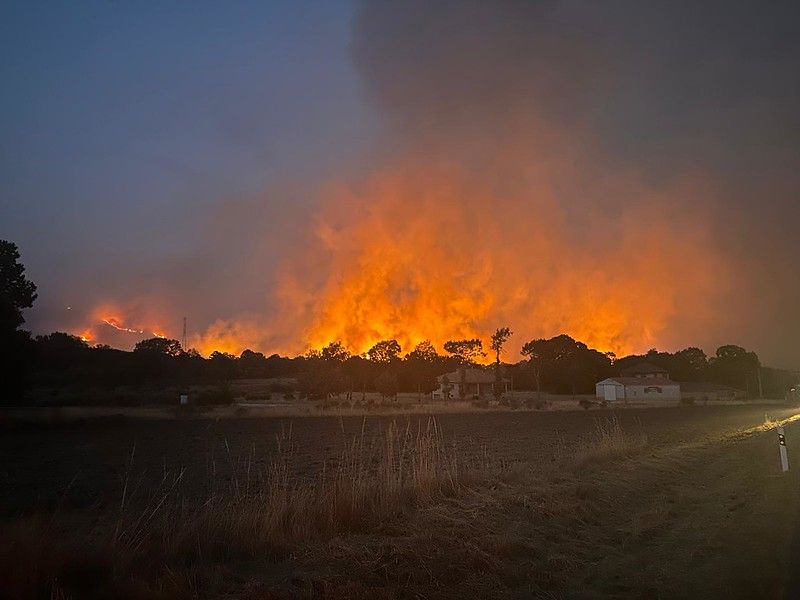
| 11:01, 14. Sep. 2025 | Wildfire NW-Spain August 2025.jpg (Datei) |  |
69 KB | == Beschreibung == Waldbrände bedrohen ein Dorf in Nordwest-Spanien im August 2025 == Lizenzhinweis == {| style="border:1px solid #8888aa; background-color:#f7f8ff;padding:5px;font-size:95%;" |Quelle: Flickr, wckitchen (2025): [https://flickr.com/photos/wckitchen/54719408052/in/album-72177720328343379 WCK Teams Serve in Ourense Province During Wildfires]<br> Lizenz: [https://creativecommons.org/licenses/by/4.0/deed.de CC BY 4.0] |} | 1 |
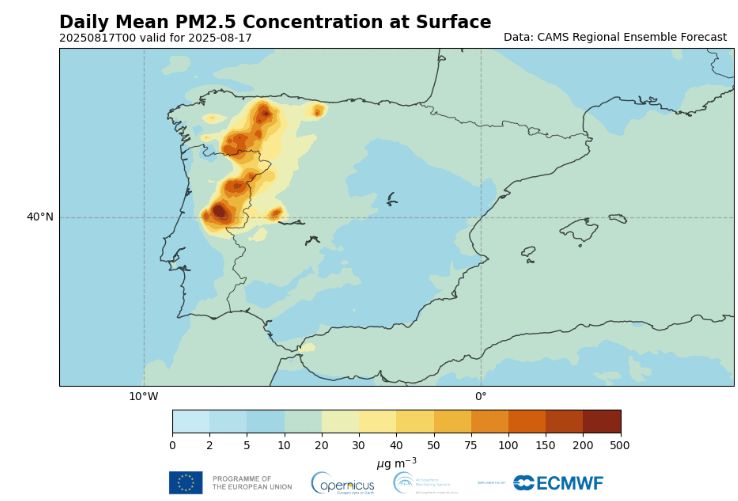
| 10:58, 14. Sep. 2025 | Spain 2025 particulate matter PM2.5.jpg (Datei) |  |
40 KB | == Beschreibung == Verbreitung der Brände in Nordwest-Spanien und Nord-Portugal am 17.8.2025, gezeigt anhand von Feinstaubpartikeln. == Lizenzhinweis == {| style="border:1px solid #8888aa; background-color:#f7f8ff;padding:5px;font-size:95%;" |Quelle: Flickr, wckitchen (2025): WCK Teams Serve in Ourense Province During Wildfires, https://flickr.com/photos/wckitchen/54719408052/in/album-72177720328343379<br> Lizenz: CC BY 4.0 https://creativecommons.org/licenses/by/4.0/deed.de |} | 1 |
| 10:11, 14. Sep. 2025 | Wildfire-Cyprus-2025b.jpg (Datei) |  |
83 KB | == Beschreibung == Waldbrände auf Zypern bei Malia in der Provinz Limassol am 24.7.2025. == Lizenzhinweis == {| style="border:1px solid #8888aa; background-color:#f7f8ff;padding:5px;font-size:95%;" |Quelle: Wikimedia Commons (2025): Fire in the Malia area of Limassol, Cyprus at night, https://commons.wikimedia.org/wiki/File:Malia_fire_Limassol_2025.jpg <br> Lizenz: [https://creativecommons.org/licenses/by-sa/4.0/deed.en CC BY-SA] Eimgefügte Karte: Wikipedia: Positionskarte von Zypern, https://e… | 1 |
| 09:27, 14. Sep. 2025 | Waldbrände-Zypern-2006-2025.jpg (Datei) |  |
65 KB | == Beschreibung == Verbrannte Fläche und Anzahl der Brände auf Zypern 2006-2025. Berücksichtigt sind Brände ab 30 ha. == Lizenzhinweis == {| style="border:1px solid #8888aa; background-color:#f7f8ff;padding:5px;font-size:95%;" |Quelle: EFFIS Annual Statistics (2025): EFFIS Estimates for European Union, Cyprus https://forest-fire.emergency.copernicus.eu/apps/effis.statistics/estimates/<br> Lizenz: [http://creativecommons.org/licenses/by/4.0/ CC BY 4.0] |} | 1 |
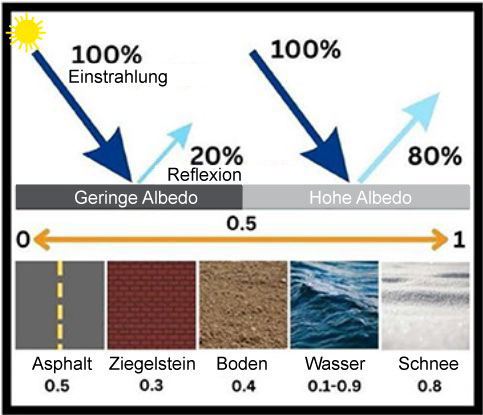
| 09:57, 10. Sep. 2025 | Albedo-Oberflächen.jpg (Datei) |  |
39 KB | == Beschreibung == Reflektion der Sonneneinstrahlung bei geringer und hoher Albedo (oben) und Albedo von verschiedenen Oberflächen (unten) == Lizenzhinweis == {| style="border:1px solid #8888aa; background-color:#f7f8ff;padding:5px;font-size:95%;" |Quelle: Alzahrani, S., S. Ullah and S.G. Al-Ghamdi (2025): How Can We Cool Warming Cities Using Nature-Based Solutions? Front. Young Minds, https://kids.frontiersin.org/articles/10.3389/frym.2025.1395250<br> Lizenz: [CC BY http://creativecommons.org… | 1 |
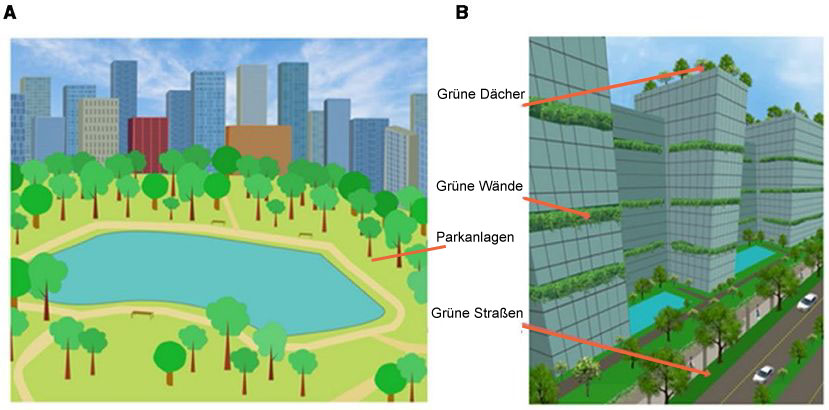
| 09:19, 10. Sep. 2025 | Abkühlung Städte.jpg (Datei) |  |
65 KB | 2 | |
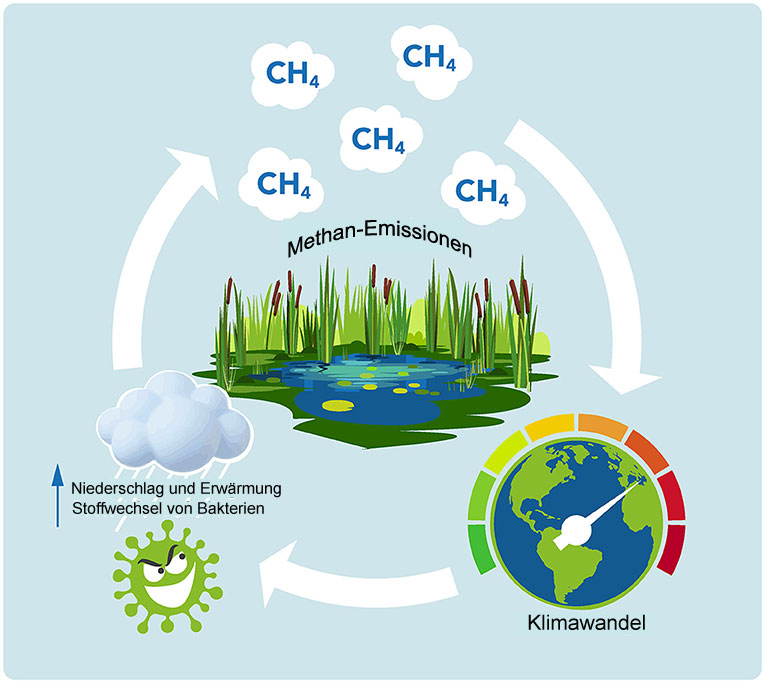
| 17:13, 9. Sep. 2025 | Methan-Emissionen-cc.jpg (Datei) |  |
80 KB | == Beschreibung == Das Klimasystem und seine Subsysteme: Atmosphäre, Hydrosphäre, Kryosphäre und Lithosphäre ==Lizenzhinweis== {| style="border:1px solid #8888aa; background-color:#f7f8ff;padding:5px;font-size:95%;" | Quelle: Regoto, P., C. Burgard & C. Jones (2022): [https://kids.frontiersin.org/articles/10.3389/frym.2022.671886 What Do We Mean by “Climate” and “Climate Change”?]. Front. Young Minds, übersetzt<br> Lizenz: [https://creativecommons.org/licenses/by/4.0/ CC BY] |} | 1 |
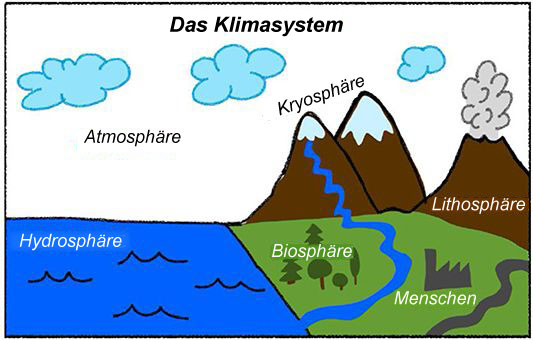
| 13:03, 9. Sep. 2025 | Klimasystem-Subsysteme.jpg (Datei) |  |
42 KB | == Beschreibung == Das Klimasystem und seine Subsysteme: Atmosphäre, Hydrosphäre, Kryosphäre und Lithospäre ==Lizenzhinweis== {| style="border:1px solid #8888aa; background-color:#f7f8ff;padding:5px;font-size:95%;" | Quelle: Regoto, P., C. Burgard & C. Jones (2022): What Do We Mean by “Climate” and “Climate Change”?. Front. Young Minds. https://kids.frontiersin.org/articles/10.3389/frym.2022.671886<br> Lizenz: [https://creativecommons.org/licenses/by/4.0/ CC BY] |} | 1 |
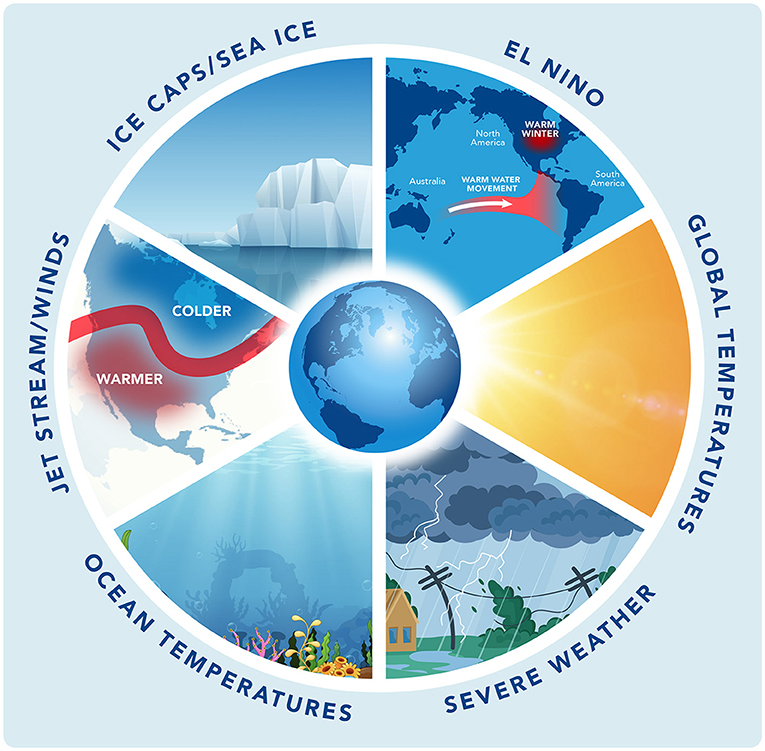
| 10:04, 9. Sep. 2025 | Climate system teleconnections.jpg (Datei) |  |
409 KB | == Beschreibung == Das Klima der Erde ist äußerst komplex und besteht aus vielen Komponenten, die sich über Fernwirkungen gegenseitig beeinflussen. Ein Beispiel: Riesige Luftströme, sogenannte Jetstreams, werden durch den Temperaturunterschied zwischen dem Äquator (wo es sehr warm ist) und den Polen (wo es sehr kalt ist) beeinflusst. Da die Temperaturen in den Polarregionen durch die globale Erwärmung stärker steigen als anderswo, ändert sich der Temperaturunterschied zwischen den Polen und dem… | 1 |
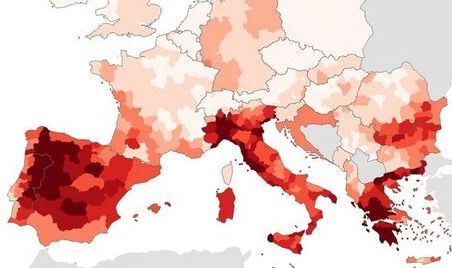
| 15:19, 22. Aug. 2025 | EU Todesfälle Hitze 2022.jpg (Datei) |  |
24 KB | == Beschreibung == Todesfälle durch Hitze pro Mio. Einwohner im Sommer 2022 ==Lizenzhinweis== {| style="border:1px solid #8888aa; background-color:#f7f8ff;padding:5px;font-size:95%;" | Quelle: Ausschnitt aus: Ballester, J., M. Quijal-Zamorano, R.F. Méndez Turrubiates et al. (2023): Heat-related mortality in Europe during the summer of 2022. Nat Med 29, 1857–1866. https://doi.org/10.1038/s41591-023-02419-z <br> Lizenz: CC BY http://creativecommons.org/licenses/by/4.0/ |} | 1 |
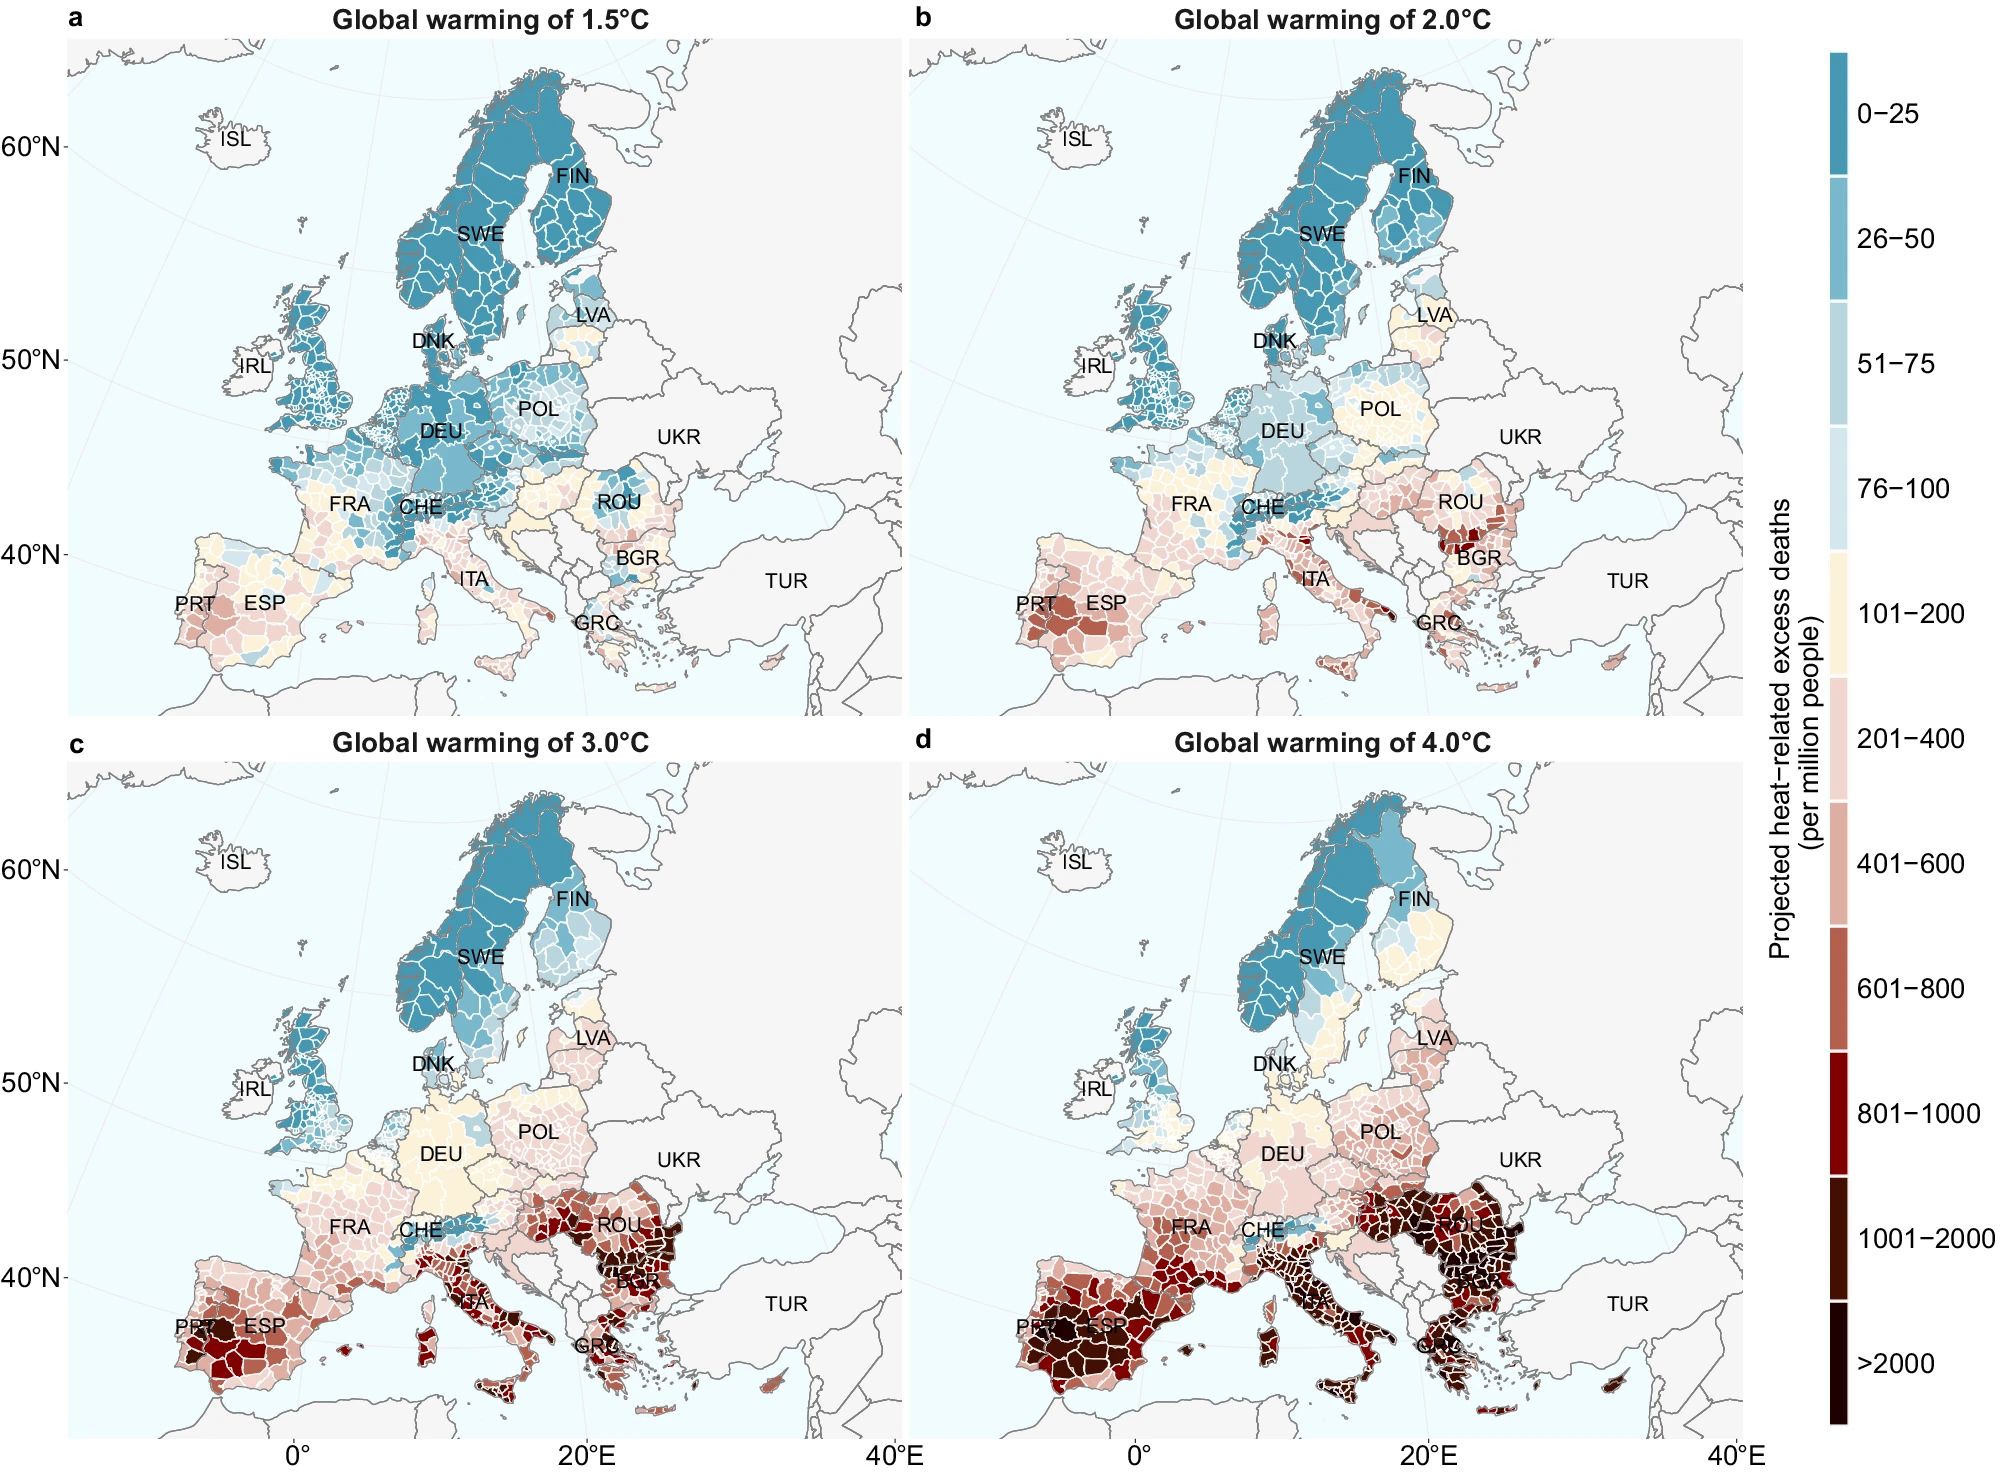
| 18:45, 17. Aug. 2025 | Global Warming Todesfälle EU.jpg (Datei) |  |
398 KB | == Beschreibung == Hitzebedingte Todesfälle pro Million Einwohner bei einer globalen Erwärmung von (a) 1,5 °C, (b) 2,0 °C, (c) 3,0 °C und (d) 4,0 °C. ==Lizenzhinweis== {| style="border:1px solid #8888aa; background-color:#f7f8ff;padding:5px;font-size:95%;" | Quelle: Wu, X., J. Wang, Y. Ge et al. (2025): Future heat-related mortality in Europe driven by compound day-night heatwaves and demographic shifts. Nat Commun 16, 7420 https://doi.org/10.1038/s41467-025-62871-y <br> Lizenz: CC BY-NC-ND… | 1 |