Von Dieter Kasang hochgeladene Dateien
Aus Klimawandel
Diese Spezialseite listet alle hochgeladenen Dateien auf.
| Datum | Name | Vorschaubild | Größe | Beschreibung | Versionen |
|---|---|---|---|---|---|
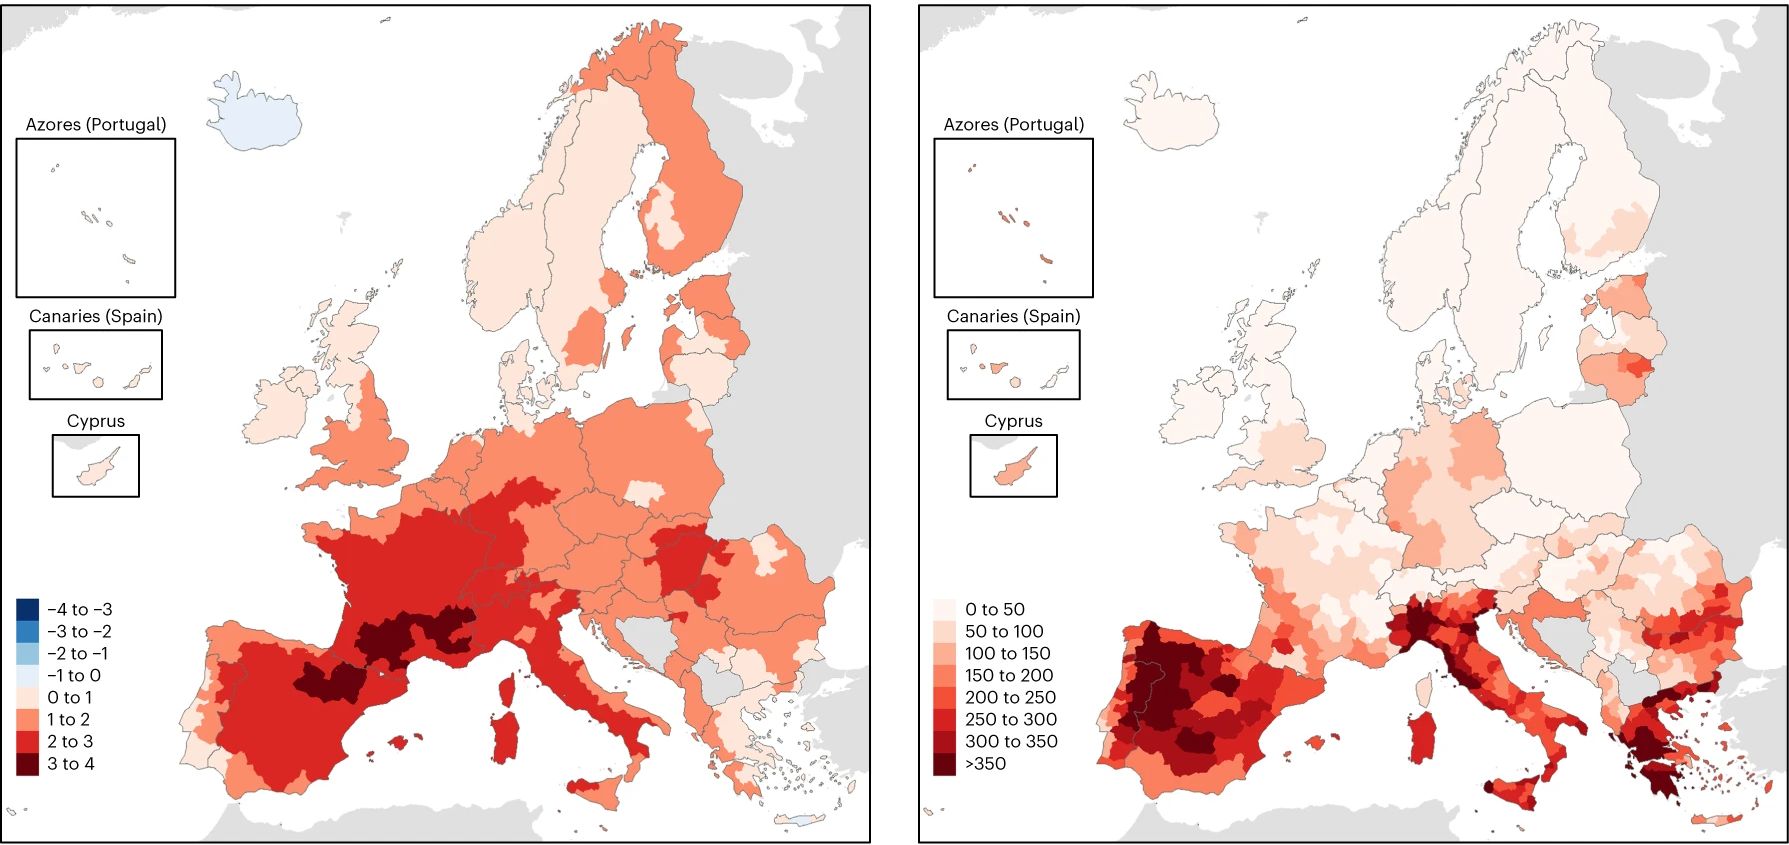
| 18:29, 17. Aug. 2025 | Temp Todesfälle 2022.jpg (Datei) |  |
169 KB | == Beschreibung == Links: Sommertemperatuen 2022 im Vergleich zum Mittel 1991-2020; rechts: Todesfälle durch Hitze pro Mio. Einwohner im Sommer 2022 ==Lizenzhinweis== {| style="border:1px solid #8888aa; background-color:#f7f8ff;padding:5px;font-size:95%;" | Quelle: Ballester, J., M. Quijal-Zamorano, R.F. Méndez Turrubiates et al. (2023): Heat-related mortality in Europe during the summer of 2022. Nat Med 29, 1857–1866. https://doi.org/10.1038/s41591-023-02419-z <br> Lizenz: CC BY http://cr… | 1 |
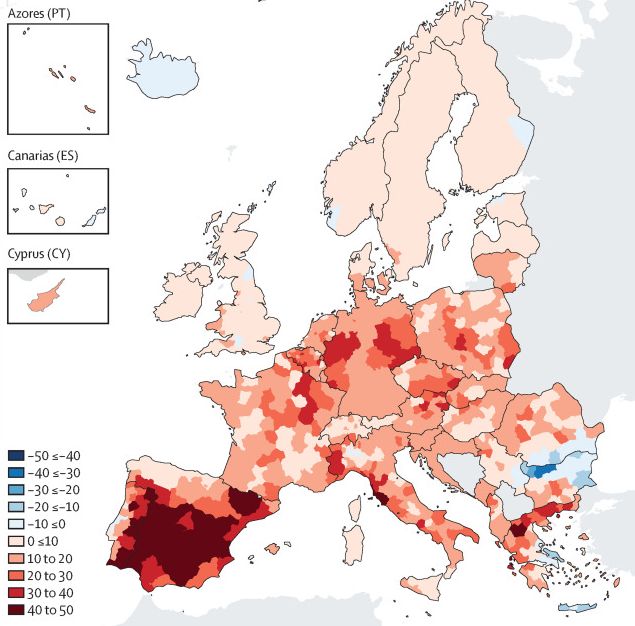
| 18:10, 17. Aug. 2025 | Hitzetote Eu 2000-2020.jpg (Datei) |  |
67 KB | == Beschreibung == Änderung der Sommertemperaturen in Europa relativ zu 1991-2020 ==Lizenzhinweis== {| style="border:1px solid #8888aa; background-color:#f7f8ff;padding:5px;font-size:95%;" | Quelle: Copernicus Climate Change (2024): C3S seasonal lookback: summer 2024, https://climate.copernicus.eu/c3s-seasonal-lookback-summer-2024 <br> Lizenz: [https://climate.copernicus.eu/disclaimer-and-privacy Reproduction of the publically available content of this website is authorised, provided the so… | 1 |
| 17:21, 17. Aug. 2025 | Eu summer temp 1979-2024.jpg (Datei) |  |
66 KB | == Beschreibung == Änderung der Sommertemperaturen in Europa relativ zu 1991-2020 ==Lizenzhinweis== {| style="border:1px solid #8888aa; background-color:#f7f8ff;padding:5px;font-size:95%;" | Quelle: Copernicus Climate Change (2024): C3S seasonal lookback: summer 2024, https://climate.copernicus.eu/c3s-seasonal-lookback-summer-2024 <br> Lizenz: [https://climate.copernicus.eu/disclaimer-and-privacy Reproduction of the publically available content of this website is authorised, provided the so… | 1 |
| 09:08, 10. Aug. 2025 | Mediterranean forest fires.jpg (Datei) |  |
93 KB | == Beschreibung == Geographische Verteilung von Brandflächen im Mittelmeerraum 2023 == Lizenzhinweis == {| style="border:1px solid #8888aa; background-color:#f7f8ff;padding:5px;font-size:95%;" |Quelle: San-Miguel-Ayanz, J., T. Durrant, R. Boca (2024): [https://publications.jrc.ec.europa.eu/repository/handle/JRC139704 Forest Fires in Europe, Middle East and North Africa 2023], Publications Office of the European Union, Luxembourg, 2024<br> Lizenz: [http://creativecommons.org/licenses/by/4.0/ CC… | 1 |
| 09:06, 10. Aug. 2025 | EU-Mediterranean fires 1980-2022.jpg (Datei) |  |
58 KB | == Beschreibung == Anzahl der Brände ab 5 ha in den fünf großen Mediterranen EU-Staaten Portugal, Spanien, Frankreich, Italien und Griechenland 1980-2023. == Lizenzhinweis == {| style="border:1px solid #8888aa; background-color:#f7f8ff;padding:5px;font-size:95%;" |Quelle: San-Miguel-Ayanz, J., T. Durrant, R. Boca (2024): [https://publications.jrc.ec.europa.eu/repository/handle/JRC139704 Forest Fires in Europe, Middle East and North Africa 2023], Publications Office of the European Union, Luxemb… | 1 |
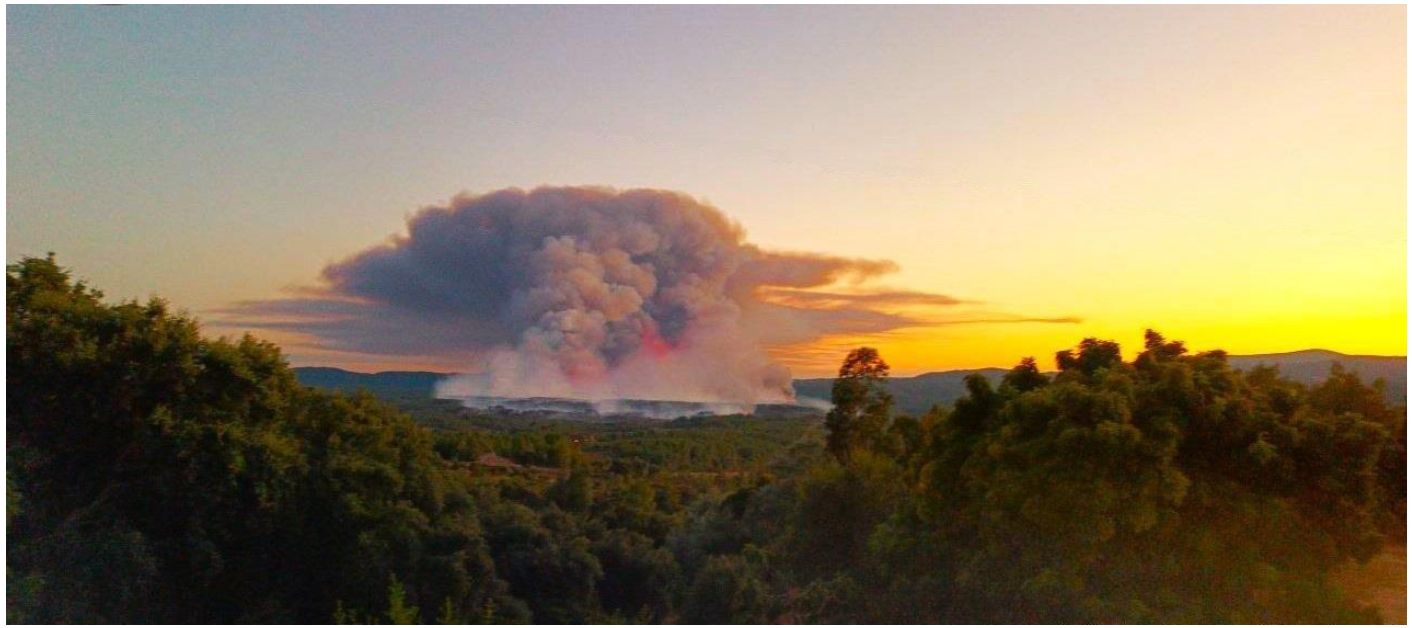
| 08:44, 10. Aug. 2025 | Carrascal fire Portugal Aug 2023.jpg (Datei) |  |
87 KB | == Beschreibung == Das Carrascal Feuer im August 2023 in Zentral-Portugal. Betroffen war eine Kiefern-, Eukalyptus- und Buschvegetation. == Lizenzhinweis == {| style="border:1px solid #8888aa; background-color:#f7f8ff;padding:5px;font-size:95%;" |Quelle: San-Miguel-Ayanz, J., T. Durrant, R. Boca (2024): Forest Fires in Europe, Middle East and North Africa 2023, Publications Office of the European Union, Luxembourg, 2024, https://publications.jrc.ec.europa.eu/repository/handle/JRC139704 <br> Li… | 1 |
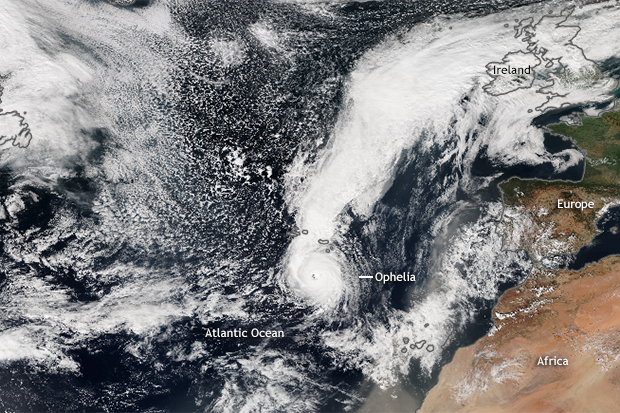
| 09:15, 8. Aug. 2025 | Hurrikan Ophelia E-Atlantik.png (Datei) |  |
671 KB | == Beschreibung == Ex-Hurrikan Ophelia über Irland am 16.10.2017 ==Lizenzhinweis== {| style="border:1px solid #8888aa; background-color:#f7f8ff;padding:5px;font-size:95%;" | Quelle: Di Liberto, T. (2017): [https://www.climate.gov/news-features/event-tracker/former-hurricane-ophelia-batters-ireland Former hurricane Ophelia batters Ireland]<br> Lizenz: NASA [https://earthobservatory.nasa.gov/ImageUse/ public domain] |} | 1 |
| 09:04, 8. Aug. 2025 | Feuerwetter-Häufigkeit-RCP4.jpg (Datei) | 89 KB | == Beschreibung == Feuerwetter-Häufigkeit in der Gegenwart 1985-2015 in % und Änderung der Feuerwetter-Häufigkeit nach den Szenarien RCP4.5 und RCP8.5 bis Ende des 21. Jahrhunderts in %. == Lizenzhinweis == {| style="border:1px solid #8888aa; background-color:#f7f8ff;padding:5px;font-size:95%;" |Quelle: Ruffault, J., T. Curt, V. Moronet al. (2020): Increased likelihood of heat-induced large wildfires in the Mediterranean Basin. Sci Rep 10, 13790 https://doi.org/10.1038/s41598-020-70069-z <br>… | 1 | |
| 08:58, 8. Aug. 2025 | Med-Ausdehnung-Feuersaison2.jpg (Datei) |  |
113 KB | == Beschreibung == Brandfläche der europäischen Mittelmeerländer Portugal, Griechenland, Spanien, Frankreich und Italien 2006-2019 in ha. == Lizenzhinweis == {| style="border:1px solid #8888aa; background-color:#f7f8ff;padding:5px;font-size:95%;" |Quelle: Meier, S., E. Strobl, R.J.R. Elliott & N. Kettridge (2023): [https://doi.org/10.1111/risa.14075 Cross-country risk quantification of extreme wildfires in Mediterranean Europe]. Risk Analysis, 43, 1745–1762<br> Lizenz: [http://creativecommons.o… | 1 |
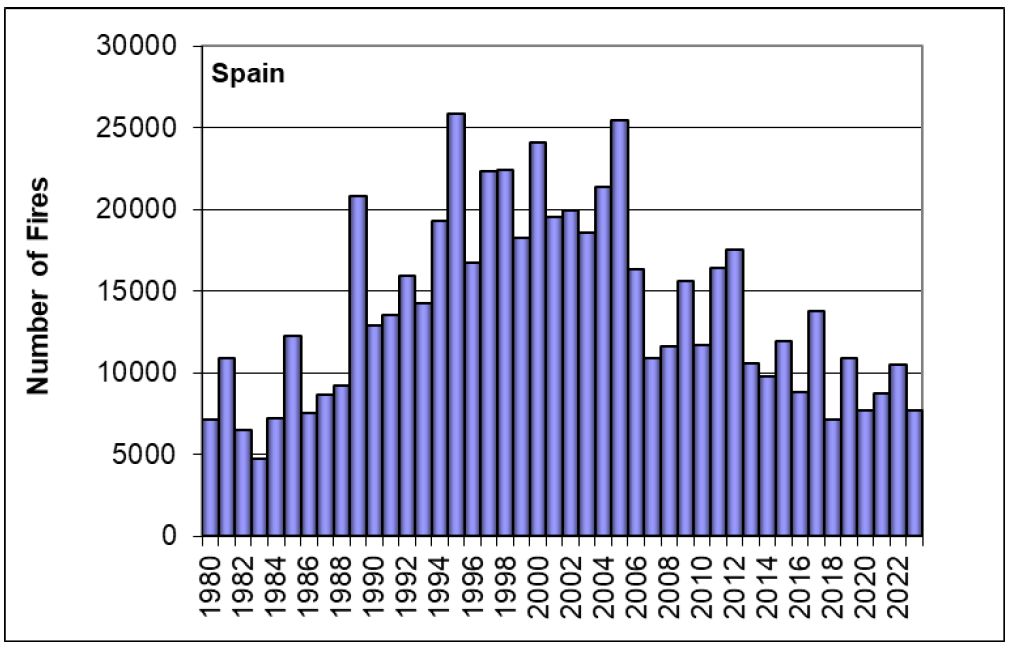
| 10:02, 6. Aug. 2025 | Spain fire number1980-2023.jpg (Datei) |  |
77 KB | == Beschreibung == Anzahl der Brände 1980-2023 == Lizenzhinweis == {| style="border:1px solid #8888aa; background-color:#f7f8ff;padding:5px;font-size:95%;" |Quelle: San-Miguel-Ayanz, J., T. Durrant, R. Boca (2024): [https://publications.jrc.ec.europa.eu/repository/handle/JRC139704 Forest Fires in Europe, Middle East and North Africa 2023], Publications Office of the European Union, Luxembourg, 2024<br> Lizenz: [http://creativecommons.org/licenses/by/4.0/ CC BY] |} | 1 |
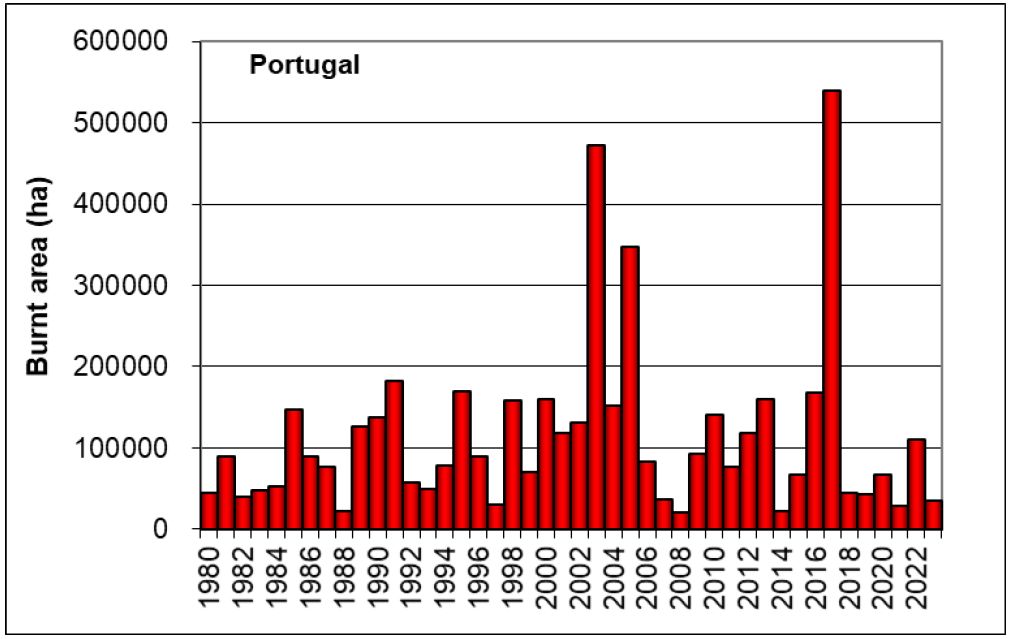
| 09:53, 6. Aug. 2025 | Burnt area Portugal1980-2023.jpg (Datei) |  |
67 KB | == Beschreibung == Verbrannte Fläche in Portugal 1980-2023 == Lizenzhinweis == {| style="border:1px solid #8888aa; background-color:#f7f8ff;padding:5px;font-size:95%;" |Quelle: San-Miguel-Ayanz, J., T. Durrant, R. Boca (2024): [https://publications.jrc.ec.europa.eu/repository/handle/JRC139704 Forest Fires in Europe, Middle East and North Africa 2023], Publications Office of the European Union, Luxembourg, 2024<br> Lizenz: [http://creativecommons.org/licenses/by/4.0/ CC BY] |} | 1 |
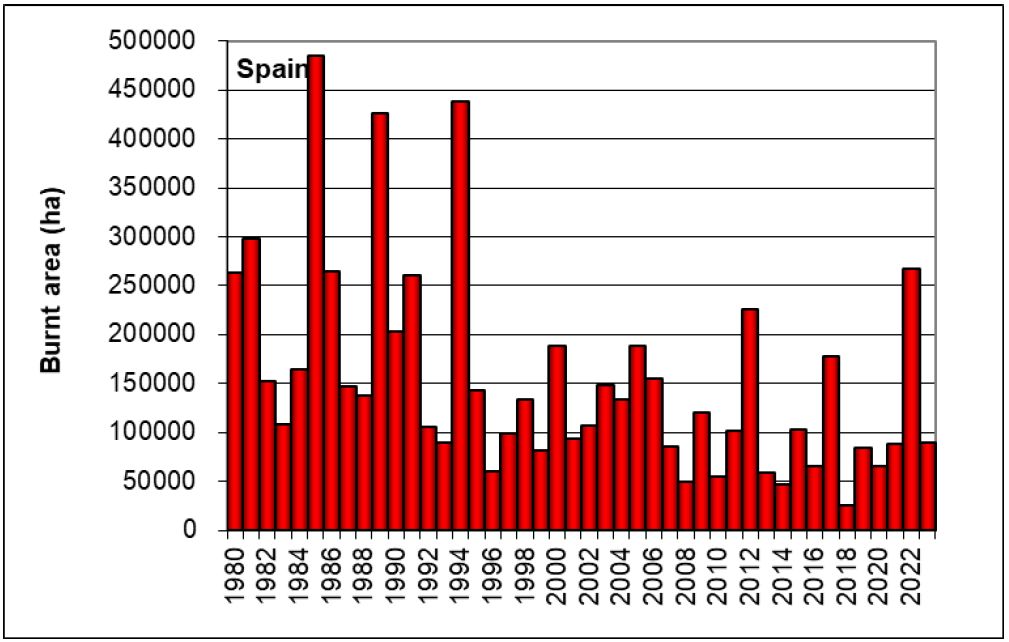
| 09:50, 6. Aug. 2025 | Burnt area Spain1980-2023.jpg (Datei) |  |
76 KB | == Beschreibung == Verbrannte Fläche in Spanien 1980-2023 == Lizenzhinweis == {| style="border:1px solid #8888aa; background-color:#f7f8ff;padding:5px;font-size:95%;" |Quelle: San-Miguel-Ayanz, J., T. Durrant, R. Boca (2024): [https://publications.jrc.ec.europa.eu/repository/handle/JRC139704 Forest Fires in Europe, Middle East and North Africa 2023], Publications Office of the European Union, Luxembourg, 2024<br> Lizenz: [http://creativecommons.org/licenses/by/4.0/ CC BY] |} | 1 |
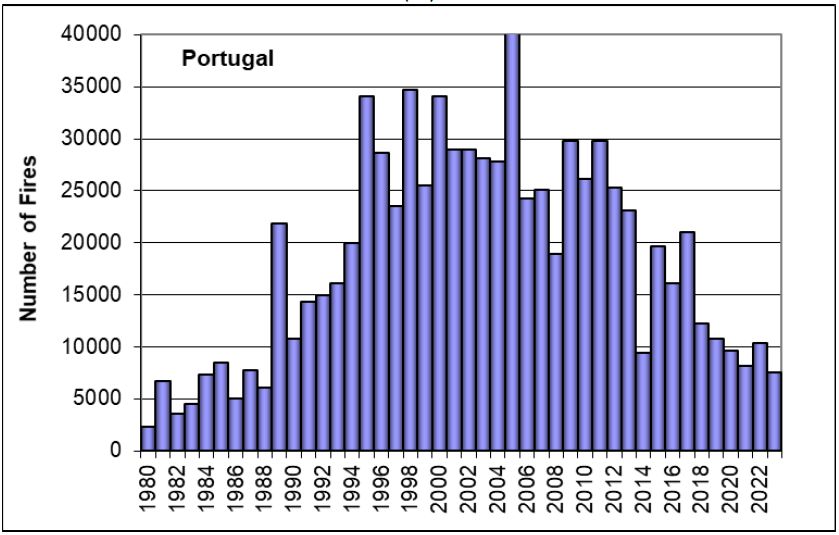
| 09:21, 6. Aug. 2025 | Portugal Anzahl Brände 1980-2023.jpg (Datei) |  |
59 KB | == Beschreibung == Anzahl der Brände in Portugal 1980-2023 == Lizenzhinweis == {| style="border:1px solid #8888aa; background-color:#f7f8ff;padding:5px;font-size:95%;" |Quelle: San-Miguel-Ayanz, J., T. Durrant, R. Boca (2024): Forest Fires in Europe, Middle East and North Africa 2023, Publications Office of the European Union, Luxembourg, 2024, https://publications.jrc.ec.europa.eu/repository/handle/JRC139704 <br> Lizenz: [http://creativecommons.org/licenses/by/4.0/ CC BY] |} | 1 |
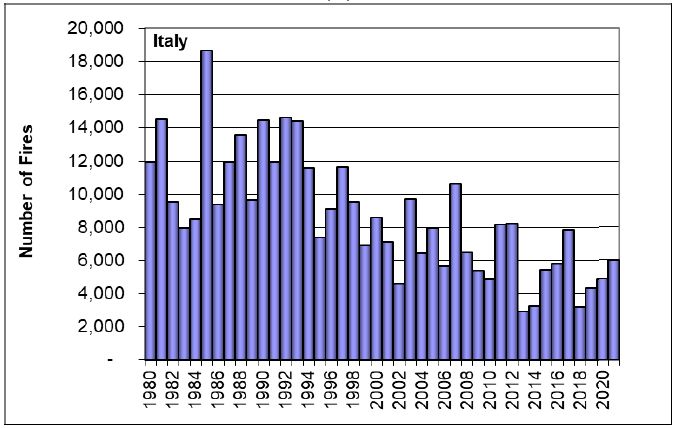
| 09:15, 6. Aug. 2025 | Italy fire number 1980-2021.jpg (Datei) |  |
47 KB | == Beschreibung == Anzahl der Brände in Italien 1980-2021 == Lizenzhinweis == {| style="border:1px solid #8888aa; background-color:#f7f8ff;padding:5px;font-size:95%;" |Quelle: San-Miguel-Ayanz, J., T. Durrant, R. Boca (2022): Forest Fires in Europe, Middle East and North Africa 2021, Publications Office of the European Union, Luxembourg, 2022, https://publications.jrc.ec.europa.eu/repository/handle/JRC130846 <br> Lizenz: [http://creativecommons.org/licenses/by/4.0/ CC BY] |} | 1 |
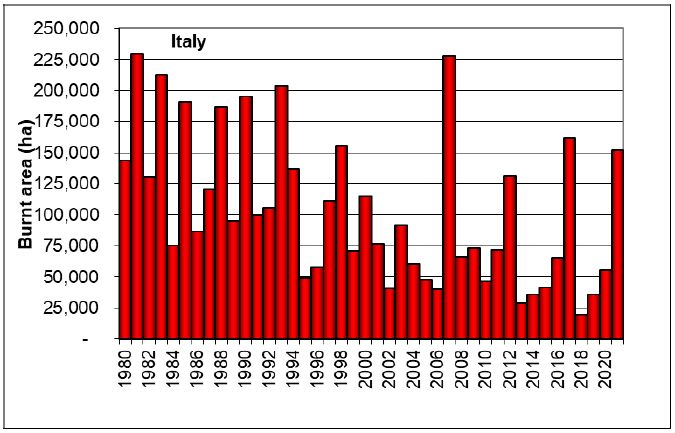
| 09:12, 6. Aug. 2025 | Italy burned area 1980-2021.jpg (Datei) |  |
52 KB | == Beschreibung == Verbrannte Fläche in Italien 1980-2021 == Lizenzhinweis == {| style="border:1px solid #8888aa; background-color:#f7f8ff;padding:5px;font-size:95%;" |Quelle: San-Miguel-Ayanz, J., T. Durrant, R. Boca (2022): Forest Fires in Europe, Middle East and North Africa 2021, Publications Office of the European Union, Luxembourg, 2022, https://publications.jrc.ec.europa.eu/repository/handle/JRC130846 <br> Lizenz: [http://creativecommons.org/licenses/by/4.0/ CC BY] |} | 1 |
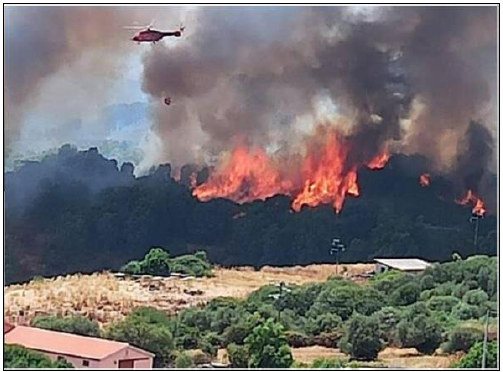
| 09:08, 6. Aug. 2025 | Wildfire 2021 Sardinia.png (Datei) |  |
398 KB | == Beschreibung == Waldbrände 2021 auf Sardinien == Lizenzhinweis == {| style="border:1px solid #8888aa; background-color:#f7f8ff;padding:5px;font-size:95%;" |Quelle: San-Miguel-Ayanz, J., T. Durrant, R. Boca (2022): Forest Fires in Europe, Middle East and North Africa 2021, Publications Office of the European Union, Luxembourg, 2022, https://publications.jrc.ec.europa.eu/repository/handle/JRC130846<br> Lizenz: [http://creativecommons.org/licenses/by/4.0/ CC BY] |} | 1 |
| 15:58, 5. Aug. 2025 | Brandfläche-Mittelmeerraum.jpg (Datei) |  |
38 KB | Brandfläche der europäischen Mittelmeerländer Portugal, Griechenland, Spanien, Frankreich und Italien 2006-2019 in ha. == Lizenzhinweis == {| style="border:1px solid #8888aa; background-color:#f7f8ff;padding:5px;font-size:95%;" |Quelle: Meier, S., E. Strobl, R.J.R. Elliott & N. Kettridge (2023): Cross-country risk quantification of extreme wildfires in Mediterranean Europe. Risk Analysis, 43, 1745–1762. https://doi.org/10.1111/risa.14075<br> Lizenz: CC BY http://creativecommons.org/licenses/by/… | 1 |
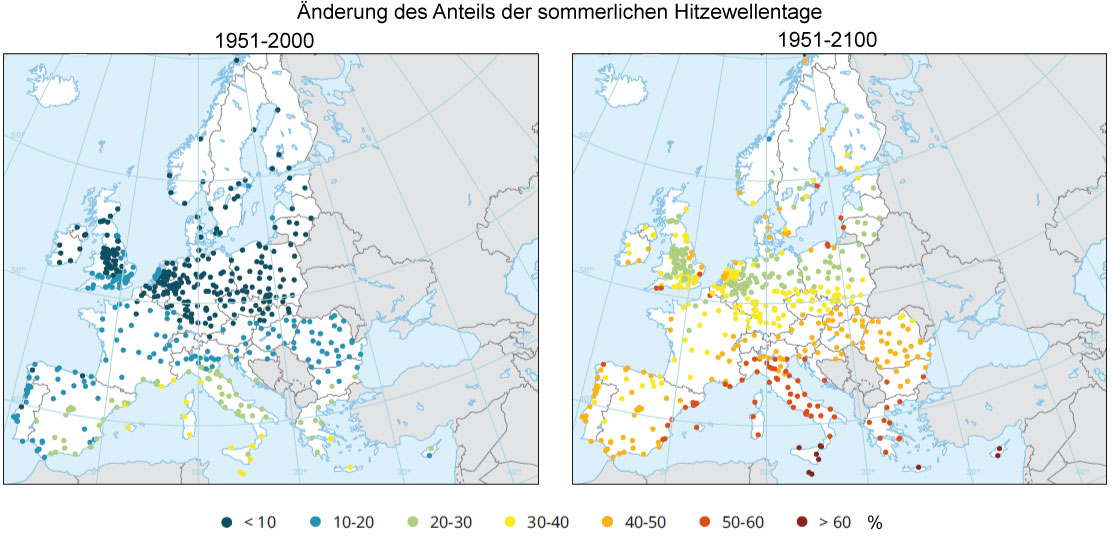
| 11:02, 31. Jul. 2025 | Eu-heatwave-days-2051-2100.jpg (Datei) |  |
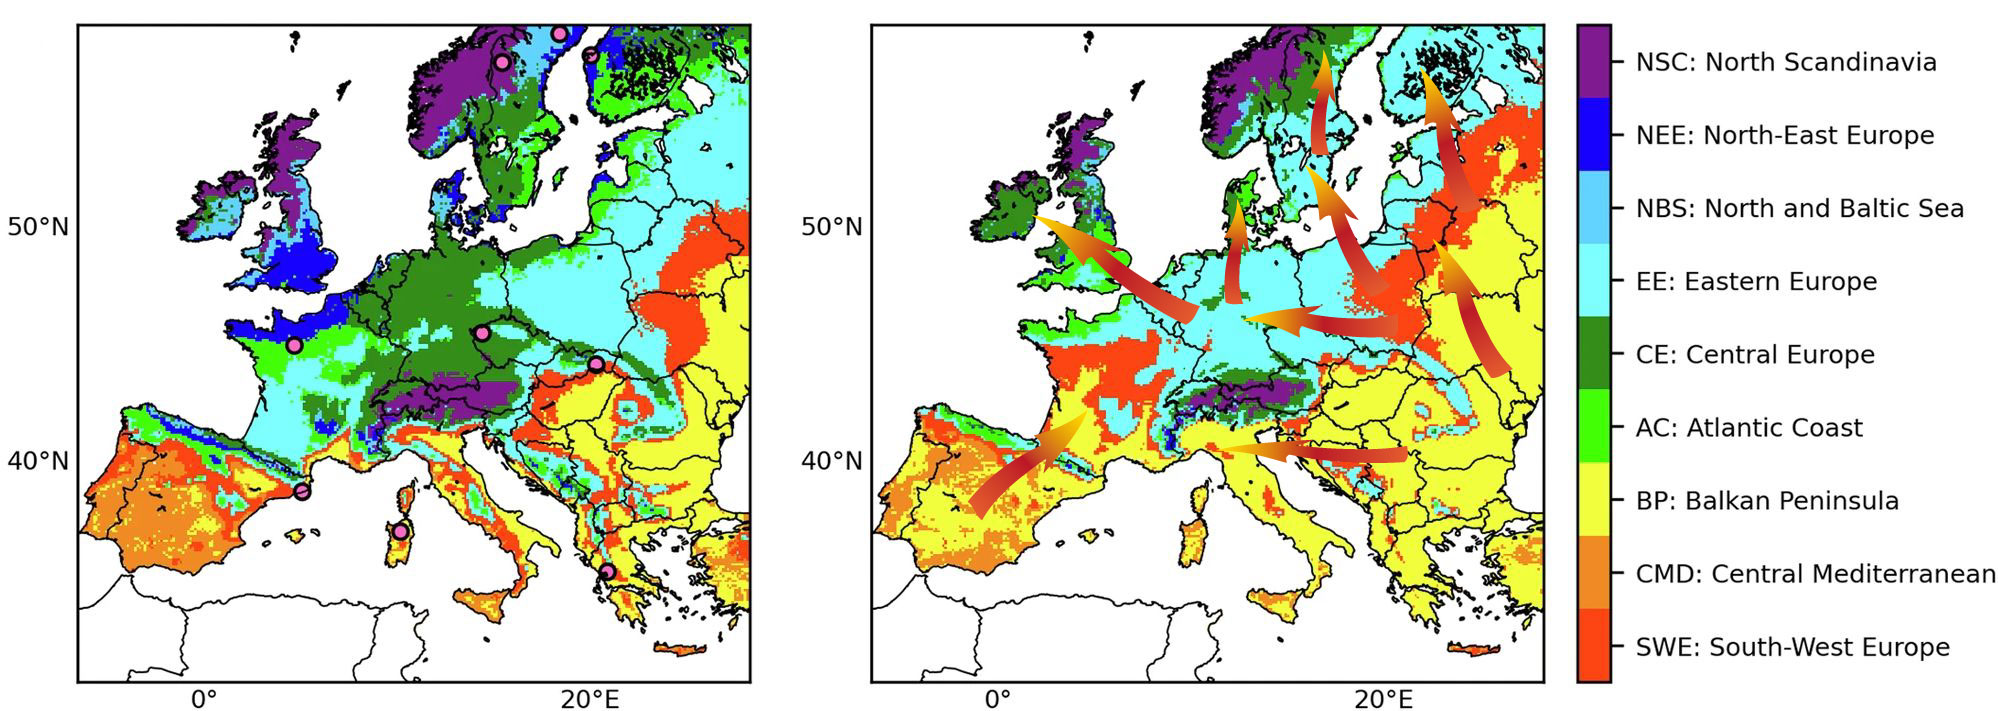
136 KB | == Beschreibung == Ausdehnung heißer und trockener Sommer bei einer globalen Erwärmung um 3°C (Pfeile hinzugefügt). == Lizenzhinweis == {| style="border:1px solid #8888aa; background-color:#f7f8ff;padding:5px;font-size:95%;" |Quelle: Felsche, E., Böhnisch, A., Poschlod, B. et al. (2024): European hot and dry summers are projected to become more frequent and expand northwards. Commun Earth Environ 5, 410 https://doi.org/10.1038/s43247-024-01575-5<br> Lizenz: [https://creativecommons.org/license… | 1 |
| 09:22, 31. Jul. 2025 | Eu-Hitzewellen-aktuell-GWL3.jpg (Datei) |  |
318 KB | == Beschreibung == Ausdehnung heißer und trockener Sommer bei einer globalen Erwärmung um 3°C. == Lizenzhinweis == {| style="border:1px solid #8888aa; background-color:#f7f8ff;padding:5px;font-size:95%;" |Quelle: Felsche, E., Böhnisch, A., Poschlod, B. et al. (2024): European hot and dry summers are projected to become more frequent and expand northwards. Commun Earth Environ 5, 410 https://doi.org/10.1038/s43247-024-01575-5<br> Lizenz: [https://creativecommons.org/licenses/by/4.0/ CC BY 4.0]… | 1 |
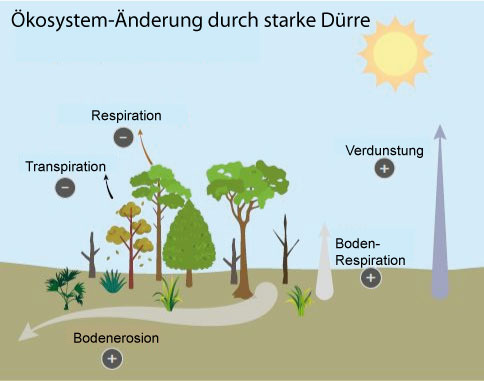
| 18:59, 28. Jul. 2025 | Dürre-CO2-Wasser.jpg (Datei) |  |
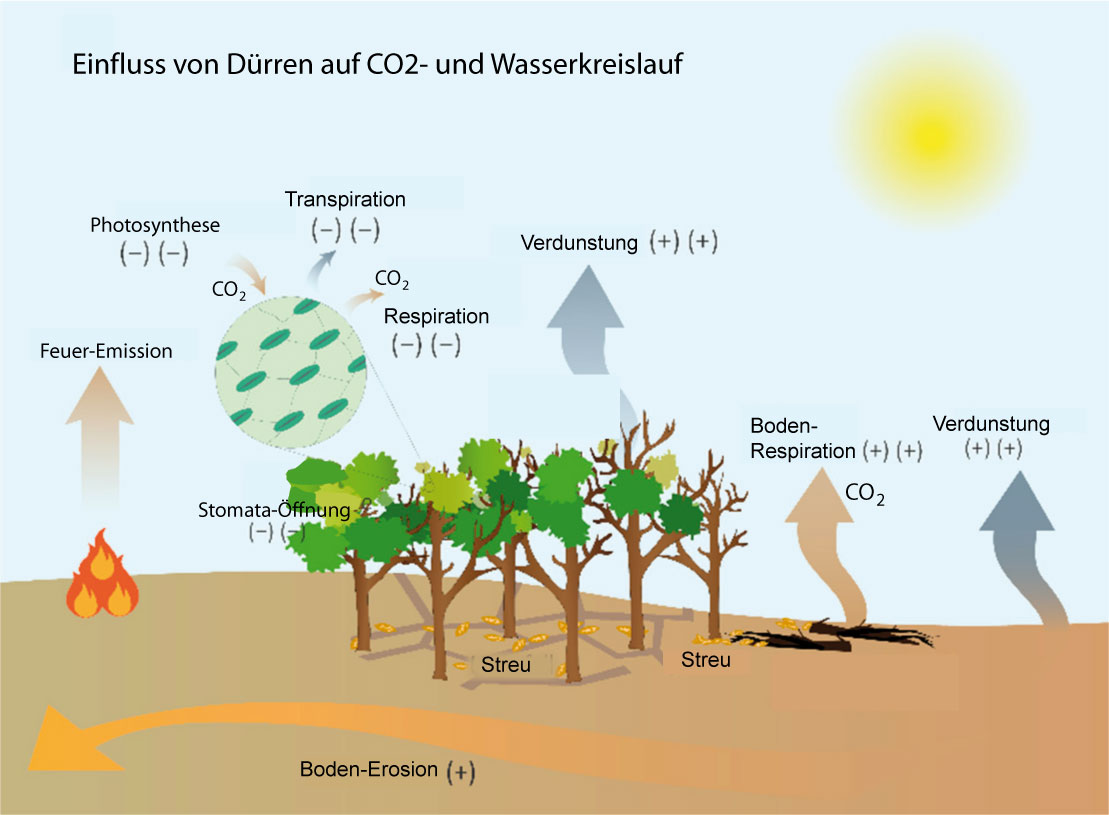
96 KB | == Beschreibung == Kohlenstoff- und Wasserflüsse bei einer starken Dürre. Orangene Pfeile zeigen den Kohlenstofffluss, blaue Pfeile den Wasserfluss. Die Größe der Pfeile gibt die Größe der Flüsse an. +/- zeigen Zu- und Abnahmen der Flüsse. Die Pflanzenrespiration bezieht sich auf Blätter und den Stamm, die Bodenrespiration auf Wurzeln, Laubfall und organische Bestandteile im Boden. == Lizenzhinweis == {| style="border:1px solid #8888aa; background-color:#f7f8ff;padding:5px;font-size:95%;" | Que… | 1 |
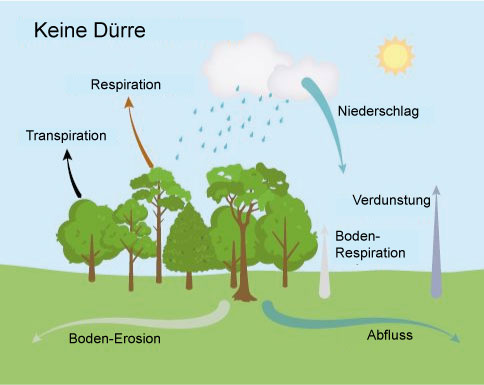
| 18:56, 28. Jul. 2025 | Baumgruppe-CO2-Wasser.jpg (Datei) |  |
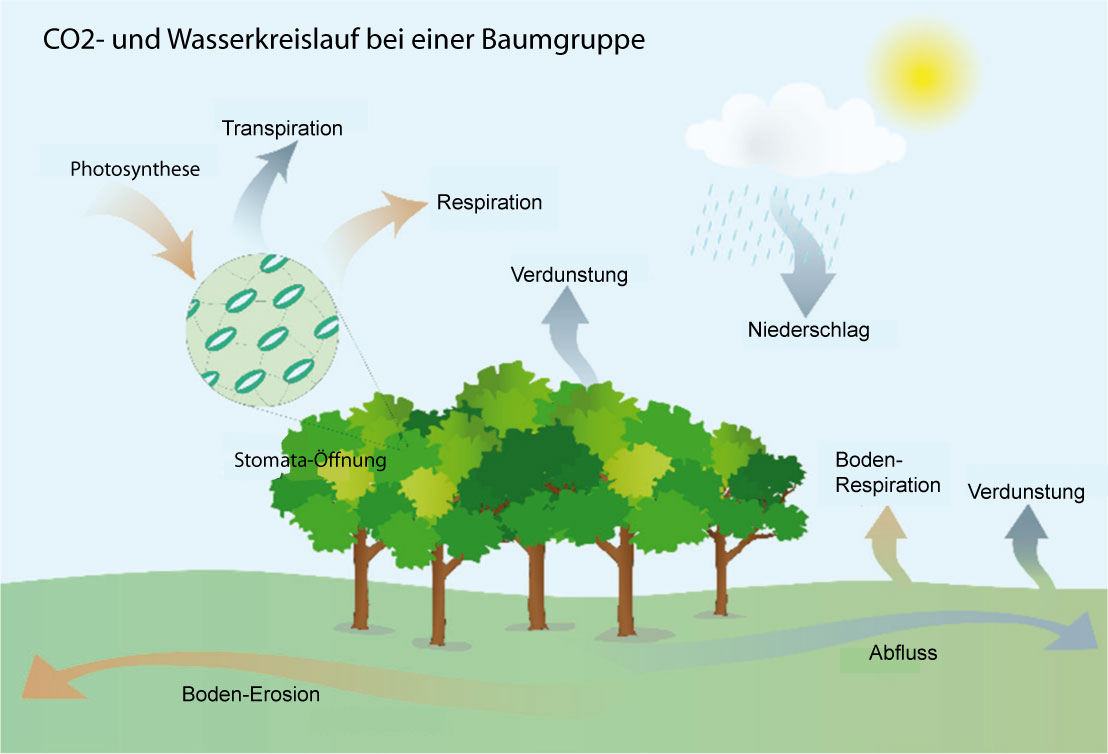
79 KB | == Beschreibung == Kohlenstoff- und Wasserflüsse vor einem Dürreereignis. Orangene Pfeile zeigen den Kohlenstofffluss, blaue Pfeile den Wasserfluss. Die Größe der Pfeile gibt die Größe der Flüsse an. +/- zeigen Zu- und Abnahmen der Flüsse. Die Pflanzenrespiration bezieht sich auf Blätter und den Stamm, die Bodenrespiration auf Wurzeln, Laubfall und organische Bestandteile im Boden. == Lizenzhinweis == {| style="border:1px solid #8888aa; background-color:#f7f8ff;padding:5px;font-size:95%;" | Que… | 1 |
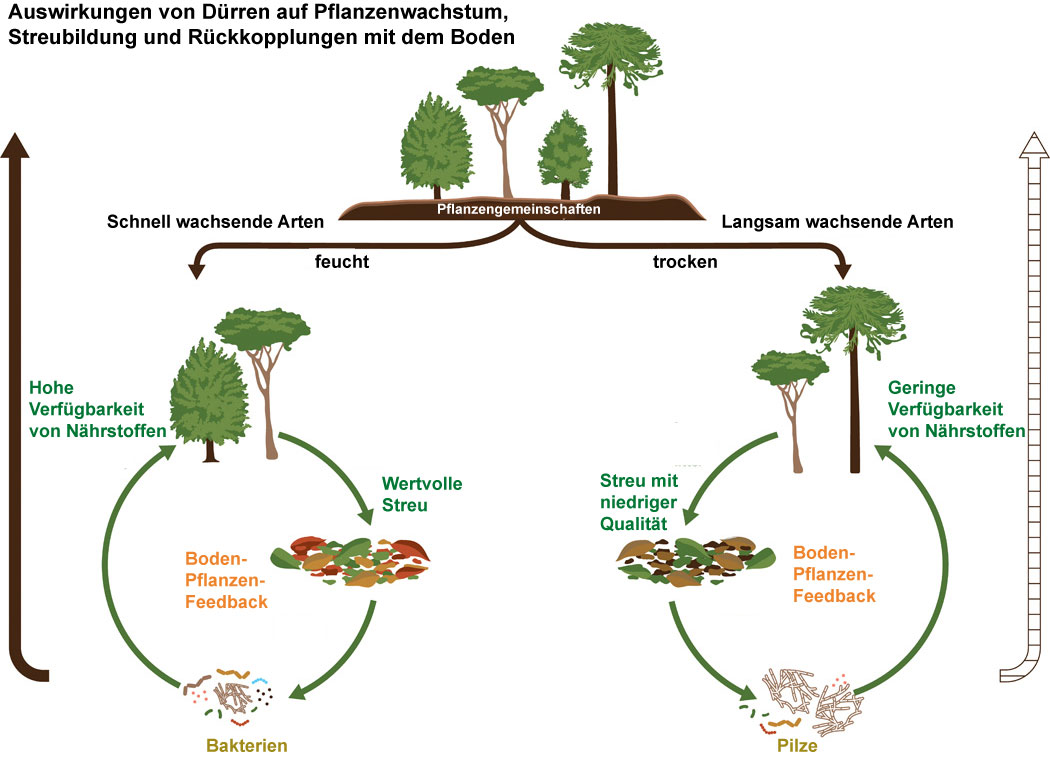
| 18:41, 28. Jul. 2025 | Dürrefolgen-Pflanzen.jpg (Datei) |  |
111 KB | == Beschreibung == Auswirkungen von Dürren auf Pflanzenwachstum, Streubildung und Rückkopplungen mit dem Boden == Lizenzhinweis == {| style="border:1px solid #8888aa; background-color:#f7f8ff;padding:5px;font-size:95%;" | Quelle: Pugnaire, F.I., J.A. Moillo, J. Peñuelas et al. (2019): Climate change effects on plant-soil feedbacks and consequences for biodiversity and functioning of terrestrial ecosystems.Sci. Adv.5, https://www.science.org/doi/10.1126/sciadv.aaz1834<br> Lizenz: CC BY-NC http:/… | 1 |
| 16:06, 28. Jul. 2025 | Wald-Wasserkreislauf.jpg (Datei) |  |
27 KB | Klassifizierung globaler Trockengebiete == Lizenzhinweis == {| style="border:1px solid #8888aa; background-color:#f7f8ff;padding:5px;font-size:95%;" | Quelle: European Commission Joint Research Centre and United Nations Convention to Combat Desertification (2024): World Drought Atlas [A. Toreti, D. Tsegai, and L. Rossi Eds], Publications Office of the European Union, Luxembourg, https://publications.jrc.ec.europa.eu/repository/handle/JRC139691 <br> Lizenz: CC-BY |} | 1 |
| 16:04, 28. Jul. 2025 | Wald-Dürre.jpg (Datei) |  |
28 KB | Einfluss von Wald auf Wasser- und CO2-Kreislauf == Lizenzhinweis == {| style="border:1px solid #8888aa; background-color:#f7f8ff;padding:5px;font-size:95%;" | Quelle: European Commission Joint Research Centre and United Nations Convention to Combat Desertification (2024): World Drought Atlas [A. Toreti, D. Tsegai, and L. Rossi Eds], Publications Office of the European Union, Luxembourg, https://publications.jrc.ec.europa.eu/repository/handle/JRC139691 <br> Lizenz: CC BY |} | 1 |
| 15:49, 27. Jul. 2025 | Klimawandel-Grundwasser.jpg (Datei) |  |
116 KB | == Beschreibung == Direkte und indirekte Folgen des Klimawandels auf Grundwassersysteme == Lizenzhinweis == {| style="border:1px solid #8888aa; background-color:#f7f8ff;padding:5px;font-size:95%;" |Quelle: United Nations (2022): [https://www.unwater.org/publications/un-world-water-development-report-2022 The United Nations World Water Development Report 2022: Groundwater: Making the invisible visible]. UNESCO, Paris<br> Lizenz: [https://creativecommons.org/licenses/by-sa/3.0/igo/ CC BY-SA] |} | 1 |
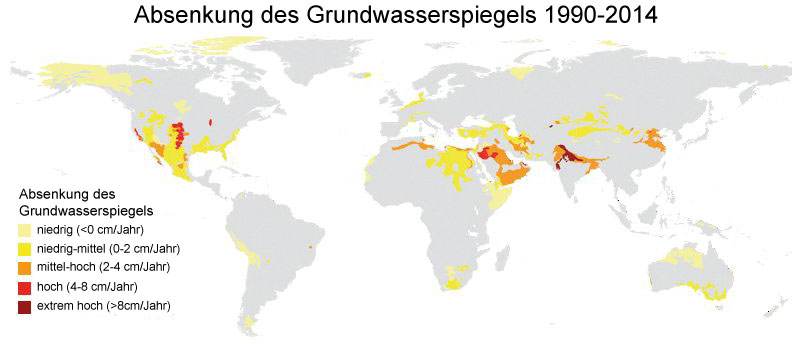
| 15:46, 27. Jul. 2025 | Absenkung-Grundwasserspiege.jpg (Datei) |  |
37 KB | == Beschreibung == Absenkung des Grundwasserspiegels 1990-2014 == Lizenzhinweis == {| style="border:1px solid #8888aa; background-color:#f7f8ff;padding:5px;font-size:95%;" |Quelle: United Nations (2022): The United Nations World Water Development Report 2022: Groundwater: Making the invisible visible. UNESCO, Paris, https://www.unwater.org/publications/un-world-water-development-report-2022 <br> Lizenz: Lizenz: CC BY-SA https://creativecommons.org/licenses/by-sa/3.0/igo/ |} | 1 |
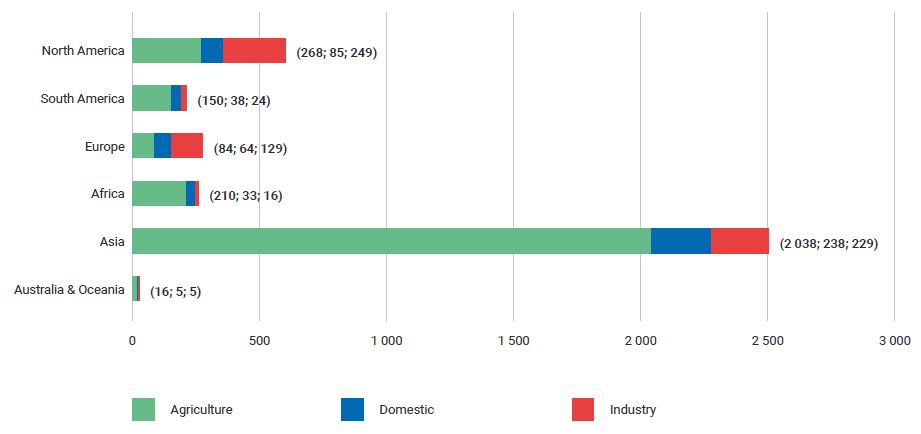
| 10:59, 26. Jul. 2025 | Freshwater withdrawal 2017.jpg (Datei) |  |
23 KB | == Beschreibung == Süßwasserentnahme 2017 nach Kontinenten und Sektoren in km3/Jahr == Lizenzhinweis == {| style="border:1px solid #8888aa; background-color:#f7f8ff;padding:5px;font-size:95%;" |Quelle: United Nations (2022): The United Nations World Water Development Report 2022: Groundwater: Making the invisible visible. UNESCO, Paris, https://www.unwater.org/publications/un-world-water-development-report-2022<br> Lizenz: CC BY-SA https://creativecommons.org/licenses/by-sa/3.0/igo/ |} | 1 |
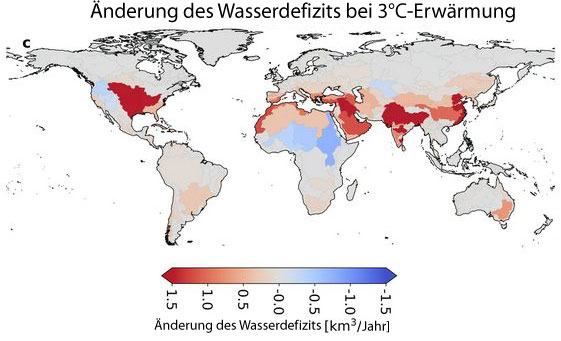
| 16:09, 25. Jul. 2025 | Wasserdefizit-bei-3°C.jpg (Datei) |  |
42 KB | == Beschreibung == Änderung des Wasser-Defizits in wichtigen Abflussbecken in km3/Jahr bei einer globalen Erwärmung um 3°C == Lizenzhinweis == {| style="border:1px solid #8888aa; background-color:#f7f8ff;padding:5px;font-size:95%;" |Quelle: Rosa, L., M. Sangiorgio (2025): [https://doi.org/10.1038/s41467-025-56517-2 Global water gaps under future warming levels]. Nat Commun 16, 1192 <br> Lizenz: [http://creativecommons.org/licenses/by/4.0/ CC BY] |} | 1 |
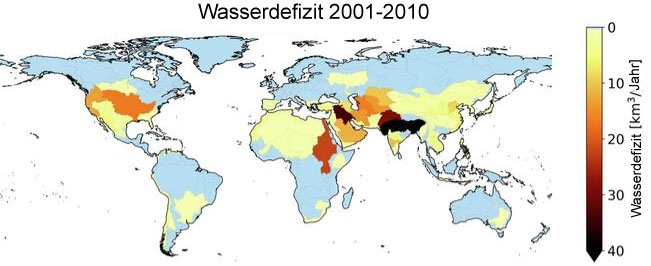
| 16:08, 25. Jul. 2025 | Wasserdefizit2001-2010.jpg (Datei) |  |
40 KB | == Beschreibung == Wasser-Defizit in wichtigen Abflussbecken in km3/Jahr 2001-2010 == Lizenzhinweis == {| style="border:1px solid #8888aa; background-color:#f7f8ff;padding:5px;font-size:95%;" |Quelle: Rosa, L., M. Sangiorgio (2025): Global water gaps under future warming levels. Nat Commun 16, 1192 https://doi.org/10.1038/s41467-025-56517-2<br> Lizenz: CC BY http://creativecommons.org/licenses/by/4.0/ |} | 1 |
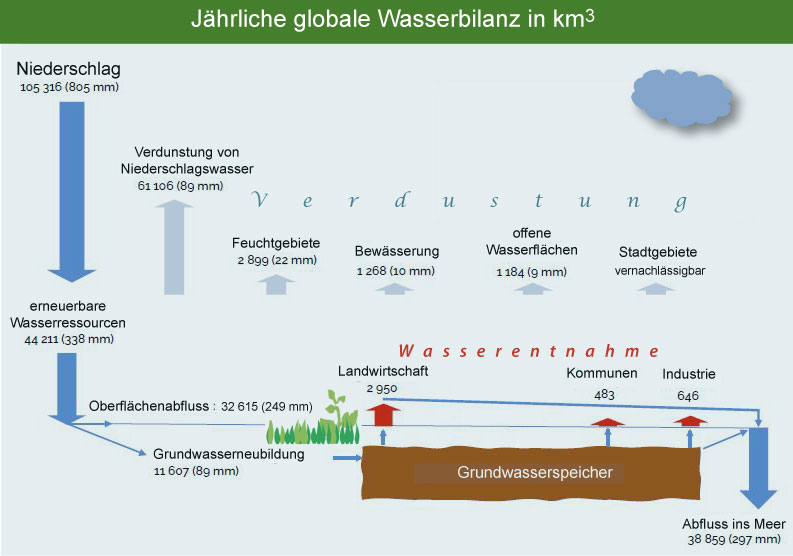
| 19:36, 24. Jul. 2025 | Global-water-balance.jpg (Datei) |  |
60 KB | 3 | |
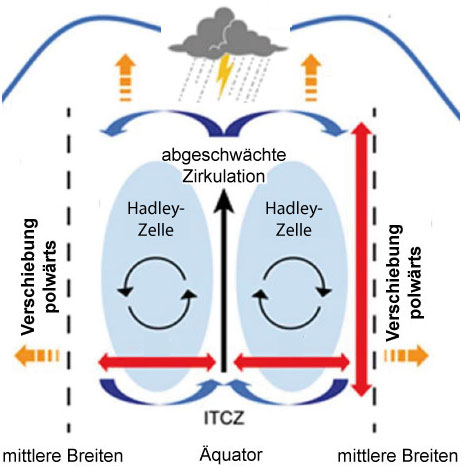
| 18:48, 24. Jul. 2025 | Hadley-Zirkulation.jpg (Datei) |  |
39 KB | == Beschreibung == Änderung der Hadley-Zirkulation durch den Klimawandel, Ausschnitt und übersetzt == Lizenzhinweis == {| style="border:1px solid #8888aa; background-color:#f7f8ff;padding:5px;font-size:95%;" |Quelle: Terzi, L., G. Wotawa, M. Schoeppner et al. (2020): Radioisotopes demonstrate changes in global atmospheric circulation possibly caused by global warming. Sci Rep 10, 10695, https://doi.org/10.1038/s41598-020-66541-5<br> Lizenz: [https://creativecommons.org/licenses/by/4.0/ CC BY 4.… | 1 |
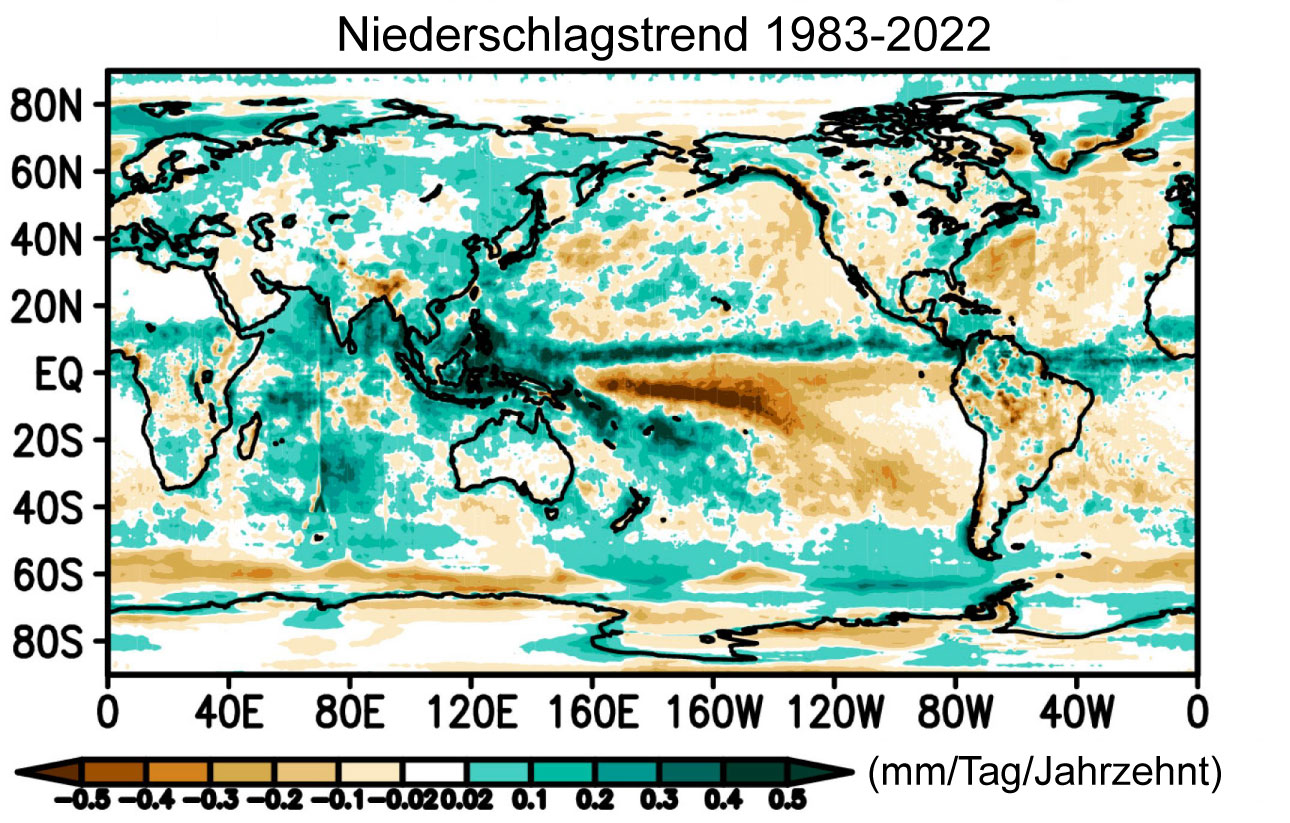
| 18:38, 24. Jul. 2025 | Niederschlagstrend1983-2022.jpg (Datei) |  |
307 KB | == Beschreibung == Niederschlagstrend 1983 bis 2022 == Lizenzhinweis == {| style="border:1px solid #8888aa; background-color:#f7f8ff;padding:5px;font-size:95%;" |Quelle: Adler, R.F., and G. Gu (2024): [https://doi.org/10.3390/atmos15050535 Global Precipitation for the Year 2023 and How It Relates to Longer Term Variations and Trends], Atmosphere 15, no. 5: 535<br> Lizenz: [https://creativecommons.org/licenses/by/4.0/ CC BY 4.0] |} | 1 |
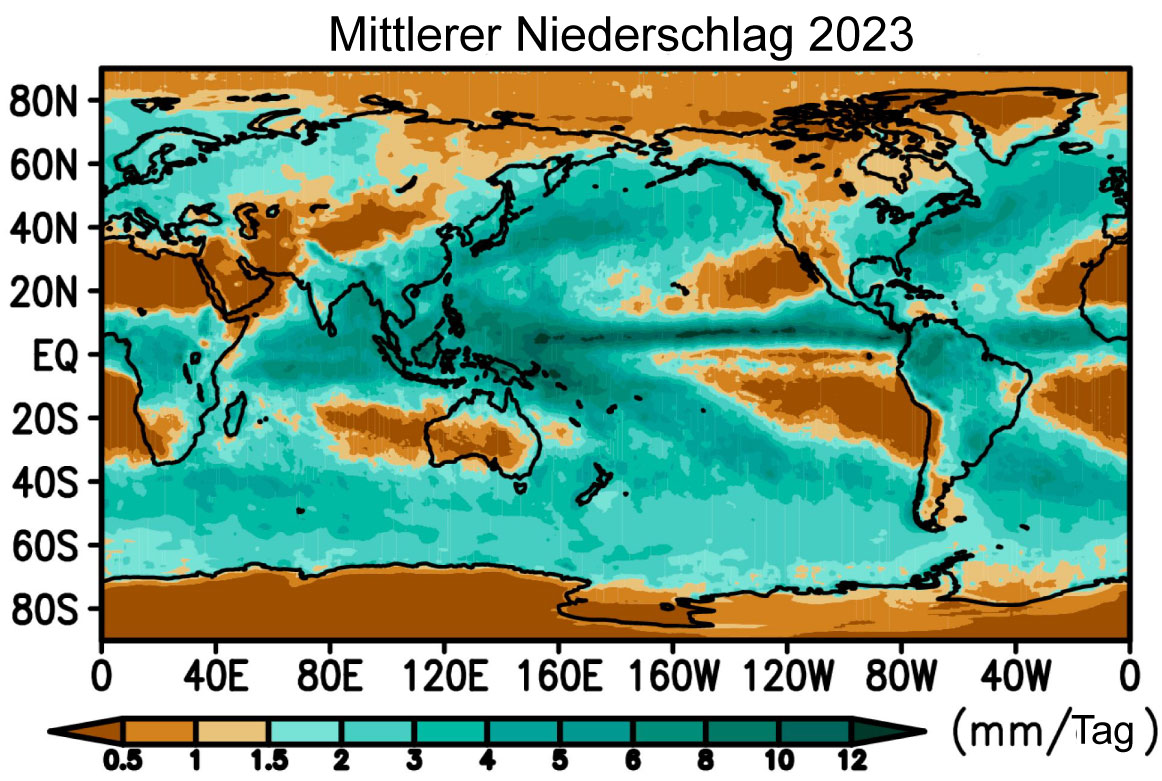
| 18:23, 24. Jul. 2025 | Niederschlag-2023.jpg (Datei) |  |
224 KB | == Beschreibung == Jährliche globale Wasser-Bilanz auf dem Land == Lizenzhinweis == {| style="border:1px solid #8888aa; background-color:#f7f8ff;padding:5px;font-size:95%;" |Quelle: FAO (2022): [https://doi.org/10.4060/cb9910en The State of the World’s Land and Water Resources for Food and Agriculture – Systems at breaking point]. Main report. Rome<br> Lizenz: [https://creativecommons.org/licenses/by-nc-sa/3.0/igo/legalcode CC BY-NC-SA 3.0] |} | 1 |
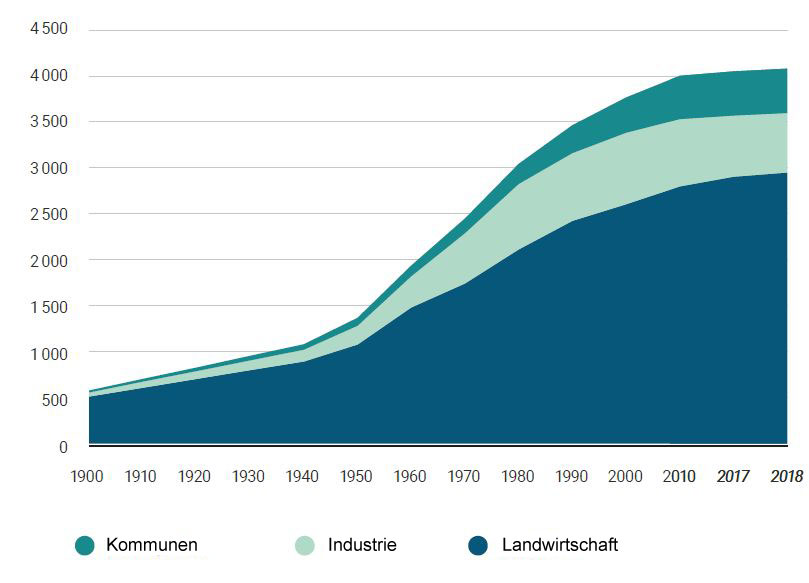
| 16:42, 24. Jul. 2025 | Water-withdrawls-dt.jpg (Datei) |  |
40 KB | == Beschreibung == Der globale Wasserverbrauch 1900-2018 nach Sektoren == Lizenzhinweis == {| style="border:1px solid #8888aa; background-color:#f7f8ff;padding:5px;font-size:95%;" |Quelle: United Nations (2023): The United Nations World Water Development Report 2023: Partnerships and Cooperation for Water. UNESCO, Paris https://www.unwater.org/publications/un-world-water-development-report-2023<br> Lizenz: public domain |} | 1 |
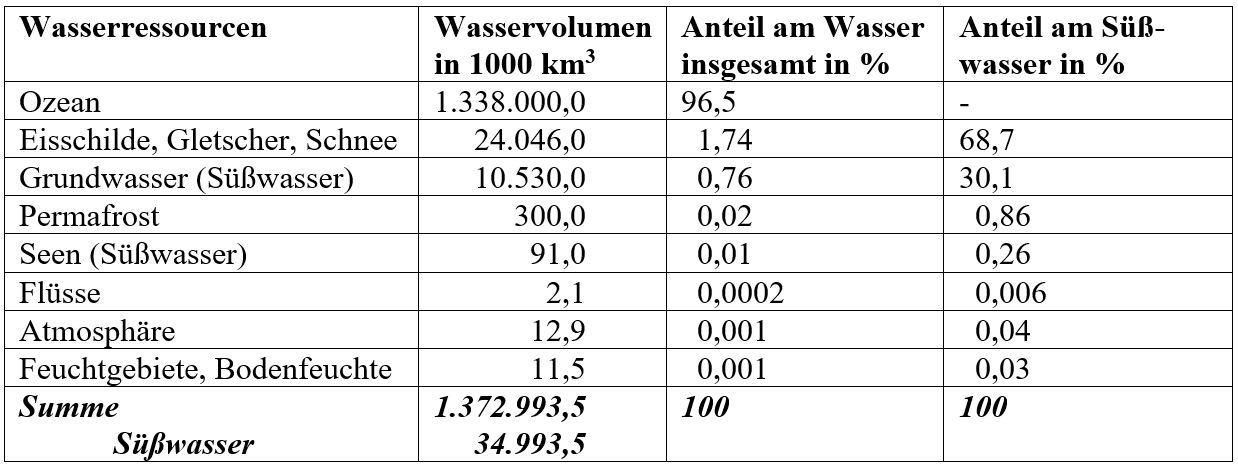
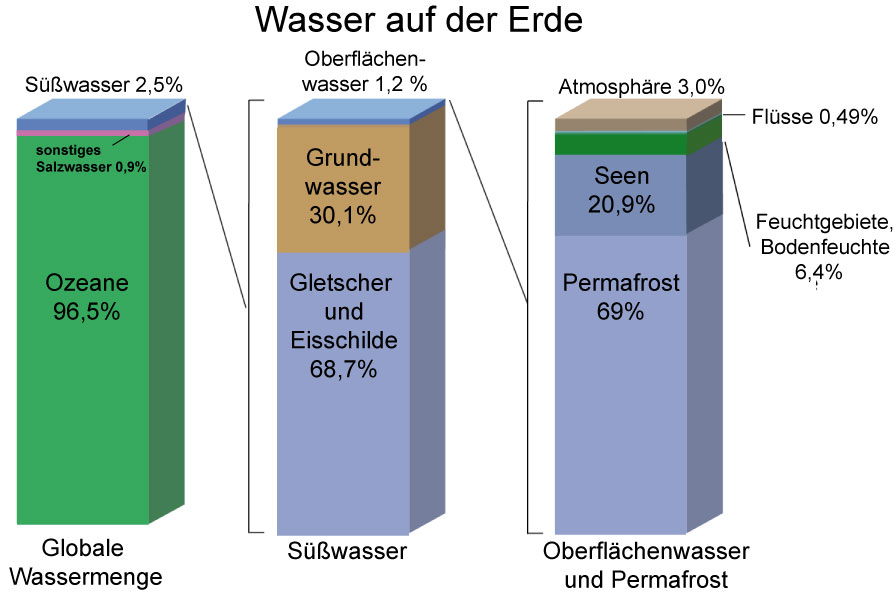
| 15:20, 24. Jul. 2025 | Wasserressourcen tabelle.jpg (Datei) |  |
94 KB | == Beschreibung == Die Wasserverteilung auf der Erde. == Lizenzhinweis == {| style="border:1px solid #8888aa; background-color:#f7f8ff;padding:5px;font-size:95%;" |Quelle: Nach NASA Earth Observatory (2010): The Water Cyle https://earthobservatory.nasa.gov/features/Water/page1.php<br> Lizenz: public domain |} | 1 |
| 15:12, 24. Jul. 2025 | Wasserressourcen.jpg (Datei) |  |
68 KB | == Beschreibung == Wasser auf der Erde, übersetzt == Lizenzhinweis == {| style="border:1px solid #8888aa; background-color:#f7f8ff;padding:5px;font-size:95%;" |Quelle: USGS (2019): The distribution of water on, in, and above the Earth https://www.usgs.gov/media/images/distribution-water-and-above-earth <br> Lizenz: public domain |} | 1 |
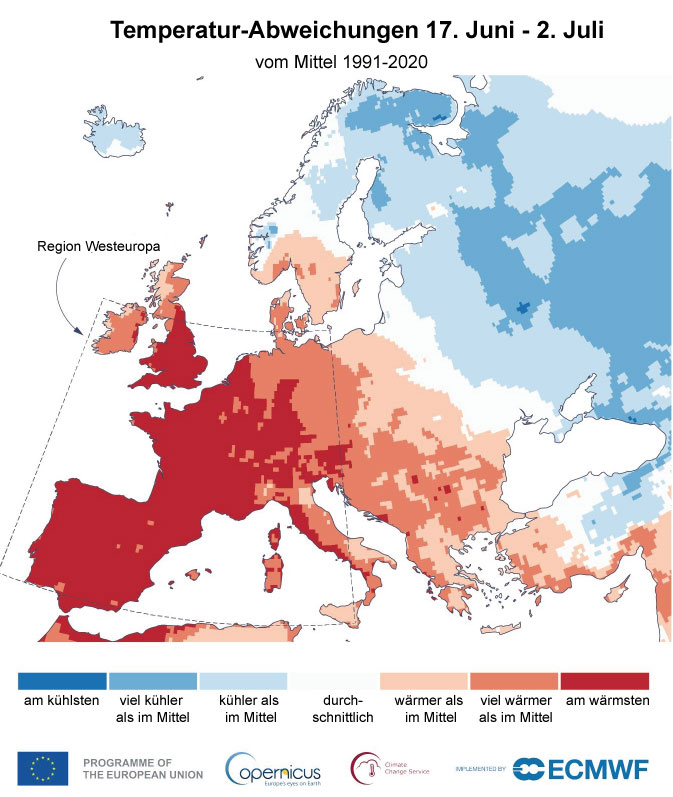
| 14:55, 17. Jul. 2025 | Hitzewelle-Juni-2025.jpg (Datei) |  |
104 KB | == Beschreibung == Die Grafik zeigt, wie stark die Temperaturen vom 17. Juni bis 2. Juli 2025 vom Durchschnitt abgewichen sind. Die Extremwerte "am kühlsten" und "am wärmsten" sind dabei mit dem Mittel derselben Tagen im Zeitraum 1979-2024 verglichen, die übrigen Werte mit 1991-2020. ==Lizenzhinweis== {| style="border:1px solid #8888aa; background-color:#f7f8ff;padding:5px;font-size:95%;" | Quelle: CCopernicus Climate Change Service (2025): Heatwaves contribute to the warmest June on record in… | 1 |
| 18:59, 15. Jul. 2025 | Earth-warming.gif (Datei) |  |
40 KB | == Beschreibung == Die Erde erwärmt sich ==Lizenzhinweis== {| style="border:1px solid #8888aa; background-color:#f7f8ff;padding:5px;font-size:95%;" | Quelle: NASA ClimateKids: [https://climatekids.nasa.gov/climate-change-evidence/ How do we know the climate is changing?] <br> Lizenz: public domain |} | 1 |
| 18:55, 15. Jul. 2025 | Earth warm's.jpg (Datei) |  |
11 KB | ==Lizenzhinweis== {| style="border:1px solid #8888aa; background-color:#f7f8ff;padding:5px;font-size:95%;" | Quelle: NASA ClimateKids: [https://climatekids.nasa.gov/health-report-sea-ice/ Planet Health Report] <br> Lizenz: public domain |} | 1 |
| 18:51, 15. Jul. 2025 | Earth warming.jpg (Datei) |  |
14 KB | == Beschreibung == Die Erde erwärmt sich ==Lizenzhinweis== {| style="border:1px solid #8888aa; background-color:#f7f8ff;padding:5px;font-size:95%;" | Quelle: NASA ClimateKids: Planet Health Report: Temperature, https://climatekids.nasa.gov/health-report-temp/ <br> Lizenz: public domain |} | 1 |
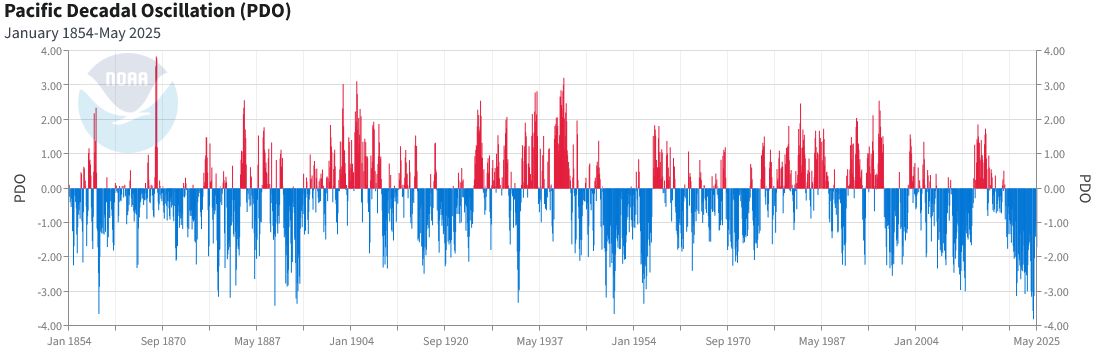
| 20:22, 7. Jul. 2025 | Pacific Decadal Oscillation.jpg (Datei) |  |
63 KB | Pazifische Dekadenoszillation (PDO) == Lizenzhinweis == {| style="border:1px solid #8888aa; background-color:#f7f8ff;padding:5px;font-size:95%;" |Quelle: NOAA (2025): Pacific Decadal Oscillation (PDO), https://www.ncei.noaa.gov/access/monitoring/pdo/ Lizenz: public domain |} | 1 |
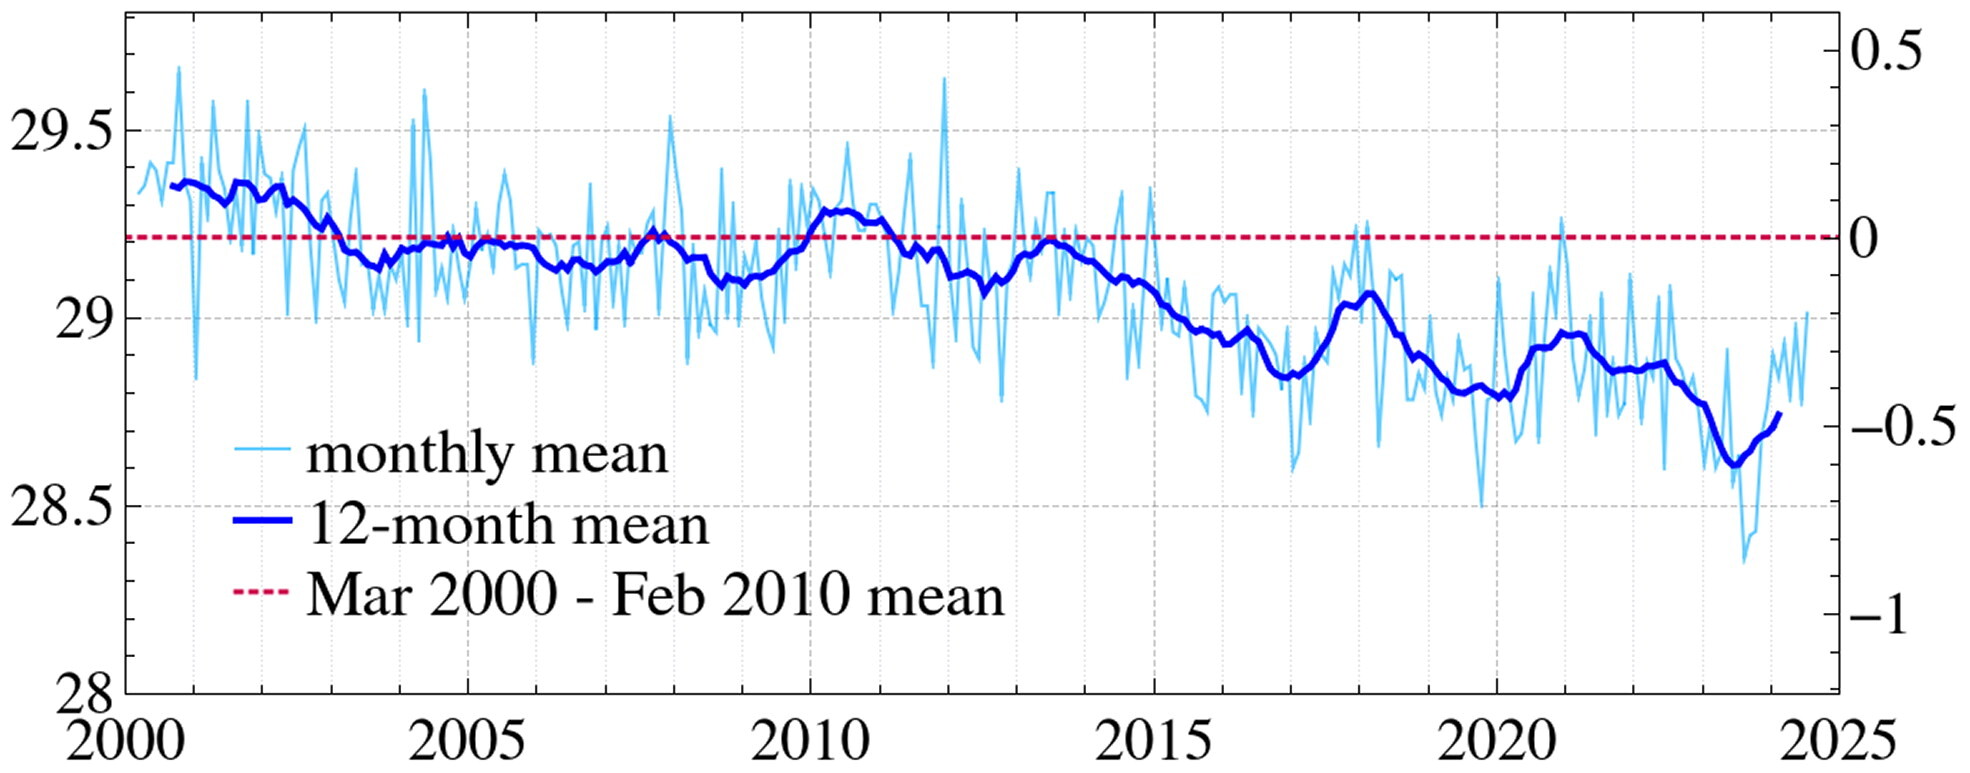
| 13:40, 2. Jul. 2025 | Earth's albedo 2000-2025.jpg (Datei) |  |
212 KB | Änderung der planetaren Albedo 2000-2025 == Lizenzhinweis == {| style="border:1px solid #8888aa; background-color:#f7f8ff;padding:5px;font-size:95%;" |Quelle: Hansen, J. E., P. Kharecha, M. Sato et al. (2025): Global Warming Has Accelerated: Are the United Nations and the Public Well-Informed? Environment: Science and Policy for Sustainable Development, 67(1), 6–44. https://doi.org/10.1080/00139157.2025.2434494<br> Lizenz: [https://creativecommons.org/licenses/by/4.0/ CC BY 4.0] |} | 1 |
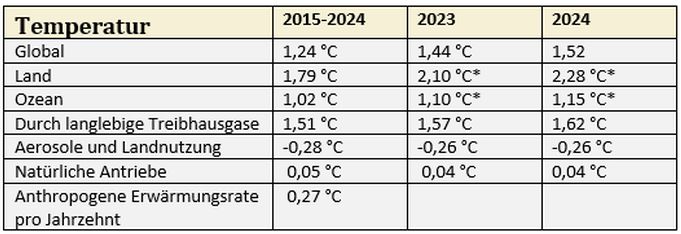
| 17:56, 26. Jun. 2025 | Temperatur 2024.jpg (Datei) |  |
37 KB | 2 | |
| 15:24, 26. Jun. 2025 | 5-einfache-Bilder.jpg (Datei) | 42 KB | 2 | ||
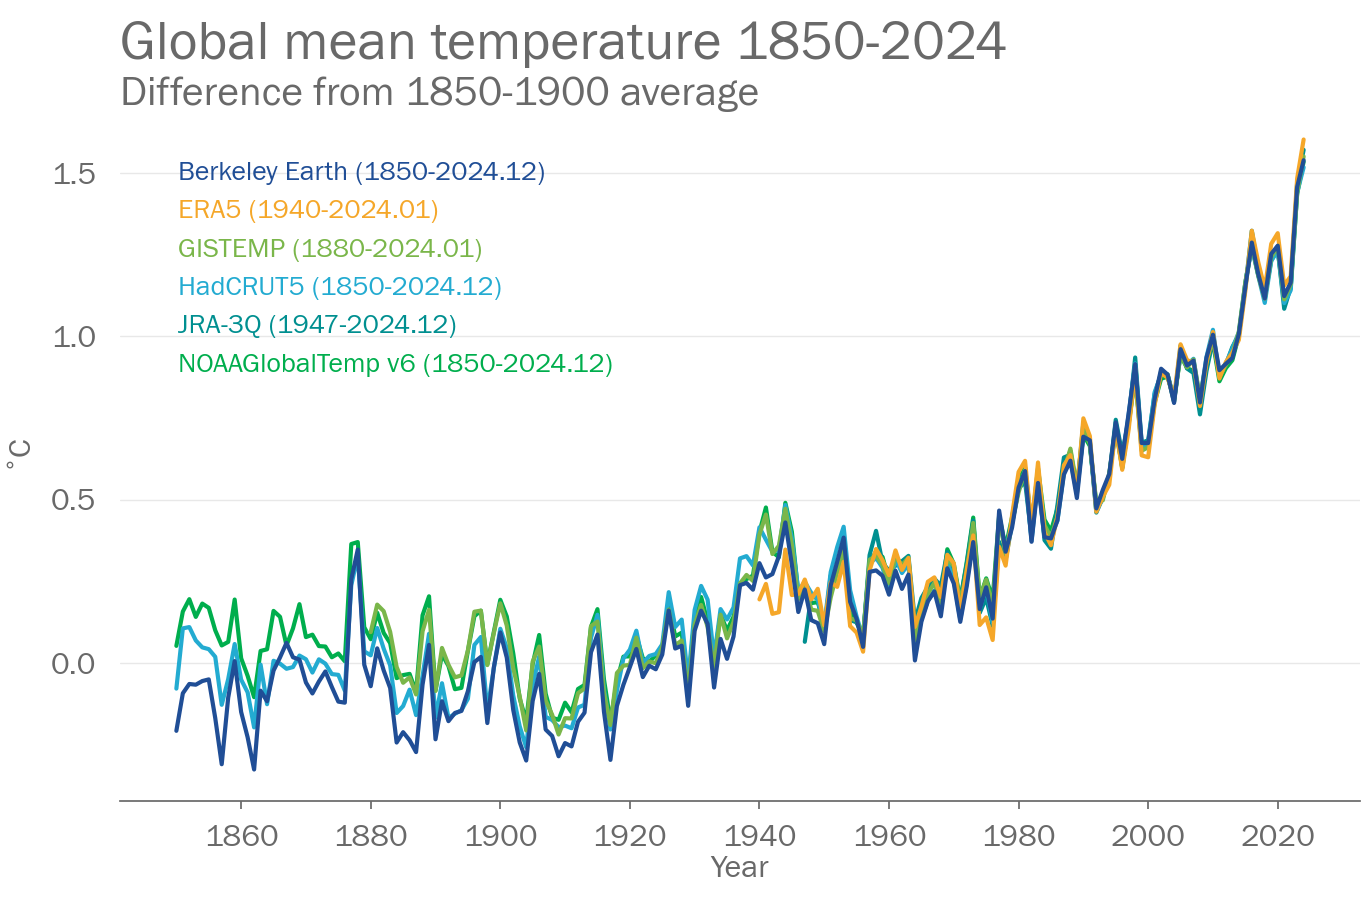
| 11:13, 26. Jun. 2025 | Global mean temp 2024.png (Datei) |  |
217 KB | == Beschreibung == Globale Jahresmitteltemperatur 1850-2024, relativ zum Mittel 1850-1900 (vorindustriell). == Lizenzhinweis == {| style="border:1px solid #8888aa; background-color:#f7f8ff;padding:5px;font-size:95%;" | Quelle: World Meteorological Organization, WMO (2025): State of the global climate 2024, https://wmo.int/publication-series/state-of-global-climate-2024</br> Lizenz: Reproduction of short excerpts of WMO materials, figures and photographs on this website is authorized free of c… | 1 |
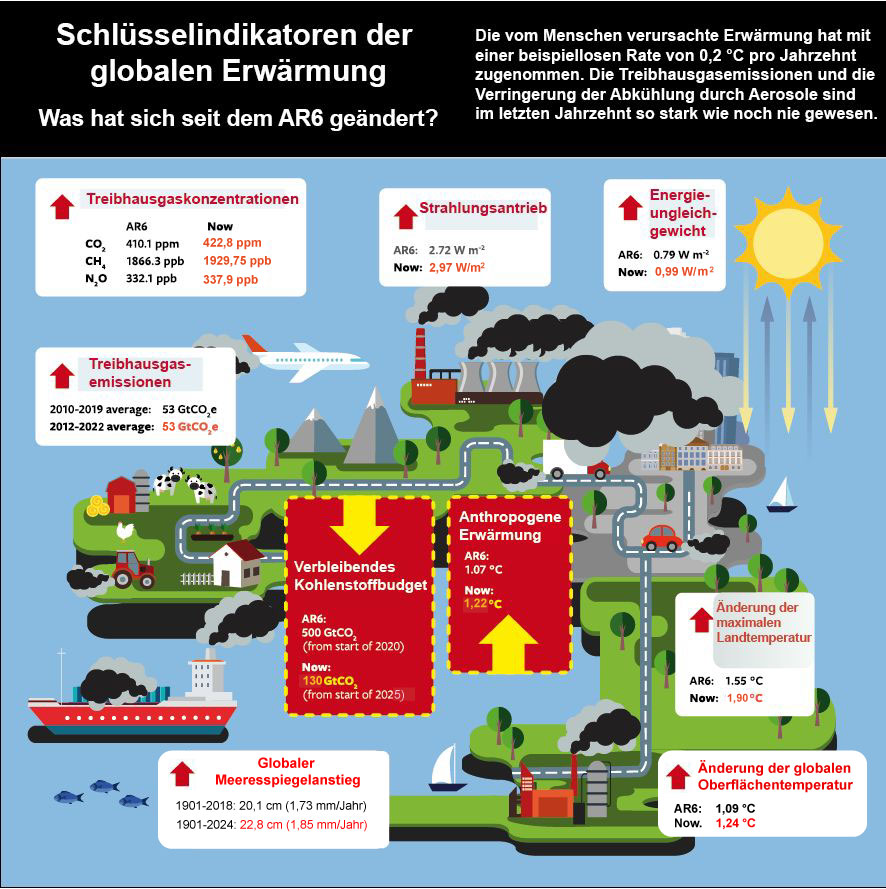
| 19:55, 25. Jun. 2025 | Klimaindikatoren-2024.jpg (Datei) |  |
187 KB | 2 | |
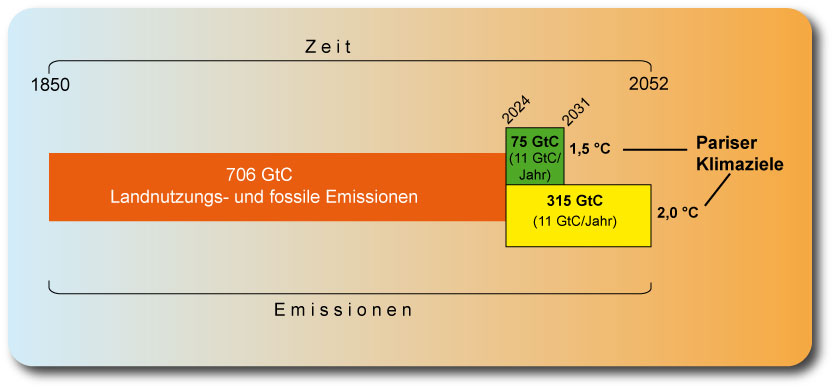
| 18:38, 25. Jun. 2025 | Verbleibendes-Budget.jpg (Datei) |  |
36 KB | 2 | |
| 10:54, 25. Jun. 2025 | Strahlung 1750-aktuell.jpg (Datei) |  |
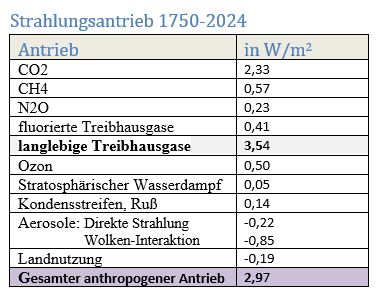
28 KB | == Beschreibung == Anthropogener Strahlungsantrieb 1750 bis 2024 ==Lizenzhinweis== {| style="border:1px solid #8888aa; background-color:#f7f8ff;padding:5px;font-size:95%;" | Quelle: Forster, P. M., C.J. Smith, T. Walsh et al. (2025): Indicators of Global Climate Change 2024: [https://doi.org/10.5194/essd-17-2641-2025 Annual update of large-scale indicators of the state of the climate system and the human influence], Earth System Science Data<br> Lizenz: [https://creativecommons.org/licenses/… | 1 |
| 10:00, 25. Jun. 2025 | Strahlungsantrieb-1750-aktuell.jpg (Datei) |  |
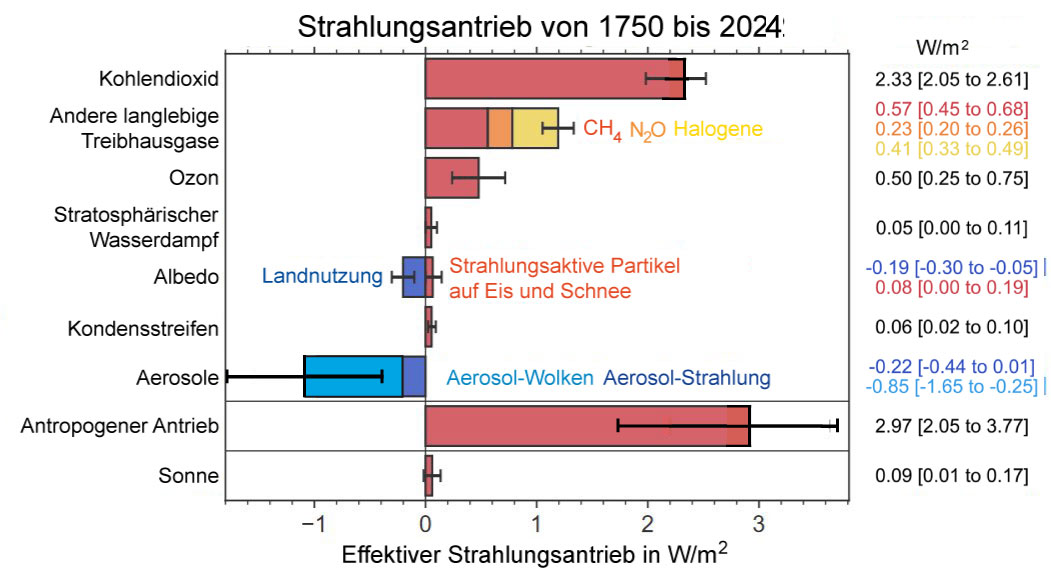
93 KB | == Beschreibung == Historischer Strahlungsantrieb durch Treibhausgase, Landnutzung, Aerosole und die Sonne 1750 bis 2024 == Lizenzhinweis == {| style="border:1px solid #8888aa; background-color:#f7f8ff;padding:5px;font-size:95%;" | Quelle: Forster, P. M., C.J. Smith, T. Walsh et al. (2025): [https://essd.copernicus.org/articles/17/2641/2025/ Indicators of Global Climate Change 2024: Annual update of large-scale indicators of the state of the climate system and the human influence], Earth Syste… | 1 |
| 08:58, 25. Jun. 2025 | THG-Konzentration aktuell.jpg (Datei) |  |
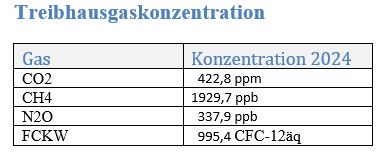
13 KB | == Beschreibung == Treibhausgas-Konzentration 2023 ==Lizenzhinweis== {| style="border:1px solid #8888aa; background-color:#f7f8ff;padding:5px;font-size:95%;" | Quelle: Forster, P. M., C.J. Smith, T. Walsh et al. (2024): [https://essd.copernicus.org/articles/17/2641/2025/ Indicators of Global Climate Change 2024: Annual update of large-scale indicators of the state of the climate system and the human influence], Earth System Science Data<br> Lizenz: [https://creativecommons.org/licenses/by/… | 1 |