Von Dieter Kasang hochgeladene Dateien
Aus Klimawandel
Diese Spezialseite listet alle hochgeladenen Dateien auf.
| Datum | Name | Vorschaubild | Größe | Beschreibung | Versionen |
|---|---|---|---|---|---|
| 18:55, 15. Jul. 2025 | Earth warm's.jpg (Datei) |  |
11 KB | ==Lizenzhinweis== {| style="border:1px solid #8888aa; background-color:#f7f8ff;padding:5px;font-size:95%;" | Quelle: NASA ClimateKids: [https://climatekids.nasa.gov/health-report-sea-ice/ Planet Health Report] <br> Lizenz: public domain |} | 1 |
| 18:51, 15. Jul. 2025 | Earth warming.jpg (Datei) |  |
14 KB | == Beschreibung == Die Erde erwärmt sich ==Lizenzhinweis== {| style="border:1px solid #8888aa; background-color:#f7f8ff;padding:5px;font-size:95%;" | Quelle: NASA ClimateKids: Planet Health Report: Temperature, https://climatekids.nasa.gov/health-report-temp/ <br> Lizenz: public domain |} | 1 |
| 20:22, 7. Jul. 2025 | Pacific Decadal Oscillation.jpg (Datei) |  |
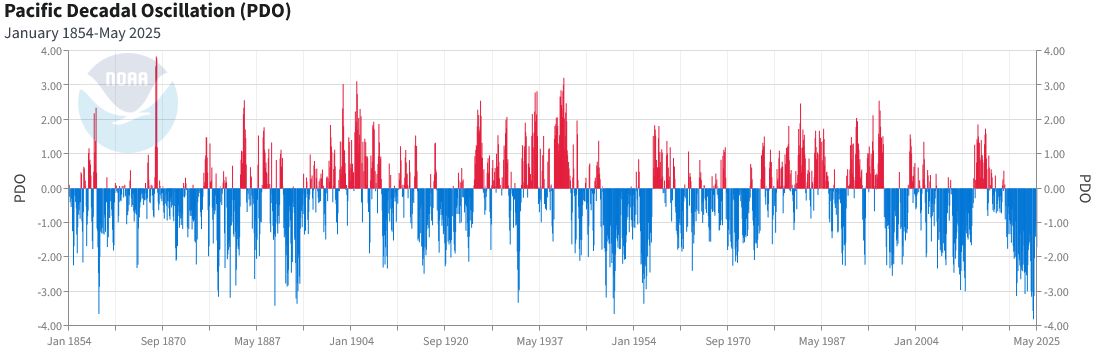
63 KB | Pazifische Dekadenoszillation (PDO) == Lizenzhinweis == {| style="border:1px solid #8888aa; background-color:#f7f8ff;padding:5px;font-size:95%;" |Quelle: NOAA (2025): Pacific Decadal Oscillation (PDO), https://www.ncei.noaa.gov/access/monitoring/pdo/ Lizenz: public domain |} | 1 |
| 13:40, 2. Jul. 2025 | Earth's albedo 2000-2025.jpg (Datei) |  |
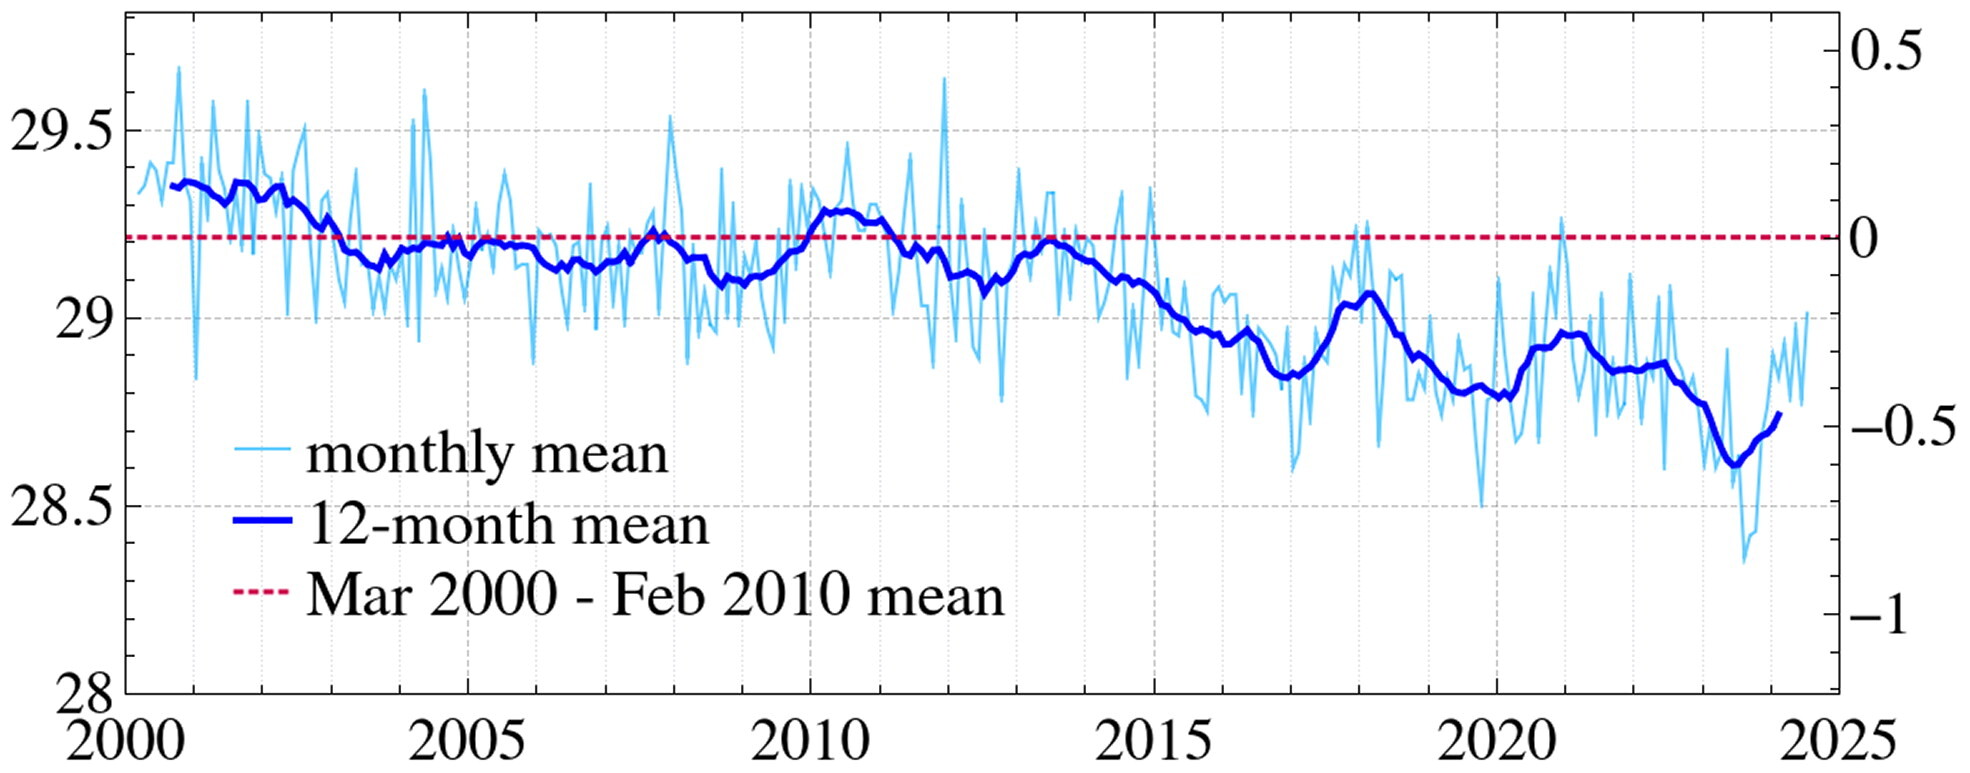
212 KB | Änderung der planetaren Albedo 2000-2025 == Lizenzhinweis == {| style="border:1px solid #8888aa; background-color:#f7f8ff;padding:5px;font-size:95%;" |Quelle: Hansen, J. E., P. Kharecha, M. Sato et al. (2025): Global Warming Has Accelerated: Are the United Nations and the Public Well-Informed? Environment: Science and Policy for Sustainable Development, 67(1), 6–44. https://doi.org/10.1080/00139157.2025.2434494<br> Lizenz: [https://creativecommons.org/licenses/by/4.0/ CC BY 4.0] |} | 1 |
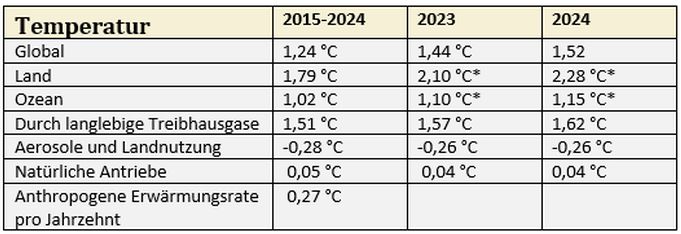
| 17:56, 26. Jun. 2025 | Temperatur 2024.jpg (Datei) |  |
37 KB | 2 | |
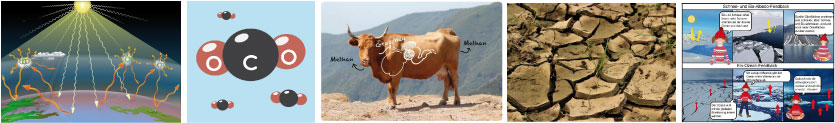
| 15:24, 26. Jun. 2025 | 5-einfache-Bilder.jpg (Datei) | 42 KB | 2 | ||
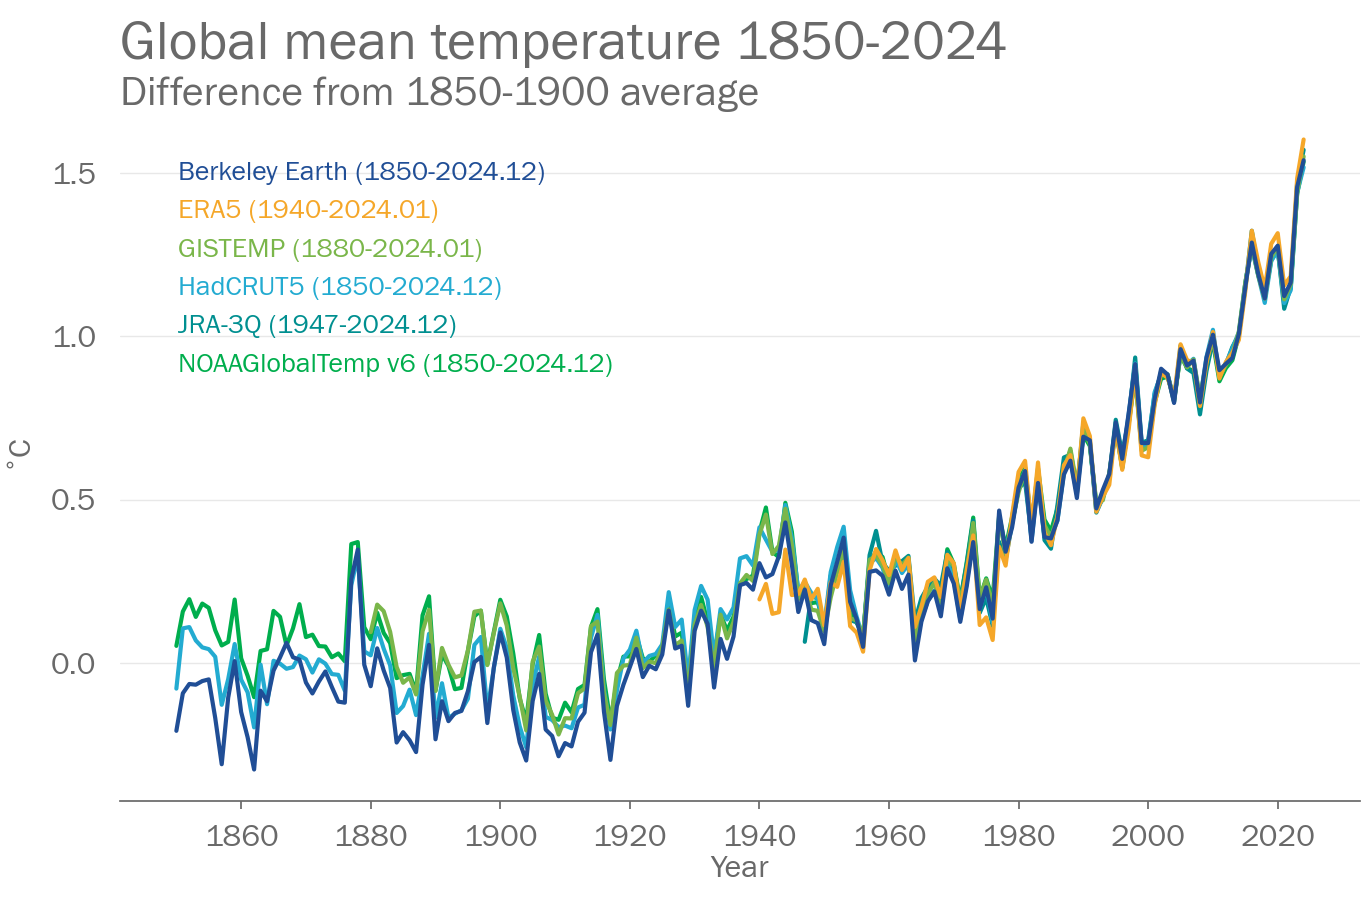
| 11:13, 26. Jun. 2025 | Global mean temp 2024.png (Datei) |  |
217 KB | == Beschreibung == Globale Jahresmitteltemperatur 1850-2024, relativ zum Mittel 1850-1900 (vorindustriell). == Lizenzhinweis == {| style="border:1px solid #8888aa; background-color:#f7f8ff;padding:5px;font-size:95%;" | Quelle: World Meteorological Organization, WMO (2025): State of the global climate 2024, https://wmo.int/publication-series/state-of-global-climate-2024</br> Lizenz: Reproduction of short excerpts of WMO materials, figures and photographs on this website is authorized free of c… | 1 |
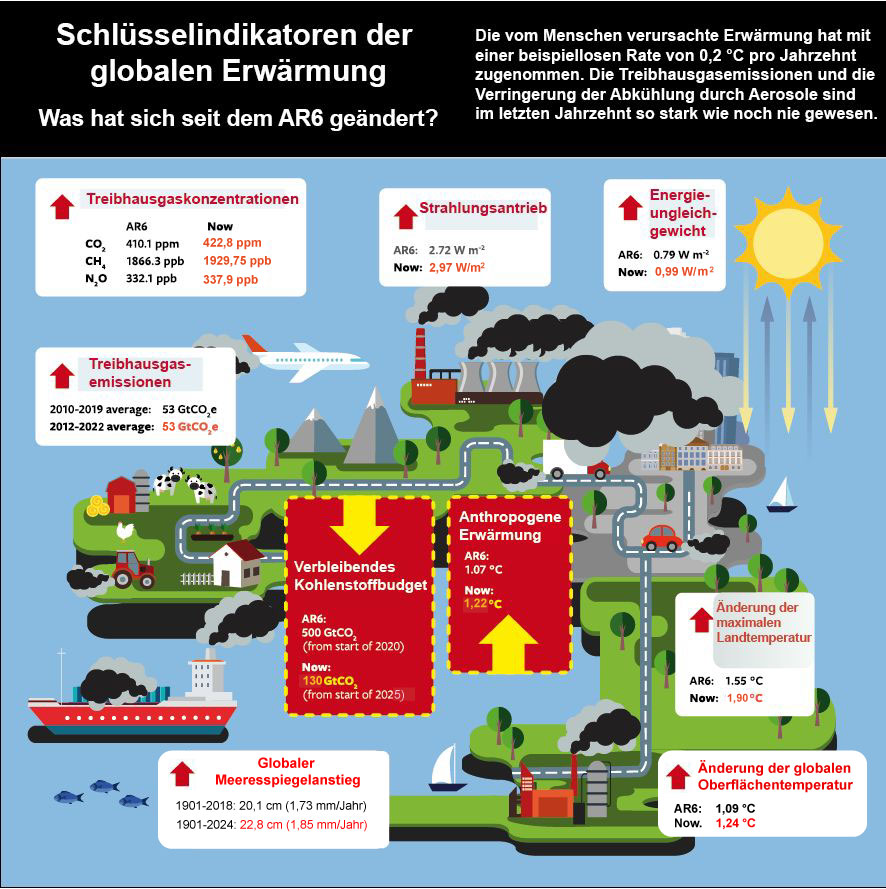
| 19:55, 25. Jun. 2025 | Klimaindikatoren-2024.jpg (Datei) |  |
187 KB | 2 | |
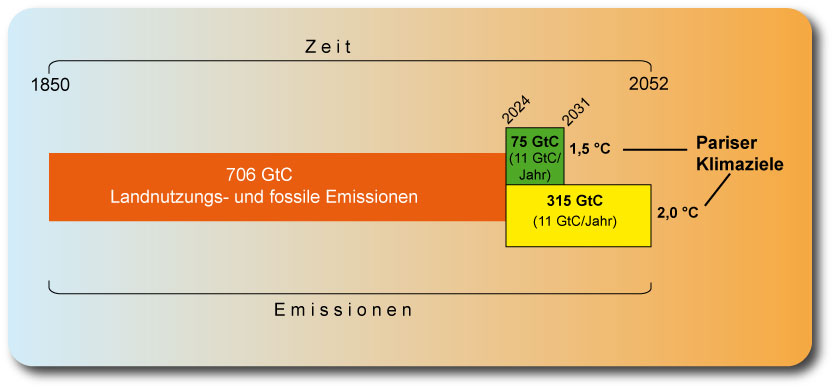
| 18:38, 25. Jun. 2025 | Verbleibendes-Budget.jpg (Datei) |  |
36 KB | 2 | |
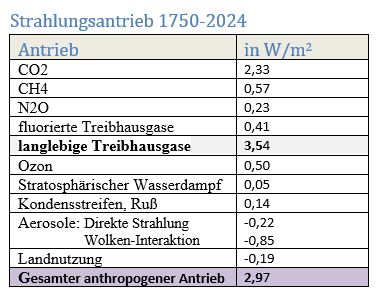
| 10:54, 25. Jun. 2025 | Strahlung 1750-aktuell.jpg (Datei) |  |
28 KB | == Beschreibung == Anthropogener Strahlungsantrieb 1750 bis 2024 ==Lizenzhinweis== {| style="border:1px solid #8888aa; background-color:#f7f8ff;padding:5px;font-size:95%;" | Quelle: Forster, P. M., C.J. Smith, T. Walsh et al. (2025): Indicators of Global Climate Change 2024: [https://doi.org/10.5194/essd-17-2641-2025 Annual update of large-scale indicators of the state of the climate system and the human influence], Earth System Science Data<br> Lizenz: [https://creativecommons.org/licenses/… | 1 |
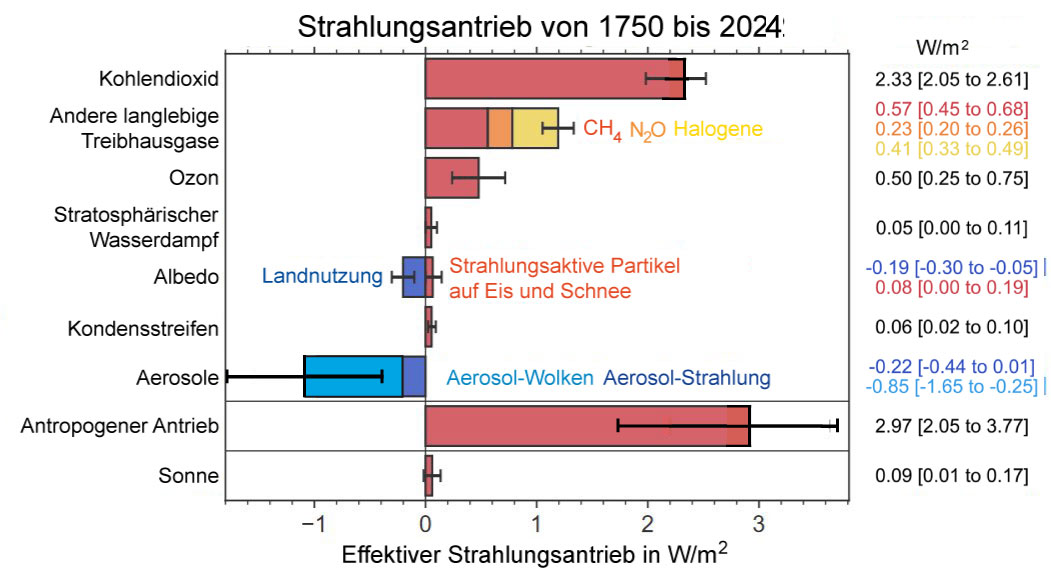
| 10:00, 25. Jun. 2025 | Strahlungsantrieb-1750-aktuell.jpg (Datei) |  |
93 KB | == Beschreibung == Historischer Strahlungsantrieb durch Treibhausgase, Landnutzung, Aerosole und die Sonne 1750 bis 2024 == Lizenzhinweis == {| style="border:1px solid #8888aa; background-color:#f7f8ff;padding:5px;font-size:95%;" | Quelle: Forster, P. M., C.J. Smith, T. Walsh et al. (2025): [https://essd.copernicus.org/articles/17/2641/2025/ Indicators of Global Climate Change 2024: Annual update of large-scale indicators of the state of the climate system and the human influence], Earth Syste… | 1 |
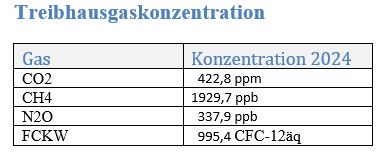
| 08:58, 25. Jun. 2025 | THG-Konzentration aktuell.jpg (Datei) |  |
13 KB | == Beschreibung == Treibhausgas-Konzentration 2023 ==Lizenzhinweis== {| style="border:1px solid #8888aa; background-color:#f7f8ff;padding:5px;font-size:95%;" | Quelle: Forster, P. M., C.J. Smith, T. Walsh et al. (2024): [https://essd.copernicus.org/articles/17/2641/2025/ Indicators of Global Climate Change 2024: Annual update of large-scale indicators of the state of the climate system and the human influence], Earth System Science Data<br> Lizenz: [https://creativecommons.org/licenses/by/… | 1 |
| 08:25, 25. Jun. 2025 | Global THG emissions2023.jpg (Datei) |  |
26 KB | 2 | |
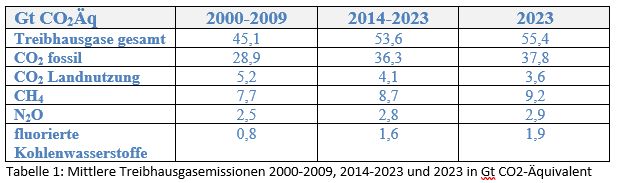
| 08:16, 25. Jun. 2025 | THG-Emissionen 2000-2023.jpg (Datei) |  |
26 KB | 2 | |
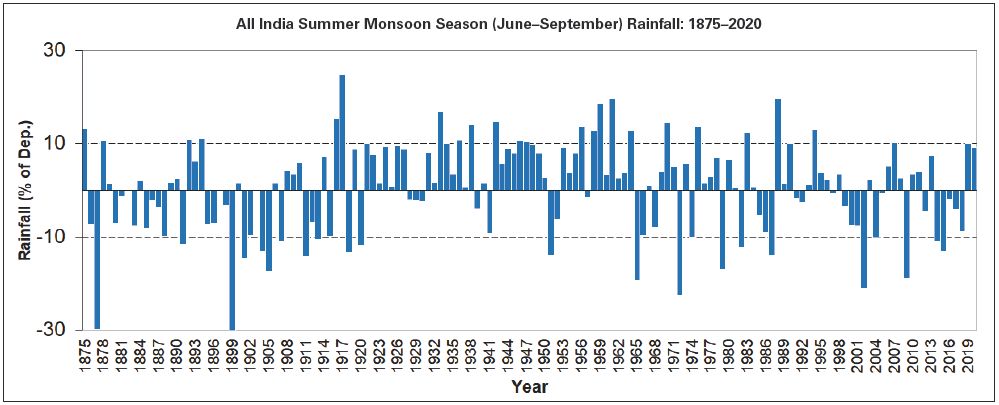
| 18:50, 23. Jun. 2025 | India rainfall 1875-2020 Monsoon season.jpg (Datei) |  |
62 KB | == Beschreibung == Niederschläge über Indien während der Monsunzeit 1875-2020 == Lizenzhinweis == {| style="border:1px solid #8888aa; background-color:#f7f8ff;padding:5px;font-size:95%;" |Quelle: WMO (2021): State of the Climate in Asia, https://library.wmo.int/records/item/68890-state-of-the-climate-in-asia-2023 <br> Lizenz: The right of publication in print, electronic and any other form and in any language is reserved by WMO. Short extracts from WMO publications may be reproduced without aut… | 1 |
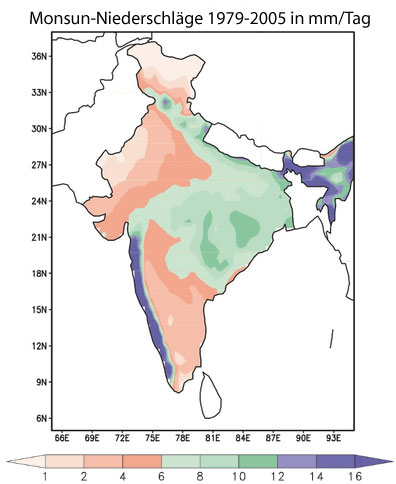
| 10:47, 21. Jun. 2025 | India-monsoon-prec-1979-200.jpg (Datei) |  |
32 KB | Regionale Verteilung der Monsun-Niederschläge 1979-2005 in mm/Tag == Lizenzhinweis == {| style="border:1px solid #8888aa; background-color:#f7f8ff;padding:5px;font-size:95%;" |Quelle: Kulkarni, A., T.P. Sabin, J.S. Chowdary et al. (2020): Precipitation Changes in India, https://doi.org/10.1007/978-981-15-4327-2_3 In: Krishnan, R., J. Sanjay, C. Gnanaseelan et al., eds (2020): Assessment of Climate Change over the Indian Region https://link.springer.com/book/10.1007/978-981-15-4327-2<br> Lizenz… | 1 |
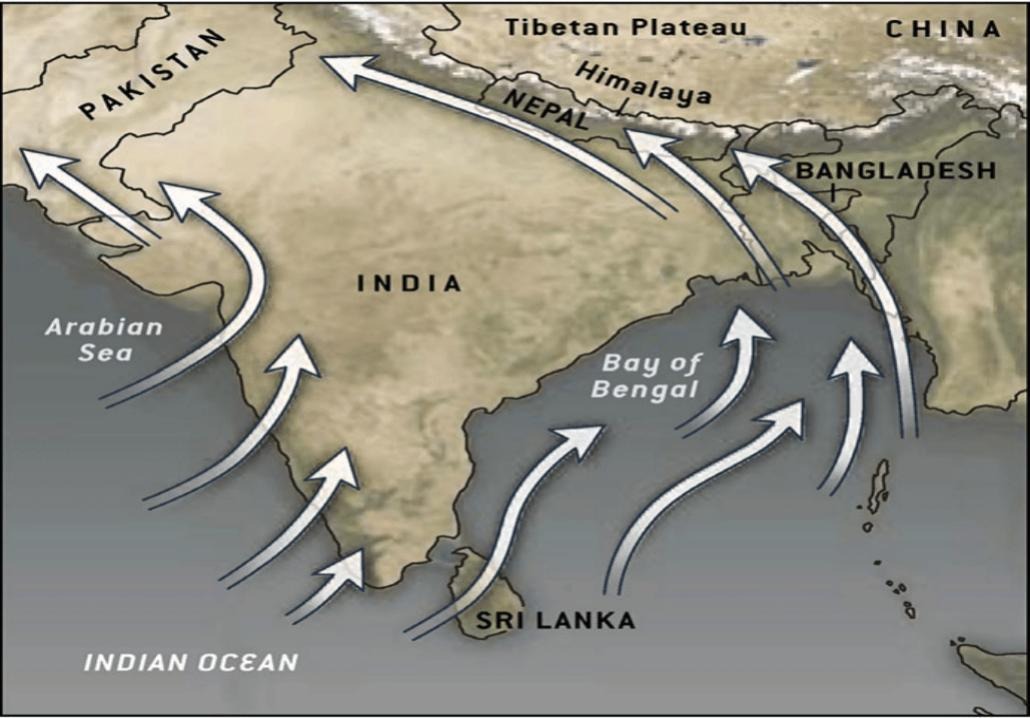
| 16:47, 20. Jun. 2025 | S-Asian monsoon syste.jpg (Datei) |  |
100 KB | == Beschreibung == Der Südasiatische Sommermonsun == Lizenzhinweis == {| style="border:1px solid #8888aa; background-color:#f7f8ff;padding:5px;font-size:95%;" |Quelle: Fiaz, A., G. Rahman, H.-H. Kwon (2025): Impacts of climate change on the South Asian monsoon: A comprehensive review of its variability and future projections, Journal of Hydro-environment Research 59, https://doi.org/10.1016/j.jher.2025.100654<br> Lizenz: CC BY-NC-ND 4.0, http://creativecommons.org/licenses/by-nc-nd/4.0/ |} | 1 |
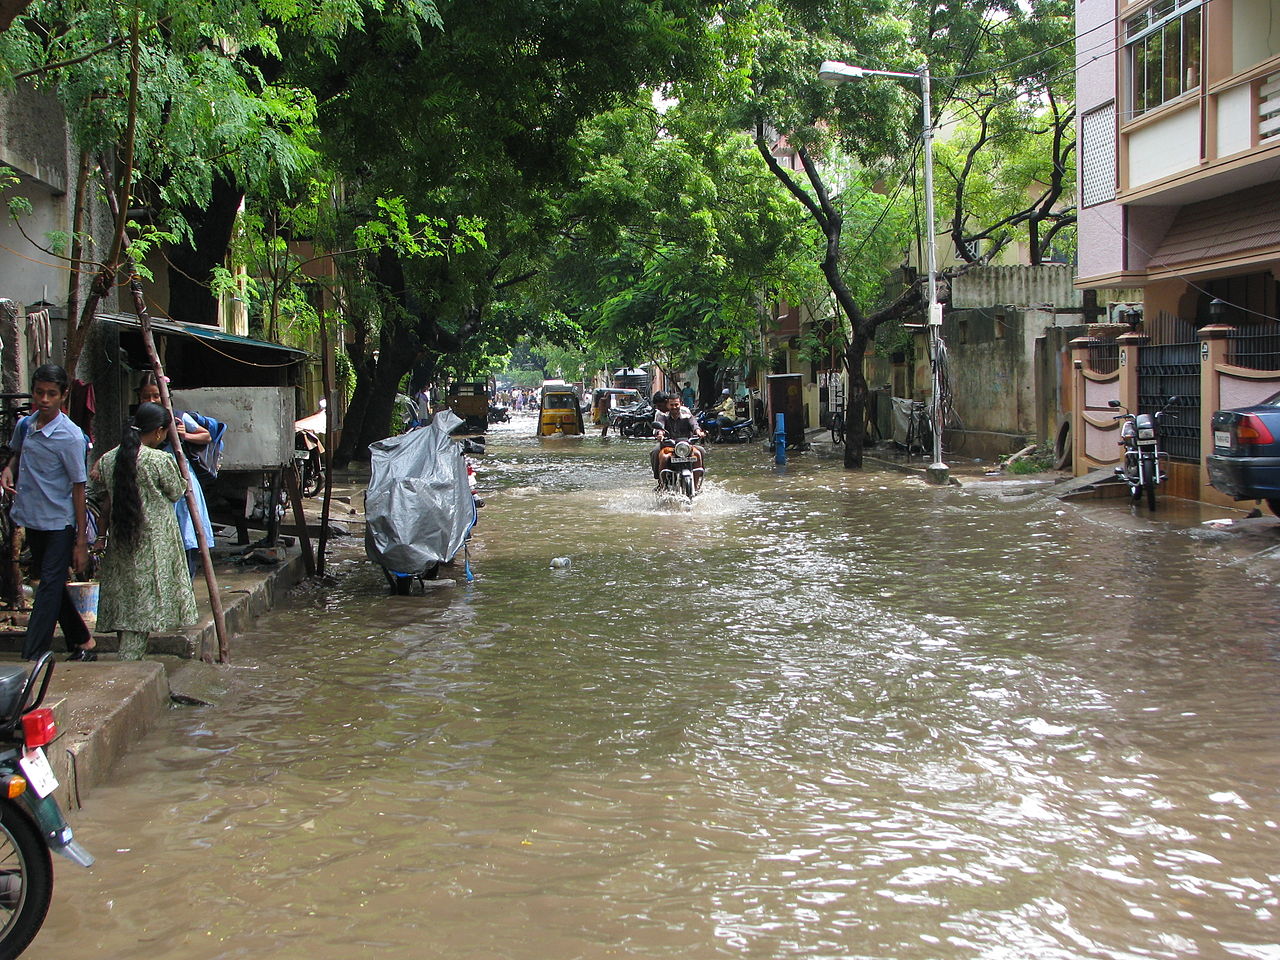
| 16:42, 20. Jun. 2025 | Chennai Monsoon rain.jpg (Datei) |  |
395 KB | == Beschreibung == Straßenszene in Chennai nach einem Monsunregen == Lizenzhinweis == {| style="border:1px solid #8888aa; background-color:#f7f8ff;padding:5px;font-size:95%;" |Quelle: Wikimedia Commons (2008): People going about their daily lives commuting to work or school just after heavy morning rains flooded the streets. https://commons.wikimedia.org/wiki/File:India_-_Chennai_-_Monsoon_-_04_(3058215637).jpg<br> Lizenz: CC BY https://creativecommons.org/licenses/by/2.0/deed.en |} | 1 |
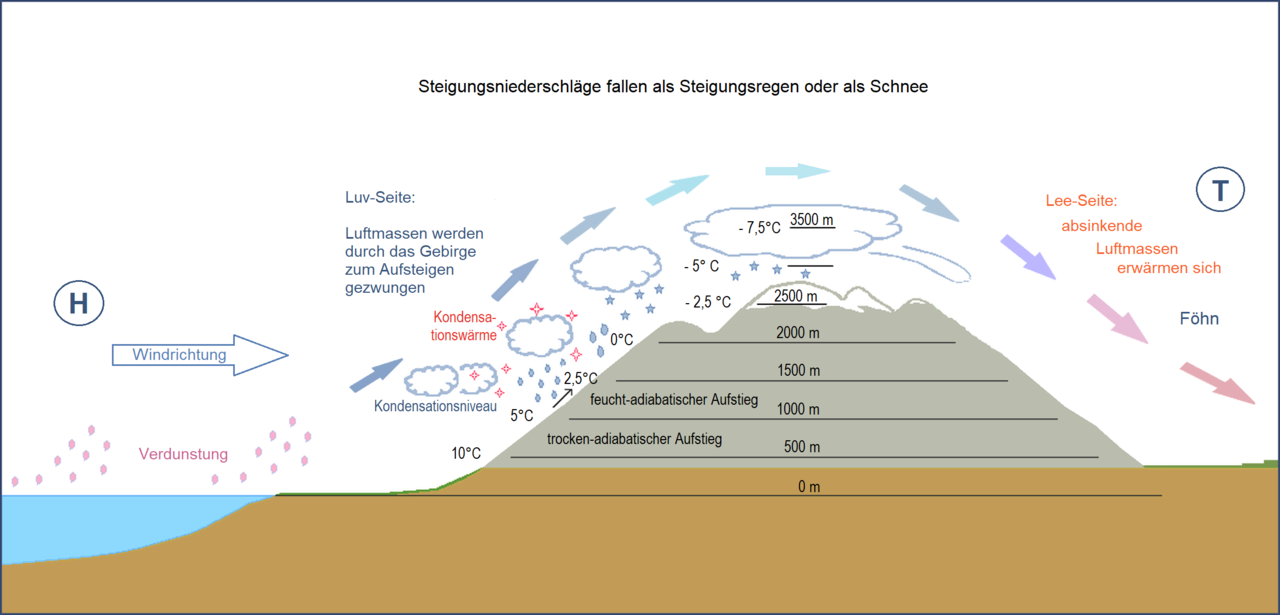
| 19:22, 19. Jun. 2025 | Steigungsregen Föhn.png (Datei) |  |
162 KB | == Beschreibung == Steigungsniederschläge fallen als Steigungsregen oder Schnee ==Lizenzhinweis== {| style="border:1px solid #8888aa; background-color:#f7f8ff;padding:5px;font-size:95%;" | Quelle: Wikipedia (2016): Steigungsniederschläge fallen als Steigungsregen oder Schnee, Author: Geo-Science-International,https://commons.wikimedia.org/wiki/File:Steigungsregen.png <br> Lizenz: CC 0 https://creativecommons.org/publicdomain/zero/1.0/deed.en |} | 1 |
| 19:14, 11. Jun. 2025 | CO2 Mauna Loa Wachstumsrate.jpg (Datei) |  |
78 KB | 4 | |
| 18:59, 11. Jun. 2025 | Konzentration CO2 aktuell.jpg (Datei) |  |
88 KB | 6 | |
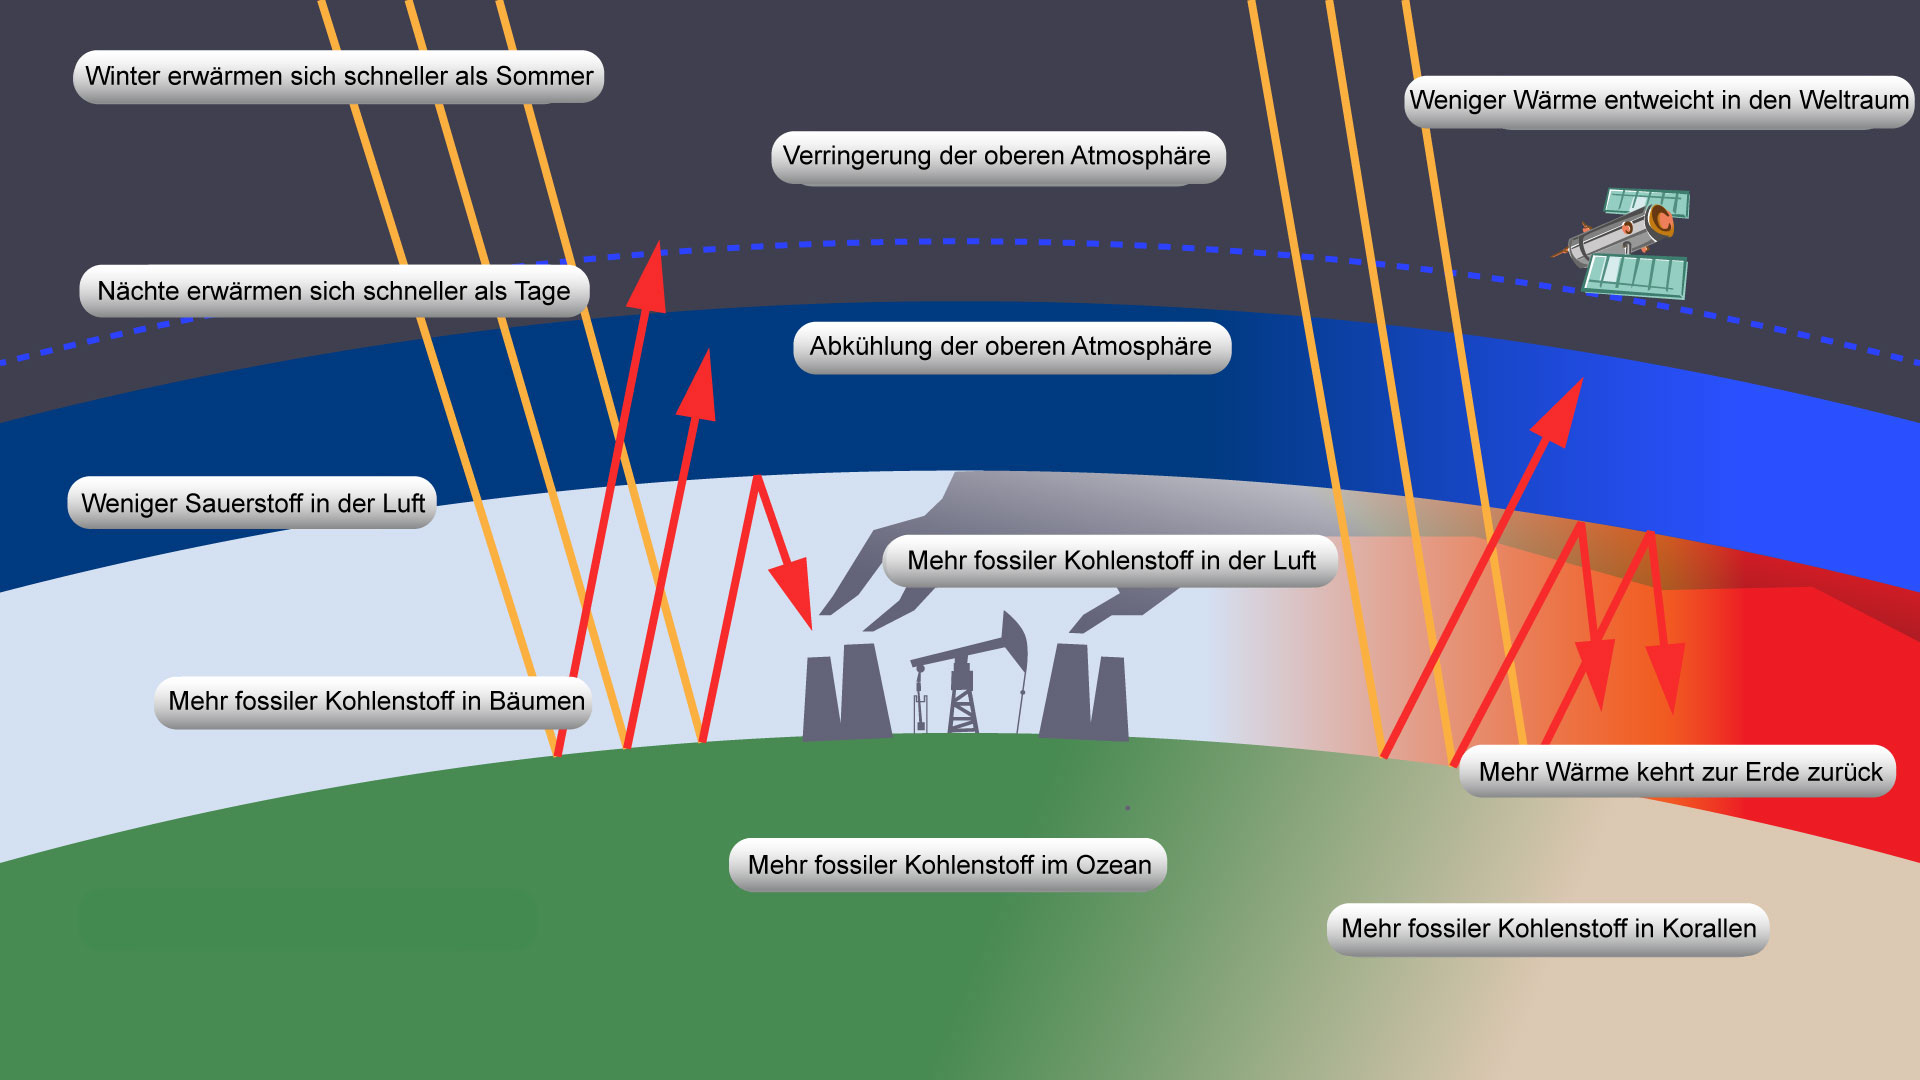
| 15:59, 11. Jun. 2025 | How Earth Warms.jpg (Datei) |  |
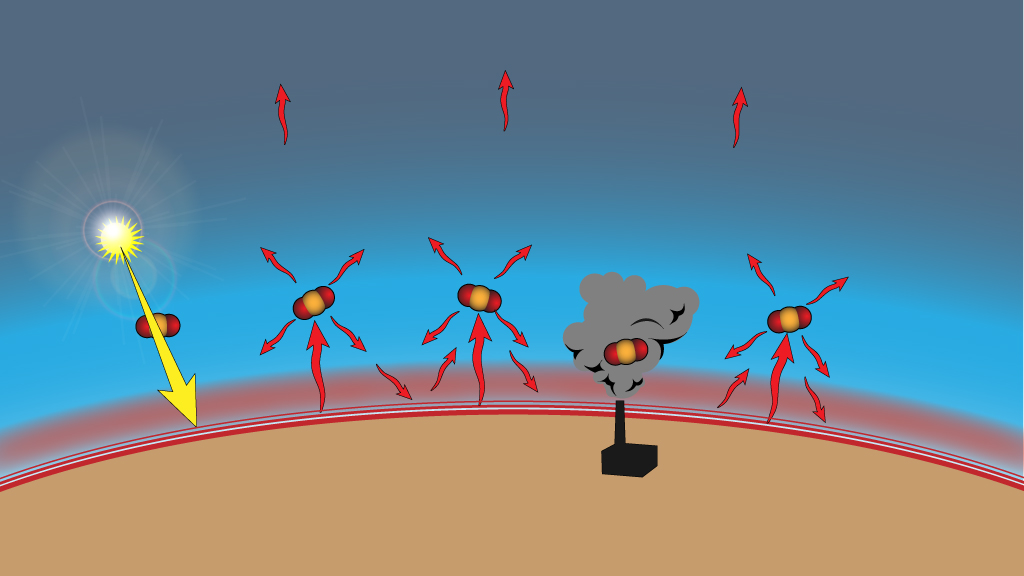
160 KB | == Beschreibung == Der Treibhauseffekt durch den Menschen. == Lizenzhinweis == {| style="border:1px solid #8888aa; background-color:#f7f8ff;padding:5px;font-size:95%;" |Quelle: Skeptical Science: How Earth Warms, https://skepticalscience.com/graphics.php?g=266 Aus Graphik-Sammlung: Climate Graphics: JG Illustrations, https://skepticalscience.com/graphics.php?c=7 <br> Lizenz: [https://creativecommons.org/licenses/by/4.0/ CC BY-SA] |} | 1 |
| 15:48, 11. Jun. 2025 | Ursachen Klimawandel.jpg (Datei) |  |
12 KB | == Beschreibung == Der Treibhauseffekt in einfacher Darstellung (ohne Beschriftung) == Lizenzhinweis == {| style="border:1px solid #8888aa; background-color:#f7f8ff;padding:5px;font-size:95%;" |Quelle: Skeptical Science: Greenhouse Effect, https://skepticalscience.com/graphics.php?g=221 aus Slg.: https://skepticalscience.com/graphics.php<br> Lizenz: [https://creativecommons.org/licenses/by/4.0/ CC BY-SA] |} | 1 |
| 15:36, 11. Jun. 2025 | WaterTank-inflow-outflow-dt.jpg (Datei) |  |
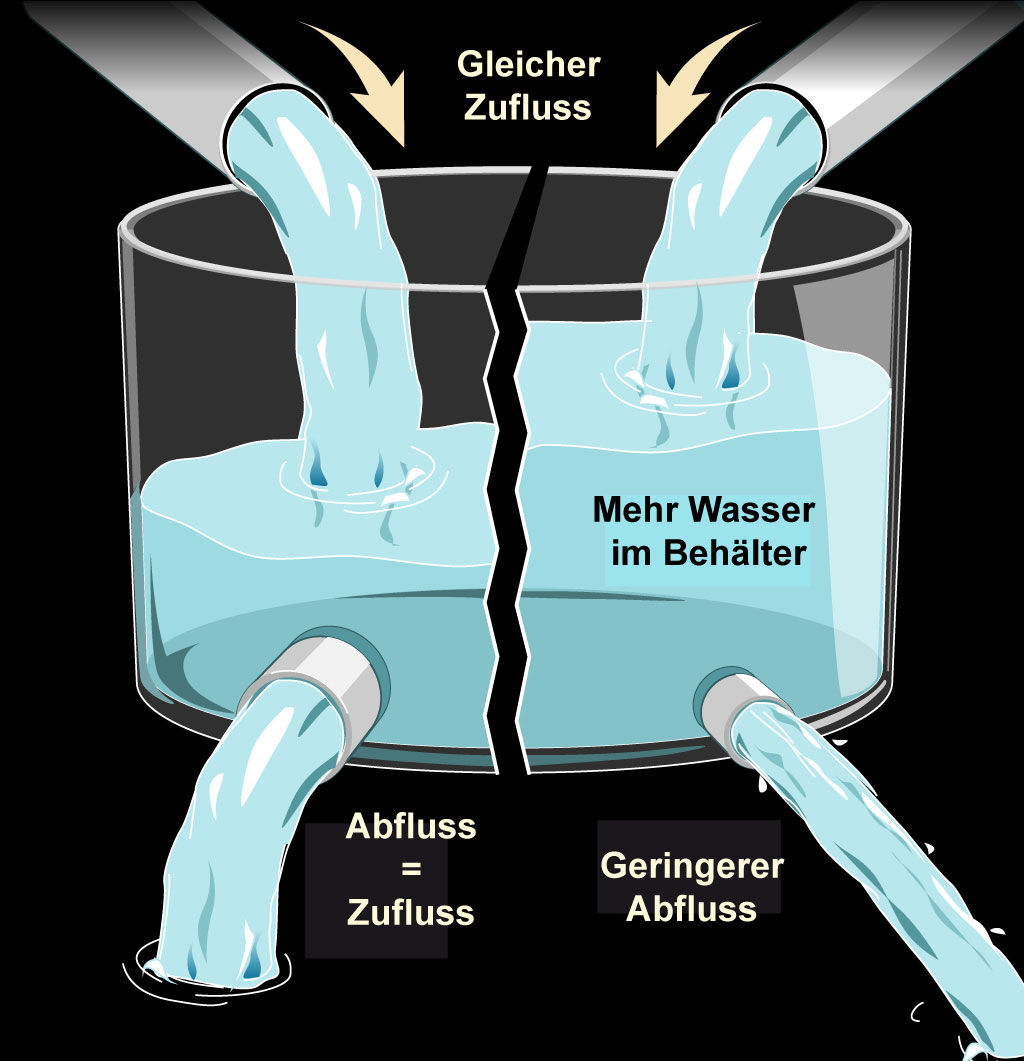
124 KB | == Beschreibung == Wassertank als Analogie zum Treibhauseffekt: Der Zufluss der Wärmemenge durch die Sonnenstrahlung bleibt gleich. Der Abfluss der Wärmememge in den Weltraum wird durch mehr Treibhausgase jedoch verringert. Dadurch bleibt mehr Wärme in der Atmosphäre. Quelle: Skeptical Science: CO2 Saturation Myth Part 1: Water Tank Analogy https://skepticalscience.com/graphics.php?g=103 Aus Graphik-Sammlung: Climate Graphics: JG Illustrations, https://skepticalscience.com/graphics.php?c=7 ==… | 1 |
| 15:07, 11. Jun. 2025 | Wassertank verleinerter Abfluss.jpg (Datei) |  |
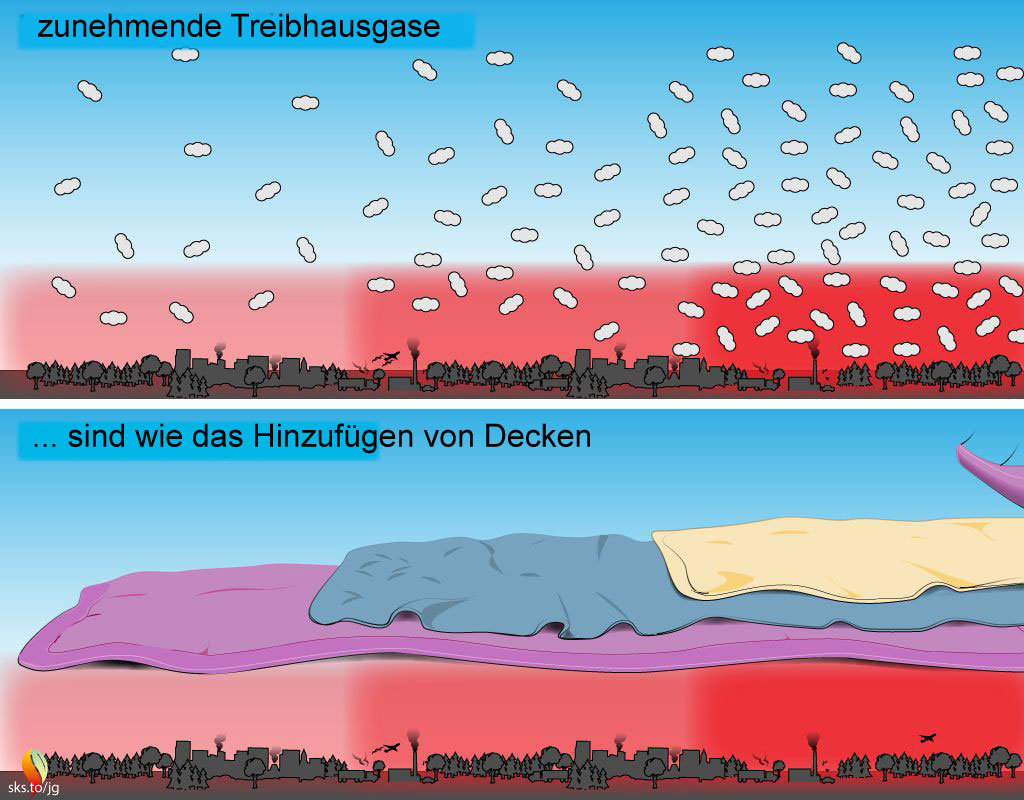
19 KB | == Beschreibung == Der zunehmende Treibhauseffekt ist wie ein Wassertank mit verkleinertem Abfluss. Wenn weniger Wärme in den Weltraum abfließt, nimmt die Wärme in der Atmosphäre zu. == Lizenzhinweis == {| style="border:1px solid #8888aa; background-color:#f7f8ff;padding:5px;font-size:95%;" |Quelle: Skeptical Science: SkS Analogy 9 - Green house gases and stack of blankets https://skepticalscience.com/SkS_Analogy_09_Greenhouse_effect_stack_of_blankets_2022.html Aus Graphik-Sammlung: [https://… | 1 |
| 15:02, 11. Jun. 2025 | GHE like adding blankets.jpg (Datei) | 143 KB | 2 | ||
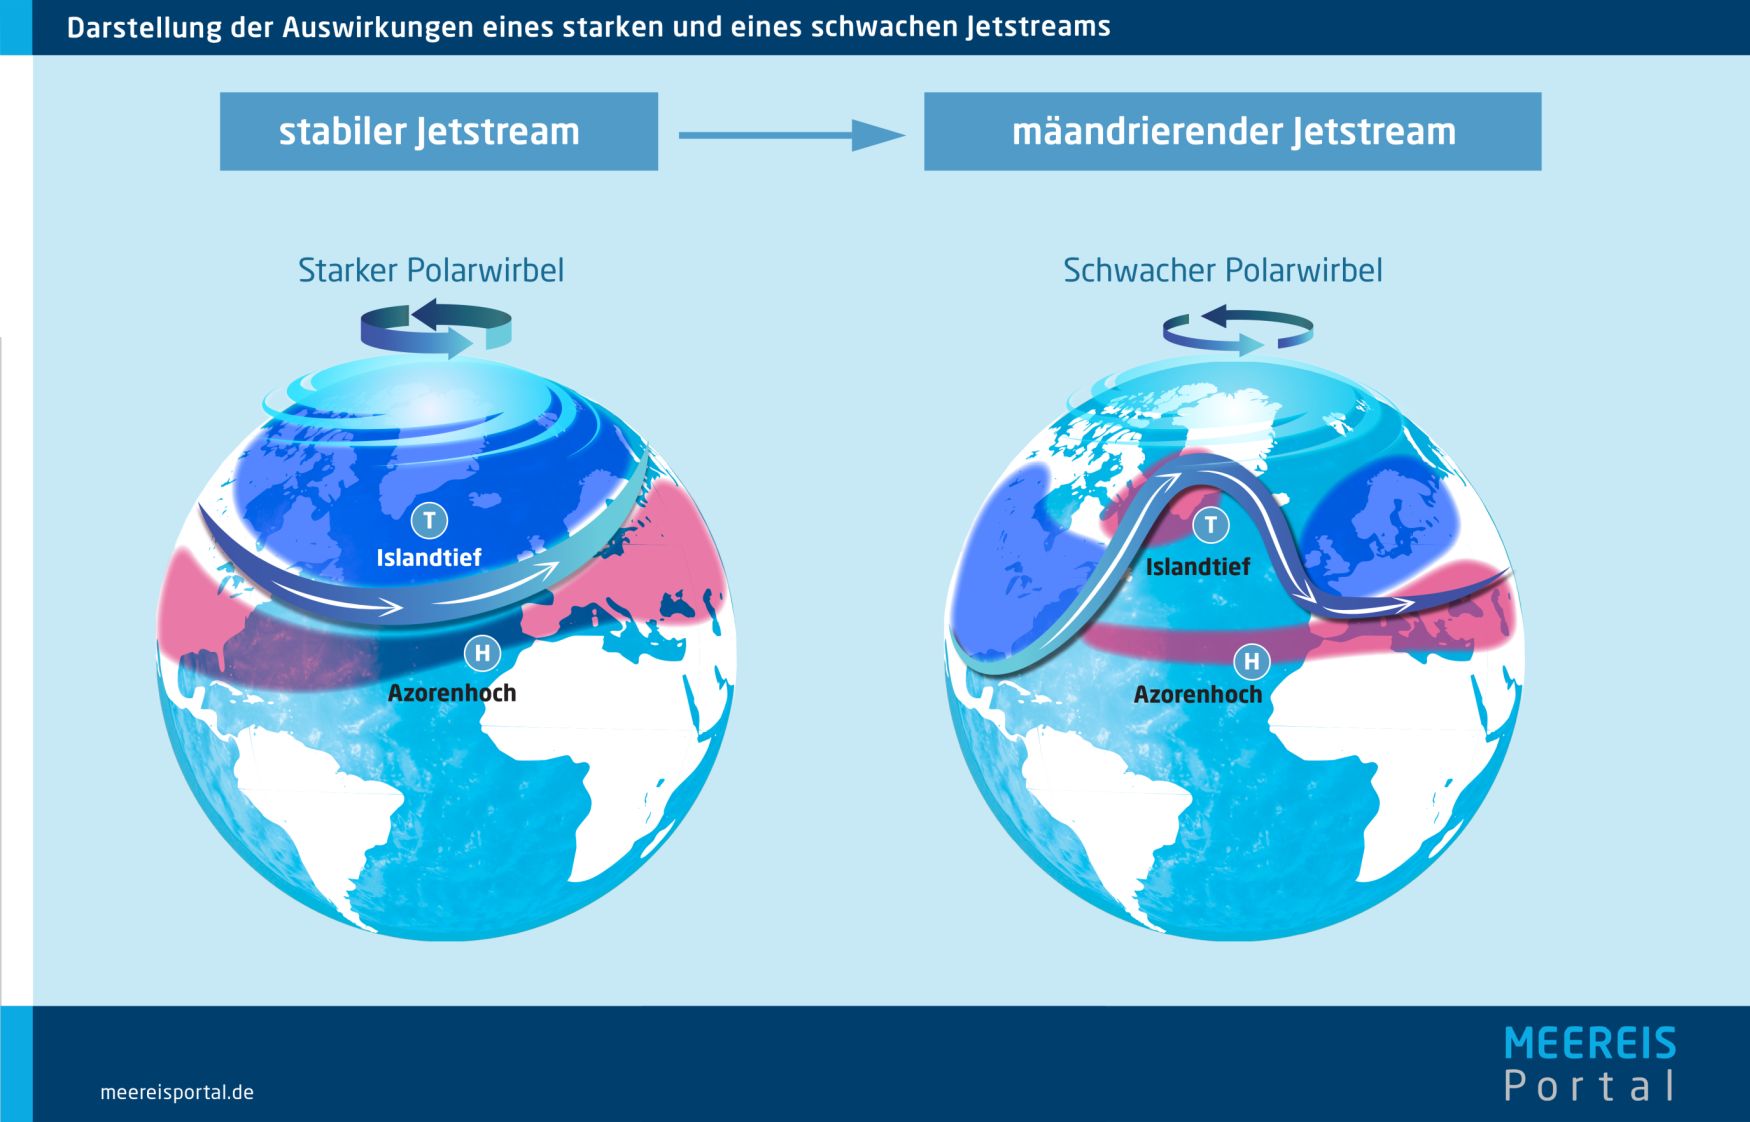
| 17:29, 10. Jun. 2025 | Starker-schwacher Jetstream.jpg (Datei) |  |
154 KB | Auswirkungen eines starken und eines schwachen Jetstreams ==Lizenzhinweis== {| style="border:1px solid #8888aa; background-color:#f7f8ff;padding:5px;font-size:95%;" | Quelle: Meereisportal: Einfluss von Meereis auf den Wärmeaustausch Atmosphäre-Ozean, https://www.meereisportal.de/karten-grafiken/infografiken<br> Lizenz: CC BY https://www.meereisportal.de/karten-grafiken/infografiken |} | 1 |
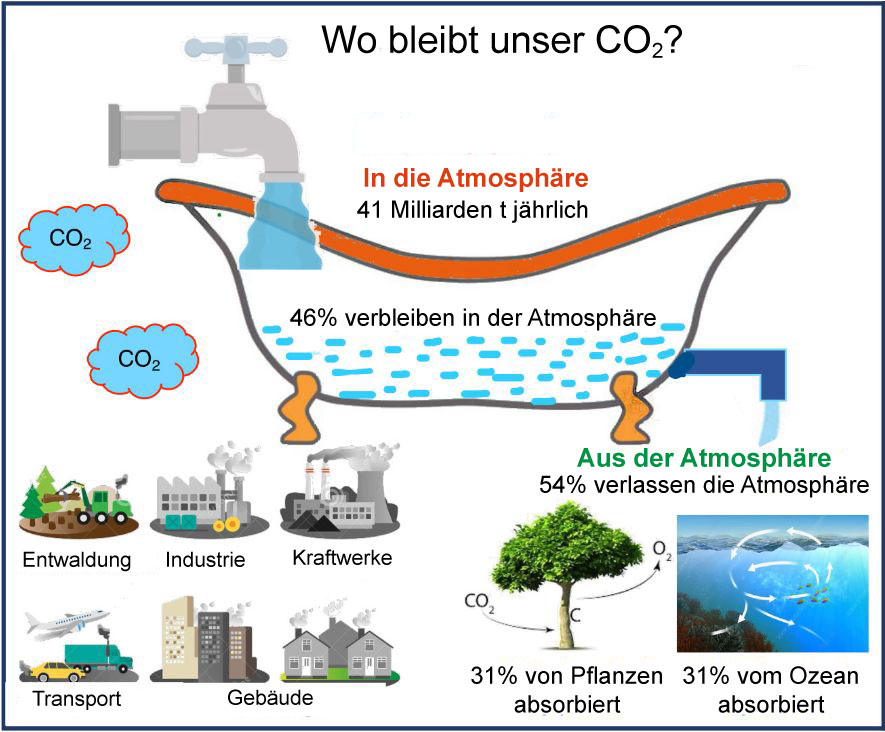
| 15:56, 9. Jun. 2025 | CO2-Emission-Absorption.jpg (Datei) |  |
119 KB | == Beschreibung == CO2-Kreislauf in einer Badewannenanalogie. Das Wasser in der Badewanne zeigt die Akkumulation von CO2 in der Atmosphäre. Über die Hälfte davon nehmen Pflanzen und der Ozean auf ==Lizenzhinweis== {| style="border:1px solid #8888aa; background-color:#f7f8ff;padding:5px;font-size:95%;" | Quelle: Chandra N and Niwa Y (2022): How quickly would we see the effects of changing greenhouse gas emissions?. Front. Young Minds. 10:695527. doi: 10.3389/frym.2022.695527, https://kids.fronti… | 1 |
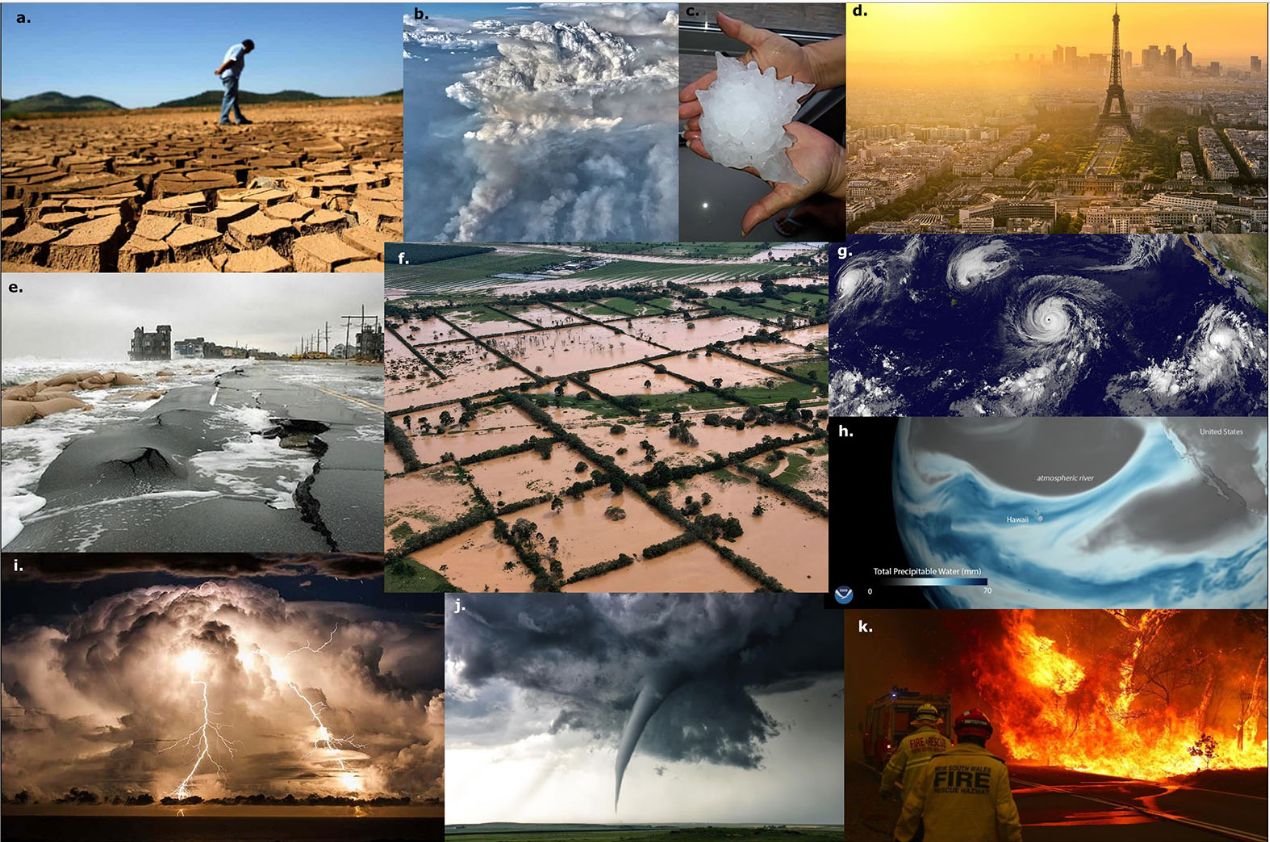
| 15:23, 9. Jun. 2025 | Wetterextreme Beispiele.jpg (Datei) |  |
226 KB | == Beschreibung == Beispiele für Wetterextreme: a) Dürre in Brasilien 2014, b) Feuer in den USA 2019, c) Hagelkörner in Argentinien 2018, d) Paris während einer Hitzewelle, e) Küstenüberflutung in den USA, f) Überschwemmung nach Hurrikan Eta in Mittelamerika 2020, g) tropische Zyklonen über dem Pazifik 2015, h) Atmosphärische Flüsse vor der Westküste der USA 2018, i) Gewitter vor Australien, j) Tornado, k) Buschfeuer in Australien 2019. ==Lizenzhinweis== {| style="border:1px solid #8888aa; back… | 1 |
| 13:09, 9. Jun. 2025 | Temp global aktuell.jpg (Datei) |  |
106 KB | 13 | |
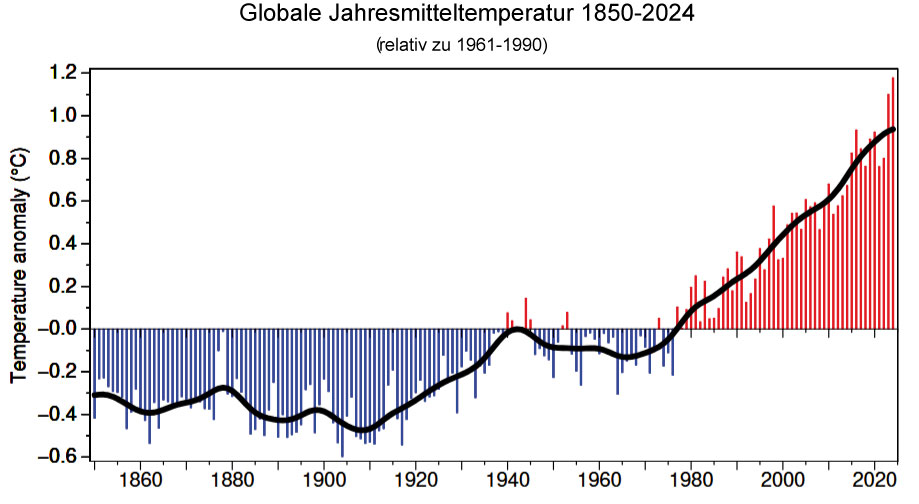
| 14:45, 8. Jun. 2025 | Global-temp-1850-2024.jpg (Datei) |  |
70 KB | == Beschreibung == Änderung der globalen Jahresmitteltemperatur 1851-2024 relativ zu 1961-1990 ==Lizenzhinweis== {| style="border:1px solid #8888aa; background-color:#f7f8ff;padding:5px;font-size:95%;" | Quelle: Osborn, T. & P. Jones (2025): Global Temperature Record, https://www.uea.ac.uk/groups-and-centres/climatic-research-unit<br> Lizenz: You may copy and disseminate this information, but it remains the property of the Climatic Research Unit, and due acknowledgement must be made. |} | 1 |
| 15:07, 5. Jun. 2025 | Anthropogene-natürliche Antriebe.png (Datei) |  |
126 KB | == Beschreibung == Modellberechnungen des aktuellen Temperaturtrends mit nur natürlichen (blau) und natürlichen und menschlichen (rot) Antrieben. == Lizenzhinweis == {| style="border:1px solid #8888aa; background-color:#f7f8ff;padding:5px;font-size:95%;" |Quelle: Deutsches Klimakonsortium, Lena Puttfarcken (2023): Ergebnisse des Weltklimarates, https://klimasimulationen.de/weltklimarat/<br> Lizenz: CC BY-NC-ND 4.0 https://creativecommons.org/licenses/by-nc-nd/4.0/deed.de | 1 |
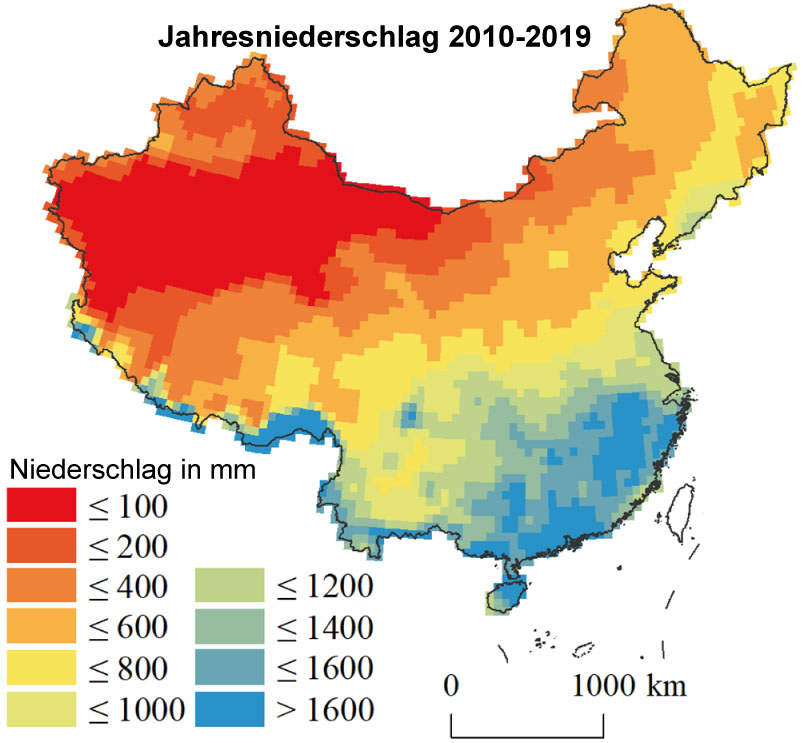
| 10:12, 2. Jun. 2025 | China-Niederschlag-2010er.jpg (Datei) |  |
92 KB | == Beschreibung == Mittlerer Jahresniederschlag 2010-2019 == Lizenzhinweis == {| style="border:1px solid #8888aa; background-color:#f7f8ff;padding:5px;font-size:95%;" |Quelle: Zhao. J., Z. Wang (2020): [https://doi.org/10.1371/journal.pone.0231671 Future trends of water resources and influences on agriculture in China]. PLoS ONE 15(4): e0231671.<br> Lizenz: [http://creativecommons.org/licenses/by/4.0/ CC BY] |} | 1 |
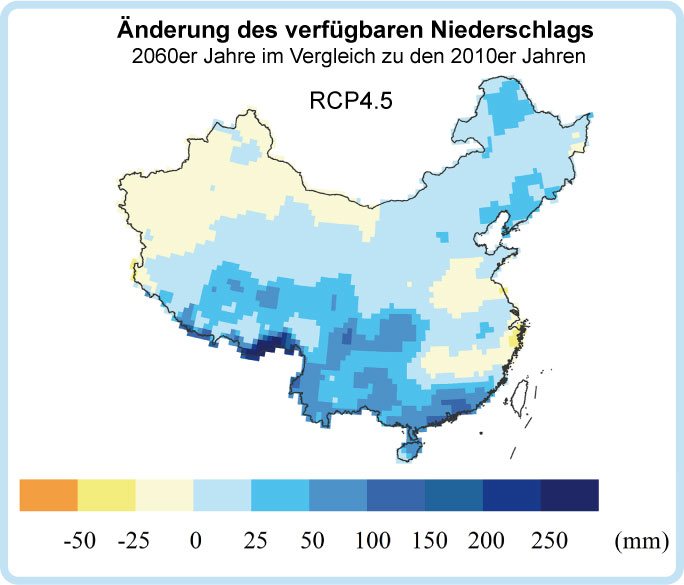
| 10:08, 2. Jun. 2025 | Niederschlag-2060er-RCP4.5.jpg (Datei) |  |
55 KB | == Beschreibung == Änderung des verfügbaren Niederschlags nach den Szenarien RCP4.5 bis 2060-2069 im Vergleich zu den 2010er Jahren. == Lizenzhinweis == {| style="border:1px solid #8888aa; background-color:#f7f8ff;padding:5px;font-size:95%;" |Quelle: Zhao. J., Z. Wang (2020): Future trends of water resources and influences on agriculture in China. PLoS ONE 15(4): e0231671. https://doi.org/10.1371/journal.pone.0231671<br> Lizenz: [http://creativecommons.org/licenses/by/4.0/ CC BY] |} | 1 |
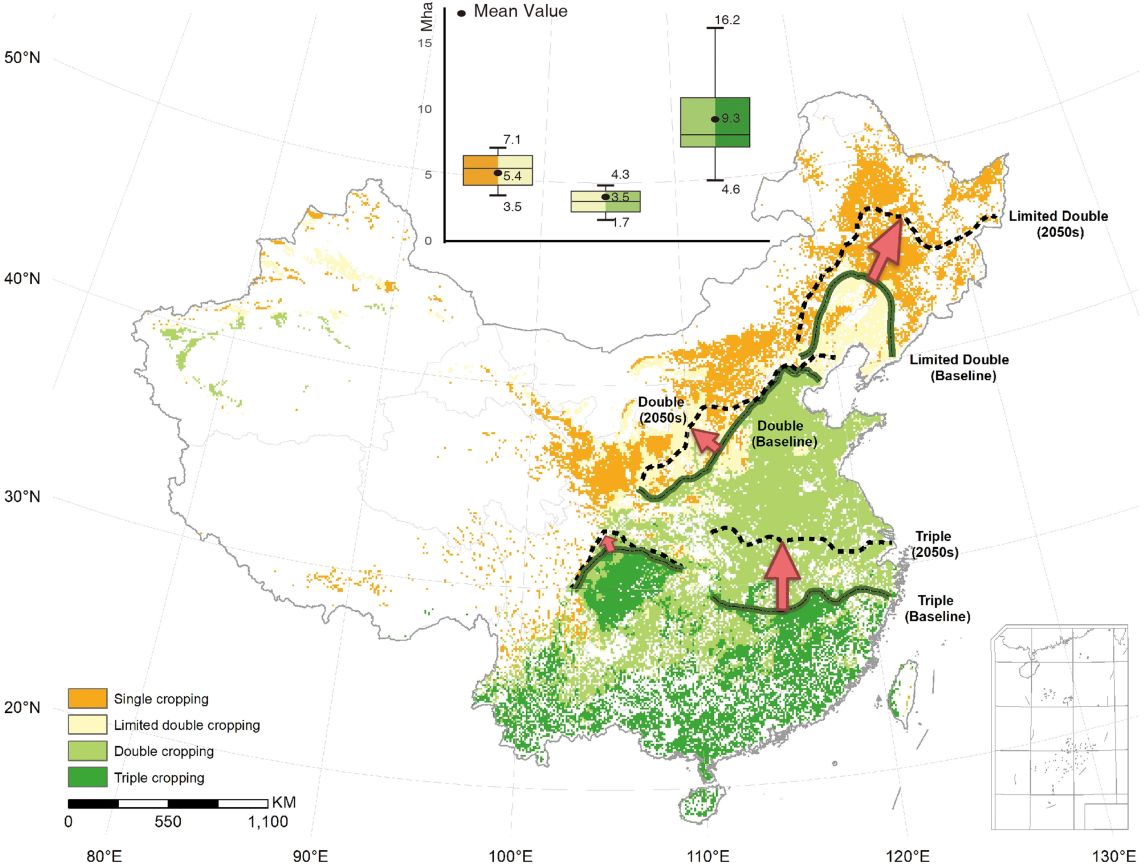
| 09:48, 2. Jun. 2025 | China multi cropping extension 2050s.jpg (Datei) |  |
134 KB | == Beschreibung == Ausdehnung von Anbauflächen mit mehrfachen Getreideernten pro Jahr durch den Klimawandel bis zu den 2050er Jahren im Vergleich zu 1881-2010. == Lizenzhinweis == {| style="border:1px solid #8888aa; background-color:#f7f8ff;padding:5px;font-size:95%;" |Liang, Z., S. Laixiang Z. Tian et al. (2023): Increase in grain production potential of China under climate change, PNAS Nexus 2, 3, https://doi.org/10.1093/pnasnexus/pgad057<br> Lizenz: CC BY-NC-ND https://creativecommons.org/li… | 1 |
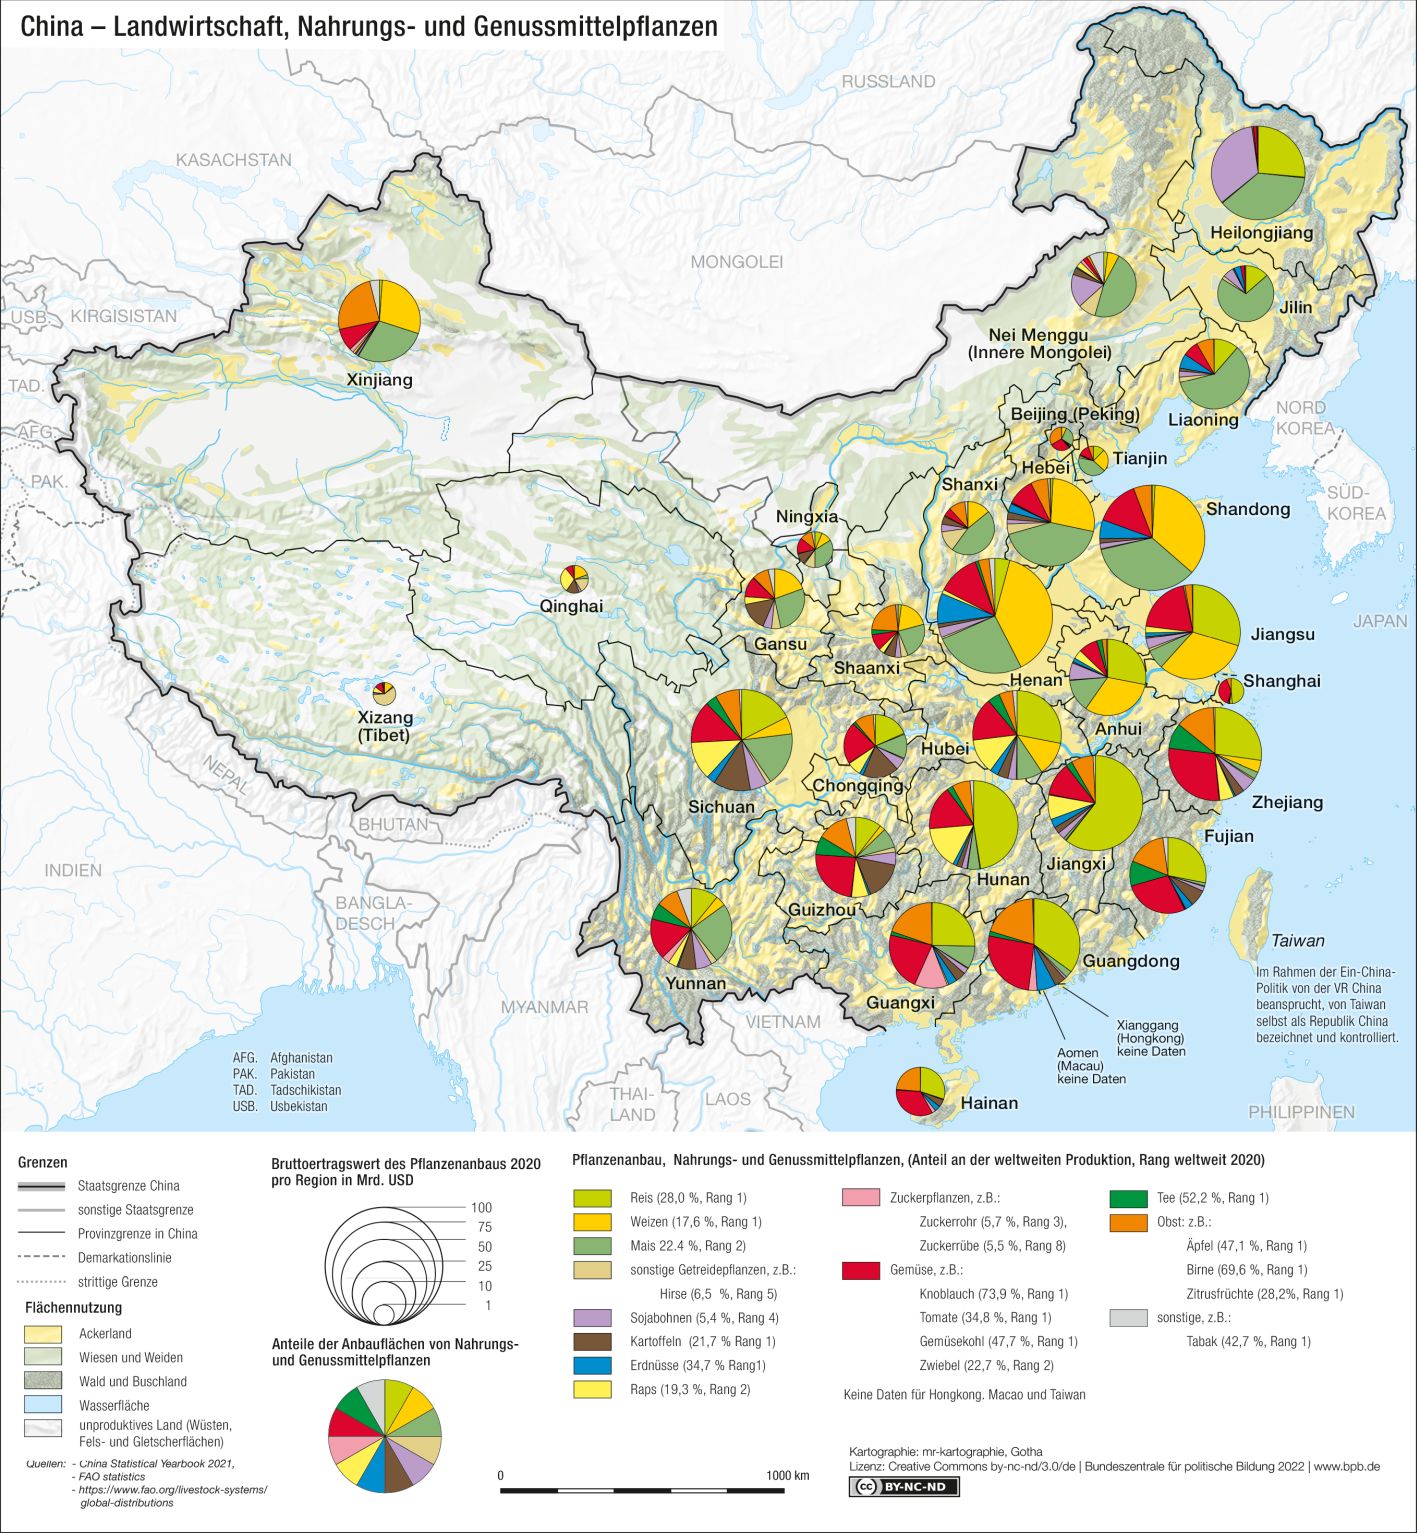
| 09:34, 2. Jun. 2025 | China-Landwirtschaft-Pflanzen.jpg (Datei) |  |
403 KB | == Beschreibung == Wichtige Anbaupflanzen in China mit Ertrag, Flächenanteil und Anteil an der weltweiten Produktion. == Lizenzhinweis == {| style="border:1px solid #8888aa; background-color:#f7f8ff;padding:5px;font-size:95%;" |Sternfeld, E., Bundeszentrale für politische Bildung (2022): Ernährungssicherung in China, https://www.bpb.de/themen/asien/china/513234/ernaehrungssicherung-in-china/ <br> Lizenz: CC BY-NC-ND |} | 1 |
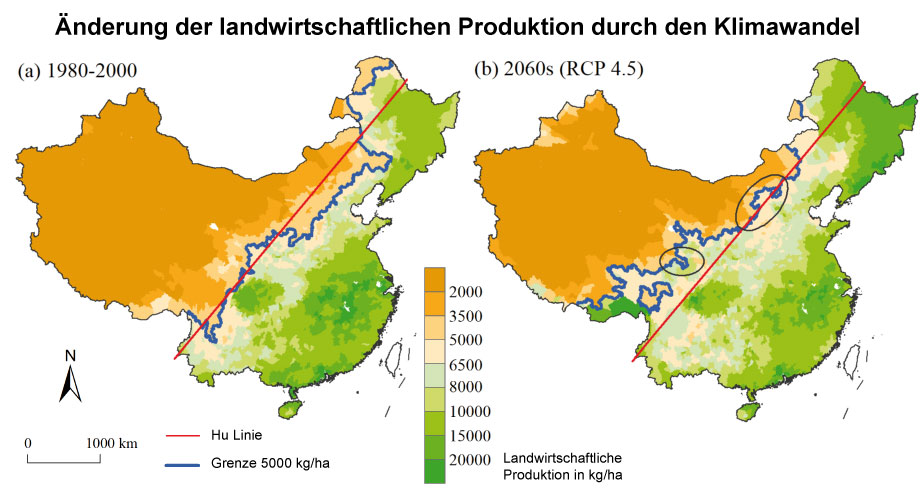
| 09:31, 2. Jun. 2025 | China ldw Produktion 1980-2060.jpg (Datei) |  |
91 KB | == Beschreibung == Änderung der landwirtschaftlichen Produktion in China: a) Produktion in kg/ha 1980-2000, a) nach dem Szenario RCP4.5 in den 2060er Jahren. == Lizenzhinweis == {| style="border:1px solid #8888aa; background-color:#f7f8ff;padding:5px;font-size:95%;" | Zhap, J. und Wang, Z. (2020): [https://journals.plos.org/plosone/article?id=10.1371/journal.pone.0231671 Future trends of water resources and influences on agriculture in China. PLoS ONE 15(4)]<br> Lizenz [https://creativecommons.… | 1 |
| 09:13, 2. Jun. 2025 | China-Änderung-ldw-Produkti.jpg (Datei) |  |
91 KB | == Beschreibung == Änderung der landwirtschaftlichen Produktion: links Produktion in kg/ha 1980-2000, rechts nach dem Szenario RCP4.5 in den 2060er Jahren. == Lizenzhinweis == {| style="border:1px solid #8888aa; background-color:#f7f8ff;padding:5px;font-size:95%;" | Zhap, J. und Wang, Z. (2020): [https://journals.plos.org/plosone/article?id=10.1371/journal.pone.0231671 PFuture trends of water resources and influences on agriculture in China. PLoS ONE 15(4)]<br> Lizenz [https://creativecommons.o… | 1 |
| 14:08, 26. Mai 2025 | Fingerprint-of-cc-dt.jpg (Datei) |  |
209 KB | == Beschreibung == Der Fingerabdruck der globalen Erwärmung ==Lizenzhinweis== {| style="border:1px solid #8888aa; background-color:#f7f8ff;padding:5px;font-size:95%;" | Quelle: Skeptical Science: [https://skepticalscience.com/graphics.php?g=222 Human Fingerprints], aus Slg. [https://skepticalscience.com/graphics.php Climate Graphics by Skeptical Science]<br /> Lizenz: [https://creativecommons.org/licenses/by/4.0/ CC BY-SA] |} | 1 |
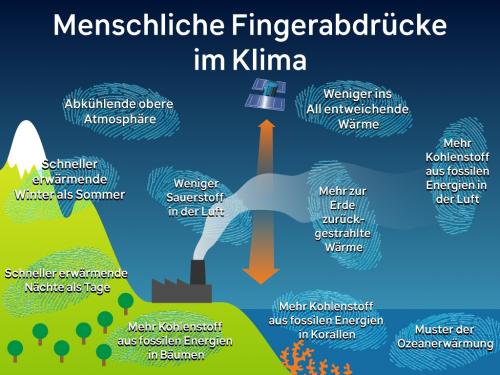
| 13:30, 26. Mai 2025 | Menschliche Fingerabdrücke.jpg (Datei) |  |
38 KB | == Beschreibung == Der menschliche Fingerabdruck beim Klimawandel ==Lizenzhinweis== {| style="border:1px solid #8888aa; background-color:#f7f8ff;padding:5px;font-size:95%;" | Quelle: Skeptical Science: Human Fingerprints, https://skepticalscience.com/graphics.php?g=467 aus Slg.: https://skepticalscience.com/graphics.php <br /> Lizenz: [https://creativecommons.org/licenses/by/4.0/ CC BY-SA] |} | 1 |
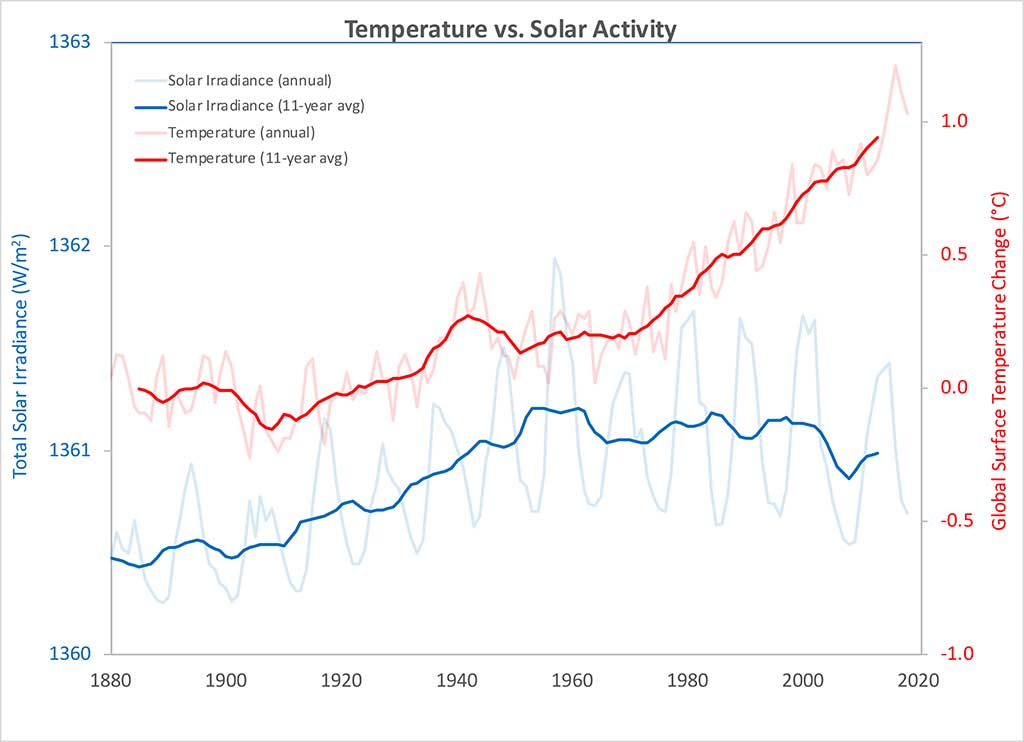
| 13:11, 26. Mai 2025 | Temp vs solar 1880-2020.jpg (Datei) |  |
49 KB | == Beschreibung == Temperaturänderung und Sonneneinstrahlung 1880 bis 2020. ==Lizenzhinweis== {| style="border:1px solid #8888aa; background-color:#f7f8ff;padding:5px;font-size:95%;" | Quelle: Skeptical Science (2016): Solar vs Temperature, https://skepticalscience.com/graphics.php?g=5 <br /> Lizenz: CC BY-SA https://creativecommons.org/licenses/by/4.0/ |} | 1 |
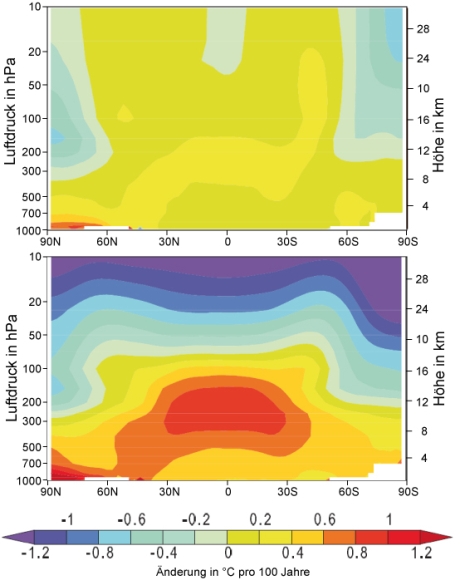
| 13:05, 26. Mai 2025 | Tropo-Stratosphäre Erwärmung.jpg (Datei) |  |
59 KB | 4 | |
| 12:46, 26. Mai 2025 | Absorbtion-reflection-dt.jpg (Datei) |  |
16 KB | == Beschreibung == Absorption und Reflektion von Sonnenstrahlung, übersetzt. == Lizenzhinweis == {| style="border:1px solid #8888aa; background-color:#f7f8ff;padding:5px;font-size:95%;" |Quelle: NASA Climate Kids: [https://climatekids.nasa.gov/heat-islands/ What Is an Urban Heat Island?]<br> Lizenz: public domain |} | 1 |
| 12:34, 26. Mai 2025 | Absorbtion reflection.jpg (Datei) |  |
73 KB | Absorption und Reflektion von Sonnenstrahlung == Lizenzhinweis == {| style="border:1px solid #8888aa; background-color:#f7f8ff;padding:5px;font-size:95%;" |Quelle: NASA Climate Kids: What Is an Urban Heat Island?, https://climatekids.nasa.gov/heat-islands/<br> Lizenz: public domain |} | 1 |
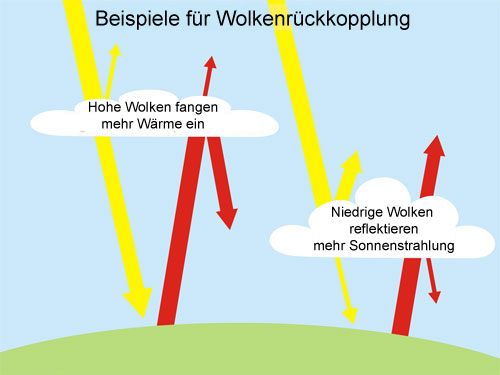
| 20:04, 25. Mai 2025 | Hohe-niedrige-Wolken-Strahlung.jpg (Datei) |  |
27 KB | == Beschreibung == Wirkung von Wolken auf die Strahlung ==Lizenzhinweis== {| style="border:1px solid #8888aa; background-color:#f7f8ff;padding:5px;font-size:95%;" | Quelle: Skeptical Science: Urban Heat Island, https://skepticalscience.com/graphics.php?g=9 aus Slg.: https://skepticalscience.com/graphics.php <br> Lizenz: CC BY-SA https://creativecommons.org/licenses/by/4.0 / |} | 1 |
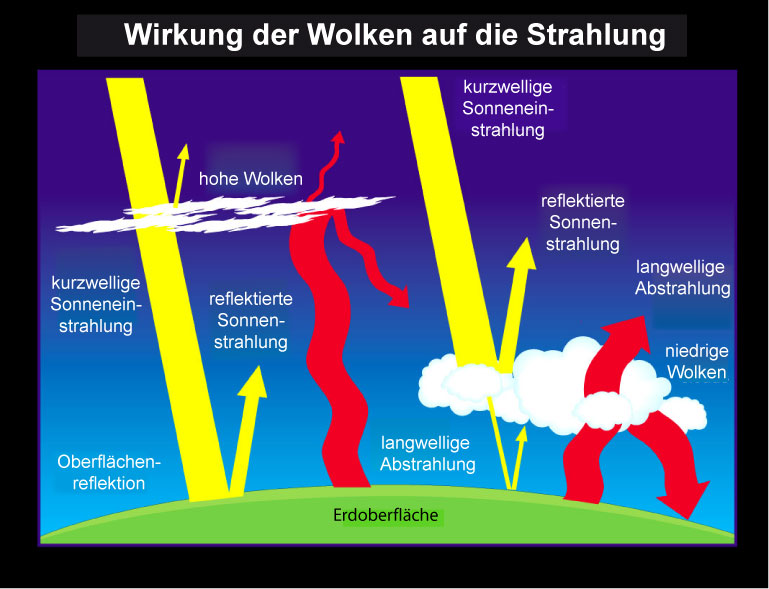
| 20:01, 25. Mai 2025 | Wolken Albedo Strahlung.jpg (Datei) |  |
88 KB | Wirkung von Wolken auf den Strahlungshaushalt ==Lizenzhinweis== {| style="border:1px solid #8888aa; background-color:#f7f8ff;padding:5px;font-size:95%;" | Quelle: NASA visible earth (2000): Cloud Effects on Earth’s Radiation, https://visibleearth.nasa.gov/images/54219/cloud-effects-on-earths-radiation<br> Lizenz: public domain |} | 1 |
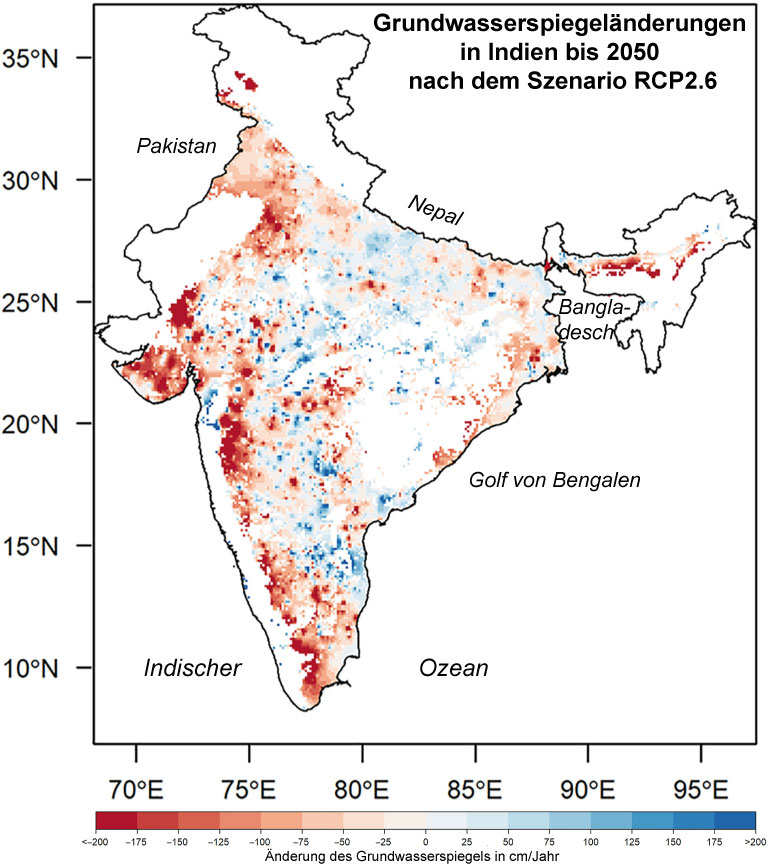
| 13:44, 24. Mai 2025 | Indien-Grundwasseränderung.jpg (Datei) |  |
120 KB | == Beschreibung == Änderung des Grundwasserspiegels in Indien bis 2050 nach dem Szenario RCP2.6 ==Lizenzhinweis== {| style="border:1px solid #8888aa; background-color:#f7f8ff;padding:5px;font-size:95%;" | Quelle: Bhattarai, N., D.B. Lobell, Balwinder-Singh et al. (2023): Warming temperatures exacerbate groundwater depletion rates in India.Sci.Advances 9, https://www.science.org/doi/10.1126/sciadv.adi1401 - übersetzt<br> Lizenz: CC BY-NC https://creativecommons.org/licenses/by-nc/4.0/ |} | 1 |
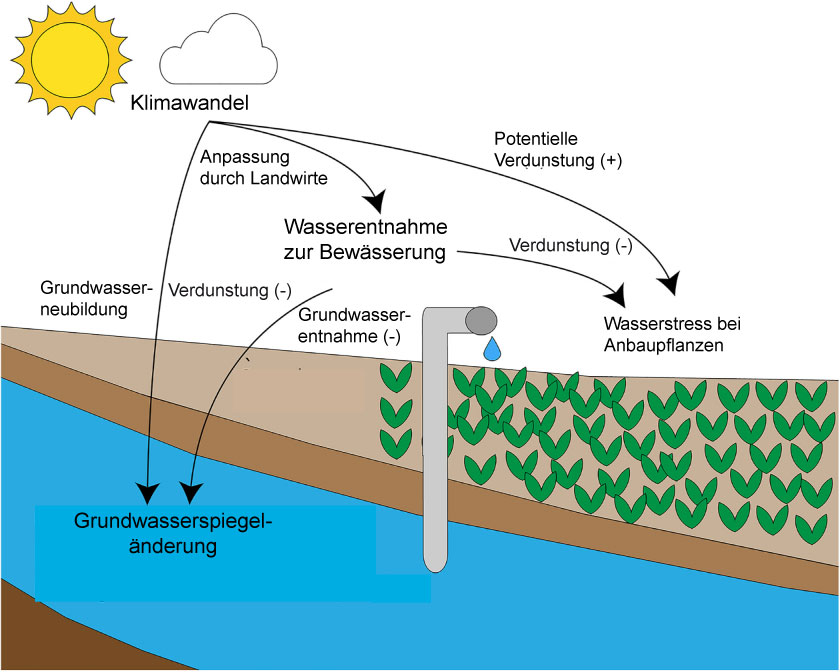
| 13:39, 24. Mai 2025 | Indien Grundwasserstress.jpg (Datei) |  |
93 KB | == Beschreibung == Klimawandel und Grundwasserstress in der indischen Landwirtschaft ==Lizenzhinweis== {| style="border:1px solid #8888aa; background-color:#f7f8ff;padding:5px;font-size:95%;" | Quelle: Bhattarai, N., D.B. Lobell, Balwinder-Singh et al. (2023): Warming temperatures exacerbate groundwater depletion rates in India.Sci.Advances 9, https://www.science.org/doi/10.1126/sciadv.adi1401 - übersetzt<br> Lizenz: CC BY-NC https://creativecommons.org/licenses/by-nc/4.0/ |} | 1 |
| 19:35, 22. Mai 2025 | Drought-S-Asia.jpg (Datei) |  |
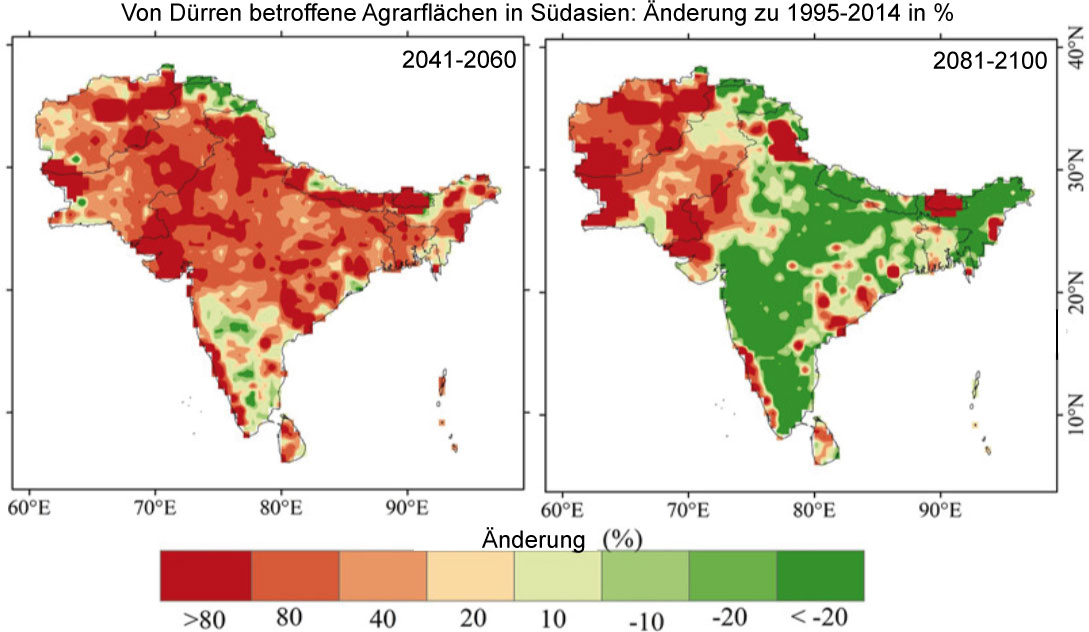
96 KB | Von Dürren betroffene Agrarflächen in Südasien als Änderung zu 1995-2014 in % nach dem Szenario SSP5-8.5 ==Lizenzhinweis== {| style="border:1px solid #8888aa; background-color:#f7f8ff;padding:5px;font-size:95%;" | Quelle: Mondal, S. K., B. Su, J. Huang et al. (2024): Climate change will aggravate South Asian cropland exposure to drought by the middle of 21st century. Earth's Future, 12, e2023EF003872. https://doi.org/10.1029/2023EF003872<br> Lizenz: CC BY http://creativecommons.org/licenses/by… | 1 |
| 18:16, 4. Mai 2025 | Lachgas als GHG2.jpg (Datei) |  |
57 KB | == Beschreibung == Entstehung und Wirkung von Lachgas (N2O) ==Lizenzhinweis== {| style="border:1px solid #8888aa; background-color:#f7f8ff;padding:5px;font-size:95%;" | Quelle: Office for Climate Education, OCE (2022): [https://www.oce.global/en Das Klima in unseren Händen – Klimawandel und Landsysteme], Lehrerhandbuch für die Klassenstufen 5 bis 10, Paris, 2022; ursprgl. NASA, übersetzt <br> Lizenz: CC BY-NC-SA |} | 1 |