Von Dieter Kasang hochgeladene Dateien
Aus Klimawandel
Diese Spezialseite listet alle hochgeladenen Dateien auf.
| Datum | Name | Vorschaubild | Größe | Beschreibung | Versionen |
|---|---|---|---|---|---|
| 19:40, 7. Mär. 2025 | Natürlicher Treibhauseffekt.png (Datei) |  |
184 KB | == Beschreibung == Der natürliche Treibhauseffekt bewirkt eine Erwärmung der Erdatmosphäre um 32 °C. == Lizenzhinweis == {| style="border:1px solid #8888aa; background-color:#f7f8ff;padding:5px;font-size:95%;" |Quelle: Schrader, C., bpb (2023): Klimawandel – die gestörte Balance, https://www.bpb.de/themen/klimawandel/dossier-klimawandel/517115/klimawandel-die-gestoerte-balance/ <br> Lizenz: CC BY-NC-ND https://creativecommons.org/licenses/by-nc-nd/4.0/deed.de |} | 1 |
| 14:48, 7. Mär. 2025 | Globale Zirkulation.png (Datei) |  |
373 KB | Globale Zirkulation der Erdatmosphäre mit Hadley-Zelle, Ferrell-Zelle und Polarzelle ==Lizenzhinweis== {| style="border:1px solid #8888aa; background-color:#f7f8ff;padding:5px;font-size:95%;" | Quelle: Wikimedia Commons (2013): Globale Zirkulation der Erdatmosphäre mit Hadley-Zelle, Ferrell-Zelle und Polarzelle, https://commons.wikimedia.org/wiki/File:Earth_Global_Circulation_-_de.svg<br> Lizenz: CC BY-SA https://creativecommons.org/licenses/by-sa/3.0/deed.en |} | 1 |
| 16:13, 5. Mär. 2025 | Amazon tipping potential.jpg (Datei) |  |
101 KB | == Beschreibung == Kipppunkte-Potential im Amazonasgebiet im Jahr 2050: -1 (blau) = gering, 2-4 (orange bis rot) = hoch bis sehr hoch. ==Lizenzhinweis== {| style="border:1px solid #8888aa; background-color:#f7f8ff;padding:5px;font-size:95%;" | Quelle: Flores, B.M., E. Montoya, B. Sakschewskiet al. (2024): Critical transitions in the Amazon forest system. Nature 626, 555–564, https://doi.org/10.1038/s41586-023-06970-0 <br> Lizenz: CC BY http://creativecommons.org/licenses/by/4.0/ |} | 1 |
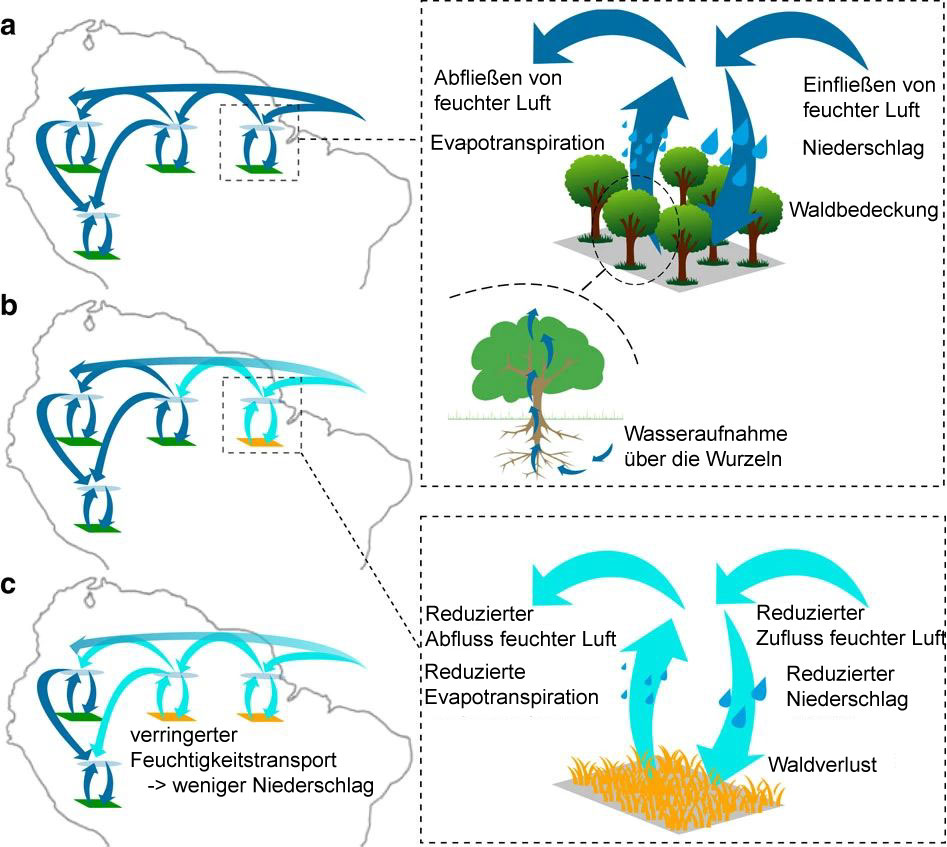
| 16:06, 5. Mär. 2025 | Amazon-Wald–Vegetation.jpg (Datei) |  |
145 KB | == Beschreibung == Änderung der Wechselwirkungen von Vegetation und Atmosphäre durch Abholzung und die Folgen für den Niederschlag. ==Lizenzhinweis== {| style="border:1px solid #8888aa; background-color:#f7f8ff;padding:5px;font-size:95%;" | Quelle: Zemp, D.C., C.-F. Schleussner, H.M.J. Barbosa et al. (2017): Self-amplified Amazon forest loss due to vegetation–atmosphere feedbacks. Nat. Commun. 8, https://www.nature.com/articles/ncomms14681<br> Lizenz: [http://creativecommons.org/licenses/by/4.… | 1 |
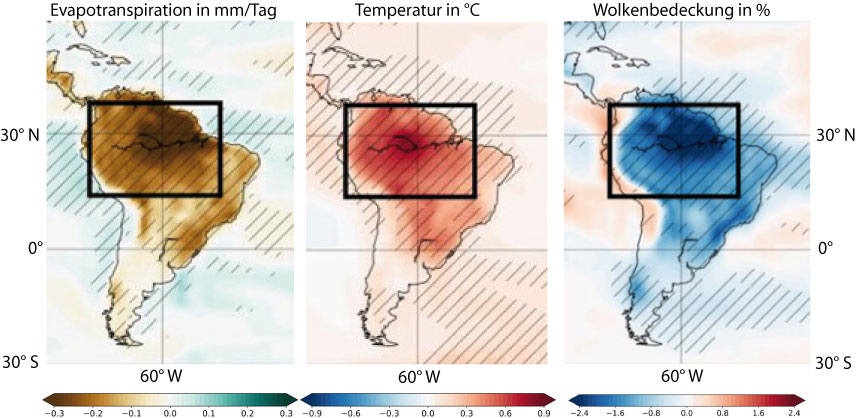
| 16:00, 5. Mär. 2025 | Amazon-Verdunstung-Temp-Wolk.jpg (Datei) |  |
79 KB | == Beschreibung == Abnehmende Verdunstung erhöht die Temperatur, wodurch die Wolkenbedeckung abnimmt )Modellsimulation über ca. 100 Jahre). ==Lizenzhinweis== {| style="border:1px solid #8888aa; background-color:#f7f8ff;padding:5px;font-size:95%;" | Quelle: Kimm, H., S.-W. Park, S.-Y. Jun & J.-S. Kug (2024): How does plant CO2 physiological forcing amplify Amazon warming in CMIP6 Earth system models? Earth's Future, 12, e2023EF004223. Lizenz: CC BY http://creativecommons.org/licenses/by/4.0/… | 1 |
| 15:54, 5. Mär. 2025 | Temp-E-Amazon-1900-2100.jpg (Datei) | 66 KB | == Beschreibung == Wasserkreislauf im Amazonas-Regenwald ==Lizenzhinweis== {| style="border:1px solid #8888aa; background-color:#f7f8ff;padding:5px;font-size:95%;" | Quelle: Parsons, L. A. (2020). Implications of CMIP6 projected drying trends for 21st century Amazonian drought risk. Earth's Future, 8, e2020EF001608. https://doi.org/10.1029/2020EF001608<br> Lizenz: CC BY-NC-ND http://creativecommons.org/licenses/by-nc-nd/4.0/ |} | 1 | |
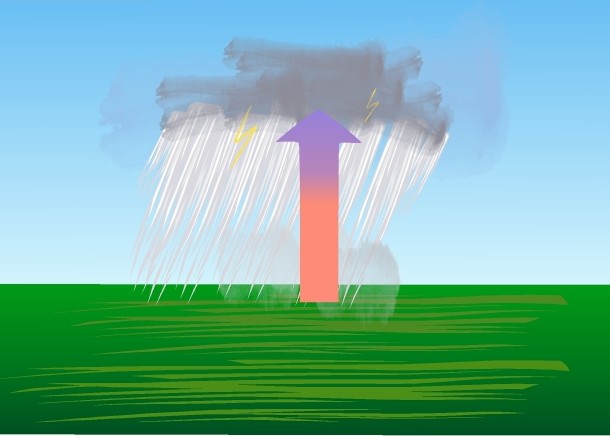
| 20:03, 4. Mär. 2025 | Konvektionsregen.jpg (Datei) |  |
40 KB | == Beschreibung == Konvektionsregen ==Lizenzhinweis== {| style="border:1px solid #8888aa; background-color:#f7f8ff;padding:5px;font-size:95%;" | Quelle: Wikipedia (2004): Konvektionsregen, https://commons.wikimedia.org/wiki/File:Konvektionsregen.jpg <br> Lizenz: [https://creativecommons.org/licenses/by-sa/3.0/deed.en CC BY-SA] |} | 1 |
| 19:58, 4. Mär. 2025 | Steigungsregen.jpg (Datei) |  |
26 KB | Steigungsregen ==Lizenzhinweis== {| style="border:1px solid #8888aa; background-color:#f7f8ff;padding:5px;font-size:95%;" | Quelle: Wikipedia (2005): Steigungsregen, https://commons.wikimedia.org/wiki/File:Steigungsregen.jpg<br> Lizenz: CC Y-SA https://creativecommons.org/licenses/by-sa/3.0/deed.en |} | 1 |
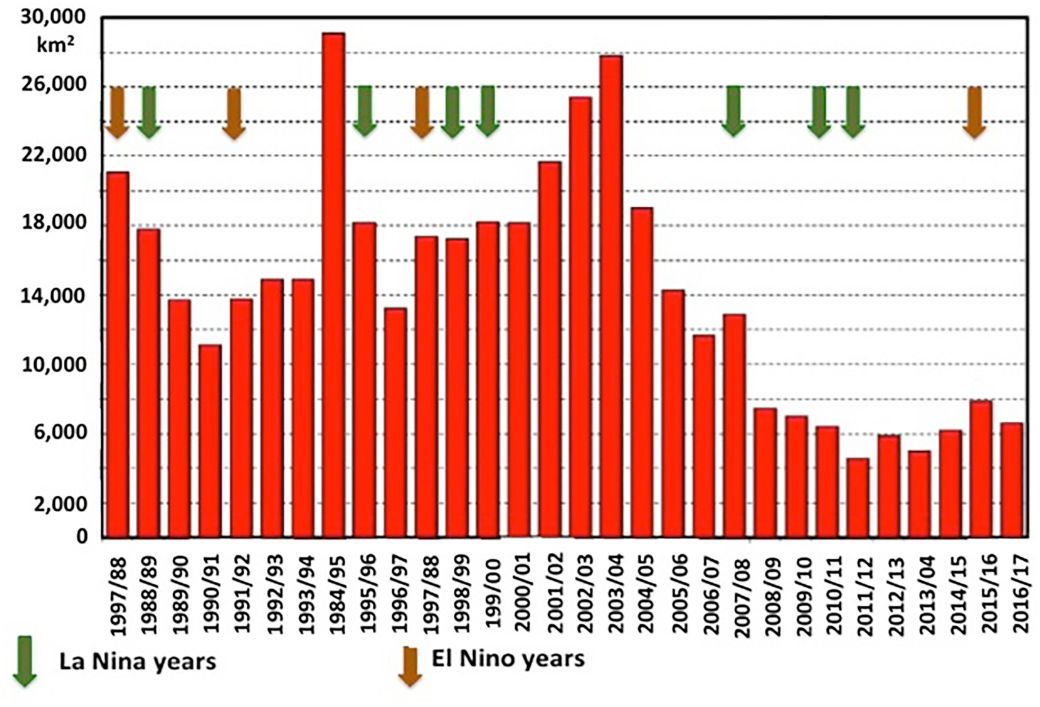
| 16:48, 22. Feb. 2025 | Amazonia deforestation1988-2017.jpg (Datei) |  |
112 KB | == Beschreibung == Entwaldungsrate im brasilianischen Amazonas 1988-2017 ==Lizenzhinweis== {| style="border:1px solid #8888aa; background-color:#f7f8ff;padding:5px;font-size:95%;" | Quelle: Larrea, C., Murais, T. Azevedo et al. (2021): Globalization, Extractivism and Social Exclusion: Threats and Opportunities to Amazon Governance in Brazil In: Nobre, C., A. Encalada, E. Anderson et al. (Ed.). Amazon Assessment Report 2021 II, Chapter 17<br> Lizenz: Lizenz: CC BY-NC-SA 4.0 |} | 1 |
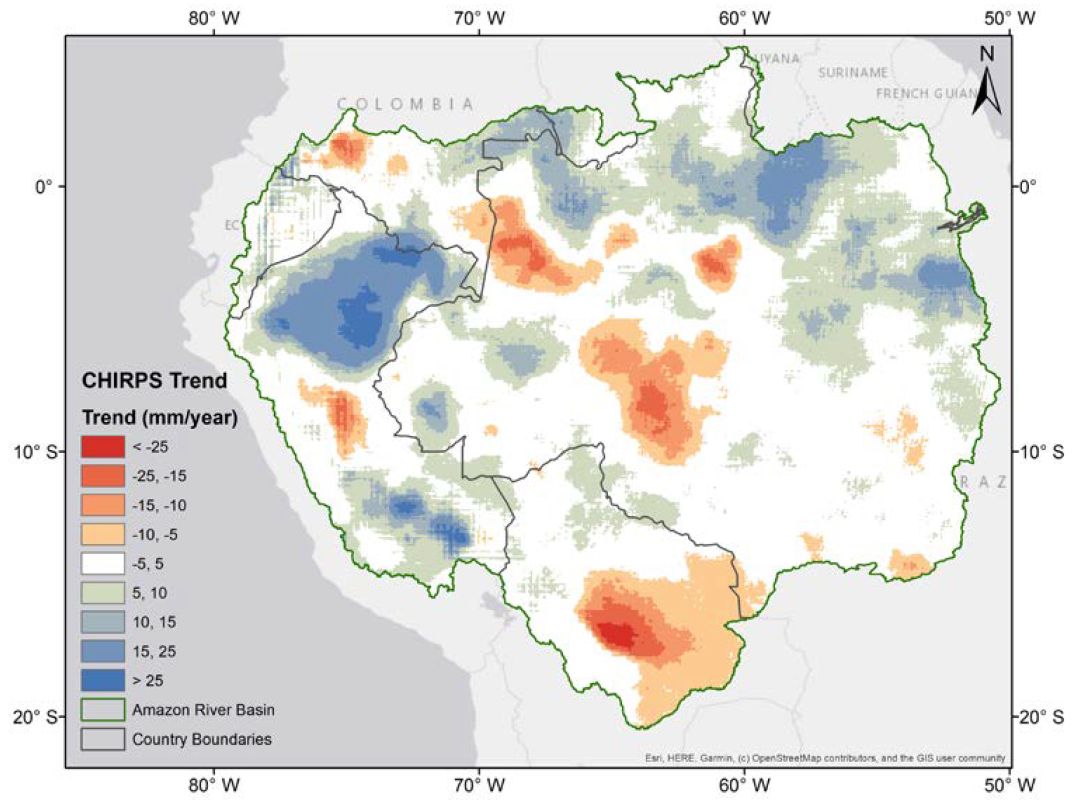
| 11:42, 19. Feb. 2025 | Amazon prec trend 1981-2017.jpg (Datei) |  |
101 KB | == Beschreibung == Regionale Niederschlagstrends im Amazonasgebiet 1981-2017 in mm/Jahr ==Lizenzhinweis== {| style="border:1px solid #8888aa; background-color:#f7f8ff;padding:5px;font-size:95%;" | Quelle: Paca, V.H. da Motta, G.E. Espinoza-Dávalos et al. (2020): Variability of Trends in Precipitation across the Amazon River Basin Determined from the CHIRPS Precipitation Product and from Station Records, Water 12, no. 5: 1244. https://doi.org/10.3390/w12051244 <br> Lizenz: [https://creativecomm… | 1 |
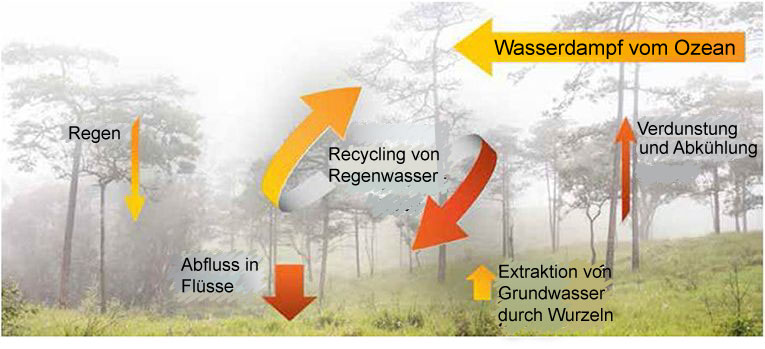
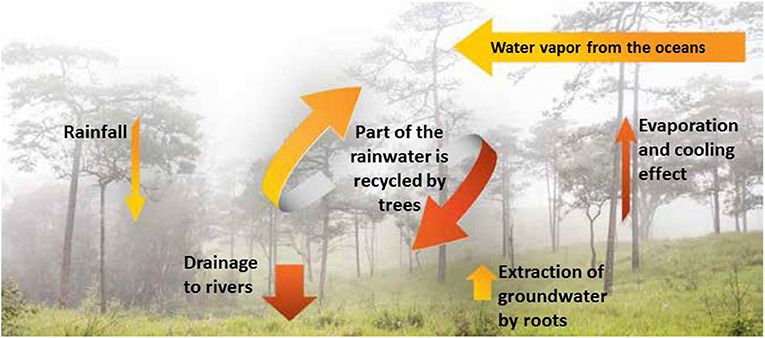
| 20:39, 17. Feb. 2025 | Amazonas-Wasserkreislauf.jpg (Datei) |  |
59 KB | == Beschreibung == Wasserkreislauf im Amazonas-Regenwald ==Lizenzhinweis== {| style="border:1px solid #8888aa; background-color:#f7f8ff;padding:5px;font-size:95%;" | Quelle: Marengo, J.A. (2020): Drought, Floods, Climate Change, and Forest Loss in the Amazon Region: A Present and Future Danger? Front. Young Minds. 8:147. doi: 10.3389/frym.2019.00147; <br> Lizenz: Lizenz: [https://creativecommons.org/licenses/by/4.0/ CC BY] |} | 1 |
| 16:48, 17. Feb. 2025 | Amazon hydrologische Prozesse.jpg (Datei) |  |
83 KB | Hydrologische Prozesse im Amazonasgebiet ==Lizenzhinweis== {| style="border:1px solid #8888aa; background-color:#f7f8ff;padding:5px;font-size:95%;" | Quelle: Costa, M.H., L.S. Borma, J.C. Espinoza et al. (2021): The Physical hydroclimate system of the Amazon In: Nobre, C., A. Encalada, E. Anderson et al. (Ed.). Amazon Assessment Report 2021, Part 1, Chapter 5, https://www.theamazonwewant.org/spa_publication/amazon-assessment-report-2021/ <br /> Lizenz: Lizenz: CC-BY-NC-SA |} | 1 |
| 16:38, 17. Feb. 2025 | Amazon rain Pacific Atlantic.jpg (Datei) |  |
118 KB | == Beschreibung == Die Haupteinflussfaktoren auf die Amazonasniederschläge: ENSO, Meeresoberflächentemperaturen (SST) im tropischen Nordatlantik und die ITCZ-Position. ==Lizenzhinweis== {| style="border:1px solid #8888aa; background-color:#f7f8ff;padding:5px;font-size:95%;" | Quelle: Ciemer, C., L. Rehm, J. Kurths et al. (2020): An early-warning indicator for Amazon droughts exclusively based on tropical Atlantic sea surface temperatures, Environmental Research Letters 15, 9, https://dx.doi.or… | 1 |
| 16:30, 17. Feb. 2025 | Amazonas Wasserkreislauf.jpg (Datei) |  |
49 KB | == Beschreibung == Wasserkreislauf im Amazonas-Regenwald ==Lizenzhinweis== {| style="border:1px solid #8888aa; background-color:#f7f8ff;padding:5px;font-size:95%;" | Quelle: Marengo, J.A. (2020): Drought, Floods, Climate Change, and Forest Loss in the Amazon Region: A Present and Future Danger? Front. Young Minds. 8:147. doi: 10.3389/frym.2019.00147; <br> Lizenz: Lizenz: CC BY https://creativecommons.org/licenses/by/4.0/ |} | 1 |
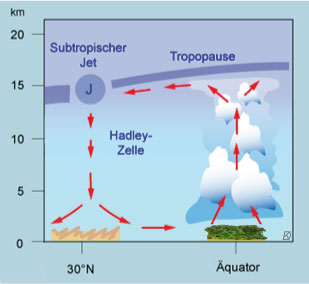
| 16:26, 17. Feb. 2025 | Tropische-zirkulation.jpg (Datei) |  |
15 KB | == Beschreibung == Tropische Zirkulation ==Lizenzhinweis== {| style="border:1px solid #8888aa; background-color:#f7f8ff;padding:5px;font-size:95%;" | Quelle: Eigene Darstellung (Dieter Kasang)<br> Lizenz: CC-BY-NC-SA |} | 1 |
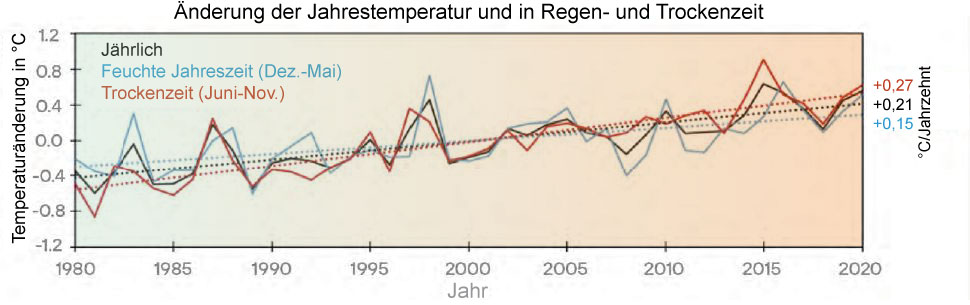
| 15:39, 17. Feb. 2025 | Amazon-temp-1980-2020.jpg (Datei) |  |
53 KB | == Beschreibung == Änderung der Jahresmittel- und der Temperatur der Regen- und Trockenzeit im Amazonasgebiet 1980-2020 ==Lizenzhinweis== {| style="border:1px solid #8888aa; background-color:#f7f8ff;padding:5px;font-size:95%;" | Quelle: Marengo, J.A., J.C. Espinoza, R. Fu et al. (2021): [https://www.theamazonwewant.org/wp-content/uploads/2022/05/Chapter-22-Bound-May-11.pdf Long-term variability, extremes and changes in temperature and hydrometeorology in the Amazon region]. In: Nobre, C., A. En… | 1 |
| 15:14, 17. Feb. 2025 | Amazonas-Erwärmungsraten.jpg (Datei) |  |
45 KB | == Beschreibung == Regionale Unterschiede in der Erwärmungsrate im Amazonasgebiet in °C/Jahrzehnt. ==Lizenzhinweis== {| style="border:1px solid #8888aa; background-color:#f7f8ff;padding:5px;font-size:95%;" | Quelle: Marengo, J.A., J.C. Espinoza, R. Fu et al. (2021): Long-term variability, extremes and changes in temperature and hydrometeorology in the Amazon region. In: Nobre, C., A. Encalada, E. Anderson et al. (Ed.). Amazon Assessment Report 2021, Chapter 22, https://www.theamazonwewant.org/w… | 1 |
| 11:26, 11. Feb. 2025 | Treibhauseffekt---Strahlung.jpg (Datei) |  |
58 KB | == Beschreibung == Treibhauseffekt, Strahlung und Treibhausgase == Lizenzhinweis == {| style="border:1px solid #8888aa; background-color:#f7f8ff;padding:5px;font-size:95%;" |Quelle: Klimafakten.de (2020): Fakten rund ums Klima, https://www.klimafakten.de/kommunikation/fakten-rund-ums-klima-emissionen<br> Lizenz: CC BY 4.0 https://creativecommons.org/licenses/by/4.0/legalcode.de%20%20 |} | 1 |
| 11:19, 11. Feb. 2025 | Atmosphäre - Aufbau.jpg (Datei) |  |
47 KB | Aufbau der Atmosphäre ==Lizenzhinweis== {| style="border:1px solid #8888aa; background-color:#f7f8ff;padding:5px;font-size:95%;" | Quelle: Klimafakten.de (2020): Fakten rund ums Klima, https://www.klimafakten.de/kommunikation/fakten-rund-ums-klima-emissionen Lizenz: CC BY 4.0 https://creativecommons.org/licenses/by/4.0/legalcode.de%20%20 |} | 1 |
| 10:38, 11. Feb. 2025 | Der Treibhauseffekt.jpg (Datei) |  |
147 KB | Der Treibhauseffekt, vereinfachte Darstellung == Lizenzhinweis == {| style="border:1px solid #8888aa; background-color:#f7f8ff;padding:5px;font-size:95%;" |Quelle: Office for Climate Education (2020): IPCC-Sonderbericht „Ozean und Kryosphäre in einem sich wandelnden Klima” – Zusammenfassung für Lehrerinnen und Lehrer, https://www.sonnentaler.net/dokumentation/ipcc-berichte/sr-ozean-kryosphaere/ <br> Lizenz: CC BY-NC-SA |} | 1 |
| 20:45, 10. Feb. 2025 | Amazon deforestation cc.jpg (Datei) |  |
110 KB | == Beschreibung == Abholzung des Amazonas-Regenwalds und die Warnung vor dem Klimawandel == Lizenzhinweis == {| style="border:1px solid #8888aa; background-color:#f7f8ff;padding:5px;font-size:95%;" |Quelle: Marengo, J.A. (2020): Drought, Floods, Climate Change, and Forest Loss in the Amazon Region: A Present and Future Danger? Front. Young Minds. 8:147. doi: 10.3389/frym.2019.00147)<br> Lizenz: CC BY 4.0 https://creativecommons.org/licenses/by/4.0/ | 1 |
| 17:32, 10. Feb. 2025 | Eisschild Komponenten.jpg (Datei) |  |
42 KB | == Beschreibung == Prozesse und Teile eines Eisschilds, übersetzt ==Lizenzhinweis== {| style="border:1px solid #8888aa; background-color:#f7f8ff;padding:5px;font-size:95%;" | Quelle: Winkelmann, R., L. Nicola and D. Notz (2022): The Antarctic Ice Sheet–A Sleeping Giant? Front. Young Minds. 10:702643. https://kids.frontiersin.org/articles/10.3389/frym.2022.702643 Lizenz: CC BY https://creativecommons.org/licenses/by/4.0/ <br> Lizenz: [https://creativecommons.org/licenses/by/4.0/ CC BY] |} | 1 |
| 11:03, 10. Feb. 2025 | CO2-Emissionen Speicher.jpg (Datei) |  |
47 KB | == Beschreibung == Emissionen von Kohlendioxid (CO2) und CO2-Speicher ==Lizenzhinweis== {| style="border:1px solid #8888aa; background-color:#f7f8ff;padding:5px;font-size:95%;" | Quelle: Heinrich Böll Stiftung (2017):Weltklima: Der Ozean bremst den Klimawandel, Abb.: petraboeckmann.de, https://www.boell.de/de/2017/05/10/weltklima-der-ozean-bremst-den-klimawandel <br> Lizenz: CC BY http://creativecommons.org/licenses/by/4.0/deed.de |} | 1 |
| 17:05, 8. Feb. 2025 | Klimasystem und Subsysteme.jpg (Datei) |  |
79 KB | Ins Meer mündender Eisschild mit Schelfeis. Aufsetzlinie und Felsuntergrund unter dem Meeresspiegel. ==Lizenzhinweis== {| style="border:1px solid #8888aa; background-color:#f7f8ff;padding:5px;font-size:95%;" | Quelle: Bamber, J.L., R.M. Westaway, B. Marzeion, and B. Wouters (2018): The land ice contribution to sea level during the satellite era, Environ. Res. Lett. 13 063008<br> Lizenz: [https://creativecommons.org/licenses/by/3.0/ CC BY] |} | 1 |
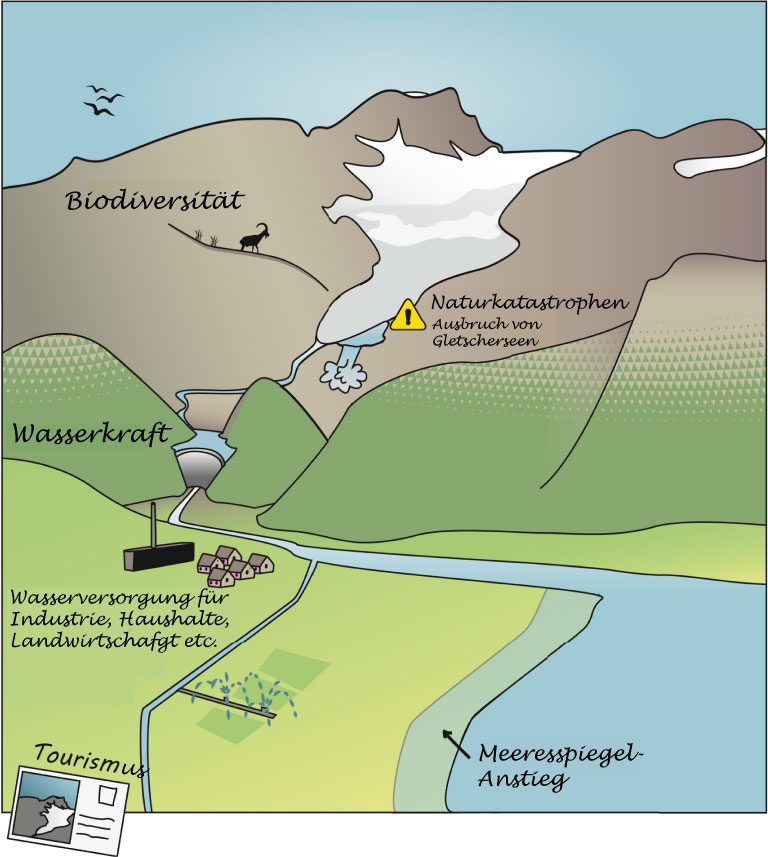
| 12:24, 6. Feb. 2025 | Glaciers-landscape dt.jpg (Datei) |  |
99 KB | == Beschreibung == Einfluss eines Gletschers auf seine Umgebung. Übersetzt. ==Lizenzhinweis== {| style="border:1px solid #8888aa; background-color:#f7f8ff;padding:5px;font-size:95%;" | Quelle: Zekollari, H., Huss, M., Farinotti, D., & Lhermitte, S. (2022): Ice-dynamical glacier evolution modeling—A review. Reviews of Geophysics, 60, e2021RG000754. https://doi.org/10.1029/2021RG000754 <br> Lizenz: CC BY http://creativecommons.org/licenses/by/4.0/ |} | 1 |
| 11:41, 6. Feb. 2025 | Gebirgs-Gletscher Massenbilanz.jpg (Datei) |  |
81 KB | Grundlegende Prozesse, die die Massenbilanz von Gletschern bestimmen. ==Lizenzhinweis== {| style="border:1px solid #8888aa; background-color:#f7f8ff;padding:5px;font-size:95%;" | Quelle: Flickr: How mountain glaciers gain and lose mass https://www.flickr.com/photos/gridarendal/32361978445/in/album-72157679157438546/ ursprgl. : GRID-Arendal http://www.grida.no/resources/6669 Lizenz: CC BY-NC-SA https://creativecommons.org/licenses/by-nc-sa/2.0/ <br> Lizenz: CC BY-NC-SA |} | 1 |
| 16:55, 5. Feb. 2025 | Arktis-Meereis-März-Sept.jpg (Datei) |  |
65 KB | Arktisches und Antarktisches Meereis in den Maximum- und Minimum-Monaten. Die blaue-weiße Farbabstufung zeigt die Meereis-Konzentration in % an. ==Lizenzhinweis== {| style="border:1px solid #8888aa; background-color:#f7f8ff;padding:5px;font-size:95%;" | Quelle: National Snow and Ice Data Center (2025): Sea Ice, https://nsidc.org/learn/parts-cryosphere/sea-ice <br> Lizenz: public domain |} | 1 |
| 14:49, 5. Feb. 2025 | Greenland ice cover.jpg (Datei) |  |
148 KB | Eisbedeckung auf Grönland ==Lizenzhinweis== {| style="border:1px solid #8888aa; background-color:#f7f8ff;padding:5px;font-size:95%;" |Quelle: Wikipedia (2005): Satellite photo highlighting the island of Greenland, as well as Iceland and the Canadian Arctic Archipelago, https://de.wikipedia.org/wiki/Datei:Greenland_42.74746W_71.57394N.jpg<br> Lizenz: public domain |} | 1 |
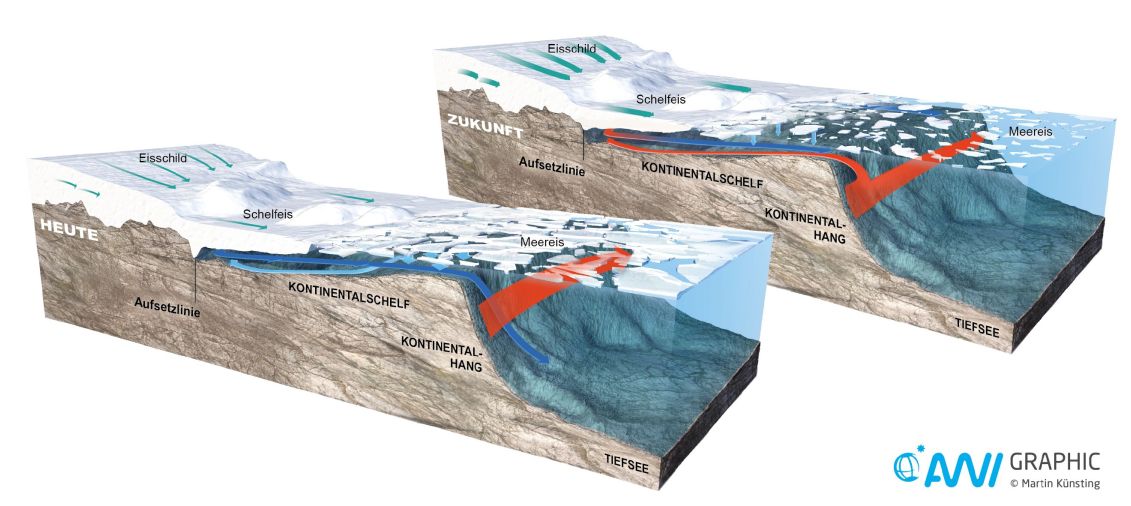
| 14:12, 5. Feb. 2025 | Filchner-Schelfeis Meeresströmungen.jpg (Datei) |  |
87 KB | == Beschreibung == Abschmelzen des Filchner-Eisschelfs durch Eindringen von warmem Wasser heute (oben) und in Zukunft (unten). ==Lizenzhinweis== {| style="border:1px solid #8888aa; background-color:#f7f8ff;padding:5px;font-size:95%;" | Quelle: Alfred-Wegener-Institut: Mediathek, Infographik, https://multimedia.awi.de/#1552335304661_6<br> Lizenz: CC BY 4.0 |} | 1 |
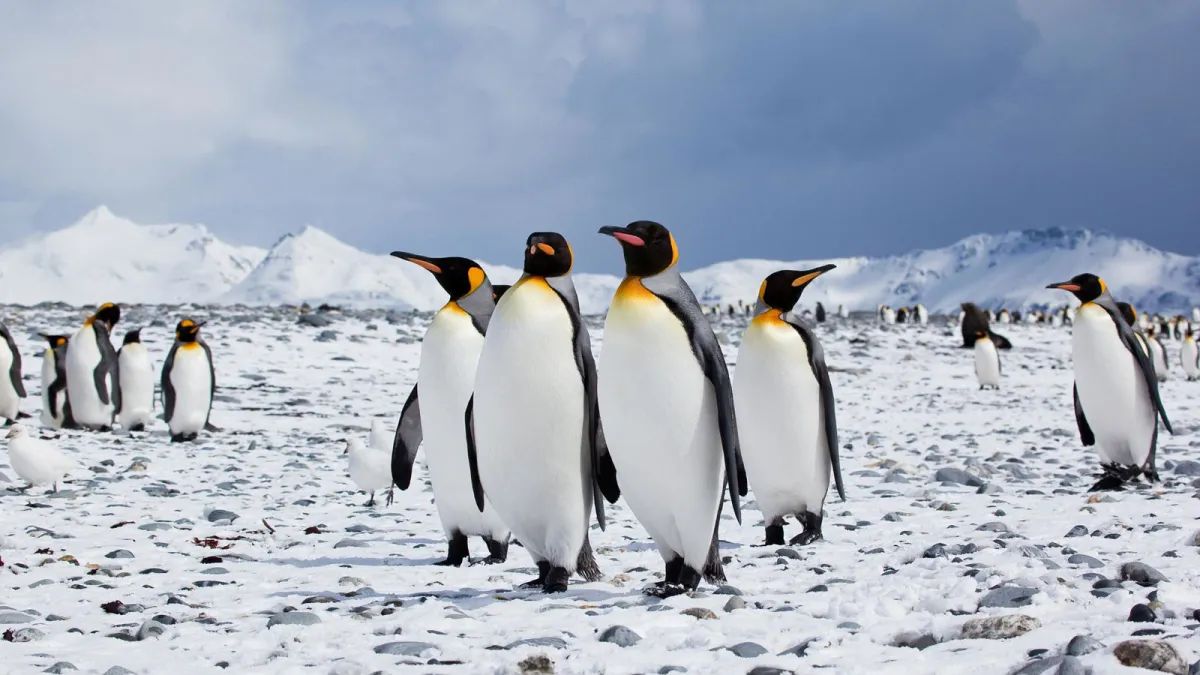
| 12:10, 5. Feb. 2025 | Pinguine Antarktis.jpg (Datei) |  |
109 KB | Pinguine in der Antarktis ==Lizenzhinweis== {| style="border:1px solid #8888aa; background-color:#f7f8ff;padding:5px;font-size:95%;" | Quelle: Pope, K. (2022): What the latest science says about Antarctica and sea-level rise, https://yaleclimateconnections.org/2022/02/what-the-latest-science-says-about-antarctica-and-sea-level-rise/, Foto: Antarctica Bound <br> Lizenz:CC BY-ND 2.0 https://creativecommons.org/licenses/by-nd/2.0/ |} | 1 |
| 12:00, 5. Feb. 2025 | Westantarktis vor 90 Mio Jahren.jpg (Datei) |  |
196 KB | Die Westantarktis vor 90 Mio. Jahren: Angenommener Regenwald aufgrund von Sedimentbohrkernen. ==Lizenzhinweis== {| style="border:1px solid #8888aa; background-color:#f7f8ff;padding:5px;font-size:95%;" | Quelle: Alfred-Wegener-Institut / James McKay, http://multimedia.awi.de/#1689274460961_21 <br> Lizenz: CC BY 4.0 |} | 1 |
| 11:12, 3. Feb. 2025 | Antarctic sea ice März.jpg (Datei) |  |
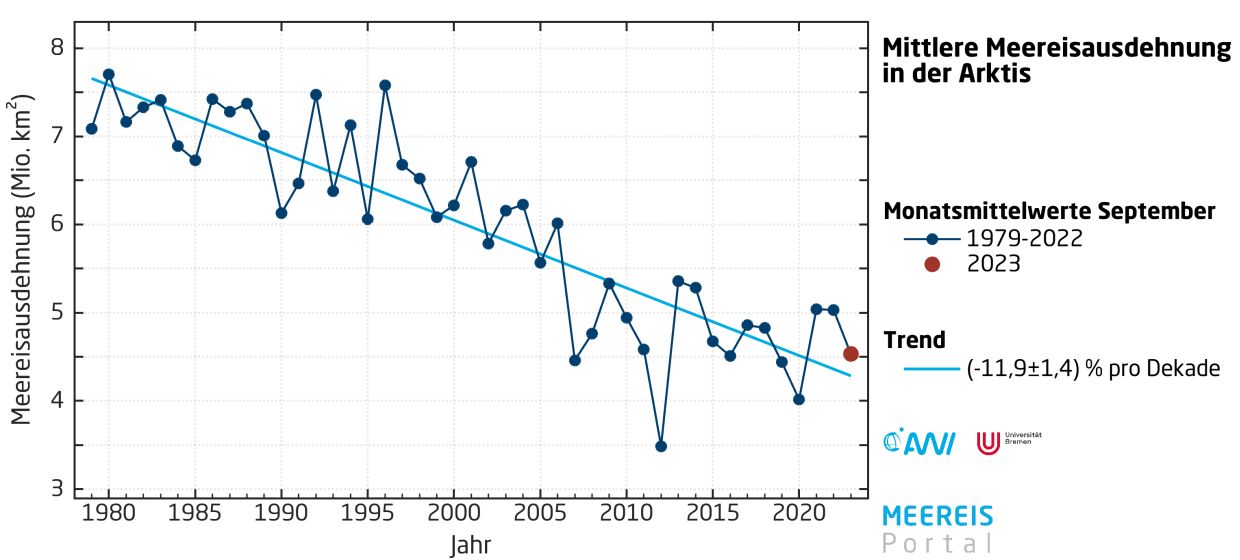
265 KB | Märzmittel der Meereisausdehnung in der Antarktis 1979-2024. Meereisausdehnung: Fläche mit über 15 % Meereisbedeckung. ==Lizenzhinweis== {| style="border:1px solid #8888aa; background-color:#f7f8ff;padding:5px;font-size:95%;" | Quelle: Meereisportal.de (2025): [https://www.meereisportal.de/karten-grafiken/trendkurven Monatsmittelwerte der Meereisausdehnung: Arktis] <br> Lizenz: "Aufbereitetes Kartenmaterial, Grafiken und Abbildungen dürfen nur unter Angabe der angegebenen Referenz oder mit Hin… | 1 |
| 10:54, 3. Feb. 2025 | Arktis Meereis Ausdehnung aktuell.jpg (Datei) |  |
276 KB | 4 | |
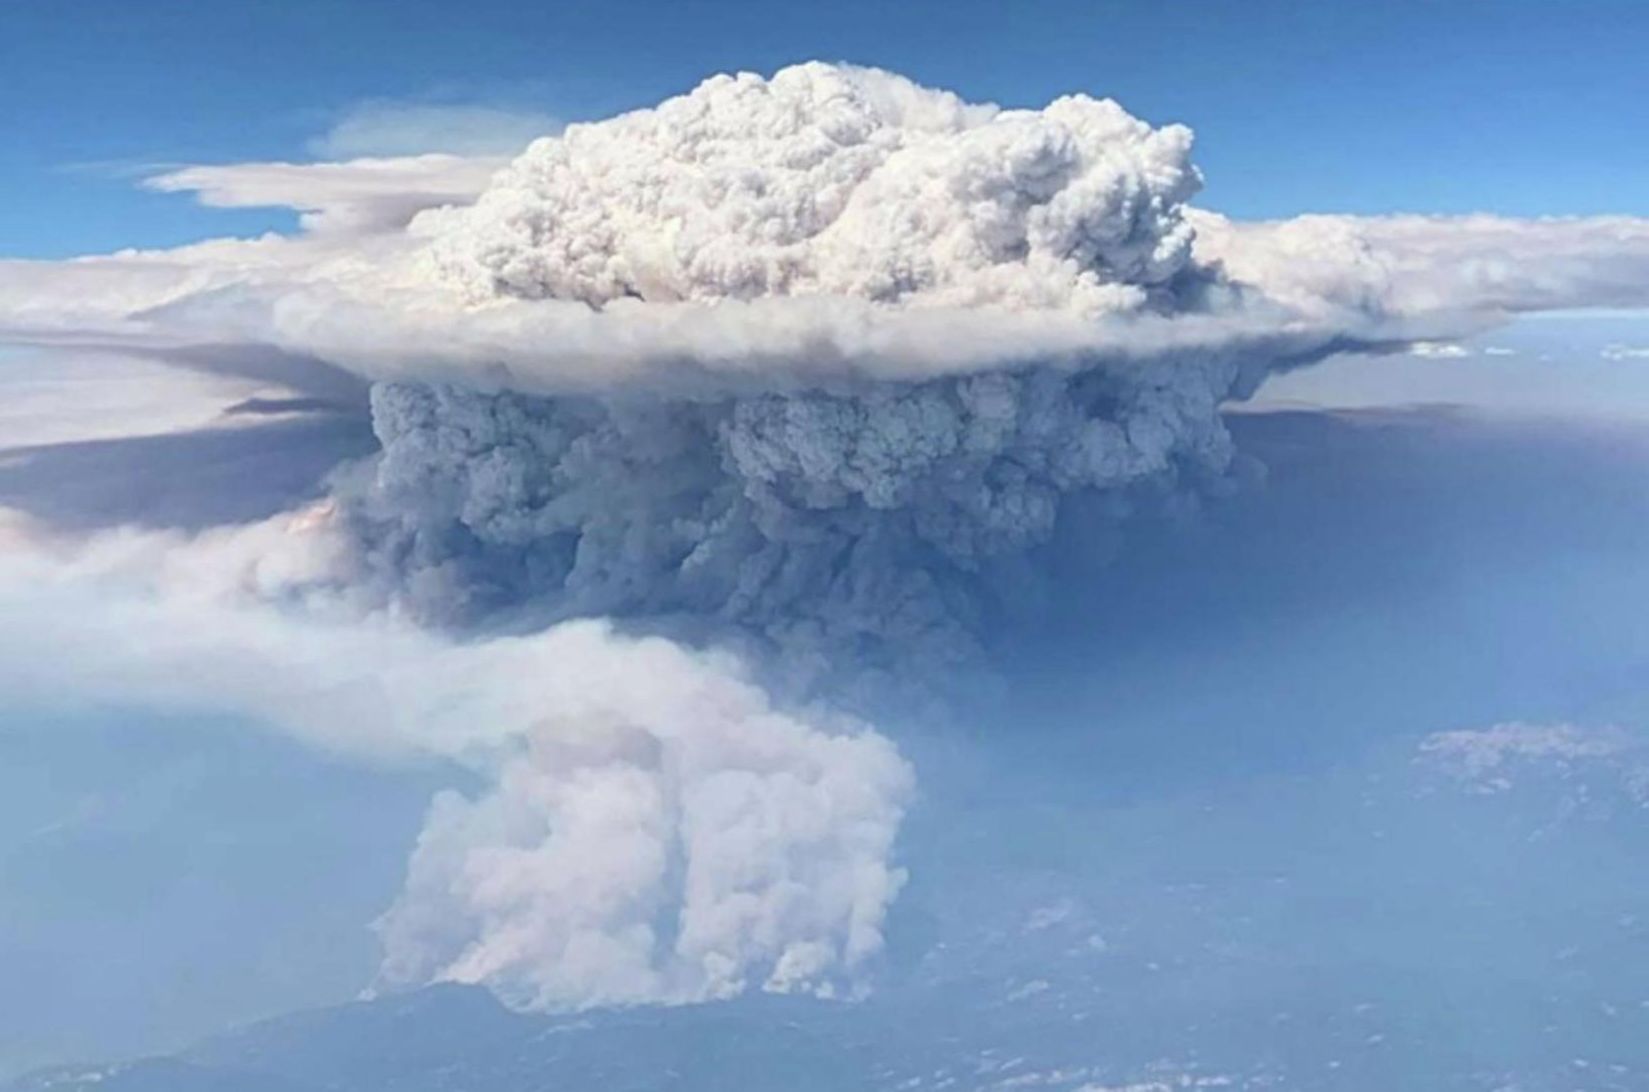
| 13:58, 1. Feb. 2025 | Creek Fire plume 2020.jpg (Datei) |  |
101 KB | == Beschreibung == Rauchentwicklung über dem Creek Fire 2020 ==Lizenzhinweis== {| style="border:1px solid #8888aa; background-color:#f7f8ff;padding:5px;font-size:95%;" | Quelle: Stephens, S.L., A.A. Bernal, B.M. Collins et al. (2022): Mass fire behavior created by extensive tree mortality and high tree density not predicted by operational fire behavior models in the southern Sierra Nevada, Forest Ecology and Management 518, https://doi.org/10.1016/j.foreco.2022.120258 Lizenz: CC BY http://creat… | 1 |
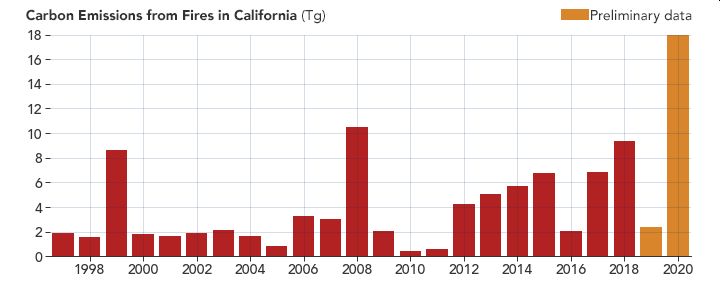
| 13:53, 1. Feb. 2025 | Cal fire2020 carbon emissions.jpg (Datei) |  |
25 KB | Kohlenstoffemissionen durch kalifornische Waldbrände 1997-2020 in Tg. 2020: vorläufige Daten (9.9.2020). ==Lizenzhinweis== {| style="border:1px solid #8888aa; background-color:#f7f8ff;padding:5px;font-size:95%;" | Quelle: NASA Earth Observatory (2020): Historic Fires Devastate the U.S. Pacific Coast, https://earthobservatory.nasa.gov/images/147277/historic-fires-devastate-the-us-pacific-coast Lizenz: public domain |} | 1 |
| 12:27, 1. Feb. 2025 | Homes destroyed Palisades fire.jpg (Datei) |  |
261 KB | == Beschreibung == Abgebrannte Wohngebäude in Los Angeles, Pacific Palisades, am 14. Januar 2025 ==Lizenzhinweis== {| style="border:1px solid #8888aa; background-color:#f7f8ff;padding:5px;font-size:95%;" | Quelle: Wikimedia Commons: Homes destroyed in the Palisades fire, https://commons.wikimedia.org/wiki/File:Homes_destroyed_in_the_Palisades_fire_(54272193113).jpg <br> Lizenz: [https://creativecommons.org/licenses/by/2.0/deed.en CC BY] |} | 1 |
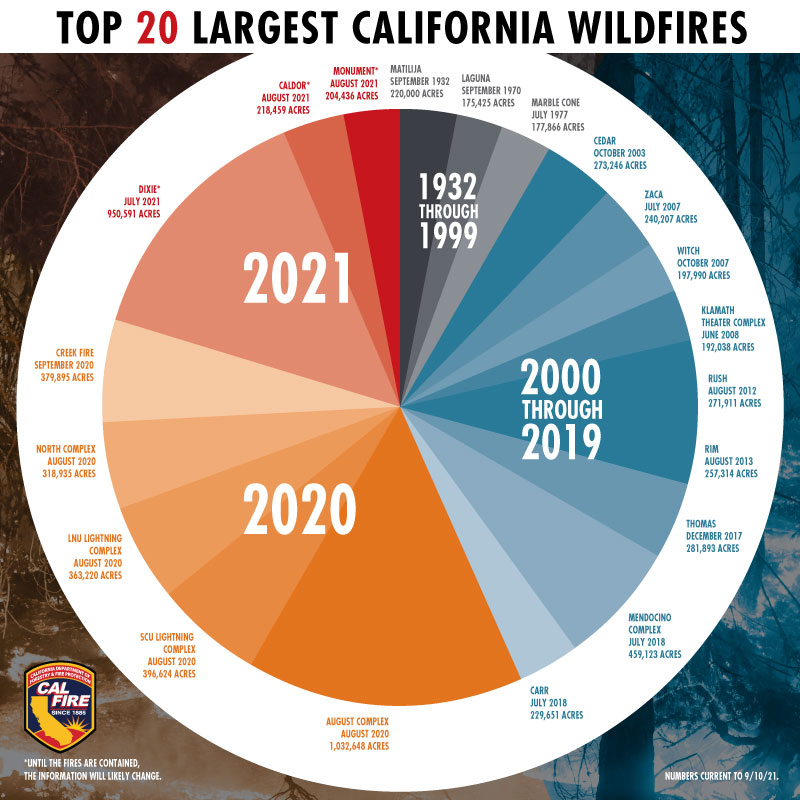
| 10:09, 1. Feb. 2025 | Top 20 Wildfires California 1932-2021.jpg (Datei) |  |
130 KB | == Beschreibung == Die 20 größten Waldbrände in Kalifornien 1932-2021 ==Lizenzhinweis== {| style="border:1px solid #8888aa; background-color:#f7f8ff;padding:5px;font-size:95%;" | Quelle: Wikimedia Commons (2021): Top 20 Wildfires in California, 1932 - Sept 10, 2021, https://commons.wikimedia.org/wiki/File:Top_20_Wildfires_in_California,_1932_-_Sept_10,_2021.jpg?uselang=de ; ursprgl.: CalFire, https://pbs.twimg.com/media/E-8nhb9VEAEp3z4?format=jpg&name=900x900 <br> Lizenz: public domain |} | 1 |
| 10:01, 1. Feb. 2025 | Wohnhaus 8.1.2025 sm.jpg (Datei) |  |
145 KB | == Beschreibung == Abgebranntes Wohnhaus in Los Angeles am 8. Januar 2025. ==Lizenzhinweis== {| style="border:1px solid #8888aa; background-color:#f7f8ff;padding:5px;font-size:95%;" | Quelle: Wikipedia (2025): Raleigh Tomlinson - parents home after the fire 1-8-2025, https://de.wikipedia.org/wiki/Datei:Parents_home_after_the_fire_1-8-2025_(54255210033).jpg <br> Lizenz: CC BY https://creativecommons.org/licenses/by/2.0/deed.de |} | 1 |
| 16:11, 24. Jan. 2025 | Fire-treatment-effects-W-US.jpg (Datei) |  |
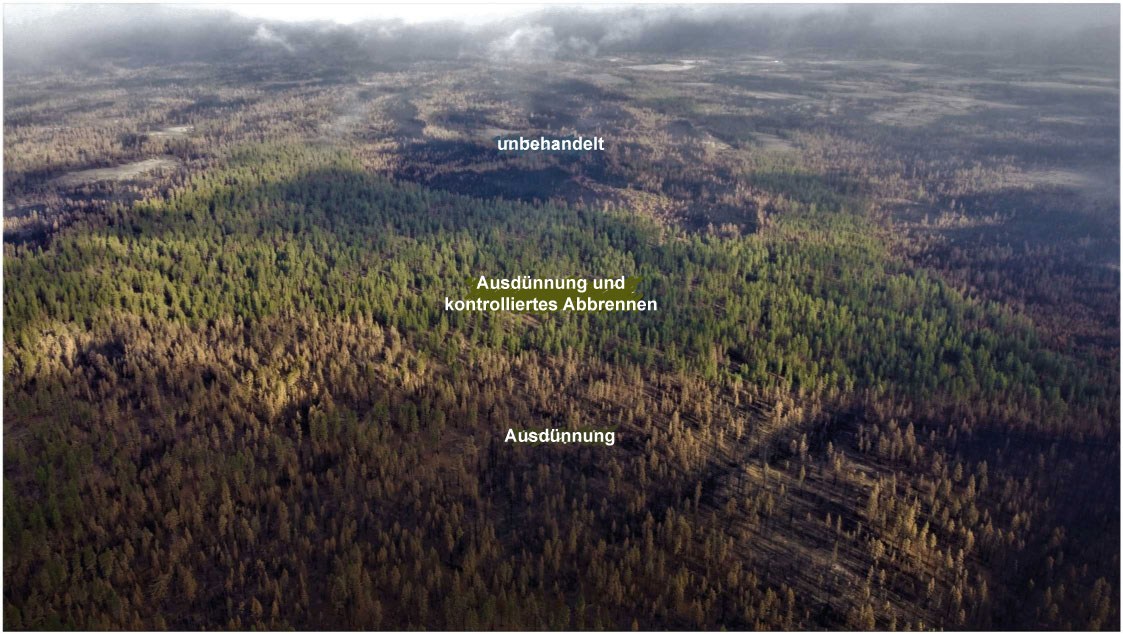
178 KB | == Beschreibung == Folgen der Waldbrandbekämpfung nach einem Feuer in Oregon 2021: Bei fehlender Behandlung des Waldbestandes ist der Wald stark geschädigt (hinten), bei Ausdünnung des Baumbestandes sind die Schäden deutlich geringer (vorne), bei Ausdünnung und kontrolliertem Abbrennen am geringsten (mittig). ==Lizenzhinweis== {| style="border:1px solid #8888aa; background-color:#f7f8ff;padding:5px;font-size:95%;" | Quelle: Davis, K.T., J. Peeler, J. Fargione et al. (2024): [https://doi.org/10… | 1 |
| 16:05, 24. Jan. 2025 | Fire-treatment-W-US.jpg (Datei) |  |
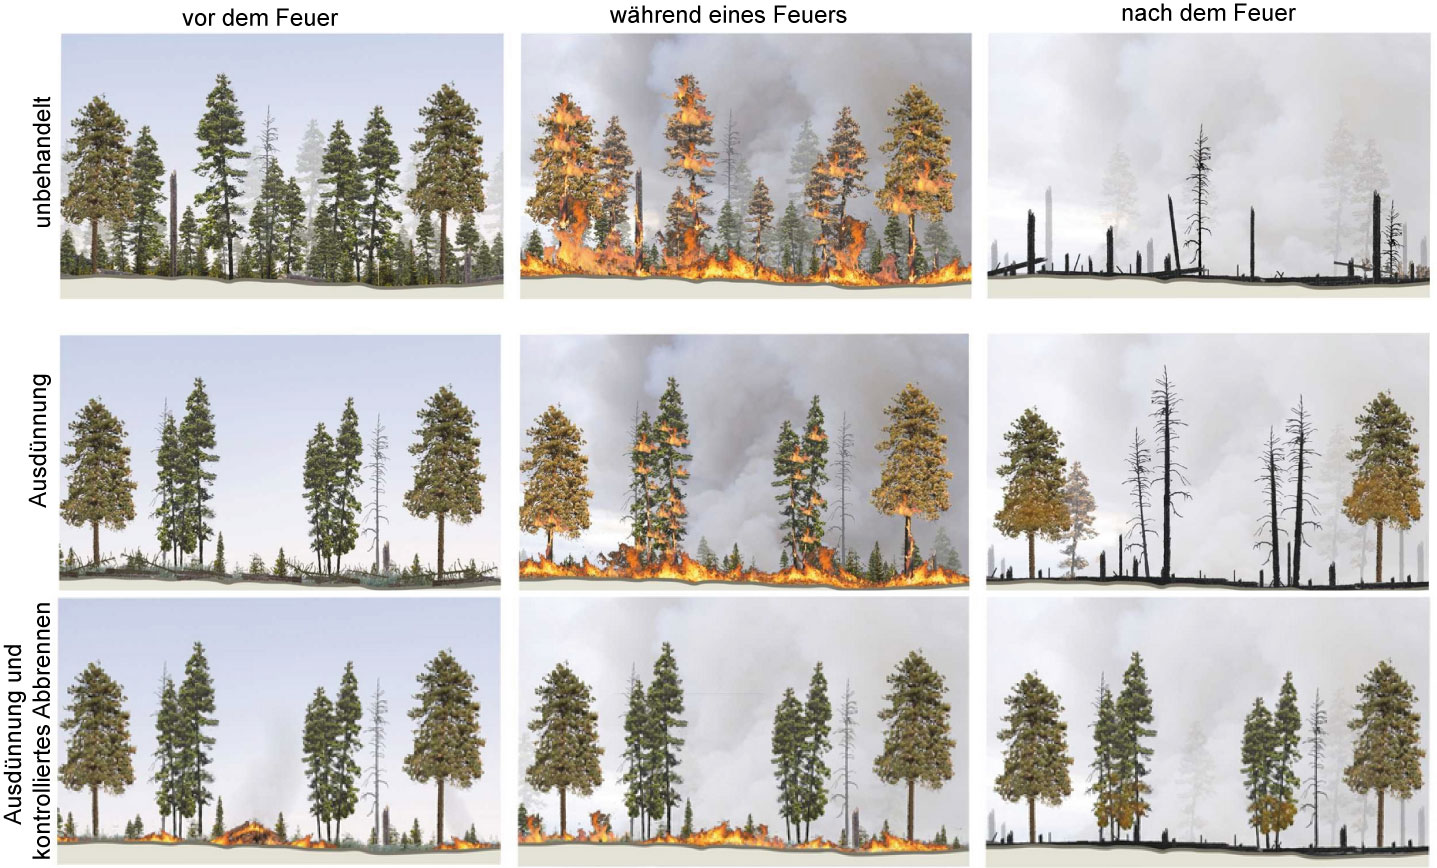
275 KB | Methoden der Waldbrandbekämpfung im Westen der USA ==Lizenzhinweis== {| style="border:1px solid #8888aa; background-color:#f7f8ff;padding:5px;font-size:95%;" | Quelle: Davis, K.T., J. Peeler, J. Fargione et al. (2024): Tamm review: A meta-analysis of thinning, prescribed fire, and wildfire effects on subsequent wildfire severity in conifer dominated forests of the Western US, Forest Ecology and Management 561, https://doi.org/10.1016/j.foreco.2024.121885 <br> Lizenz: CC BY http://creativecommo… | 1 |
| 13:13, 21. Jan. 2025 | CO2 CH4 concentration 2003-2024.jpg (Datei) |  |
183 KB | == Beschreibung == Änderung der globalen CO2- und CH4-Konzentration zwischen 2003 und 2024. == Lizenzhinweis == {| style="border:1px solid #8888aa; background-color:#f7f8ff;padding:5px;font-size:95%;" | Quelle: Copernicus Climate Change Service, C3S (2025): Copernicus: 2024 is the first year to exceed 1.5°C above pre-industrial level, https://climate.copernicus.eu/copernicus-2024-first-year-exceed-15degc-above-pre-industrial-level <br> Lizenz: Reproduction of the publicly available content of… | 1 |
| 13:05, 21. Jan. 2025 | Hunga Tonga 15.1.2022.jpg (Datei) |  |
129 KB | == Beschreibung == Ausbruch des Unterwasservulkans Hunga Tonga am 15.1.2022. == Lizenzhinweis == {| style="border:1px solid #8888aa; background-color:#f7f8ff;padding:5px;font-size:95%;" | Quelle: Wikimedia Commons (2022): Satellite images of Hunga Tonga volcano's eruption on 15 January 2022, https://commons.wikimedia.org/wiki/File:Tonga_Eruption_GOES-17_1-15-2022.gif ; ursprgl. NOAA, https://console.cloud.google.com/marketplace/details/noaa-public/goes-17<br> Lizenz: public domain |} | 1 |
| 12:58, 21. Jan. 2025 | Global warming by month 2023.jpg (Datei) |  |
123 KB | == Beschreibung == Globale Temperaturänderung 2023 im Vergleich zur vorindustriellen Periode 1850-1900 nach Monaten ==Lizenzhinweis== {| style="border:1px solid #8888aa; background-color:#f7f8ff;padding:5px;font-size:95%;" | Quelle: Rohde, R. (2024): Global Temperature Report for 2023, https://berkeleyearth.org/global-temperature-report-for-2023/ <br> Lizenz: CC BY-NC https://creativecommons.org/licenses/by-nc/4.0/ |} | 1 |
| 13:51, 20. Jan. 2025 | Temp 1950-2024 models obs.jpg (Datei) |  |
43 KB | 2 | |
| 16:07, 18. Jan. 2025 | 2024 OHC anomaly.jpg (Datei) |  |
52 KB | == Beschreibung == Erhöhung des Wärmegehalts der oberen 2000 m im Jahr 2024 gegenüber dem Mittel 1981-2010 in 109 Joule pro m2 ==Lizenzhinweis== {| style="border:1px solid #8888aa; background-color:#f7f8ff;padding:5px;font-size:95%;" | Quelle: Cheng, L., J. Abraham, K.E. Trenberth et al. (2025): [https://doi.org/10.1007/s00376-025-4541-3 Record High Temperatures in the Ocean in 2024], Advances in Atmospheric Sciences <br> Lizenz: [http://creativecommons.org/licenses/by/4.0/ CC BY] |} | 1 |
| 16:05, 18. Jan. 2025 | 2024 global SST anomaly.jpg (Datei) |  |
46 KB | == Beschreibung == Änderung der Meeresoberflächentemperatur 2024 gegenüber dem Mittel 1981-2010 in °C ==Lizenzhinweis== {| style="border:1px solid #8888aa; background-color:#f7f8ff;padding:5px;font-size:95%;" | Quelle: Cheng, L., J. Abraham, K.E. Trenberth et al. (2025): [https://doi.org/10.1007/s00376-025-4541-3 Record High Temperatures in the Ocean in 2024], Advances in Atmospheric Sciences <br> Lizenz: [http://creativecommons.org/licenses/by/4.0/ CC BY] |} | 1 |
| 16:00, 18. Jan. 2025 | SST global 1955-2024.jpg (Datei) |  |
61 KB | == Beschreibung == Die globale Meeresoberflächentemperatur (SST) von 1955 bis 2024 als monatliche Abweichung vom Mittel 1981-2010 ==Lizenzhinweis== {| style="border:1px solid #8888aa; background-color:#f7f8ff;padding:5px;font-size:95%;" | Quelle: Cheng, L., J. Abraham, K.E. Trenberth et al. (2025): Record High Temperatures in the Ocean in 2024, Advances in Atmospheric Sciences, https://doi.org/10.1007/s00376-025-4541-3 <br> Lizenz: [http://creativecommons.org/licenses/by/4.0/ CC BY] |} | 1 |
| 15:50, 18. Jan. 2025 | Global-SST-1981-2025.jpg (Datei) |  |
115 KB | == Beschreibung == Tageswerte der globalen Meeresoberflächentemperatur zwischen 60°S und 60°N 1981 bis Januar 2024 in °C. ==Lizenzhinweis== {| style="border:1px solid #8888aa; background-color:#f7f8ff;padding:5px;font-size:95%;" | Quelle: Climate Reanalyzer (2024): [https://climatereanalyzer.org/clim/sst_daily/ Daily Sea Surface Temperature] <br> Lizenz: [http://creativecommons.org/licenses/by/4.0/ CC BY] |} | 1 |
| 15:22, 18. Jan. 2025 | Land ocean temp1850-2024 BE.jpg (Datei) |  |
97 KB | == Beschreibung == Erwärmung über Land und Ozean 1850-2024. Temperaturabweichung vom vorindustriellen Mittel 1850-1900. == Lizenzhinweis == {| style="border:1px solid #8888aa; background-color:#f7f8ff;padding:5px;font-size:95%;" | Quelle: Rohde, R., Berkeley Earth (2025): Global Temperature Report for 2024, https://berkeleyearth.org/global-temperature-report-for-2024/ <br> Lizenz: [https://creativecommons.org/licenses/by-nc/4.0/ CC BY-NC] |} | 1 |
| 15:16, 18. Jan. 2025 | Global temp 1967-2024.jpg (Datei) |  |
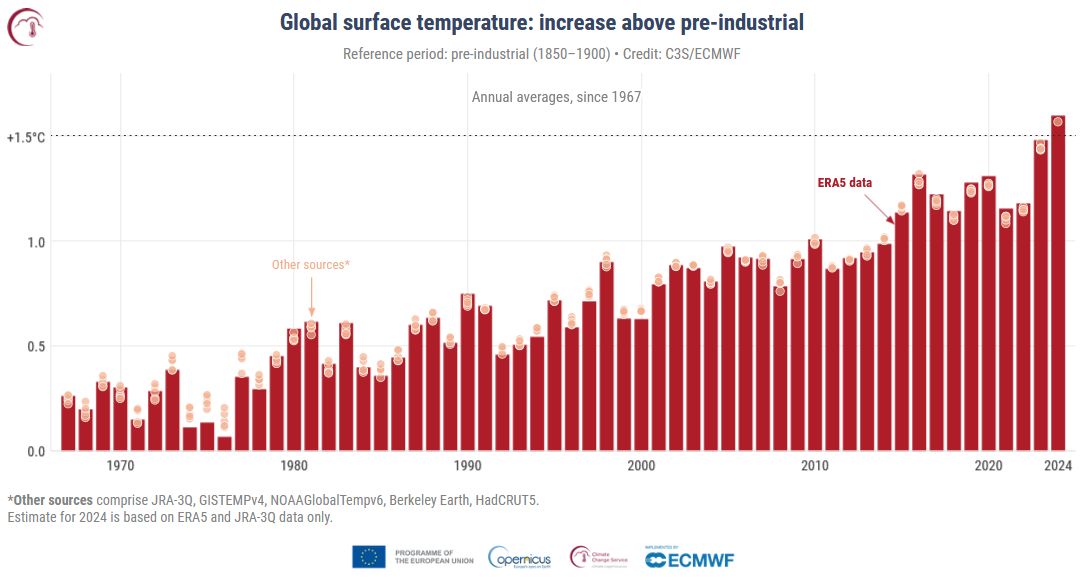
69 KB | == Beschreibung == Globale Temperaturen 1967-2024 relativ zu 1850-1900 nach verschiedenen Datenreihen. Die orangenen Punkte geben die Werte anderer Datenquellen an. == Lizenzhinweis == {| style="border:1px solid #8888aa; background-color:#f7f8ff;padding:5px;font-size:95%;" | Quelle: Copernicus Climate Change Service (2025): Global Climate Highlights 2024, https://climate.copernicus.eu/global-climate-highlights-2024 Lizenz: Reproduction of the publicly available content of this website is a… | 1 |