Von Dieter Kasang hochgeladene Dateien
Aus Klimawandel
Diese Spezialseite listet alle hochgeladenen Dateien auf.
| Datum | Name | Vorschaubild | Größe | Beschreibung | Versionen |
|---|---|---|---|---|---|
| 22:39, 17. Feb. 2025 | Amazonas-Wasserkreislauf.jpg (Datei) |  |
59 KB | == Beschreibung == Wasserkreislauf im Amazonas-Regenwald ==Lizenzhinweis== {| style="border:1px solid #8888aa; background-color:#f7f8ff;padding:5px;font-size:95%;" | Quelle: Marengo, J.A. (2020): Drought, Floods, Climate Change, and Forest Loss in the Amazon Region: A Present and Future Danger? Front. Young Minds. 8:147. doi: 10.3389/frym.2019.00147; <br> Lizenz: Lizenz: [https://creativecommons.org/licenses/by/4.0/ CC BY] |} | 1 |
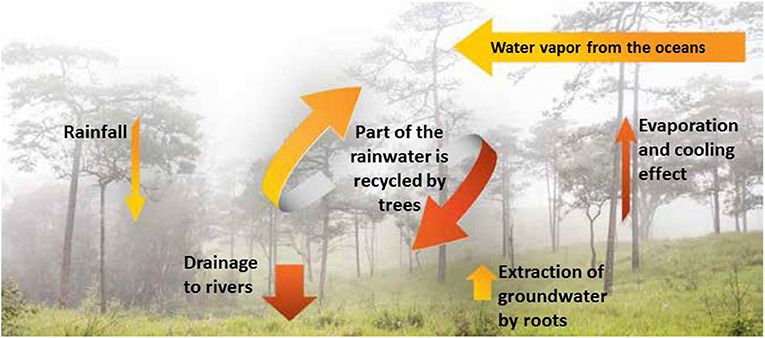
| 18:48, 17. Feb. 2025 | Amazon hydrologische Prozesse.jpg (Datei) |  |
83 KB | Hydrologische Prozesse im Amazonasgebiet ==Lizenzhinweis== {| style="border:1px solid #8888aa; background-color:#f7f8ff;padding:5px;font-size:95%;" | Quelle: Costa, M.H., L.S. Borma, J.C. Espinoza et al. (2021): The Physical hydroclimate system of the Amazon In: Nobre, C., A. Encalada, E. Anderson et al. (Ed.). Amazon Assessment Report 2021, Part 1, Chapter 5, https://www.theamazonwewant.org/spa_publication/amazon-assessment-report-2021/ <br /> Lizenz: Lizenz: CC-BY-NC-SA |} | 1 |
| 18:38, 17. Feb. 2025 | Amazon rain Pacific Atlantic.jpg (Datei) |  |
118 KB | == Beschreibung == Die Haupteinflussfaktoren auf die Amazonasniederschläge: ENSO, Meeresoberflächentemperaturen (SST) im tropischen Nordatlantik und die ITCZ-Position. ==Lizenzhinweis== {| style="border:1px solid #8888aa; background-color:#f7f8ff;padding:5px;font-size:95%;" | Quelle: Ciemer, C., L. Rehm, J. Kurths et al. (2020): An early-warning indicator for Amazon droughts exclusively based on tropical Atlantic sea surface temperatures, Environmental Research Letters 15, 9, https://dx.doi.or… | 1 |
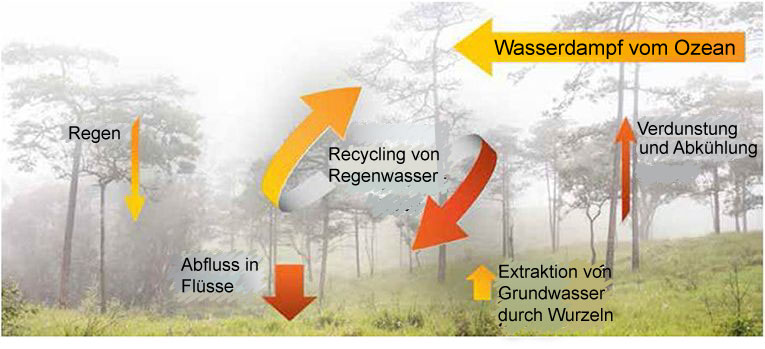
| 18:30, 17. Feb. 2025 | Amazonas Wasserkreislauf.jpg (Datei) |  |
49 KB | == Beschreibung == Wasserkreislauf im Amazonas-Regenwald ==Lizenzhinweis== {| style="border:1px solid #8888aa; background-color:#f7f8ff;padding:5px;font-size:95%;" | Quelle: Marengo, J.A. (2020): Drought, Floods, Climate Change, and Forest Loss in the Amazon Region: A Present and Future Danger? Front. Young Minds. 8:147. doi: 10.3389/frym.2019.00147; <br> Lizenz: Lizenz: CC BY https://creativecommons.org/licenses/by/4.0/ |} | 1 |
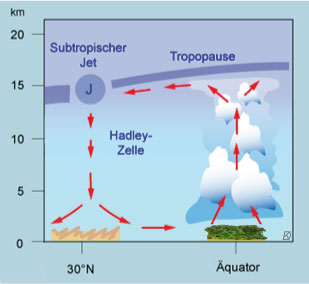
| 18:26, 17. Feb. 2025 | Tropische-zirkulation.jpg (Datei) |  |
15 KB | == Beschreibung == Tropische Zirkulation ==Lizenzhinweis== {| style="border:1px solid #8888aa; background-color:#f7f8ff;padding:5px;font-size:95%;" | Quelle: Eigene Darstellung (Dieter Kasang)<br> Lizenz: CC-BY-NC-SA |} | 1 |
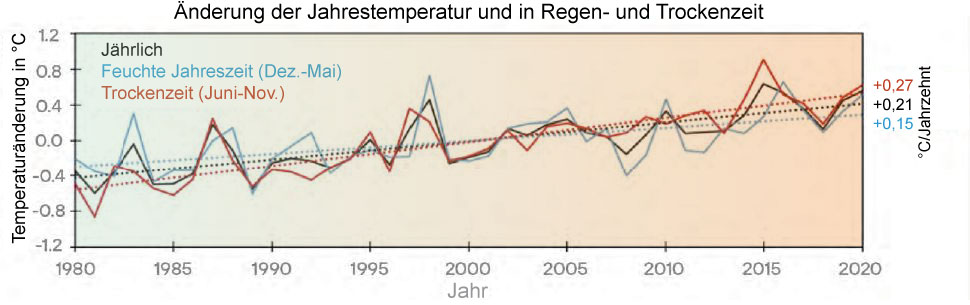
| 17:39, 17. Feb. 2025 | Amazon-temp-1980-2020.jpg (Datei) |  |
53 KB | == Beschreibung == Änderung der Jahresmittel- und der Temperatur der Regen- und Trockenzeit im Amazonasgebiet 1980-2020 ==Lizenzhinweis== {| style="border:1px solid #8888aa; background-color:#f7f8ff;padding:5px;font-size:95%;" | Quelle: Marengo, J.A., J.C. Espinoza, R. Fu et al. (2021): [https://www.theamazonwewant.org/wp-content/uploads/2022/05/Chapter-22-Bound-May-11.pdf Long-term variability, extremes and changes in temperature and hydrometeorology in the Amazon region]. In: Nobre, C., A. En… | 1 |
| 17:14, 17. Feb. 2025 | Amazonas-Erwärmungsraten.jpg (Datei) |  |
45 KB | == Beschreibung == Regionale Unterschiede in der Erwärmungsrate im Amazonasgebiet in °C/Jahrzehnt. ==Lizenzhinweis== {| style="border:1px solid #8888aa; background-color:#f7f8ff;padding:5px;font-size:95%;" | Quelle: Marengo, J.A., J.C. Espinoza, R. Fu et al. (2021): Long-term variability, extremes and changes in temperature and hydrometeorology in the Amazon region. In: Nobre, C., A. Encalada, E. Anderson et al. (Ed.). Amazon Assessment Report 2021, Chapter 22, https://www.theamazonwewant.org/w… | 1 |
| 13:26, 11. Feb. 2025 | Treibhauseffekt---Strahlung.jpg (Datei) |  |
58 KB | == Beschreibung == Treibhauseffekt, Strahlung und Treibhausgase == Lizenzhinweis == {| style="border:1px solid #8888aa; background-color:#f7f8ff;padding:5px;font-size:95%;" |Quelle: Klimafakten.de (2020): Fakten rund ums Klima, https://www.klimafakten.de/kommunikation/fakten-rund-ums-klima-emissionen<br> Lizenz: CC BY 4.0 https://creativecommons.org/licenses/by/4.0/legalcode.de%20%20 |} | 1 |
| 13:19, 11. Feb. 2025 | Atmosphäre - Aufbau.jpg (Datei) |  |
47 KB | Aufbau der Atmosphäre ==Lizenzhinweis== {| style="border:1px solid #8888aa; background-color:#f7f8ff;padding:5px;font-size:95%;" | Quelle: Klimafakten.de (2020): Fakten rund ums Klima, https://www.klimafakten.de/kommunikation/fakten-rund-ums-klima-emissionen Lizenz: CC BY 4.0 https://creativecommons.org/licenses/by/4.0/legalcode.de%20%20 |} | 1 |
| 12:38, 11. Feb. 2025 | Der Treibhauseffekt.jpg (Datei) |  |
147 KB | Der Treibhauseffekt, vereinfachte Darstellung == Lizenzhinweis == {| style="border:1px solid #8888aa; background-color:#f7f8ff;padding:5px;font-size:95%;" |Quelle: Office for Climate Education (2020): IPCC-Sonderbericht „Ozean und Kryosphäre in einem sich wandelnden Klima” – Zusammenfassung für Lehrerinnen und Lehrer, https://www.sonnentaler.net/dokumentation/ipcc-berichte/sr-ozean-kryosphaere/ <br> Lizenz: CC BY-NC-SA |} | 1 |
| 22:45, 10. Feb. 2025 | Amazon deforestation cc.jpg (Datei) |  |
110 KB | == Beschreibung == Abholzung des Amazonas-Regenwalds und die Warnung vor dem Klimawandel == Lizenzhinweis == {| style="border:1px solid #8888aa; background-color:#f7f8ff;padding:5px;font-size:95%;" |Quelle: Marengo, J.A. (2020): Drought, Floods, Climate Change, and Forest Loss in the Amazon Region: A Present and Future Danger? Front. Young Minds. 8:147. doi: 10.3389/frym.2019.00147)<br> Lizenz: CC BY 4.0 https://creativecommons.org/licenses/by/4.0/ | 1 |
| 19:32, 10. Feb. 2025 | Eisschild Komponenten.jpg (Datei) |  |
42 KB | == Beschreibung == Prozesse und Teile eines Eisschilds, übersetzt ==Lizenzhinweis== {| style="border:1px solid #8888aa; background-color:#f7f8ff;padding:5px;font-size:95%;" | Quelle: Winkelmann, R., L. Nicola and D. Notz (2022): The Antarctic Ice Sheet–A Sleeping Giant? Front. Young Minds. 10:702643. https://kids.frontiersin.org/articles/10.3389/frym.2022.702643 Lizenz: CC BY https://creativecommons.org/licenses/by/4.0/ <br> Lizenz: [https://creativecommons.org/licenses/by/4.0/ CC BY] |} | 1 |
| 13:03, 10. Feb. 2025 | CO2-Emissionen Speicher.jpg (Datei) |  |
47 KB | == Beschreibung == Emissionen von Kohlendioxid (CO2) und CO2-Speicher ==Lizenzhinweis== {| style="border:1px solid #8888aa; background-color:#f7f8ff;padding:5px;font-size:95%;" | Quelle: Heinrich Böll Stiftung (2017):Weltklima: Der Ozean bremst den Klimawandel, Abb.: petraboeckmann.de, https://www.boell.de/de/2017/05/10/weltklima-der-ozean-bremst-den-klimawandel <br> Lizenz: CC BY http://creativecommons.org/licenses/by/4.0/deed.de |} | 1 |
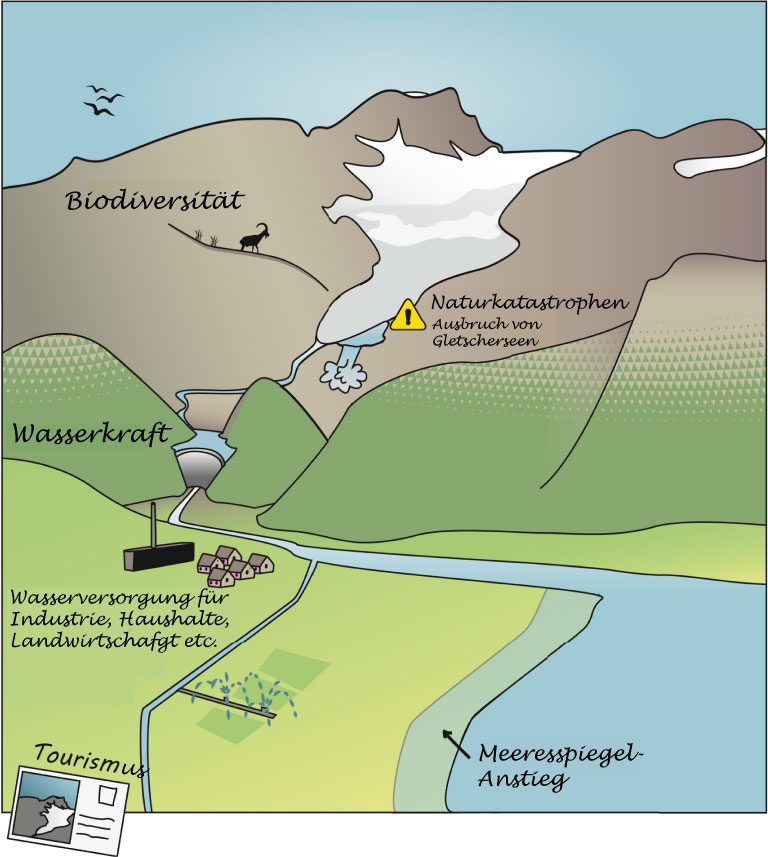
| 19:05, 8. Feb. 2025 | Klimasystem und Subsysteme.jpg (Datei) |  |
79 KB | Ins Meer mündender Eisschild mit Schelfeis. Aufsetzlinie und Felsuntergrund unter dem Meeresspiegel. ==Lizenzhinweis== {| style="border:1px solid #8888aa; background-color:#f7f8ff;padding:5px;font-size:95%;" | Quelle: Bamber, J.L., R.M. Westaway, B. Marzeion, and B. Wouters (2018): The land ice contribution to sea level during the satellite era, Environ. Res. Lett. 13 063008<br> Lizenz: [https://creativecommons.org/licenses/by/3.0/ CC BY] |} | 1 |
| 14:24, 6. Feb. 2025 | Glaciers-landscape dt.jpg (Datei) |  |
99 KB | == Beschreibung == Einfluss eines Gletschers auf seine Umgebung. Übersetzt. ==Lizenzhinweis== {| style="border:1px solid #8888aa; background-color:#f7f8ff;padding:5px;font-size:95%;" | Quelle: Zekollari, H., Huss, M., Farinotti, D., & Lhermitte, S. (2022): Ice-dynamical glacier evolution modeling—A review. Reviews of Geophysics, 60, e2021RG000754. https://doi.org/10.1029/2021RG000754 <br> Lizenz: CC BY http://creativecommons.org/licenses/by/4.0/ |} | 1 |
| 13:41, 6. Feb. 2025 | Gebirgs-Gletscher Massenbilanz.jpg (Datei) |  |
81 KB | Grundlegende Prozesse, die die Massenbilanz von Gletschern bestimmen. ==Lizenzhinweis== {| style="border:1px solid #8888aa; background-color:#f7f8ff;padding:5px;font-size:95%;" | Quelle: Flickr: How mountain glaciers gain and lose mass https://www.flickr.com/photos/gridarendal/32361978445/in/album-72157679157438546/ ursprgl. : GRID-Arendal http://www.grida.no/resources/6669 Lizenz: CC BY-NC-SA https://creativecommons.org/licenses/by-nc-sa/2.0/ <br> Lizenz: CC BY-NC-SA |} | 1 |
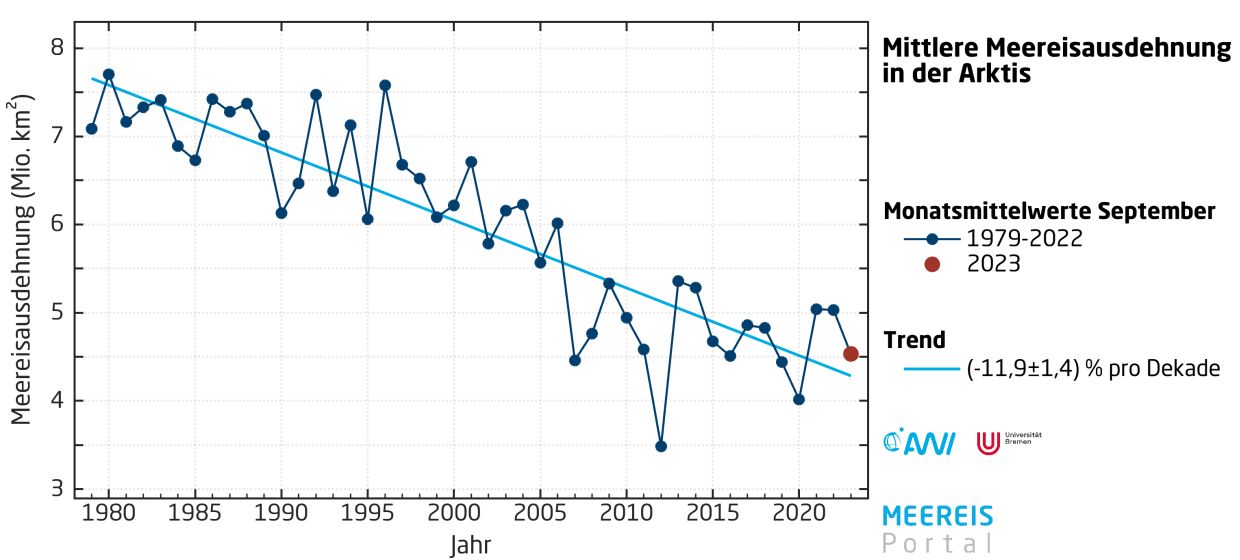
| 18:55, 5. Feb. 2025 | Arktis-Meereis-März-Sept.jpg (Datei) |  |
65 KB | Arktisches und Antarktisches Meereis in den Maximum- und Minimum-Monaten. Die blaue-weiße Farbabstufung zeigt die Meereis-Konzentration in % an. ==Lizenzhinweis== {| style="border:1px solid #8888aa; background-color:#f7f8ff;padding:5px;font-size:95%;" | Quelle: National Snow and Ice Data Center (2025): Sea Ice, https://nsidc.org/learn/parts-cryosphere/sea-ice <br> Lizenz: public domain |} | 1 |
| 16:49, 5. Feb. 2025 | Greenland ice cover.jpg (Datei) |  |
148 KB | Eisbedeckung auf Grönland ==Lizenzhinweis== {| style="border:1px solid #8888aa; background-color:#f7f8ff;padding:5px;font-size:95%;" |Quelle: Wikipedia (2005): Satellite photo highlighting the island of Greenland, as well as Iceland and the Canadian Arctic Archipelago, https://de.wikipedia.org/wiki/Datei:Greenland_42.74746W_71.57394N.jpg<br> Lizenz: public domain |} | 1 |
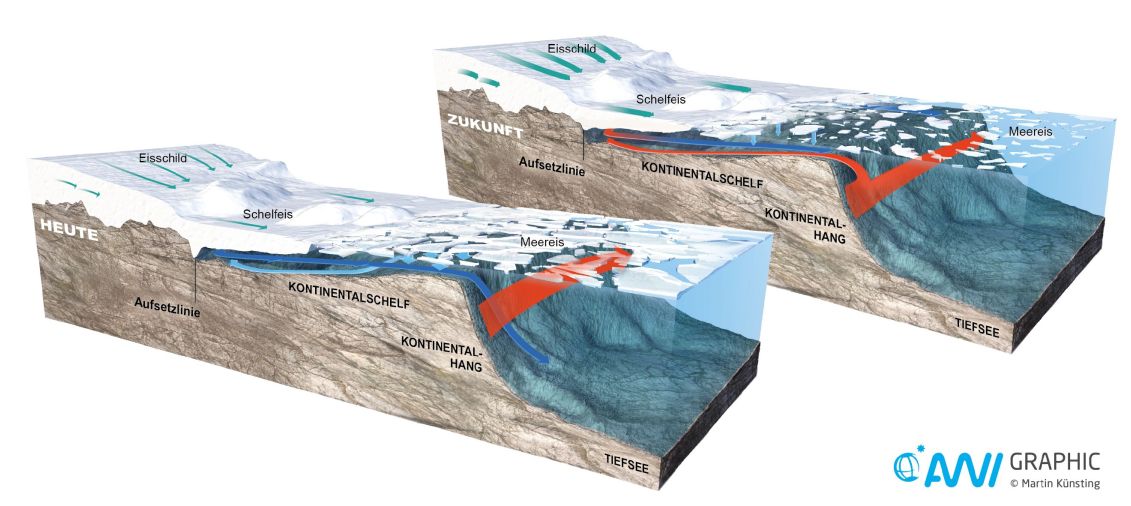
| 16:12, 5. Feb. 2025 | Filchner-Schelfeis Meeresströmungen.jpg (Datei) |  |
87 KB | == Beschreibung == Abschmelzen des Filchner-Eisschelfs durch Eindringen von warmem Wasser heute (oben) und in Zukunft (unten). ==Lizenzhinweis== {| style="border:1px solid #8888aa; background-color:#f7f8ff;padding:5px;font-size:95%;" | Quelle: Alfred-Wegener-Institut: Mediathek, Infographik, https://multimedia.awi.de/#1552335304661_6<br> Lizenz: CC BY 4.0 |} | 1 |
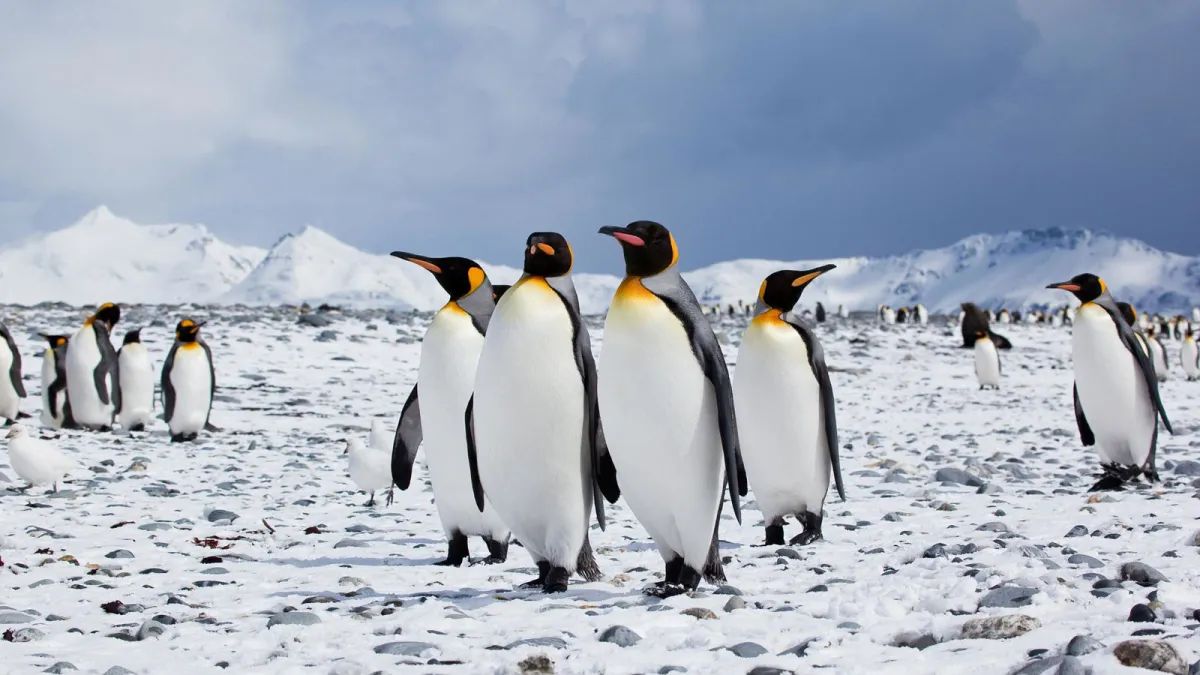
| 14:10, 5. Feb. 2025 | Pinguine Antarktis.jpg (Datei) |  |
109 KB | Pinguine in der Antarktis ==Lizenzhinweis== {| style="border:1px solid #8888aa; background-color:#f7f8ff;padding:5px;font-size:95%;" | Quelle: Pope, K. (2022): What the latest science says about Antarctica and sea-level rise, https://yaleclimateconnections.org/2022/02/what-the-latest-science-says-about-antarctica-and-sea-level-rise/, Foto: Antarctica Bound <br> Lizenz:CC BY-ND 2.0 https://creativecommons.org/licenses/by-nd/2.0/ |} | 1 |
| 14:00, 5. Feb. 2025 | Westantarktis vor 90 Mio Jahren.jpg (Datei) |  |
196 KB | Die Westantarktis vor 90 Mio. Jahren: Angenommener Regenwald aufgrund von Sedimentbohrkernen. ==Lizenzhinweis== {| style="border:1px solid #8888aa; background-color:#f7f8ff;padding:5px;font-size:95%;" | Quelle: Alfred-Wegener-Institut / James McKay, http://multimedia.awi.de/#1689274460961_21 <br> Lizenz: CC BY 4.0 |} | 1 |
| 13:12, 3. Feb. 2025 | Antarctic sea ice März.jpg (Datei) |  |
265 KB | Märzmittel der Meereisausdehnung in der Antarktis 1979-2024. Meereisausdehnung: Fläche mit über 15 % Meereisbedeckung. ==Lizenzhinweis== {| style="border:1px solid #8888aa; background-color:#f7f8ff;padding:5px;font-size:95%;" | Quelle: Meereisportal.de (2025): [https://www.meereisportal.de/karten-grafiken/trendkurven Monatsmittelwerte der Meereisausdehnung: Arktis] <br> Lizenz: "Aufbereitetes Kartenmaterial, Grafiken und Abbildungen dürfen nur unter Angabe der angegebenen Referenz oder mit Hin… | 1 |
| 12:54, 3. Feb. 2025 | Arktis Meereis Ausdehnung aktuell.jpg (Datei) |  |
276 KB | 4 | |
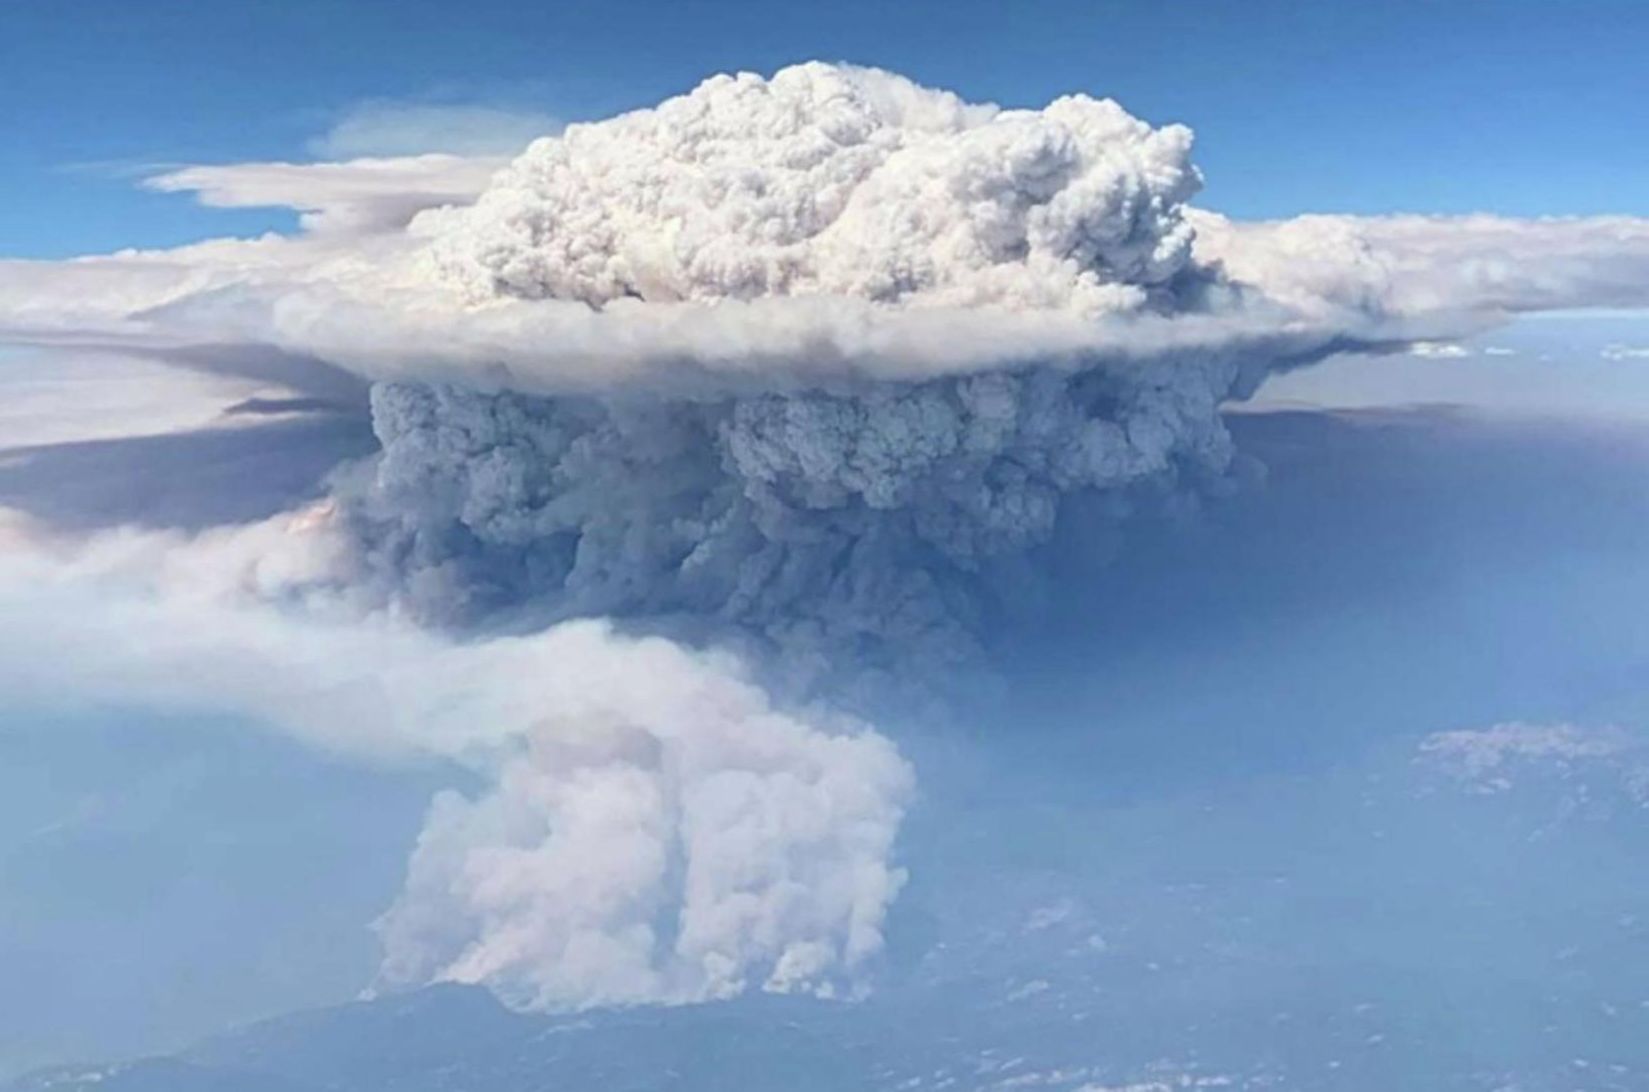
| 15:58, 1. Feb. 2025 | Creek Fire plume 2020.jpg (Datei) |  |
101 KB | == Beschreibung == Rauchentwicklung über dem Creek Fire 2020 ==Lizenzhinweis== {| style="border:1px solid #8888aa; background-color:#f7f8ff;padding:5px;font-size:95%;" | Quelle: Stephens, S.L., A.A. Bernal, B.M. Collins et al. (2022): Mass fire behavior created by extensive tree mortality and high tree density not predicted by operational fire behavior models in the southern Sierra Nevada, Forest Ecology and Management 518, https://doi.org/10.1016/j.foreco.2022.120258 Lizenz: CC BY http://creat… | 1 |
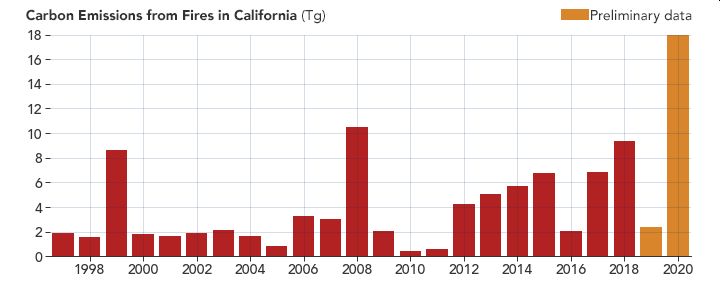
| 15:53, 1. Feb. 2025 | Cal fire2020 carbon emissions.jpg (Datei) |  |
25 KB | Kohlenstoffemissionen durch kalifornische Waldbrände 1997-2020 in Tg. 2020: vorläufige Daten (9.9.2020). ==Lizenzhinweis== {| style="border:1px solid #8888aa; background-color:#f7f8ff;padding:5px;font-size:95%;" | Quelle: NASA Earth Observatory (2020): Historic Fires Devastate the U.S. Pacific Coast, https://earthobservatory.nasa.gov/images/147277/historic-fires-devastate-the-us-pacific-coast Lizenz: public domain |} | 1 |
| 14:27, 1. Feb. 2025 | Homes destroyed Palisades fire.jpg (Datei) |  |
261 KB | == Beschreibung == Abgebrannte Wohngebäude in Los Angeles, Pacific Palisades, am 14. Januar 2025 ==Lizenzhinweis== {| style="border:1px solid #8888aa; background-color:#f7f8ff;padding:5px;font-size:95%;" | Quelle: Wikimedia Commons: Homes destroyed in the Palisades fire, https://commons.wikimedia.org/wiki/File:Homes_destroyed_in_the_Palisades_fire_(54272193113).jpg <br> Lizenz: [https://creativecommons.org/licenses/by/2.0/deed.en CC BY] |} | 1 |
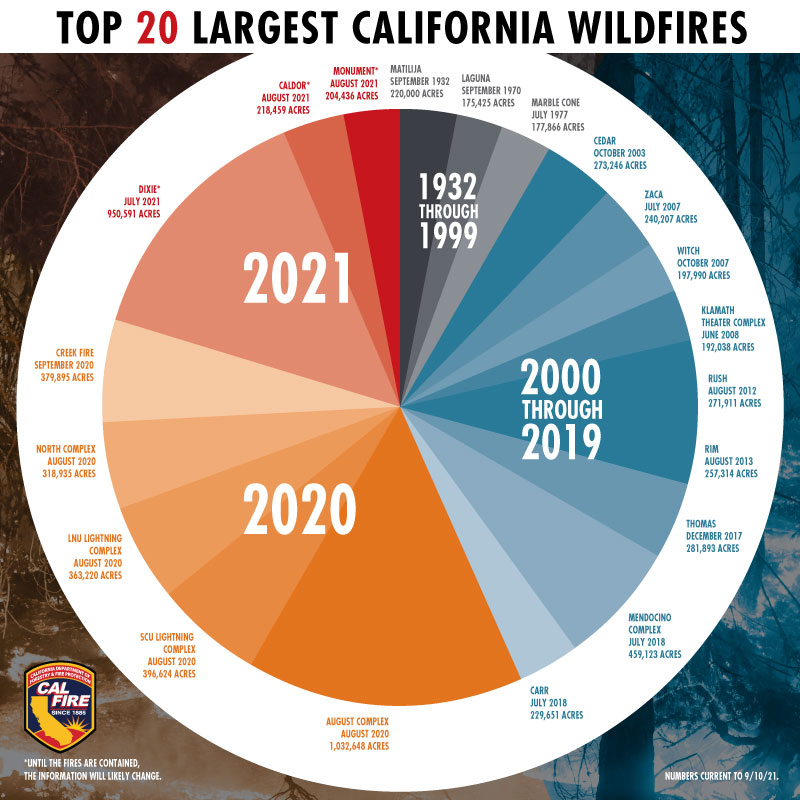
| 12:09, 1. Feb. 2025 | Top 20 Wildfires California 1932-2021.jpg (Datei) |  |
130 KB | == Beschreibung == Die 20 größten Waldbrände in Kalifornien 1932-2021 ==Lizenzhinweis== {| style="border:1px solid #8888aa; background-color:#f7f8ff;padding:5px;font-size:95%;" | Quelle: Wikimedia Commons (2021): Top 20 Wildfires in California, 1932 - Sept 10, 2021, https://commons.wikimedia.org/wiki/File:Top_20_Wildfires_in_California,_1932_-_Sept_10,_2021.jpg?uselang=de ; ursprgl.: CalFire, https://pbs.twimg.com/media/E-8nhb9VEAEp3z4?format=jpg&name=900x900 <br> Lizenz: public domain |} | 1 |
| 12:01, 1. Feb. 2025 | Wohnhaus 8.1.2025 sm.jpg (Datei) |  |
145 KB | == Beschreibung == Abgebranntes Wohnhaus in Los Angeles am 8. Januar 2025. ==Lizenzhinweis== {| style="border:1px solid #8888aa; background-color:#f7f8ff;padding:5px;font-size:95%;" | Quelle: Wikipedia (2025): Raleigh Tomlinson - parents home after the fire 1-8-2025, https://de.wikipedia.org/wiki/Datei:Parents_home_after_the_fire_1-8-2025_(54255210033).jpg <br> Lizenz: CC BY https://creativecommons.org/licenses/by/2.0/deed.de |} | 1 |
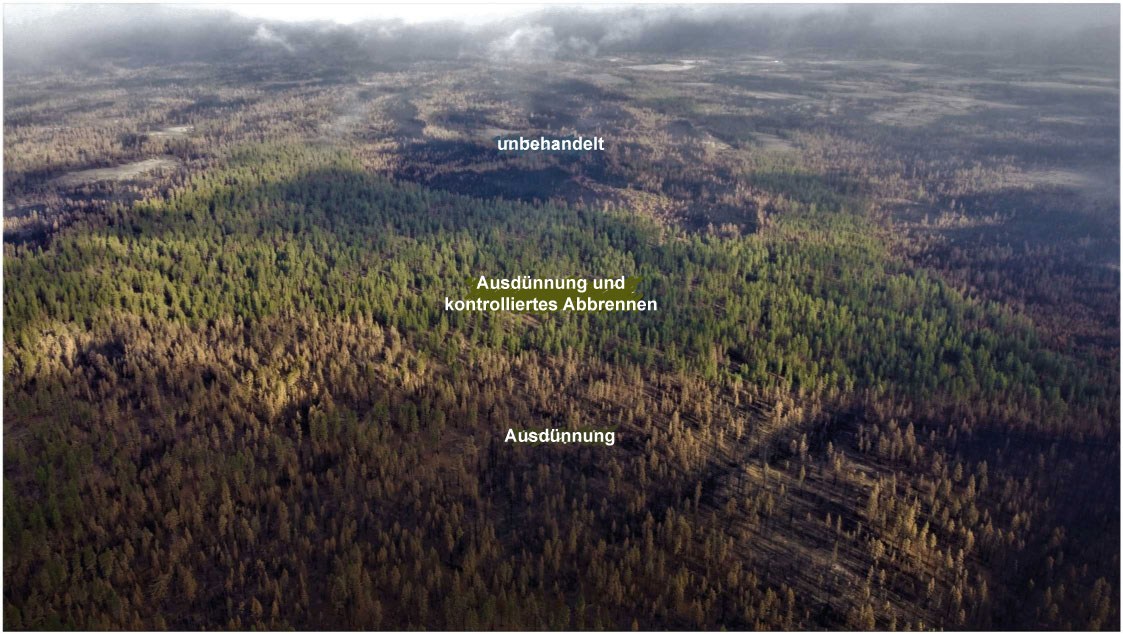
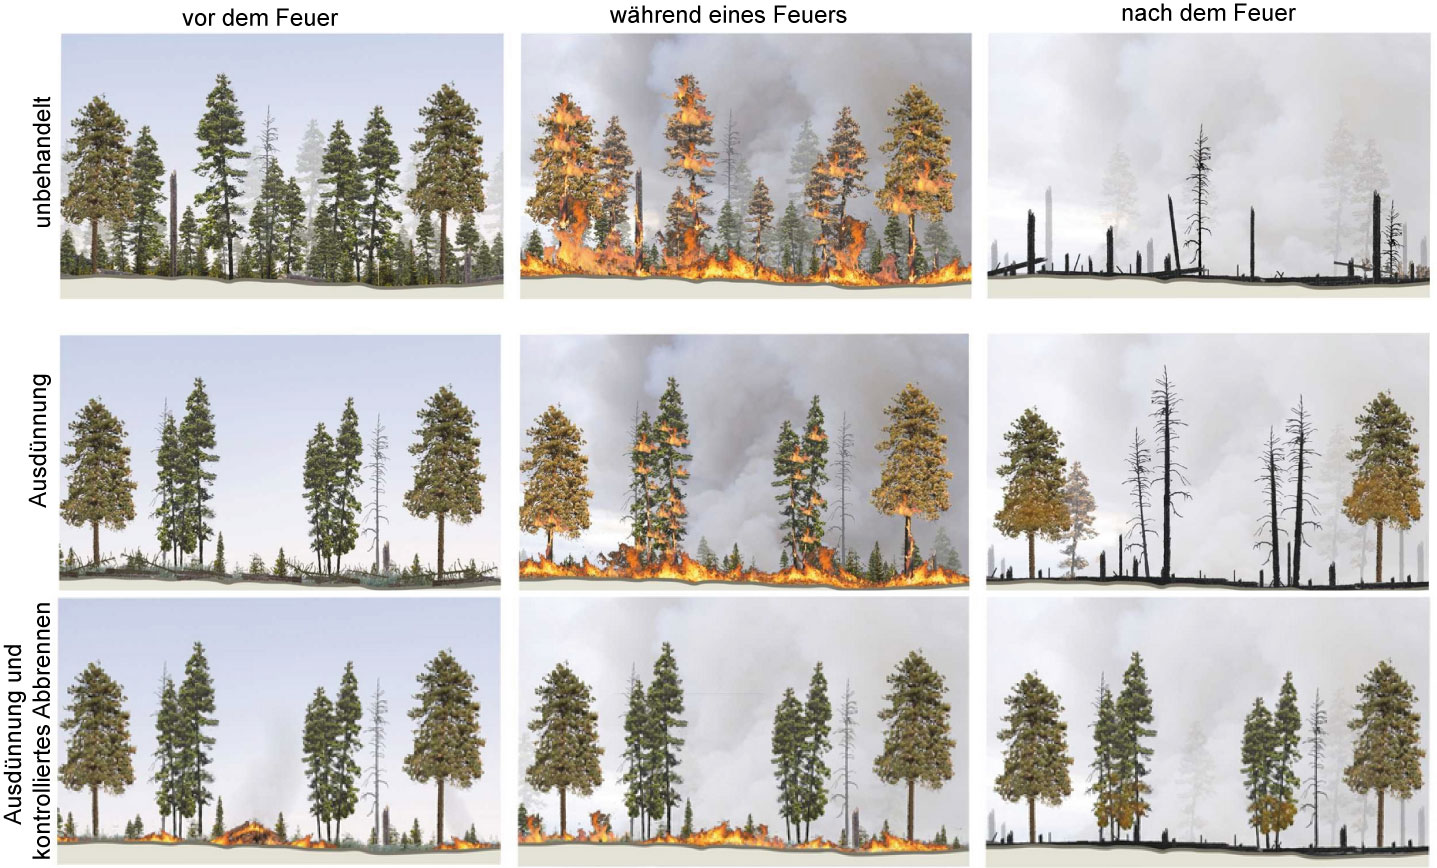
| 18:11, 24. Jan. 2025 | Fire-treatment-effects-W-US.jpg (Datei) |  |
178 KB | == Beschreibung == Folgen der Waldbrandbekämpfung nach einem Feuer in Oregon 2021: Bei fehlender Behandlung des Waldbestandes ist der Wald stark geschädigt (hinten), bei Ausdünnung des Baumbestandes sind die Schäden deutlich geringer (vorne), bei Ausdünnung und kontrolliertem Abbrennen am geringsten (mittig). ==Lizenzhinweis== {| style="border:1px solid #8888aa; background-color:#f7f8ff;padding:5px;font-size:95%;" | Quelle: Davis, K.T., J. Peeler, J. Fargione et al. (2024): [https://doi.org/10… | 1 |
| 18:05, 24. Jan. 2025 | Fire-treatment-W-US.jpg (Datei) |  |
275 KB | Methoden der Waldbrandbekämpfung im Westen der USA ==Lizenzhinweis== {| style="border:1px solid #8888aa; background-color:#f7f8ff;padding:5px;font-size:95%;" | Quelle: Davis, K.T., J. Peeler, J. Fargione et al. (2024): Tamm review: A meta-analysis of thinning, prescribed fire, and wildfire effects on subsequent wildfire severity in conifer dominated forests of the Western US, Forest Ecology and Management 561, https://doi.org/10.1016/j.foreco.2024.121885 <br> Lizenz: CC BY http://creativecommo… | 1 |
| 15:13, 21. Jan. 2025 | CO2 CH4 concentration 2003-2024.jpg (Datei) |  |
183 KB | == Beschreibung == Änderung der globalen CO2- und CH4-Konzentration zwischen 2003 und 2024. == Lizenzhinweis == {| style="border:1px solid #8888aa; background-color:#f7f8ff;padding:5px;font-size:95%;" | Quelle: Copernicus Climate Change Service, C3S (2025): Copernicus: 2024 is the first year to exceed 1.5°C above pre-industrial level, https://climate.copernicus.eu/copernicus-2024-first-year-exceed-15degc-above-pre-industrial-level <br> Lizenz: Reproduction of the publicly available content of… | 1 |
| 15:05, 21. Jan. 2025 | Hunga Tonga 15.1.2022.jpg (Datei) |  |
129 KB | == Beschreibung == Ausbruch des Unterwasservulkans Hunga Tonga am 15.1.2022. == Lizenzhinweis == {| style="border:1px solid #8888aa; background-color:#f7f8ff;padding:5px;font-size:95%;" | Quelle: Wikimedia Commons (2022): Satellite images of Hunga Tonga volcano's eruption on 15 January 2022, https://commons.wikimedia.org/wiki/File:Tonga_Eruption_GOES-17_1-15-2022.gif ; ursprgl. NOAA, https://console.cloud.google.com/marketplace/details/noaa-public/goes-17<br> Lizenz: public domain |} | 1 |
| 14:58, 21. Jan. 2025 | Global warming by month 2023.jpg (Datei) |  |
123 KB | == Beschreibung == Globale Temperaturänderung 2023 im Vergleich zur vorindustriellen Periode 1850-1900 nach Monaten ==Lizenzhinweis== {| style="border:1px solid #8888aa; background-color:#f7f8ff;padding:5px;font-size:95%;" | Quelle: Rohde, R. (2024): Global Temperature Report for 2023, https://berkeleyearth.org/global-temperature-report-for-2023/ <br> Lizenz: CC BY-NC https://creativecommons.org/licenses/by-nc/4.0/ |} | 1 |
| 15:51, 20. Jan. 2025 | Temp 1950-2024 models obs.jpg (Datei) |  |
43 KB | 2 | |
| 18:07, 18. Jan. 2025 | 2024 OHC anomaly.jpg (Datei) |  |
52 KB | == Beschreibung == Erhöhung des Wärmegehalts der oberen 2000 m im Jahr 2024 gegenüber dem Mittel 1981-2010 in 109 Joule pro m2 ==Lizenzhinweis== {| style="border:1px solid #8888aa; background-color:#f7f8ff;padding:5px;font-size:95%;" | Quelle: Cheng, L., J. Abraham, K.E. Trenberth et al. (2025): [https://doi.org/10.1007/s00376-025-4541-3 Record High Temperatures in the Ocean in 2024], Advances in Atmospheric Sciences <br> Lizenz: [http://creativecommons.org/licenses/by/4.0/ CC BY] |} | 1 |
| 18:05, 18. Jan. 2025 | 2024 global SST anomaly.jpg (Datei) |  |
46 KB | == Beschreibung == Änderung der Meeresoberflächentemperatur 2024 gegenüber dem Mittel 1981-2010 in °C ==Lizenzhinweis== {| style="border:1px solid #8888aa; background-color:#f7f8ff;padding:5px;font-size:95%;" | Quelle: Cheng, L., J. Abraham, K.E. Trenberth et al. (2025): [https://doi.org/10.1007/s00376-025-4541-3 Record High Temperatures in the Ocean in 2024], Advances in Atmospheric Sciences <br> Lizenz: [http://creativecommons.org/licenses/by/4.0/ CC BY] |} | 1 |
| 18:00, 18. Jan. 2025 | SST global 1955-2024.jpg (Datei) |  |
61 KB | == Beschreibung == Die globale Meeresoberflächentemperatur (SST) von 1955 bis 2024 als monatliche Abweichung vom Mittel 1981-2010 ==Lizenzhinweis== {| style="border:1px solid #8888aa; background-color:#f7f8ff;padding:5px;font-size:95%;" | Quelle: Cheng, L., J. Abraham, K.E. Trenberth et al. (2025): Record High Temperatures in the Ocean in 2024, Advances in Atmospheric Sciences, https://doi.org/10.1007/s00376-025-4541-3 <br> Lizenz: [http://creativecommons.org/licenses/by/4.0/ CC BY] |} | 1 |
| 17:50, 18. Jan. 2025 | Global-SST-1981-2025.jpg (Datei) |  |
115 KB | == Beschreibung == Tageswerte der globalen Meeresoberflächentemperatur zwischen 60°S und 60°N 1981 bis Januar 2024 in °C. ==Lizenzhinweis== {| style="border:1px solid #8888aa; background-color:#f7f8ff;padding:5px;font-size:95%;" | Quelle: Climate Reanalyzer (2024): [https://climatereanalyzer.org/clim/sst_daily/ Daily Sea Surface Temperature] <br> Lizenz: [http://creativecommons.org/licenses/by/4.0/ CC BY] |} | 1 |
| 17:22, 18. Jan. 2025 | Land ocean temp1850-2024 BE.jpg (Datei) |  |
97 KB | == Beschreibung == Erwärmung über Land und Ozean 1850-2024. Temperaturabweichung vom vorindustriellen Mittel 1850-1900. == Lizenzhinweis == {| style="border:1px solid #8888aa; background-color:#f7f8ff;padding:5px;font-size:95%;" | Quelle: Rohde, R., Berkeley Earth (2025): Global Temperature Report for 2024, https://berkeleyearth.org/global-temperature-report-for-2024/ <br> Lizenz: [https://creativecommons.org/licenses/by-nc/4.0/ CC BY-NC] |} | 1 |
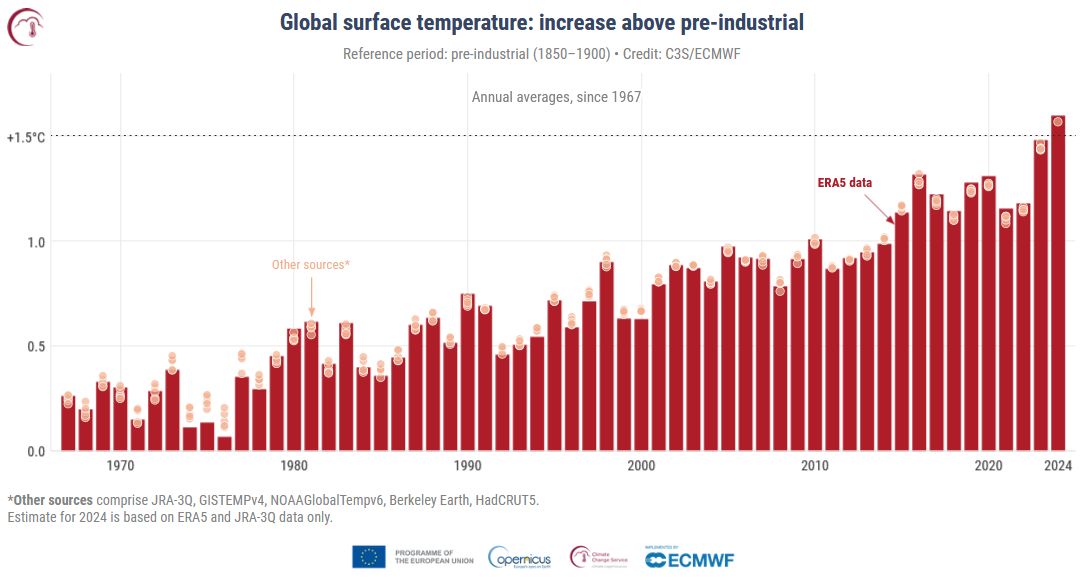
| 17:16, 18. Jan. 2025 | Global temp 1967-2024.jpg (Datei) |  |
69 KB | == Beschreibung == Globale Temperaturen 1967-2024 relativ zu 1850-1900 nach verschiedenen Datenreihen. Die orangenen Punkte geben die Werte anderer Datenquellen an. == Lizenzhinweis == {| style="border:1px solid #8888aa; background-color:#f7f8ff;padding:5px;font-size:95%;" | Quelle: Copernicus Climate Change Service (2025): Global Climate Highlights 2024, https://climate.copernicus.eu/global-climate-highlights-2024 Lizenz: Reproduction of the publicly available content of this website is a… | 1 |
| 12:30, 18. Jan. 2025 | ENSO globale Temperatur2024.jpg (Datei) |  |
93 KB | == Beschreibung == Änderung der Globalen Monatsmitteltemperaturen und El-Niño- (rot), La-Niña- (blau) und neutrale (grau) Jahre 1950-2024 ==Lizenzhinweis== {| style="border:1px solid #8888aa; background-color:#f7f8ff;padding:5px;font-size:95%;" | Quelle: NOAA National Centers for Environmental Information (2025): Global Climate Report 2024 https://www.ncei.noaa.gov/access/monitoring/monthly-report/global/202413 <br> Lizenz: public domain |} | 1 |
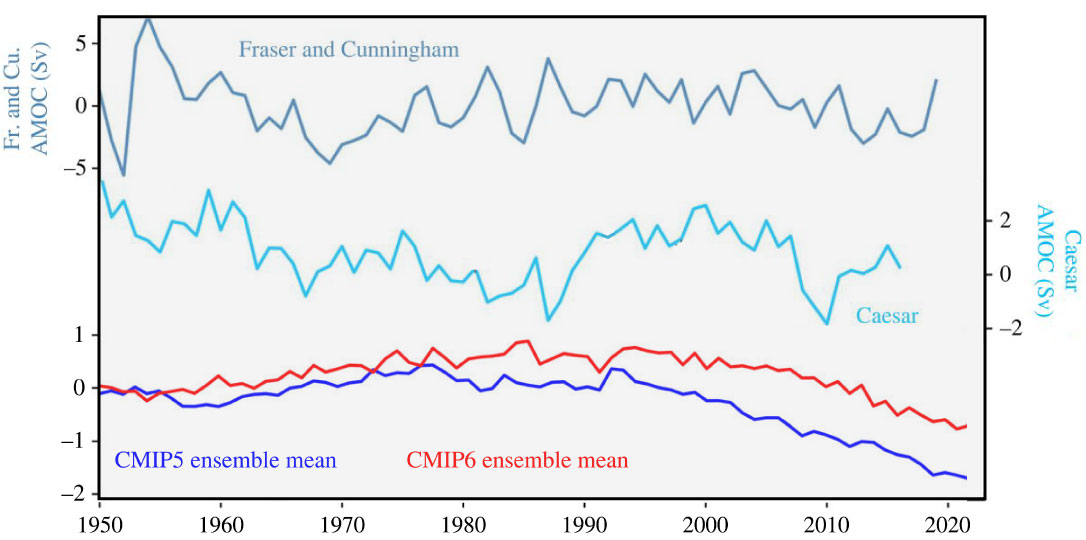
| 14:13, 12. Jan. 2025 | AMOC-1950-2020.jpg (Datei) |  |
75 KB | == Beschreibung == Änderungen der AMOC nach Beobachtungen und Modellsimulationen 1950 bis ca. 2020. Beobachtungsdaten nach Fraser and Cunningham et al. (2021) (blau) sowie Caesar (2018) (hellblau). Modellsimulationen nach CMIP5 (dunkelblau) und CMIP6 (rot), jeweils als Mittel mehrerer Modellrechnungen. ==Lizenzhinweis== {| style="border:1px solid #8888aa; background-color:#f7f8ff;padding:5px;font-size:95%;" | Quellen: Veränderte Darstellung nach: 1) McCarthy, G.D., L. Caesar (2023): Can we t… | 1 |
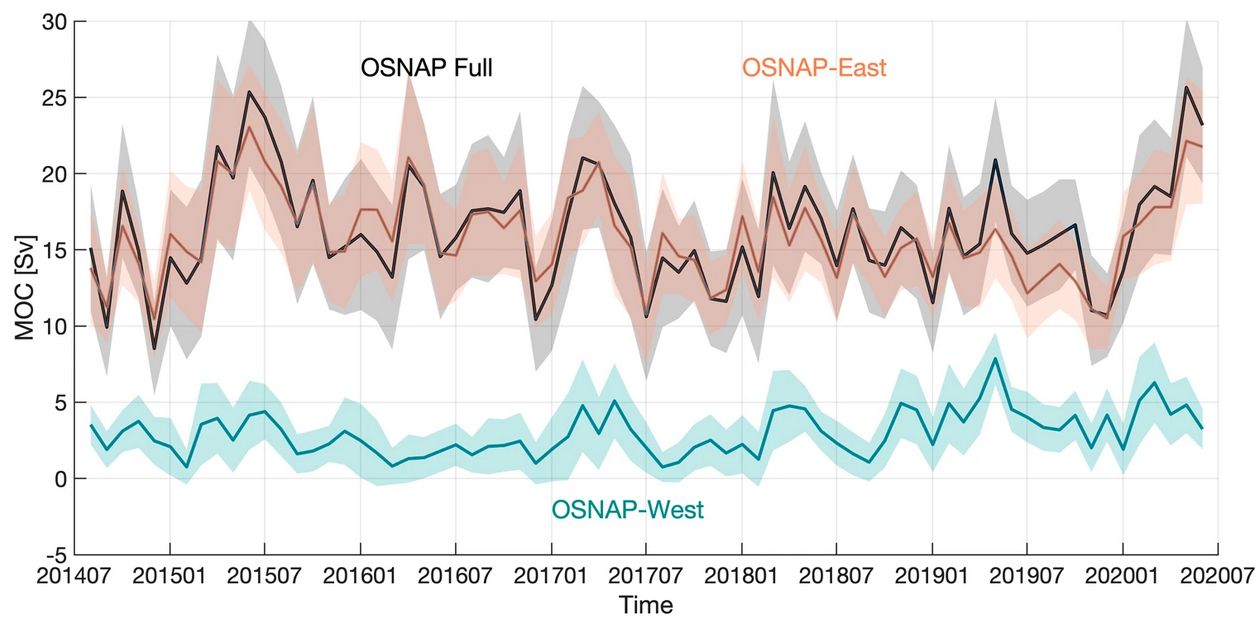
| 13:42, 12. Jan. 2025 | OSNAP circulation east west.jpg (Datei) |  |
90 KB | == Beschreibung == Zirkulation der subpolaren AMOC. Braun: östlicher subpolarer Nordatlantik, grün: westlicher Teil, grau: beide Regionen zusammen. Farbflächen: Unsicherheitsbereich. ==Lizenzhinweis== {| style="border:1px solid #8888aa; background-color:#f7f8ff;padding:5px;font-size:95%;" | Quelle: Fu, Y., M.S. Lozier, T.C. Biló et al. (2023): Seasonality of the Meridional Overturning Circulation in the subpolar North Atlantic. Commun Earth Environ 4, 181 (2023). https://doi.org/10.1038/s43247-… | 1 |
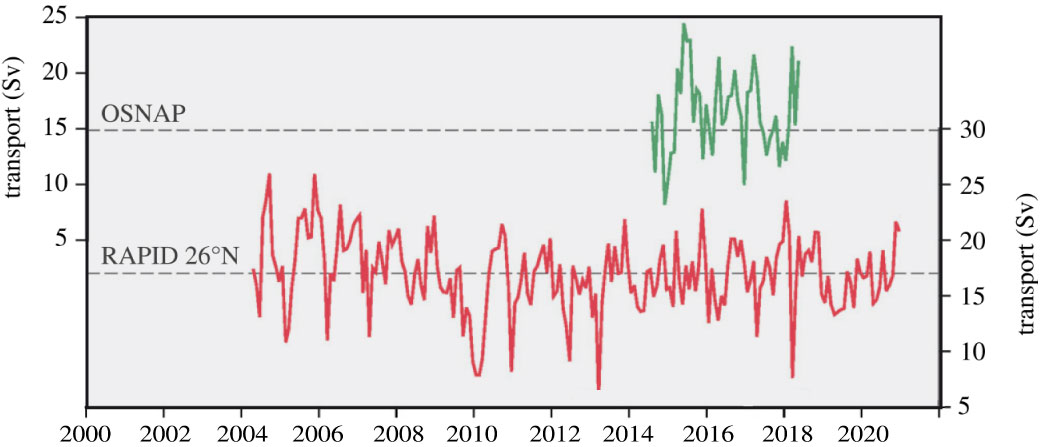
| 13:37, 12. Jan. 2025 | OSNAP RAPID.jpg (Datei) |  |
62 KB | == Beschreibung == Monatsdaten des Wassertransports der AMOC durch die Messprogramme RAPID (rot) und OSNAP bis 2018 (grün). ==Lizenzhinweis== {| style="border:1px solid #8888aa; background-color:#f7f8ff;padding:5px;font-size:95%;" | Quelle: Frajka-Williams, E., N. Foukal and G. Danabasoglu (2023): Should AMOC observations continue: how and why? Phil. Trans. R. Soc., https://doi.org/10.1098/rsta.2022.0195 <br> Lizenz: [http://creativecommons.org/licenses/by/4.0/ CC BY] |} | 1 |
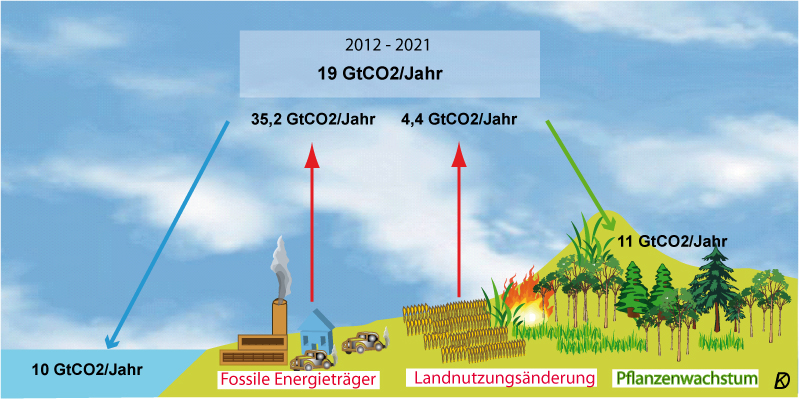
| 13:13, 12. Jan. 2025 | Austausch GtCO2 dt.jpg (Datei) |  |
270 KB | == Beschreibung == Änderung von anthropogenen Quellen und Senken von Kohlendioxid 2012-2021 ==Lizenzhinweis== {| style="border:1px solid #8888aa; background-color:#f7f8ff;padding:5px;font-size:95%;" | Quelle: eigene Darstellung, Daten nach Friedlingstein, P., M. O'Sullivan, M.W.Jones et al. (2022): [https://doi.org/10.5194/essd-14-4811-2022 Global Carbon Budget 2022], Earth Syst. Sci. Data, 14, 4811–4900<br> Lizenz: [https://creativecommons.org/licenses/by/4.0/ CC BY] |} | 1 |
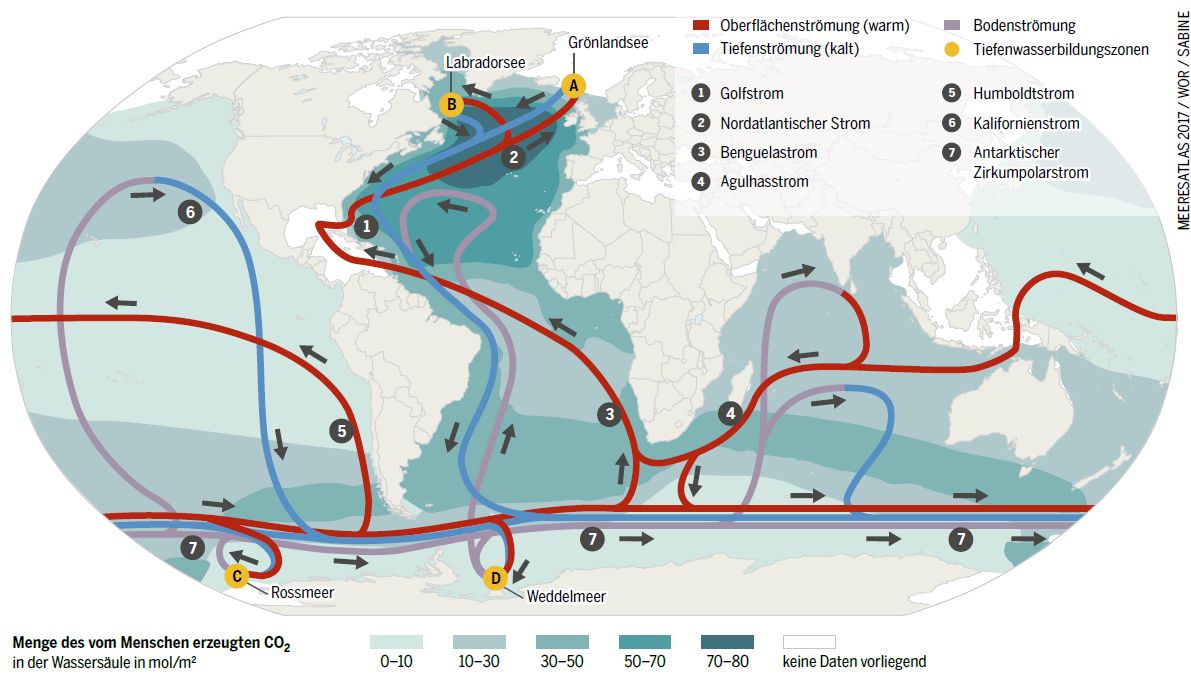
| 12:28, 12. Jan. 2025 | Meeresströmungen CO2.jpg (Datei) |  |
112 KB | == Beschreibung == Globales Förderband und CO2-Gehalt im Ozean == Lizenzhinweis == {| style="border:1px solid #8888aa; background-color:#f7f8ff;padding:5px;font-size:95%;" |Quelle: [https://meeresatlas.org/ Meeresatlas 2017]<br> Lizenz: [http://creativecommons.org/licenses/by/4.0/de/legalcode CC BY 4.0] | 1 |
| 12:20, 12. Jan. 2025 | Megacitys in Küstenzonen.png (Datei) |  |
286 KB | == Beschreibung == Risiken für Megacities in Küstenzonen == Lizenzhinweis == {| style="border:1px solid #8888aa; background-color:#f7f8ff;padding:5px;font-size:95%;" |Quelle: Meeresatlas 2017, https://meeresatlas.org/ <br> Lizenz: [http://creativecommons.org/licenses/by/4.0/de/legalcode CC BY 4.0] | 1 |
| 14:11, 10. Jan. 2025 | Global-temp-1940-2025.jpg (Datei) |  |
118 KB | 2 | |
| 19:16, 9. Jan. 2025 | AMOC flow N-S salt.jpg (Datei) | 64 KB | == Beschreibung == Meridionale Zirkulation im Atlantik, mit Fließrichtungen und Salzgehalt; links: Verlauf des vertikalen Profils. ==Lizenzhinweis== {| style="border:1px solid #8888aa; background-color:#f7f8ff;padding:5px;font-size:95%;" | Quelle: Frajka-Williams, E., N. Foukal and G. Danabasoglu (2023): Should AMOC observations continue: how and why? Phil. Trans. R. Soc., https://doi.org/10.1098/rsta.2022.0195 <br> Lizenz: [http://creativecommons.org/licenses/by/4.0/ CC BY] |} | 1 | |
| 18:51, 9. Jan. 2025 | AMOC currents N-Atlantic.jpg (Datei) |  |
68 KB | Die wichtigsten Absinkregionen im Nordatlantik-Becken, in denen Tiefenwasser gebildet wird. OSNAP West/East (Overturning in the Subpolar North Atlantic Program): Messprogramm im Nordatlantik. ==Lizenzhinweis== {| style="border:1px solid #8888aa; background-color:#f7f8ff;padding:5px;font-size:95%;" | Quelle: Chafik, L., Holliday, N. P., Bacon, S., & Rossby, T. (2022). Irminger sea is the Center of action for subpolar AMOC variability. Geophysical Research Letters, 49(17), e2022GL099133. https:/… | 1 |