Von Dieter Kasang hochgeladene Dateien
Aus Klimawandel
Diese Spezialseite listet alle hochgeladenen Dateien auf.
| Datum | Name | Vorschaubild | Größe | Beschreibung | Versionen |
|---|---|---|---|---|---|
| 13:16, 24. Feb. 2024 | Saffir-Simpson1-6.jpg (Datei) | 21 KB | 2 | ||
| 09:18, 24. Feb. 2024 | WN-Pacific N-Atlantic-TC.jpg (Datei) |  |
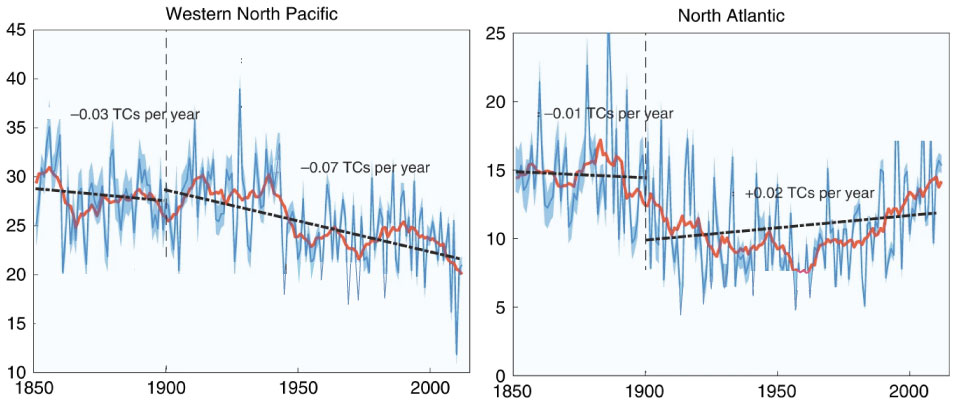
66 KB | == Beschreibung == Langfristige Trends Tropischer Wirbelstürme pro Jahr im westlichen Nordpazifik und Nordatlantik für die vorindustrielle Periode (1850-1900) und das 20. Jahrhundert (1900-2012) nach Daten und Modellexperimenten. Blau: Jahreswerte, rot: 5-Jahresmittel, gestrichelt: Trends. ==Lizenzhinweis== {| style="border:1px solid #8888aa; background-color:#f7f8ff;padding:5px;font-size:95%;" | Quelle: Chand, S.S., K.J.E. Walsh, S.J. Camargo et al. (2022): [https://doi.org/10.1038/s41558-022-… | 1 |
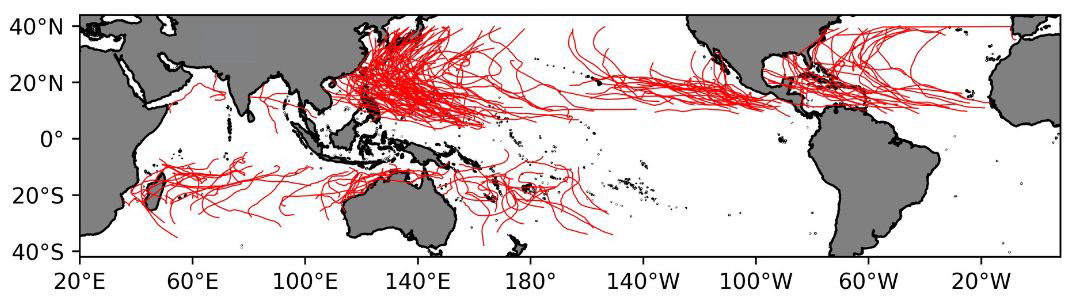
| 19:27, 23. Feb. 2024 | Global RI TC tracks 2000-2020.jpg (Datei) |  |
92 KB | 2 | |
| 08:53, 23. Feb. 2024 | Cat4-5 TCs 1990-2021.jpg (Datei) |  |
72 KB | == Beschreibung == Die globale Anzahl der Tropischen Wirbelstürme der Kategorie 4-5 (links) und der Anteil an allen Tropischen Wirbelstürmen ab Kategorie 1 (rechts) ==Lizenzhinweis== {| style="border:1px solid #8888aa; background-color:#f7f8ff;padding:5px;font-size:95%;" | Quelle: Klotzbach, P. J., K.M. Wood, C.J. Schreck III et al. (2022): Trends in global tropical cyclone activity: 1990–2021. Geophys. Res. Lett., 49, e2021GL095774, https://doi.org/10.1029/2021GL095774 <br> Lizenz: CC BY-NC-N… | 1 |
| 13:24, 22. Feb. 2024 | Global-TC-numbers.jpg (Datei) |  |
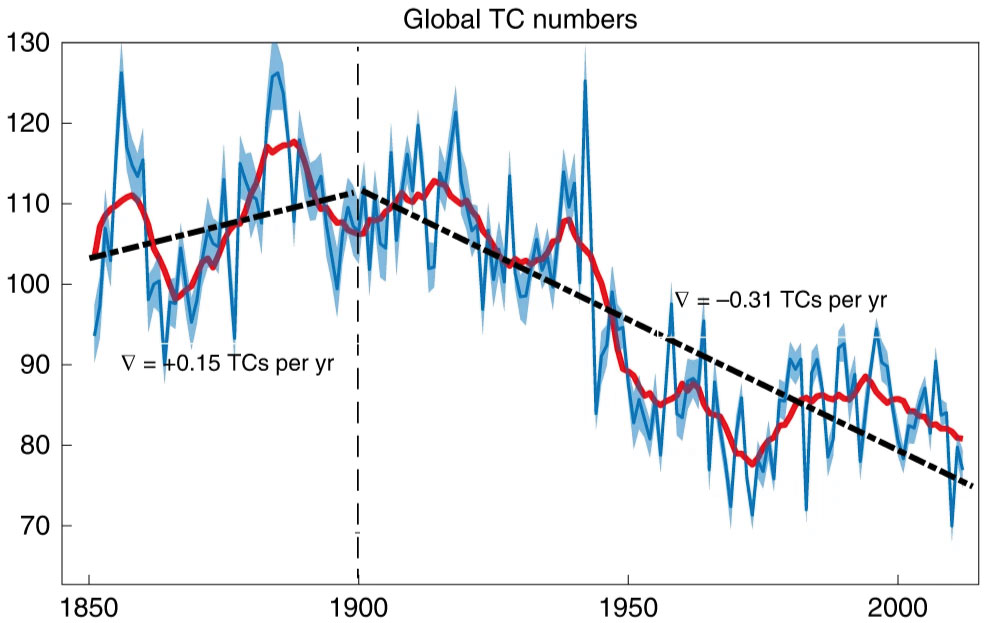
83 KB | == Beschreibung == Langfristige Trends globaler Tropischer Wirbelstürme pro Jahr für die vorindustrielle Periode (1850-1900) und das 20. Jahrhundert (1900-2012) nach Daten und Modellexperimenten. Blau: Jahreswerte, rot: 5-Jahresmittel, gestrichelt: Trends. ==Lizenzhinweis== {| style="border:1px solid #8888aa; background-color:#f7f8ff;padding:5px;font-size:95%;" | Quelle: Chand, S.S., K.J.E. Walsh, S.J. Camargo et al. (2022): Declining tropical cyclone frequency under global warming. Nat. Clim.… | 1 |
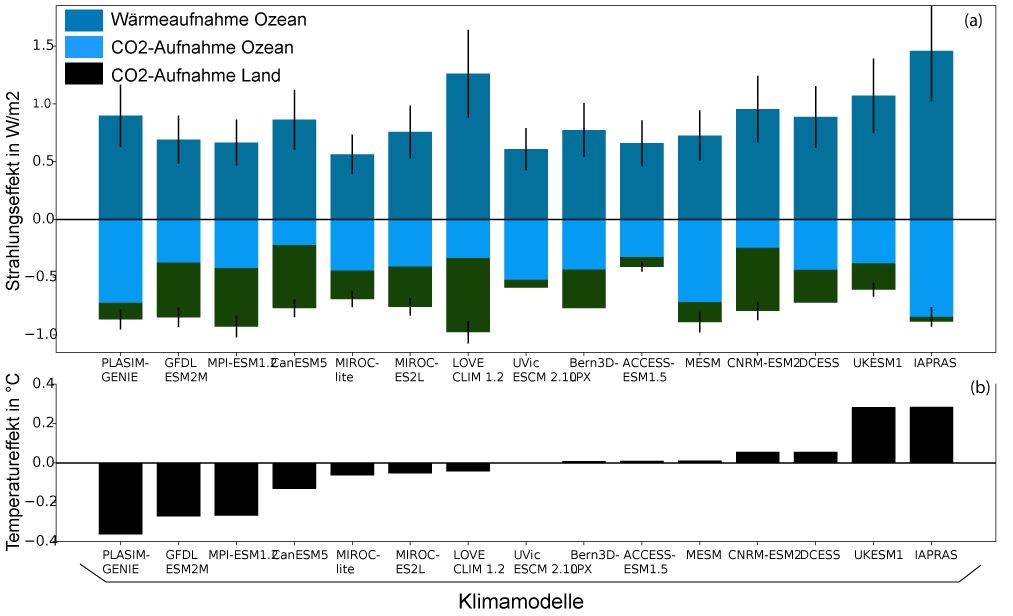
| 19:16, 15. Feb. 2024 | CO2-Ozean-Veg-Strahlung.jpg (Datei) |  |
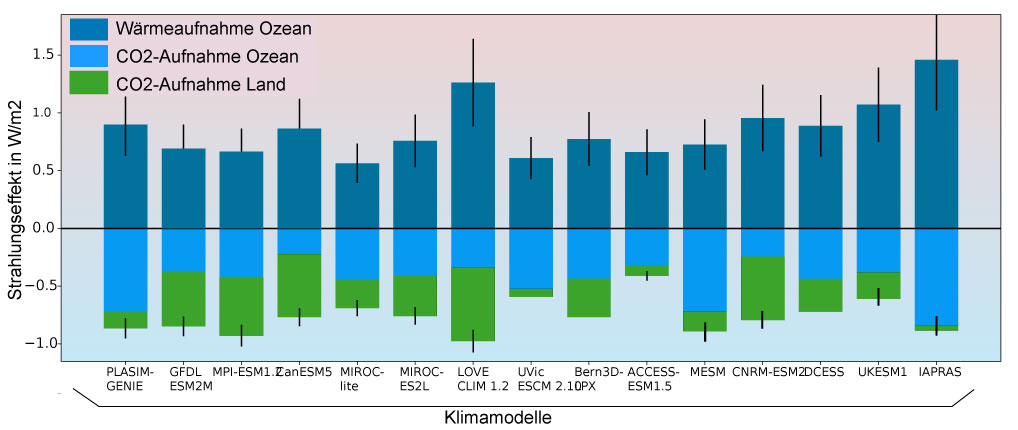
62 KB | == Beschreibung == 50 Jahre nach Netto-Null-Emissionen: Strahlungseffekt in der Atmosphäre durch Abschwächung der ozeanischen Wärmeaufnahme und CO<sub>2</sub>-Aufnahme durch Ozean und Landvegetation (oben), Temperatureffekt beider Prozesse (unten). ==Lizenzhinweis== {| style="border:1px solid #8888aa; background-color:#f7f8ff;padding:5px;font-size:95%;" | Quelle: MacDougall, A.H. et al., 2020: [https://bg.copernicus.org/articles/17/2987/2020/ Is there warming in the pipeline? A multi-model anal… | 1 |
| 14:40, 29. Jan. 2024 | Artic C-Cycle cc.jpg (Datei) |  |
113 KB | Auswirkungen des Klimawandels auf den Kohlenstoffzyklus in der Arktis ==Lizenzhinweis== {| style="border:1px solid #8888aa; background-color:#f7f8ff;padding:5px;font-size:95%;" | Quelle: Bruhwiler, L., Parmentier, FJ.W., Crill, P. et al. (2021): The Arctic Carbon Cycle and Its Response to Changing Climate. Curr Clim Change Rep 7, 14–34, https://doi.org/10.1007/s40641-020-00169-5<br> Lizenz: CC BY http://creativecommons.org/licenses/by/4.0/ |} | 1 |
| 20:30, 28. Jan. 2024 | Methan bomb Yamal.jpg (Datei) |  |
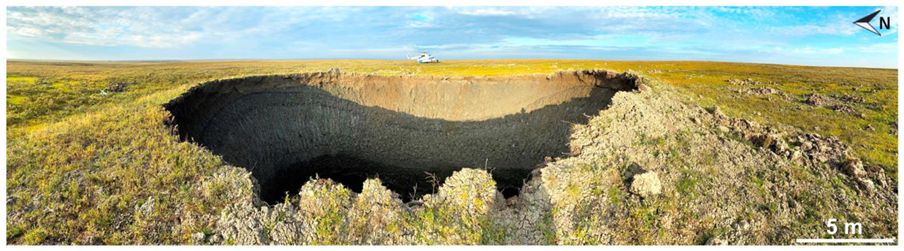
66 KB | == Beschreibung == Krater der „Methan-Bombe“ auf der sibirischen Halbinsel Yamal, 26.8.2022 ==Lizenzhinweis== {| style="border:1px solid #8888aa; background-color:#f7f8ff;padding:5px;font-size:95%;" | Quelle: Bogoyavlensky, V., I. Bogoyavlensky, R. Nikonov et al. (2020): New Catastrophic Gas Blowout and Giant Crater on the Yamal Peninsula in 2020: Results of the Expedition and Data Processing, Geosciences 2021, 11, 71, https://doi.org/10.3390/geosciences11020071 <br /> Lizenz: CC BY https://cre… | 1 |
| 20:10, 28. Jan. 2024 | Permafrost landscape sm.jpg (Datei) |  |
274 KB | == Beschreibung == Permafrostlandschaft mit wichtigen Komponenten (Temerpatur, Eis und Kohlenstoff) und Prozessen (Auftauen von Eis, Abfluss, Seenbildung, Hangrutschungen, Feuer) ==Lizenzhinweis== {| style="border:1px solid #8888aa; background-color:#f7f8ff;padding:5px;font-size:95%;" | Quelle: Schuur, E.A.G., B.W. Abbott, R. Commane et al. (2022): Permafrost and Climate Change: Carbon Cycle Feedbacks From the Warming Arctic. Annual Review of Environment and Resources, 47(1), 343–371. https://d… | 1 |
| 20:08, 28. Jan. 2024 | Permafrost landscape.jpeg (Datei) |  |
1,4 MB | == Beschreibung == Permafrostlandschaft mit wichtigen Komponenten (Temerpatur, Eis und Kohlenstoff) und Prozessen (Auftauen von Eis, Abfluss, Seenbildung, Hangrutschungen, Feuer) ==Lizenzhinweis== {| style="border:1px solid #8888aa; background-color:#f7f8ff;padding:5px;font-size:95%;" | Quelle: Schuur, E.A.G., B.W. Abbott, R. Commane et al. (2022): Permafrost and Climate Change: Carbon Cycle Feedbacks From the Warming Arctic. Annual Review of Environment and Resources, 47(1), 343–371. https://d… | 1 |
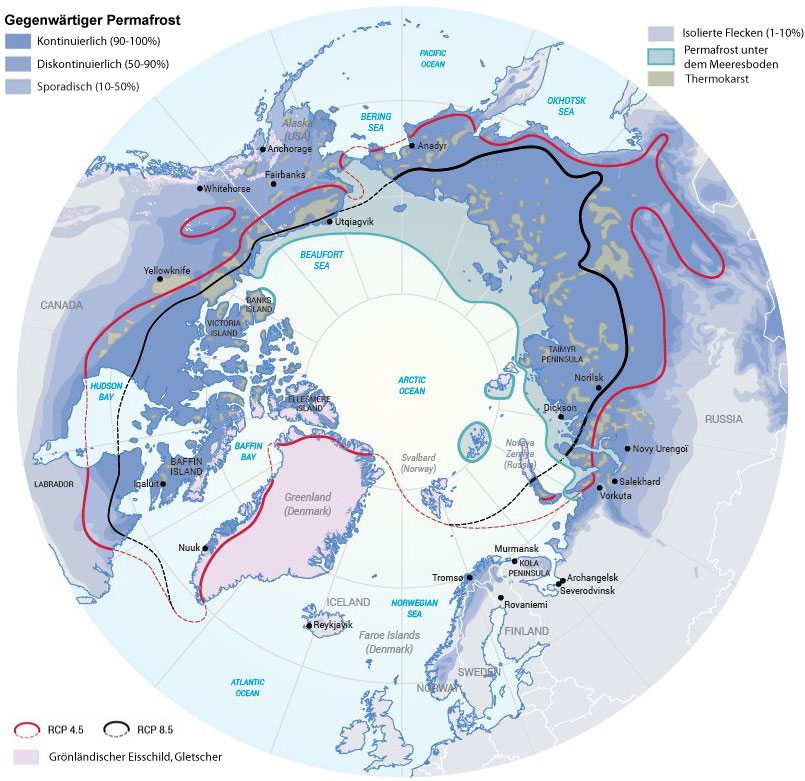
| 18:49, 28. Jan. 2024 | Permafrost gegenwart 2100.jpg (Datei) |  |
145 KB | == Beschreibung == Verbreitung von Permafrost in der Arktis gegenwärtig und 2100 ==Lizenzhinweis== {| style="border:1px solid #8888aa; background-color:#f7f8ff;padding:5px;font-size:95%;" | Quelle: Flickr (2019): [https://www.flickr.com/photos/gridarendal/47957303822/ Thawing Permafrost], übersetzt, verändert<br /> Lizenz: [https://creativecommons.org/licenses/by-nc-sa/2.0/ CC BY-NC-SA] |} | 1 |
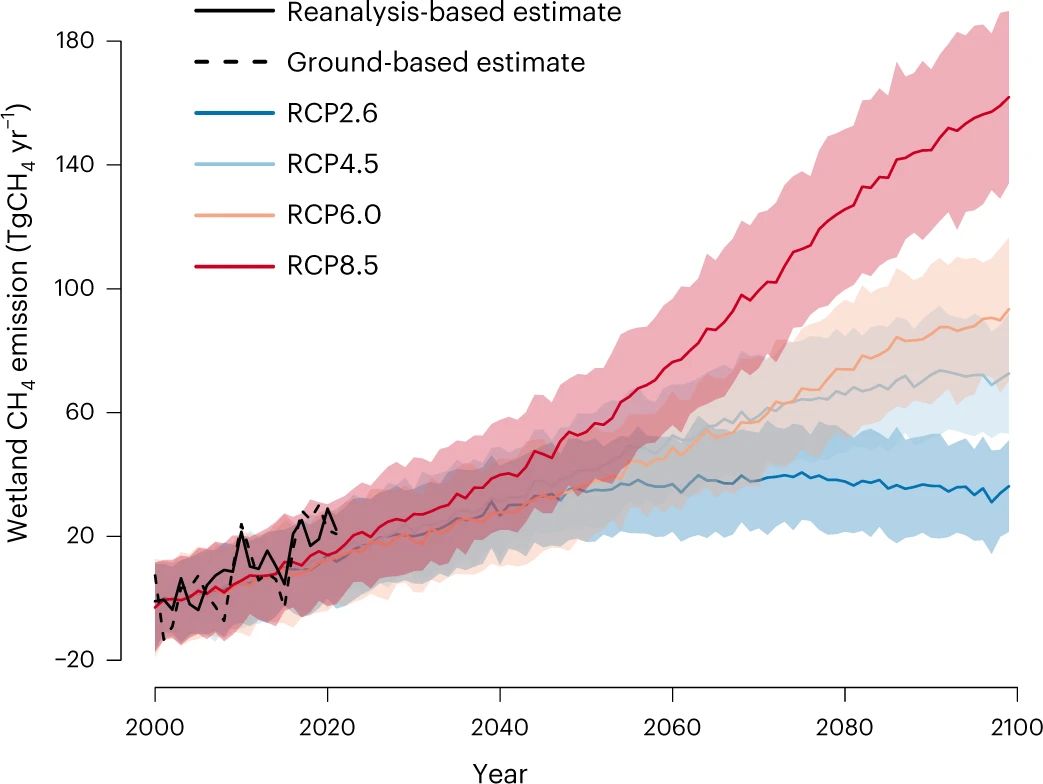
| 13:39, 22. Jan. 2024 | Wetland CH4-emissions2100.jpg (Datei) |  |
63 KB | == Beschreibung == Methanemissionen aus Feuchtgebieten 2000-2100 ==Lizenzhinweis== {| style="border:1px solid #8888aa; background-color:#f7f8ff;padding:5px;font-size:95%;" | Quelle: Zhang, Z., Poulter, B., Feldman, A.F. et al. (2023): Recent intensification of wetland methane feedback. Nat. Clim. Chang. 13, 430–433 (2023). https://doi.org/10.1038/s41558-023-01629-0<br> Lizenz: CC BY http://creativecommons.org/licenses/by/4.0/ |} | 1 |
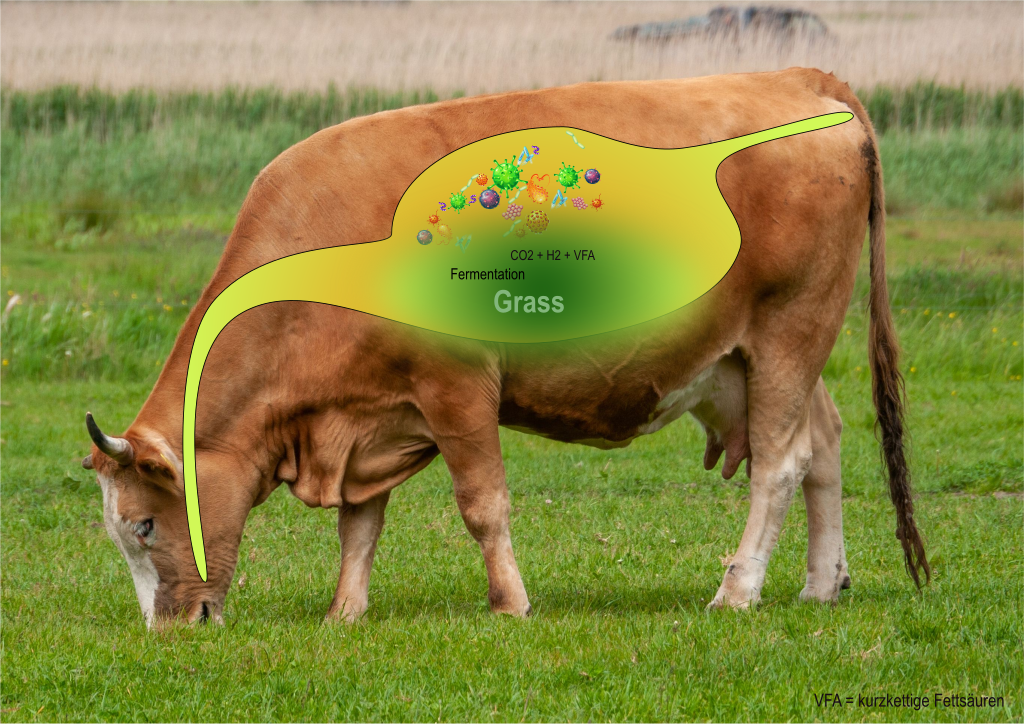
| 19:54, 21. Jan. 2024 | Methan-kuhmagen.png (Datei) |  |
1,28 MB | == Beschreibung == Entstehung von Methan im Kuhmagen. Das Futter wird durch Fermentation zerlegt, dabei entstehen CO2, H2 und Fettsäuren. Diese werden durch Methanogene (Methan bildende Mikroorganismen) umgewandelt in Methan (CH4) und Wasser. ==Lizenzhinweis== {| style="border:1px solid #8888aa; background-color:#f7f8ff;padding:5px;font-size:95%;" | Quelle: Wikimedia Commons (2023): Methanentstehung im Kuhmagen, https://commons.wikimedia.org/wiki/File:Methan-kuhmagen_hg.svg<br> Lizenz: CC BY-SA… | 1 |
| 19:52, 21. Jan. 2024 | Rice paddies.jpg (Datei) |  |
31 KB | == Beschreibung == Reisfelder als Methanquelle ==Lizenzhinweis== {| style="border:1px solid #8888aa; background-color:#f7f8ff;padding:5px;font-size:95%;" | Quelle: : Cavicchioli R., Ripple W. J., Timmis K. N., Azam F., Bakken L. R., Baylis M., et al. (2019). Scientists’ warning to humanity: microorganisms and climate change. Nat. Rev. Microbiol. 17 569–586. 10.1038/s41579-019-0222-5<br> Lizenz: CC BY http://creativecommons.org/licenses/by/4.0/ |} | 1 |
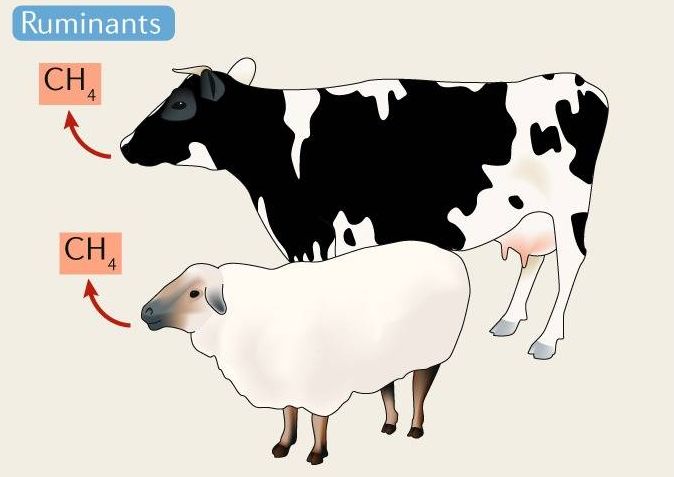
| 19:51, 21. Jan. 2024 | Ruminants methane source.jpg (Datei) |  |
31 KB | == Beschreibung == Wiederkäuer als Methanquelle ==Lizenzhinweis== {| style="border:1px solid #8888aa; background-color:#f7f8ff;padding:5px;font-size:95%;" | Quelle: : Cavicchioli R., Ripple W. J., Timmis K. N., Azam F., Bakken L. R., Baylis M., et al. (2019). Scientists’ warning to humanity: microorganisms and climate change. Nat. Rev. Microbiol. 17 569–586. 10.1038/s41579-019-0222-5<br> Lizenz: CC BY http://creativecommons.org/licenses/by/4.0/ |} | 1 |
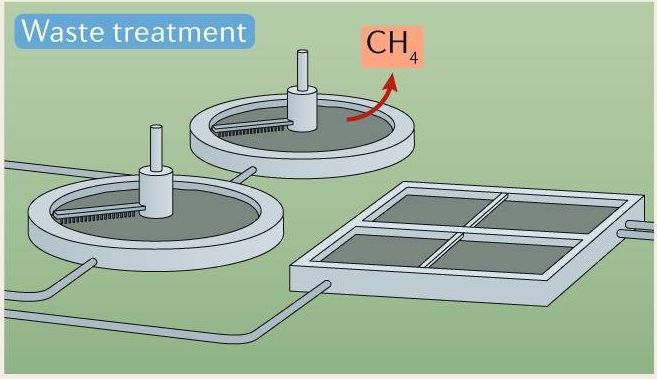
| 19:50, 21. Jan. 2024 | Waste treatment.jpg (Datei) |  |
36 KB | == Beschreibung == Abfallbehandlung als Methan-Quelle ==Lizenzhinweis== {| style="border:1px solid #8888aa; background-color:#f7f8ff;padding:5px;font-size:95%;" | Quelle: : Cavicchioli R., Ripple W. J., Timmis K. N., Azam F., Bakken L. R., Baylis M., et al. (2019). Scientists’ warning to humanity: microorganisms and climate change. Nat. Rev. Microbiol. 17 569–586. 10.1038/s41579-019-0222-5<br> Lizenz: CC BY http://creativecommons.org/licenses/by/4.0/ |} | 1 |
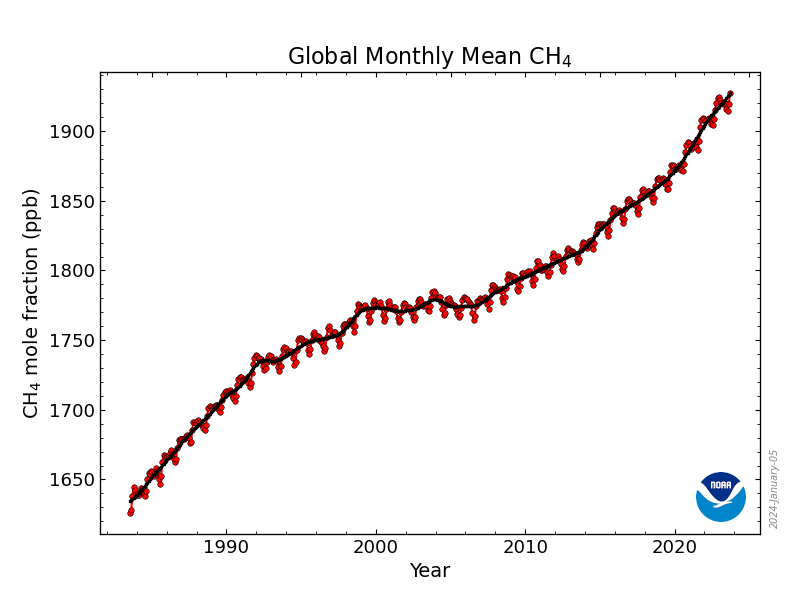
| 19:29, 21. Jan. 2024 | Ch4 trend 1983-2022.png (Datei) |  |
57 KB | == Beschreibung == Globale monatliche Methan-Konzentration 1983-2022 ==Lizenzhinweis== {| style="border:1px solid #8888aa; background-color:#f7f8ff;padding:5px;font-size:95%;" | Quelle: Earth System Research Laboratory (NOAA): Trends in Atmospheric Methane, https://gml.noaa.gov/ccgg/trends_ch4/<br> Lizenz: public domain |} | 1 |
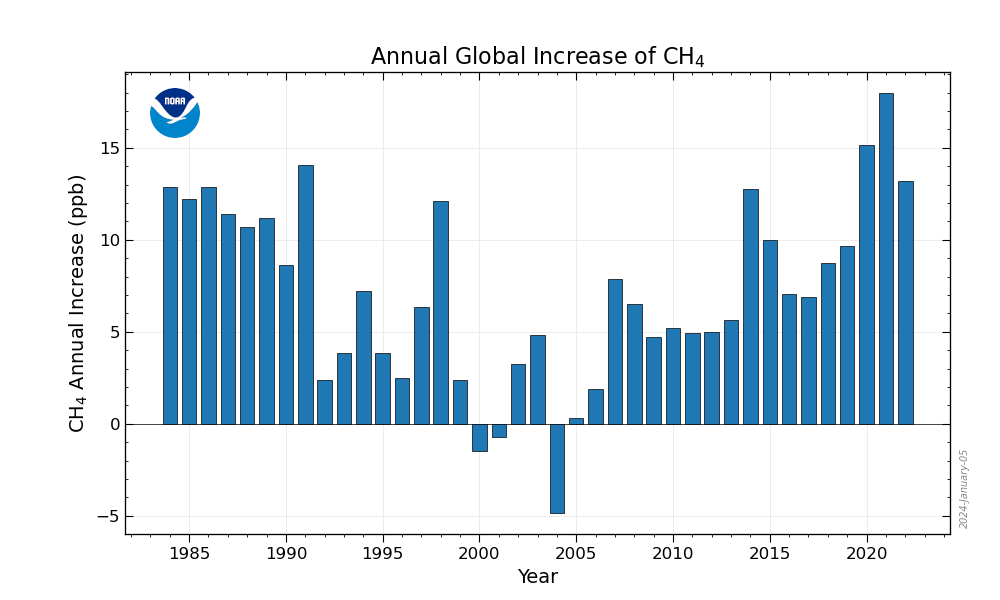
| 19:18, 21. Jan. 2024 | CH4 annual increase.png (Datei) |  |
29 KB | == Beschreibung == Jährliche Wachstumsrate der Methankonzentration 1984-2022 in ppb/Jahr ==Lizenzhinweis== {| style="border:1px solid #8888aa; background-color:#f7f8ff;padding:5px;font-size:95%;" | Quelle: NOAA Global Monitoring Laboratory (2021): Trends in Atmosperic Methane, https://gml.noaa.gov/ccgg/figures/<br> Lizenz: public domain |} | 1 |
| 15:32, 15. Jan. 2024 | ENSO global temp 1950-2023.png (Datei) |  |
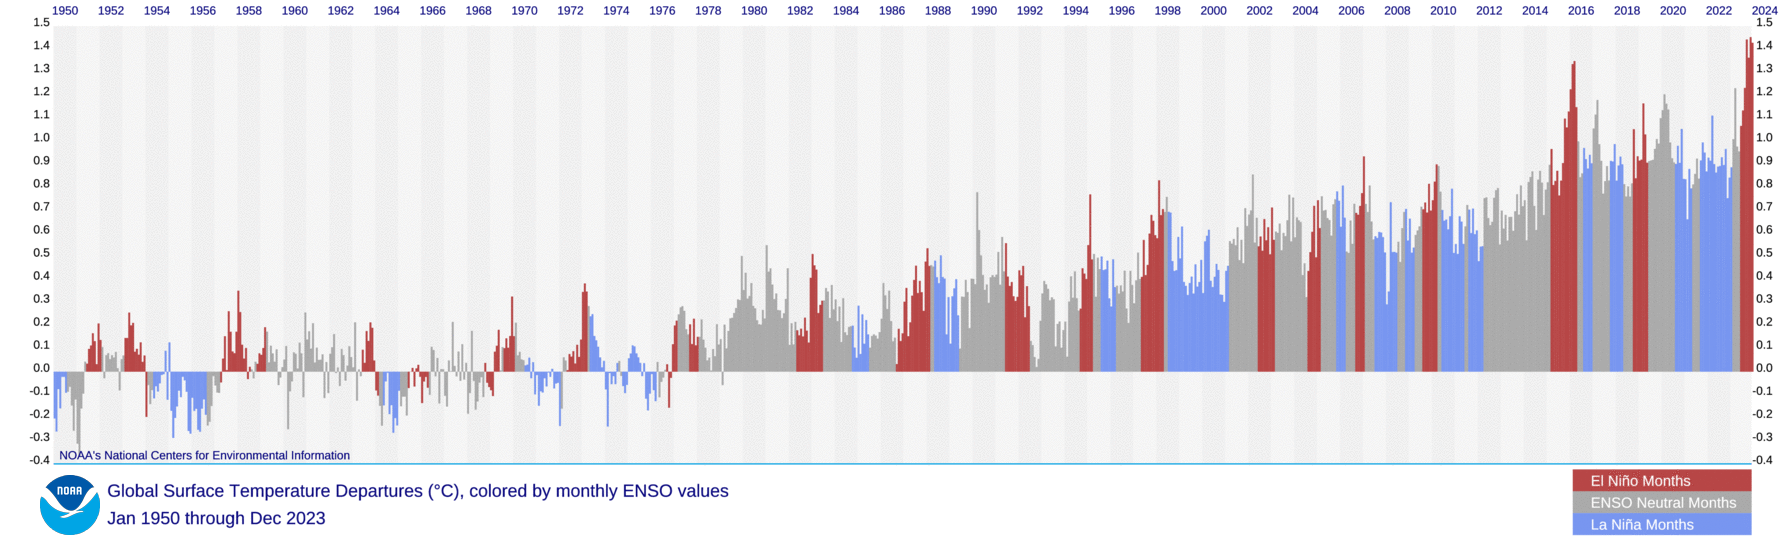
564 KB | == Beschreibung == Globale Temperaturen und ENSO. Globale Monatsmitteltemperaturen und El-Niño- und La-Niña-Jahre 1950-2023 ==Lizenzhinweis== {| style="border:1px solid #8888aa; background-color:#f7f8ff;padding:5px;font-size:95%;" | Quelle: NOAA National Centers for Environmental Information, State of the Climate: Global Climate Report - Annual 2022 (2023): [https://www.ncei.noaa.gov/access/monitoring/monthly-report/global/202213/supplemental/page-2 Monthly temperature anomalies versus El Niño]… | 1 |
| 16:58, 14. Jan. 2024 | OHC 2023 relativ to 1981-2010.jpg (Datei) |  |
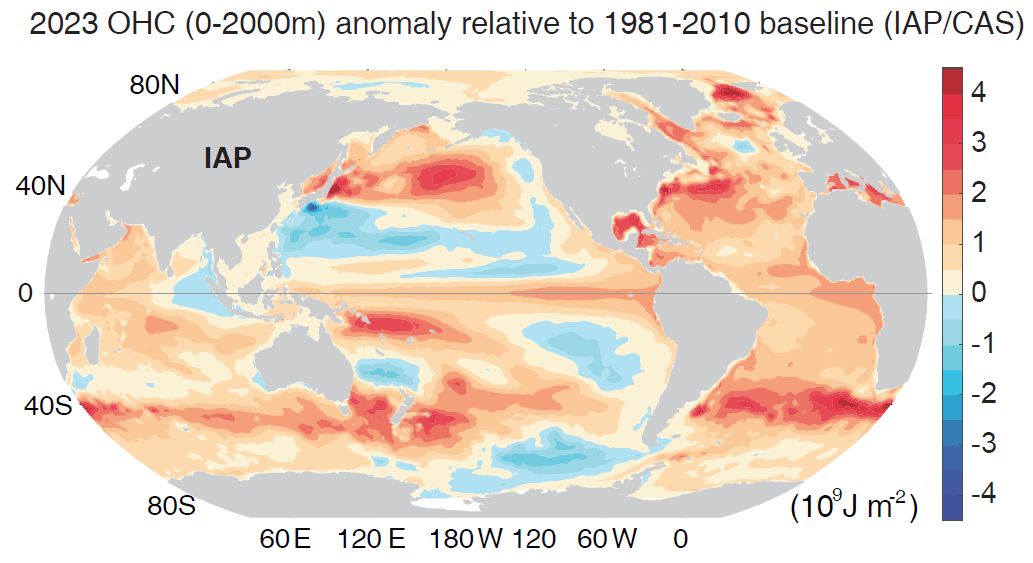
79 KB | == Beschreibung == Ozeanischer Wärmegehalt in 0-2000 m Tiefe 2023 relativ zum Mittel 1981-2010 in 109 Joule pro m2 == Lizenzhinweis == {| style="border:1px solid #8888aa; background-color:#f7f8ff;padding:5px;font-size:95%;" | Quelle: Cheng, L., J. Abraham, K.E. Trenberth et al. (2024): New Record Ocean Temperatures and Related Climate Indicators in 2023, Advances in Atmospheric Siences, https://doi.org/10.1007/s00376-024-3378-5 <br> Lizenz: CC BY http://creativecommons.org/licenses/by/4.0/ |} | 1 |
| 16:06, 14. Jan. 2024 | Land Ocean temp1850-2023.jpg (Datei) |  |
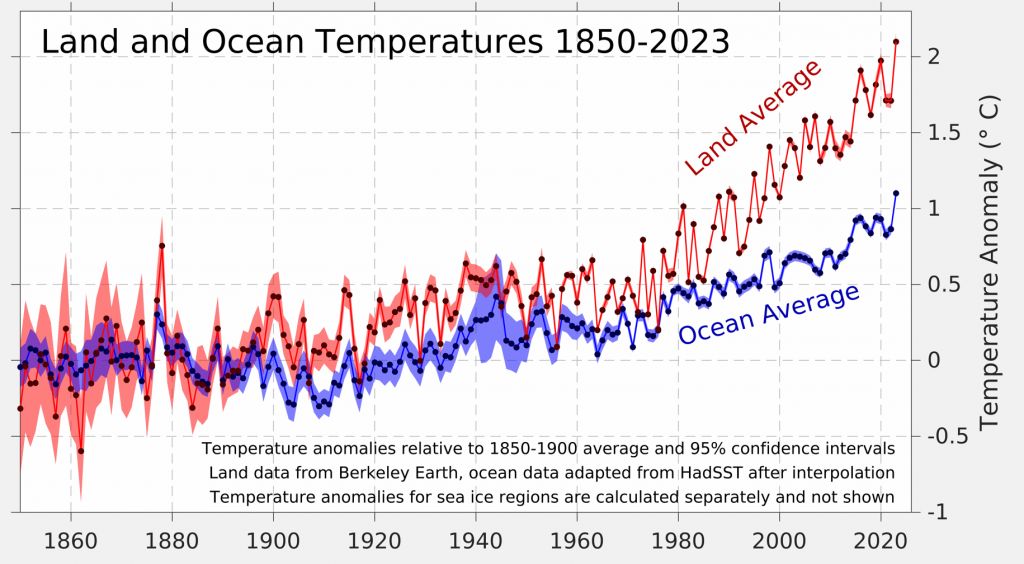
97 KB | == Beschreibung == Globale Jahresmitteltemperatur auf dem Land und Ozean 1850-2023, relativ zum Mittel 1850-1900. == Lizenzhinweis == {| style="border:1px solid #8888aa; background-color:#f7f8ff;padding:5px;font-size:95%;" | Quelle: Rohde, R., Berkeley Earth (2024): Global Temperature Report for 2023, https://berkeleyearth.org/global-temperature-report-for-2023/ <br> Lizenz: CC BY-NC https://creativecommons.org/licenses/by-nc/4.0/ |} | 1 |
| 15:53, 14. Jan. 2024 | Daily Temperature 2023.jpg (Datei) |  |
111 KB | == Beschreibung == Zunahme der Tagesmitteltemperaturen des Jahres 2023 im Vergleich zur vorindustriellen Periode 1850-1900 == Lizenzhinweis == {| style="border:1px solid #8888aa; background-color:#f7f8ff;padding:5px;font-size:95%;" | Quelle: Copernicus Climate Change Service (2024): Global Climate Highlights 2023<br> Lizenz: Reproduction of the publicly available content of this website is authorised, provided the source is acknowledged, save where otherwise stated. https://climate.copernicus.e… | 1 |
| 15:38, 14. Jan. 2024 | Globale temp1850-2023.jpg (Datei) |  |
92 KB | == Beschreibung == Globale Jahresmitteltemperatur 1850-2023, relativ zum Mittel 1850-1900 (vorindustriell). Vertikale Linien zeigen Unsicherheitsbereiche an. == Lizenzhinweis == {| style="border:1px solid #8888aa; background-color:#f7f8ff;padding:5px;font-size:95%;" | Quelle: Rohde, R. (2024): Global Temperature Report for 2023, https://berkeleyearth.org/global-temperature-report-for-2023/<br> Lizenz: CC BY-NC https://creativecommons.org/licenses/by-nc/4.0/ |} | 1 |
| 13:20, 11. Jan. 2024 | N-Atlantic SST June 2023.jpg (Datei) |  |
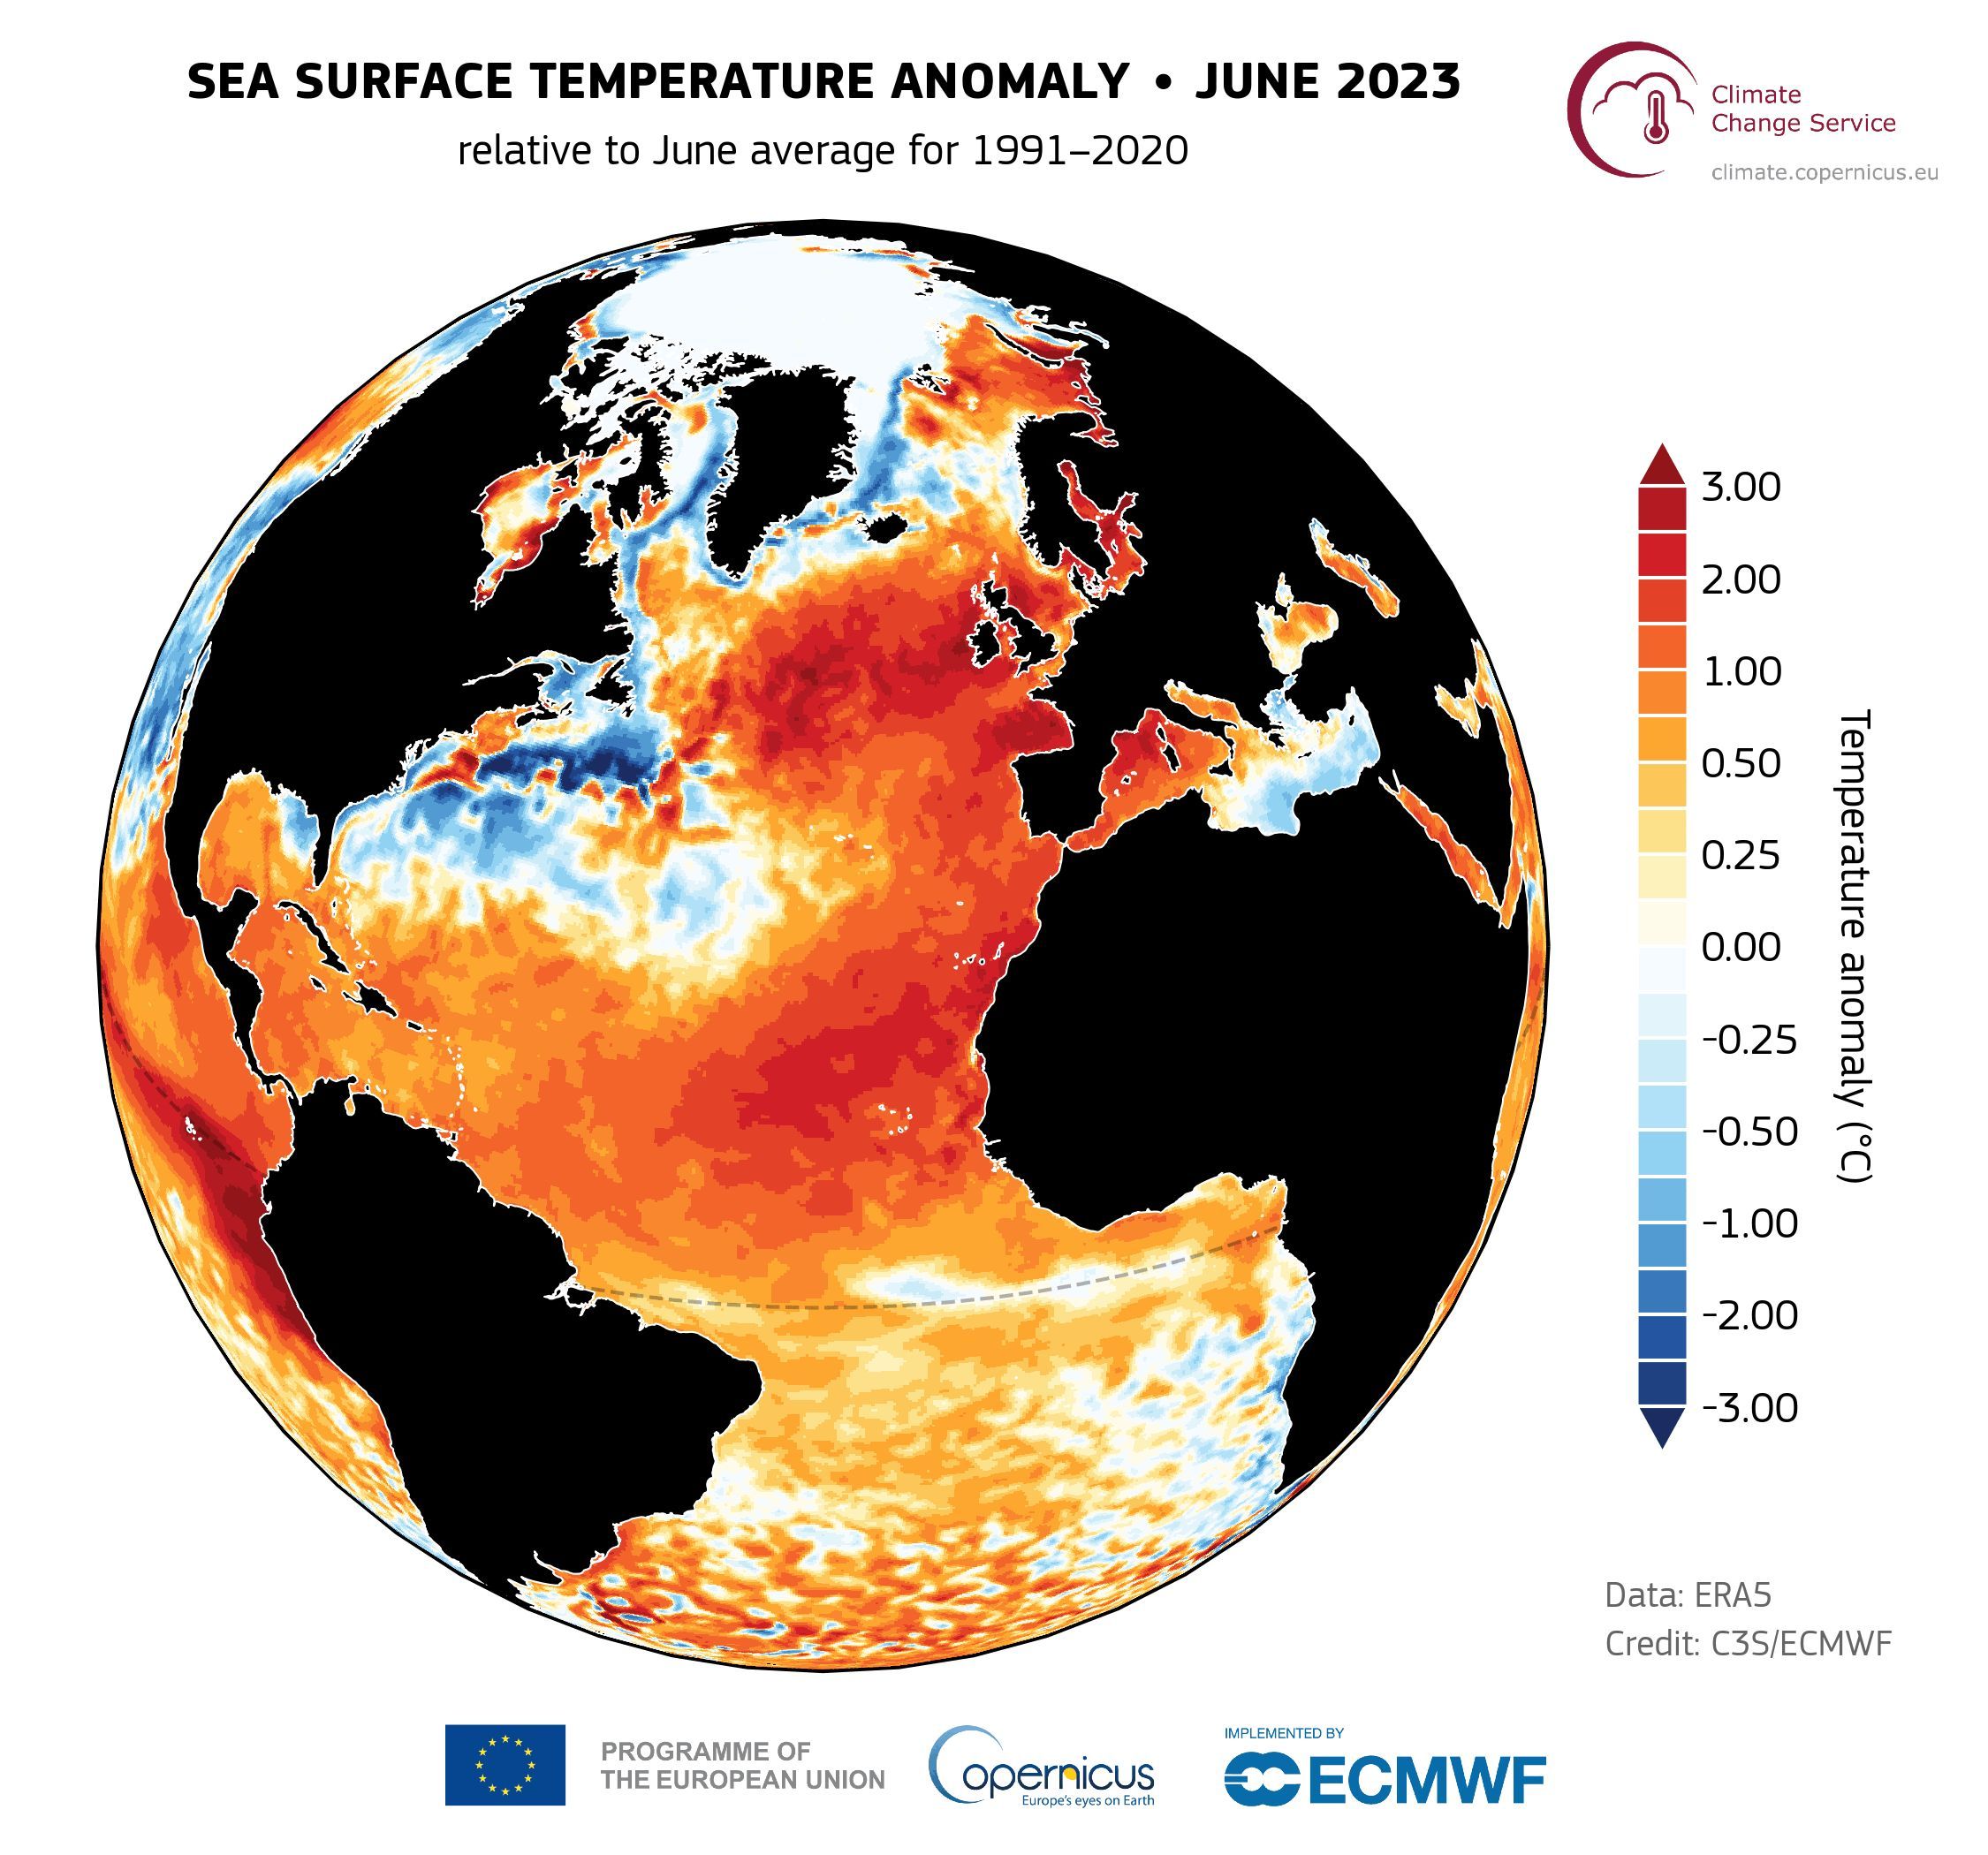
479 KB | == Beschreibung == Meeresoberflächentemperatur im Nordatlantik im Juni 2023, Abweichung vom Juni-Mittel1991-2020 ==Lizenzhinweis== {| style="border:1px solid #8888aa; background-color:#f7f8ff;padding:5px;font-size:95%;" | Quelle: Copernicus Climate Change Service (2023): Record-breaking North Atlantic Ocean temperatures contribute to extreme marine heatwaves, https://climate.copernicus.eu/record-breaking-north-atlantic-ocean-temperatures-contribute-extreme-marine-heatwaves <br> Lizenz: Credit:… | 1 |
| 16:39, 22. Dez. 2023 | Treibhausgase aktuell.jpg (Datei) |  |
50 KB | == Beschreibung == Die atmosphärische Konzentration wichtiger langlebiger Treibhausgase in den letzten ca. 2000 Jahren. ==Lizenzhinweis== {| style="border:1px solid #8888aa; background-color:#f7f8ff;padding:5px;font-size:95%;" | Eigene Darstellung nach IPCC (2007): Climate Change 2007, Working Group I: The Science of Climate Change, FAQ 2.1, Figure 1; ergänzt durch Forster, P. M., C.J. Smith, T. Walsh et al. (2023): [https://essd.copernicus.org/articles/15/2295/2023/ Indicators of Global Climat… | 1 |
| 17:27, 19. Dez. 2023 | Trockenes Flusstal.jpg (Datei) |  |
148 KB | == Beschreibung == Trockenes Flusstal (Ort unbekannt) ==Lizenzhinweis== {| style="border:1px solid #8888aa; background-color:#f7f8ff;padding:5px;font-size:95%;" | Quelle: Office for Climate Education (2021): [https://www.sonnentaler.net/dokumentation/ipcc-berichte/sr-klimawandel-landnutzung/ IPCC-Sonderbericht „Klimawandel und Landsysteme“ – Zusammenfassung für Lehrende]<br> Lizenz: CC BY-NC-SA |} | 1 |
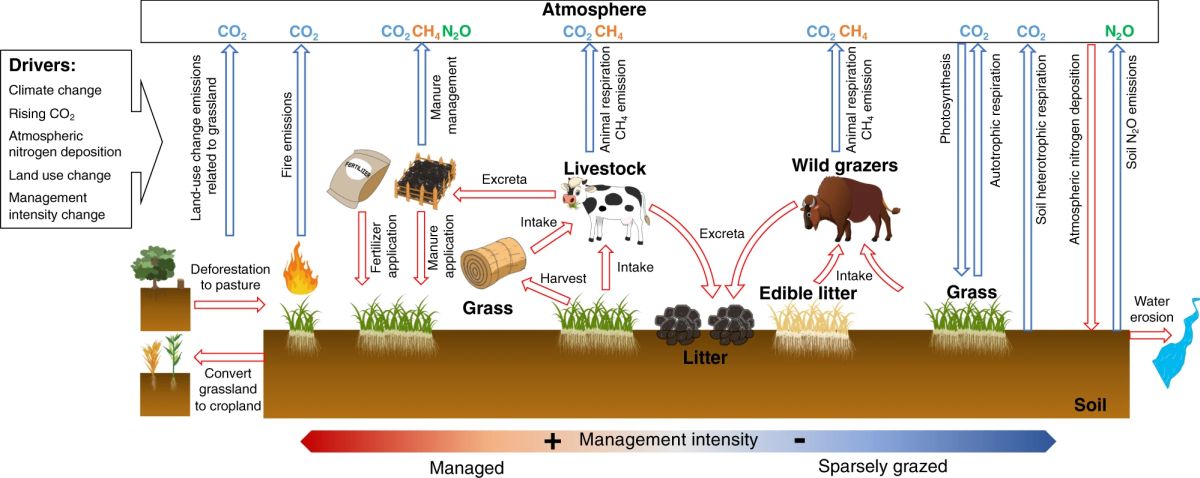
| 17:01, 19. Dez. 2023 | Grasslands GHG fluxes.jpg (Datei) |  |
89 KB | == Beschreibung == Treibhausgas-Flüsse zwischen Grasland und Atmosphäre sowie relevante Änderungsprozesse ==Lizenzhinweis== {| style="border:1px solid #8888aa; background-color:#f7f8ff;padding:5px;font-size:95%;" | Quelle: Chang, J., Ciais, P., Gasser, T. et al. (2021): Climate warming from managed grasslands cancels the cooling effect of carbon sinks in sparsely grazed and natural grasslands. Nat Commun 12, 118 (2021). https://doi.org/10.1038/s41467-020-20406-7<br> Lizenz: [http://creativec… | 1 |
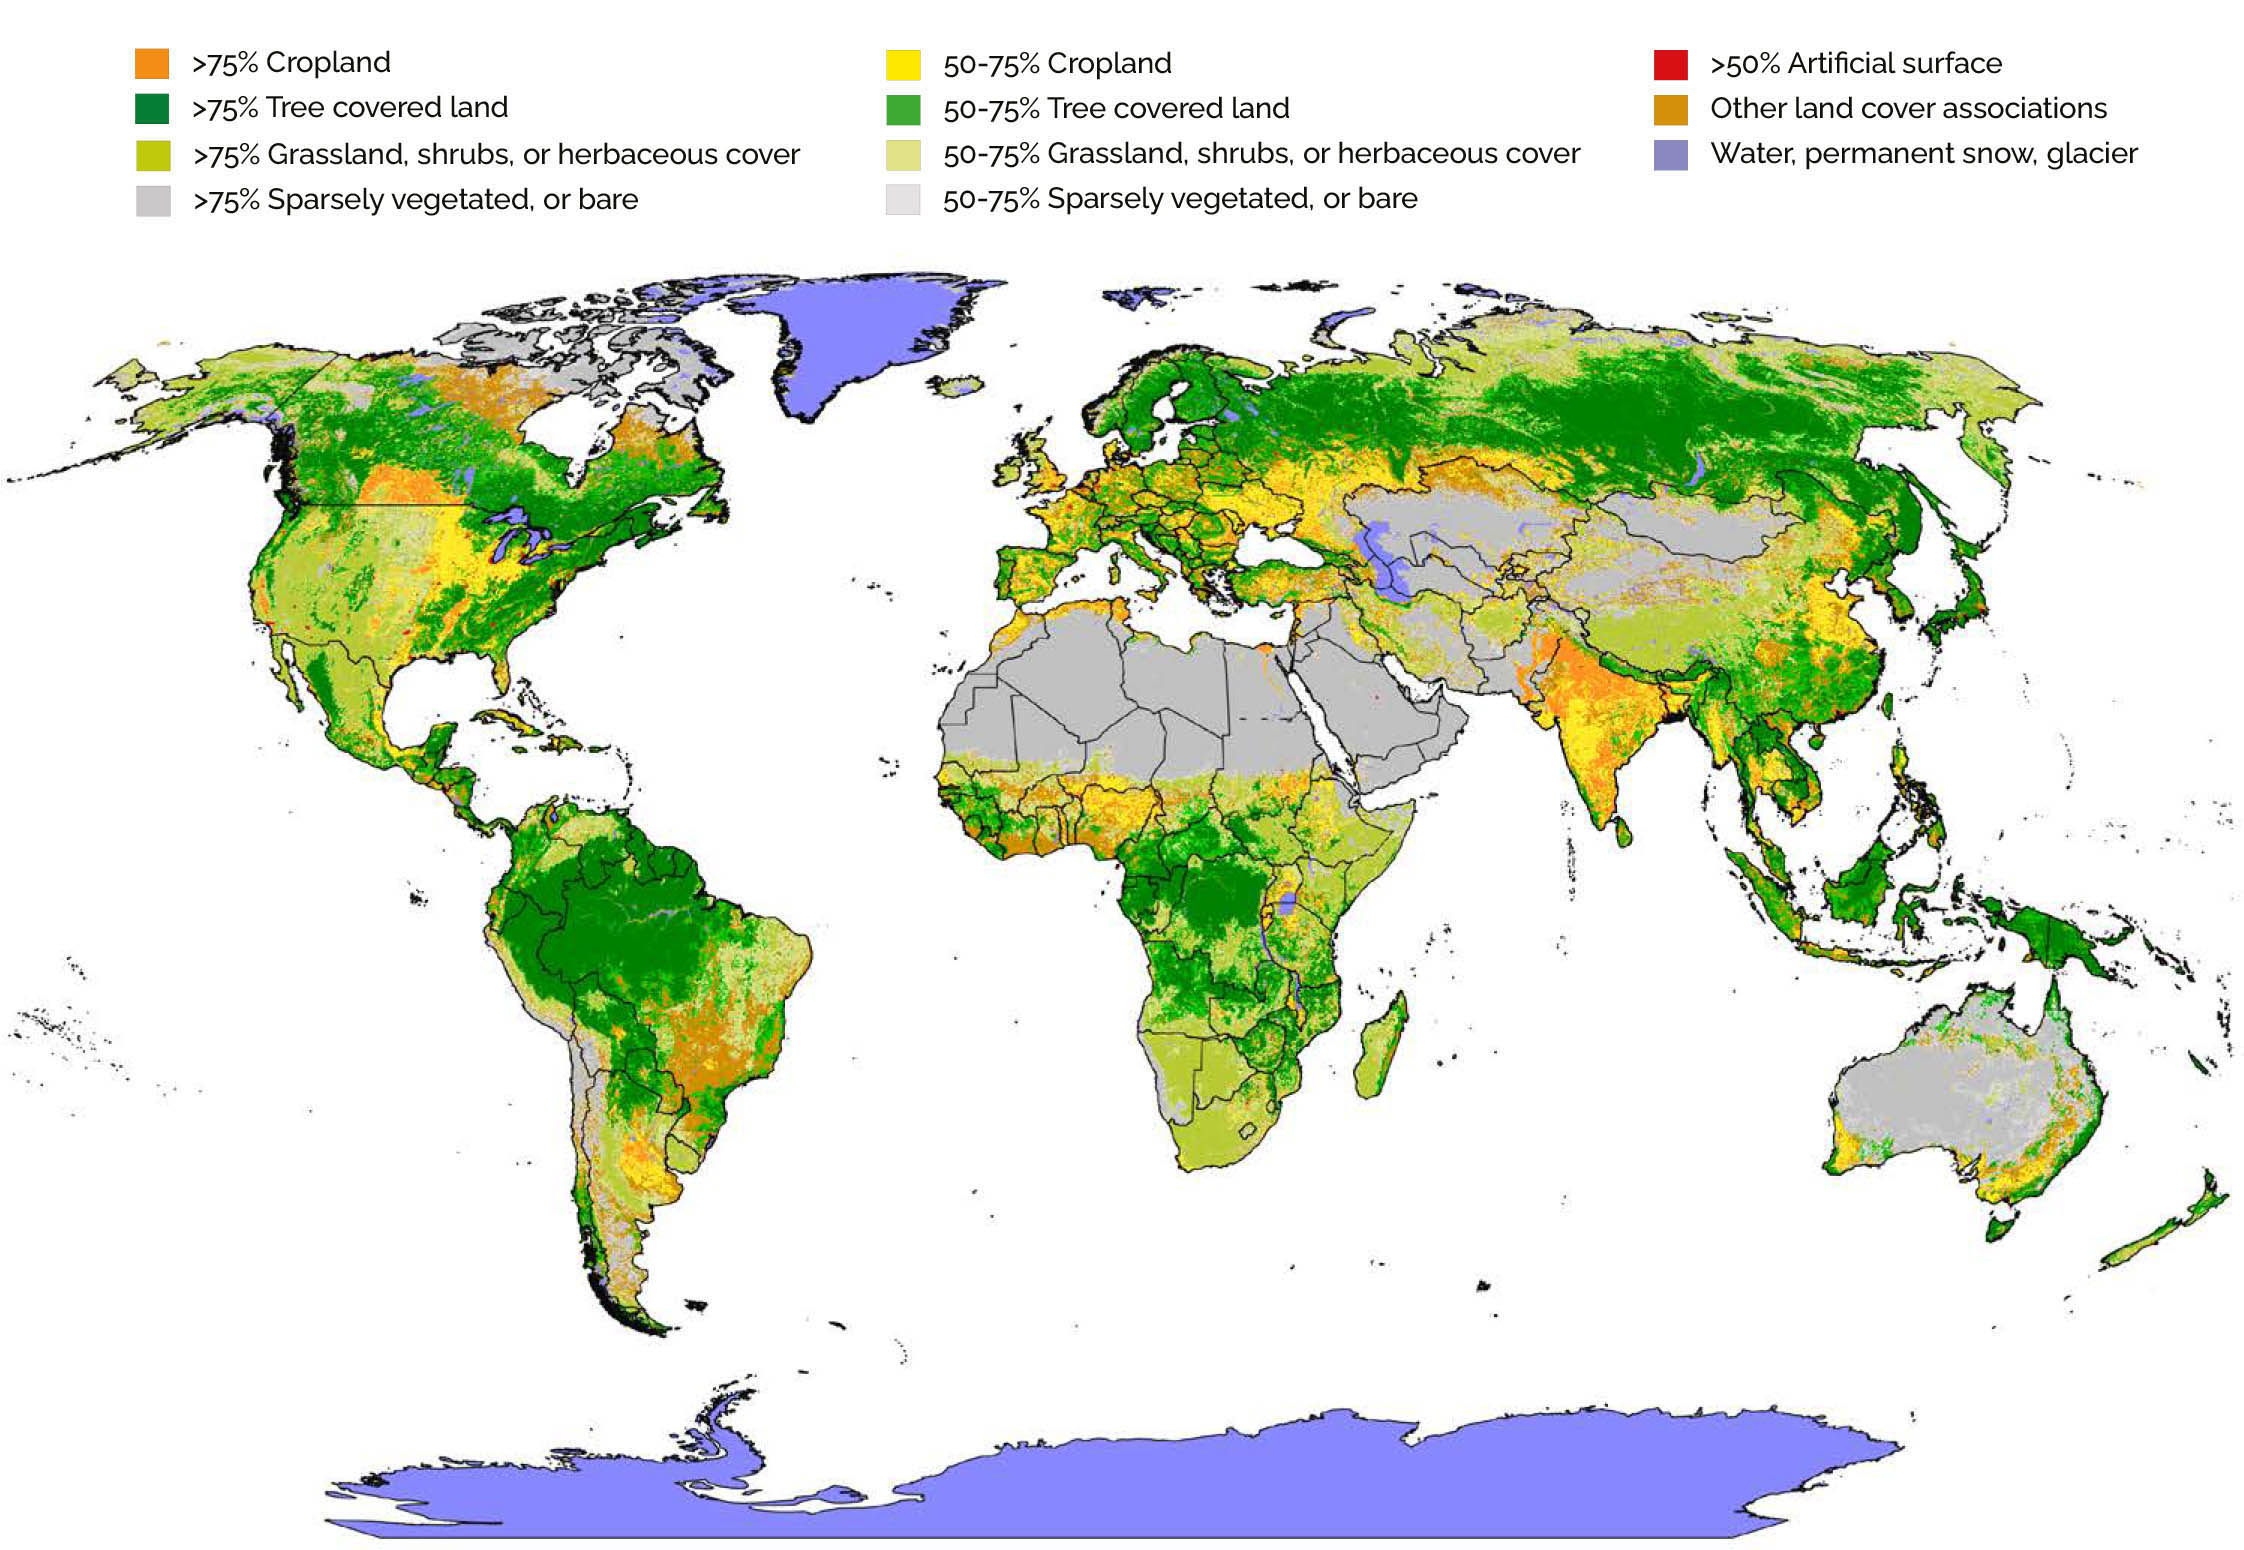
| 16:49, 19. Dez. 2023 | Land-cover classes FAO.jpg (Datei) |  |
395 KB | == Beschreibung == Vegetationsbedeckung == Lizenzhinweis == {| style="border:1px solid #8888aa; background-color:#f7f8ff;padding:5px;font-size:95%;" | Quelle: Li, Y., Z.-L. Li, H. Wu et al. (2023): [https://doi.org/10.1038/s41467-023-35799-4 Biophysical impacts of earth greening can substantially mitigate regional land surface temperature warming]. Nat Commun 14, 121, Suppl.<br> Lizenz: [https://creativecommons.org/licenses/by/4.0/ CC BY] |} | 1 |
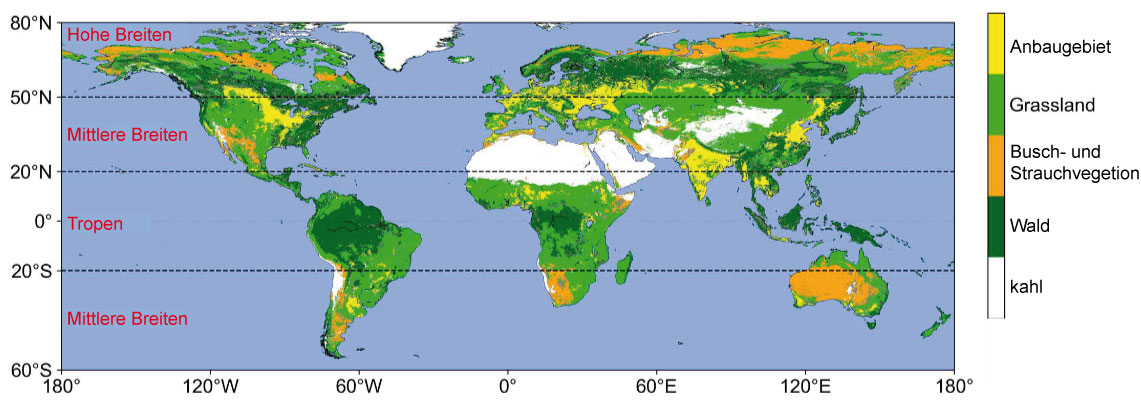
| 16:43, 19. Dez. 2023 | Vegetationsbedeckung.jpg (Datei) |  |
108 KB | == Beschreibung == Vegetationsbedeckung == Lizenzhinweis == {| style="border:1px solid #8888aa; background-color:#f7f8ff;padding:5px;font-size:95%;" | Quelle: Li, Y., Z.-L. Li, H. Wu et al. (2023): Biophysical impacts of earth greening can substantially mitigate regional land surface temperature warming. Nat Commun 14, 121, Suppl. https://doi.org/10.1038/s41467-023-35799-4<br> Lizenz: [https://creativecommons.org/licenses/by/4.0/ CC BY] |} | 1 |
| 17:16, 15. Dez. 2023 | CO2-Ozean-Landveg-Strahlung-Temp.jpg (Datei) |  |
70 KB | 2 | |
| 16:22, 15. Dez. 2023 | CO2-temp-2015-2100a.gif (Datei) |  |
49 KB | CO2-Emissionen, CO2-Konzentration und globale Mitteltemperatur nach einem hohen und einem niedrigen Szenario 2015-2100 ==Lizenzhinweis== {| style="border:1px solid #8888aa; background-color:#f7f8ff;padding:5px;font-size:95%;" | Quelle: eigene Darstellung, angelehnt an IPCC AR6 WGI (2021): FAQ 4.2, Figure 1<br> Lizenz: Lizenz: CC BY-NC-ND-SA |} | 1 |
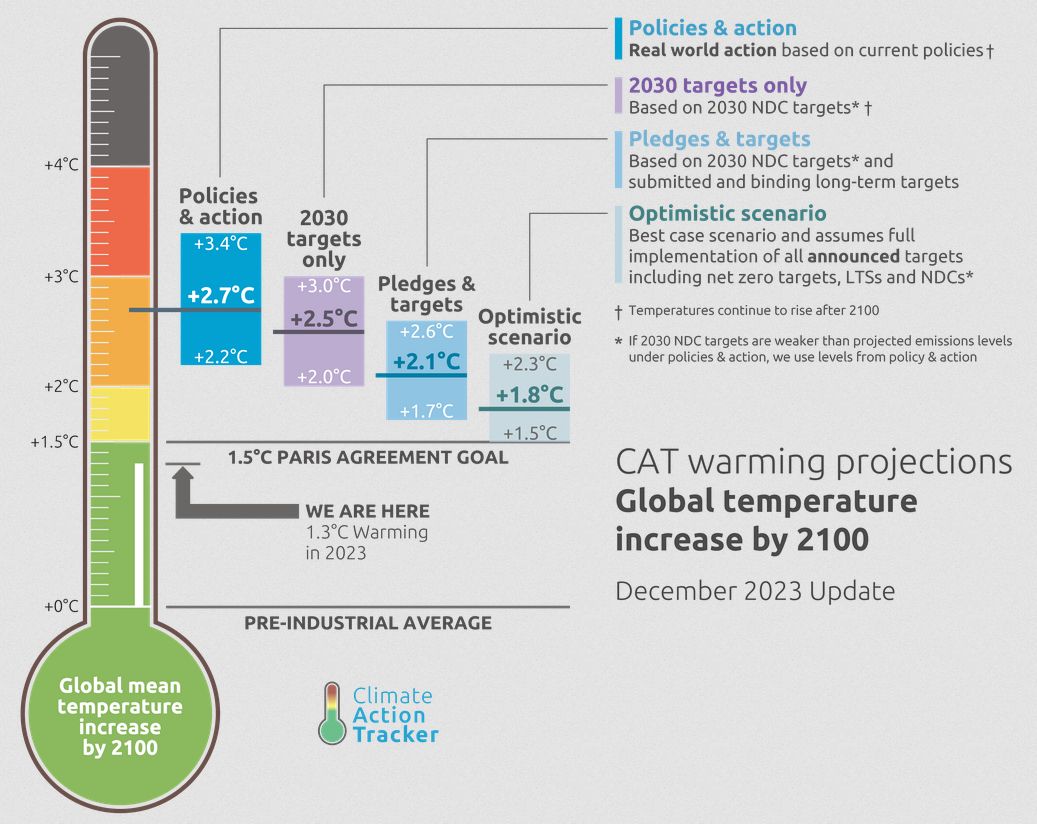
| 16:08, 15. Dez. 2023 | CAT-Thermometer2100.jpg (Datei) |  |
114 KB | Pariser Klimaziele und die aktuelle Klimapolitik: Die Erwärmung gegenüber der vorindustriellen Zeit liegt gegenwärtig bei +1 °C. Die Beschlüsse der Klimakonferenz von Paris 2015 streben eine Erwärmung von 1,5 °C, höchstens 2 °C bis 2100 an. Die seit der Konferenz übernommenen Verpflichtungen der einzelnen Staaten laufen auf eine Erwärmung von ca. 3 °C hinaus, die aktuelle Klimapolitik steuert auf eine Erwärmung von ca. 3,3 °C zu. ==Lizenzhinweis== {| style="border:1px solid #8888aa; background-… | 1 |
| 19:27, 29. Nov. 2023 | Temp SO4 1920-2020.jpg (Datei) |  |
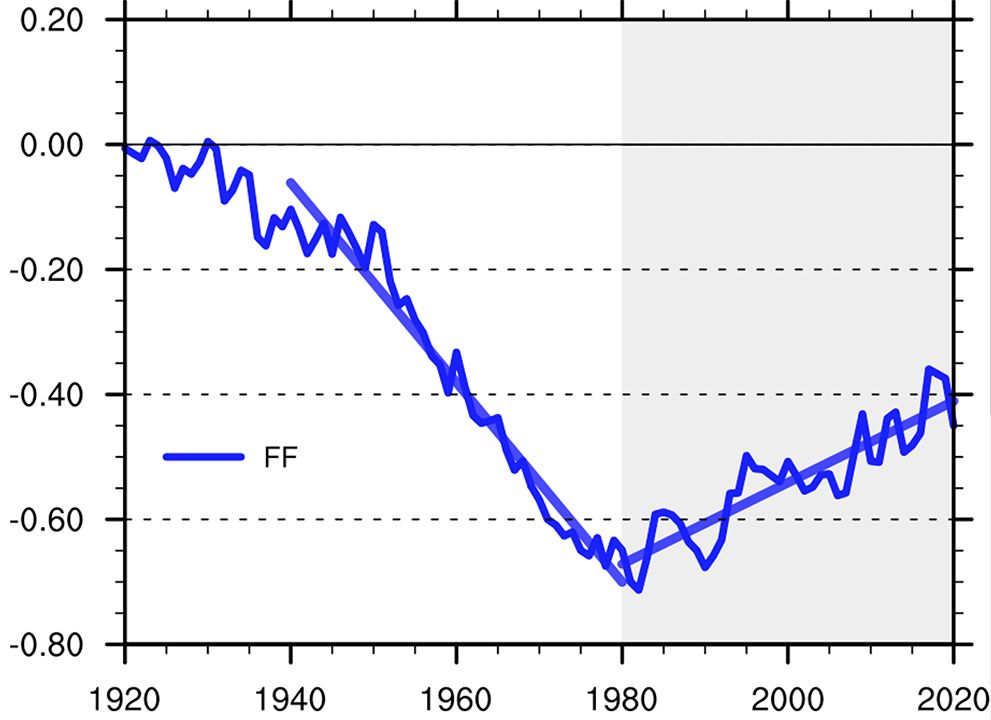
58 KB | == Beschreibung == Temperaturänderung auf der Nordhalbkugel durch SO4-Belastung infolge der Verbrennung fossiler Energieträger 1980-2020. 2020 = 0. ==Lizenzhinweis== {| style="border:1px solid #8888aa; background-color:#f7f8ff;padding:5px;font-size:95%;" | Quelle: Diao, C., Xu, Y., and Xie, S.-P. (2021): [https://doi.org/10.5194/acp-21-18499-2021 Anthropogenic aerosol effects on tropospheric circulation and sea surface temperature (1980–2020): separating the role of zonally asymmetric forcings]… | 1 |
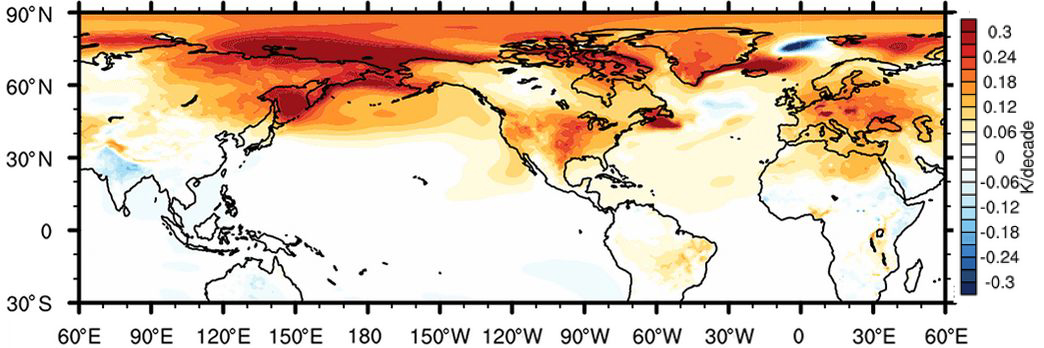
| 19:23, 29. Nov. 2023 | Temp FF forcing 1980-2020.jpg (Datei) |  |
220 KB | 2 | |
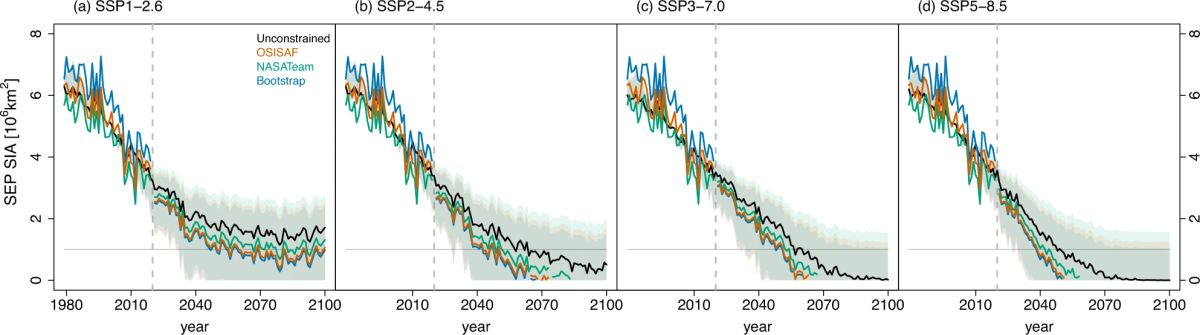
| 15:39, 29. Nov. 2023 | Arctic sea ice SSP 2100.jpg (Datei) |  |
53 KB | Beobachtete Änderungen der arktischen Meereisfläche nach verschiedenen Satelliten-Datensätzen zwischen 1979 und 2019. Ab 2020 Modellprojektionen der Meereisflächenänderung unter Berücksichtigung der beobachteten Beziehung zwischen Meereisänderungen und der Zunahme der Treibhausgaskonzentration. ==Lizenzhinweis== {| style="border:1px solid #8888aa; background-color:#f7f8ff;padding:5px;font-size:95%;" | Quelle: Kim, Y.H., S.K. Min, N.P. Gillett et al. (2023): Observationally-constrained projectio… | 1 |
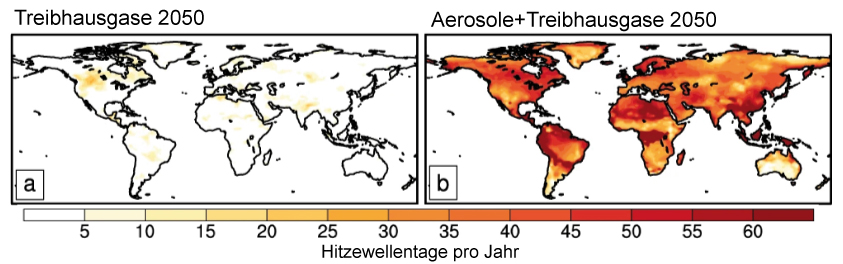
| 16:54, 25. Nov. 2023 | Hitzewellentage2050-GHG-Aero.jpg (Datei) |  |
115 KB | == Beschreibung == Änderung der Hitzewellentage pro Jahr nach dem treibhausgasneutralen Szenario SSP1-1.9 bis 2050 durch den Rückgang nur der THG-Konzentration (a) sowie bei zusätzlicher Abnahme der Aerosolemissionen (b). ==Lizenzhinweis== {| style="border:1px solid #8888aa; background-color:#f7f8ff;padding:5px;font-size:95%;" | Quelle: Wang, P., Yang, Y., Xue, D. et al. (2023): [https://doi.org/10.1038/s41467-023-42891-2 Aerosols overtake greenhouse gases causing a warmer climate and more weat… | 1 |
| 16:52, 25. Nov. 2023 | Aerosols-GHG-prec.jpg (Datei) | 214 KB | == Beschreibung == Änderung der Niederschläge nach dem treibhausgasneutralen Szenario SSP1-1.9 bis 2050 durch den Rückgang nur der THG-Konzentration (a) sowie bei zusätzlicher Abnahme der Aerosolemissionen (b). ==Lizenzhinweis== {| style="border:1px solid #8888aa; background-color:#f7f8ff;padding:5px;font-size:95%;" | Quelle: Wang, P., Yang, Y., Xue, D. et al. (2023): [https://doi.org/10.1038/s41467-023-42891-2 Aerosols overtake greenhouse gases causing a warmer climate and more weather extreme… | 1 | |
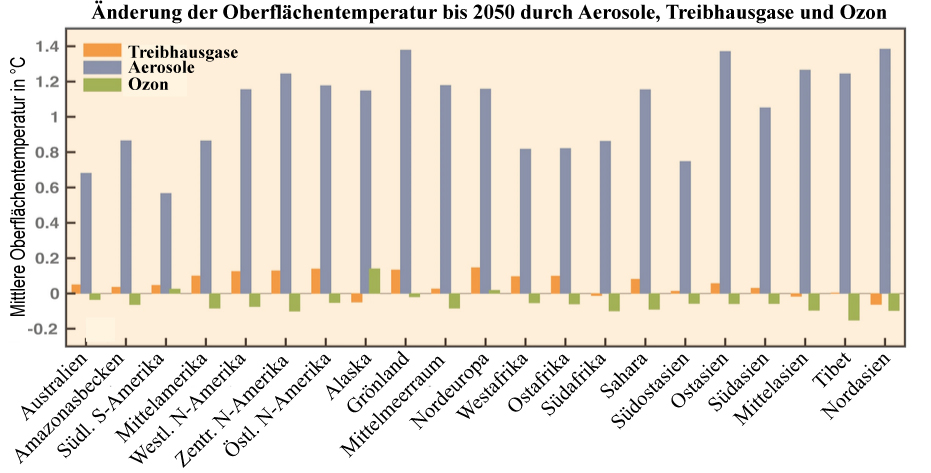
| 16:48, 25. Nov. 2023 | Aerosole-temp-2050.jpg (Datei) |  |
157 KB | == Beschreibung == Treibhausgase, Aerosole und Ozon als Verursacher der Änderung der regionalen Mitteltemperatur bis 2050 nach dem treibhausgasneutralen Szenario SSP1-1.9 relativ zu 2020 ==Lizenzhinweis== {| style="border:1px solid #8888aa; background-color:#f7f8ff;padding:5px;font-size:95%;" | Quelle: Wang, P., Yang, Y., Xue, D. et al. (2023): [https://doi.org/10.1038/s41467-023-42891-2 Aerosols overtake greenhouse gases causing a warmer climate and more weather extremes toward carbon neutrali… | 1 |
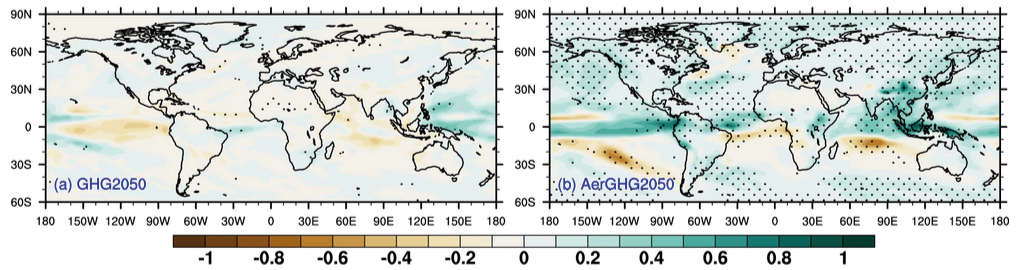
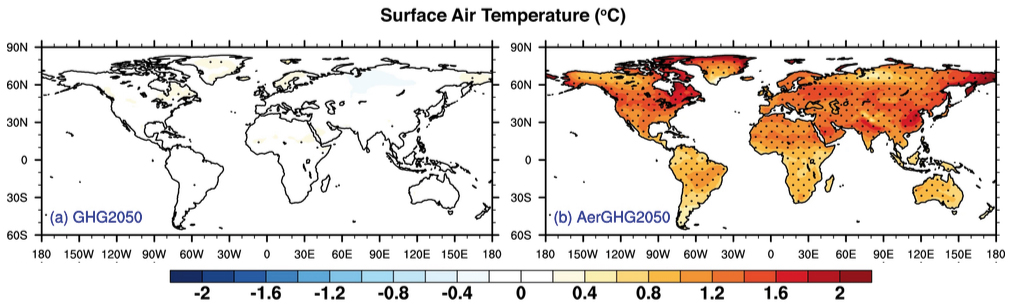
| 16:41, 25. Nov. 2023 | GHG-Aerosole-2050-temperatur.jpg (Datei) |  |
174 KB | == Beschreibung == Änderung der jährlichen Mitteltemperatur nach dem treibhausgasneutralen Szenario SSP1-1.9 bis 2050 durch den Rückgang nur der THG-Konzentration (links) sowie bei zusätzlicher Abnahme der Aerosolemissionen (rechts) relativ zu 2020. ==Lizenzhinweis== {| style="border:1px solid #8888aa; background-color:#f7f8ff;padding:5px;font-size:95%;" | Quelle: Wang, P., Yang, Y., Xue, D. et al. (2023): [https://doi.org/10.1038/s41467-023-42891-2 Aerosols overtake greenhouse gases causing a… | 1 |
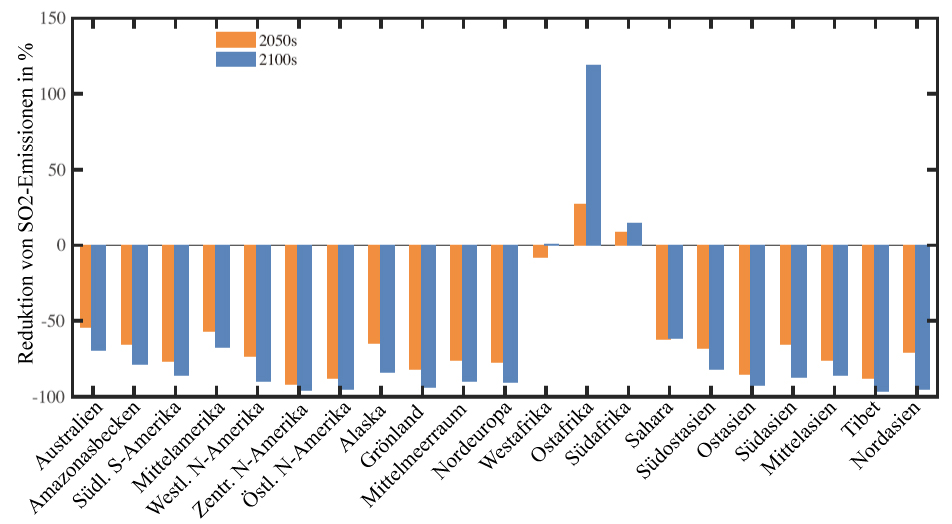
| 16:22, 25. Nov. 2023 | SO2-Emissionen-regional.jpg (Datei) |  |
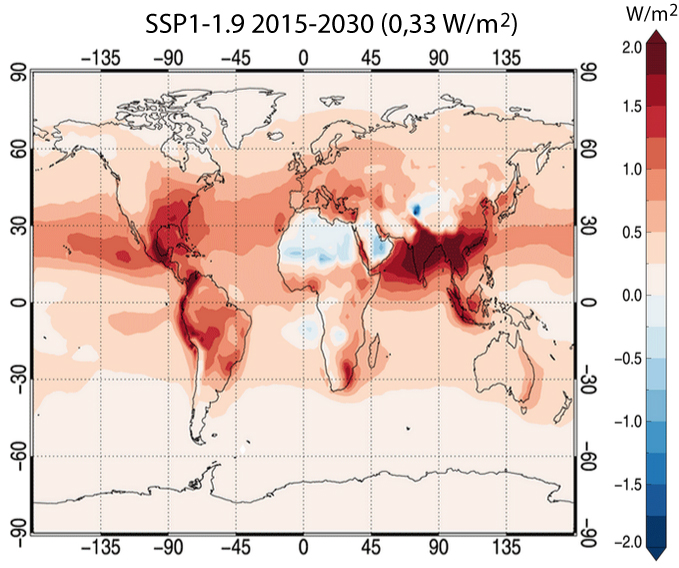
120 KB | == Beschreibung == Strahlungsantrieb durch Aerosole bis 2030 nach dem SSP-Szenario SSP1-1.9, verändert ==Lizenzhinweis== {| style="border:1px solid #8888aa; background-color:#f7f8ff;padding:5px;font-size:95%;" | Quelle: Lund, M. T., Myhre, G., and Samset, B. H.: [https://doi.org/10.5194/acp-19-13827-2019 Anthropogenic aerosol forcing under the Shared Socioeconomic Pathways], Atmos. Chem. Phys., 19, 13827–13839<br> Lizenz: [https://creativecommons.org/licenses/by/4.0/deed.de CC BY] |} | 1 |
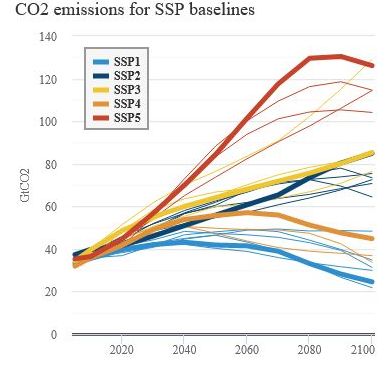
| 19:24, 7. Nov. 2023 | SSP CO2 temp.jpg (Datei) |  |
24 KB | 2 | |
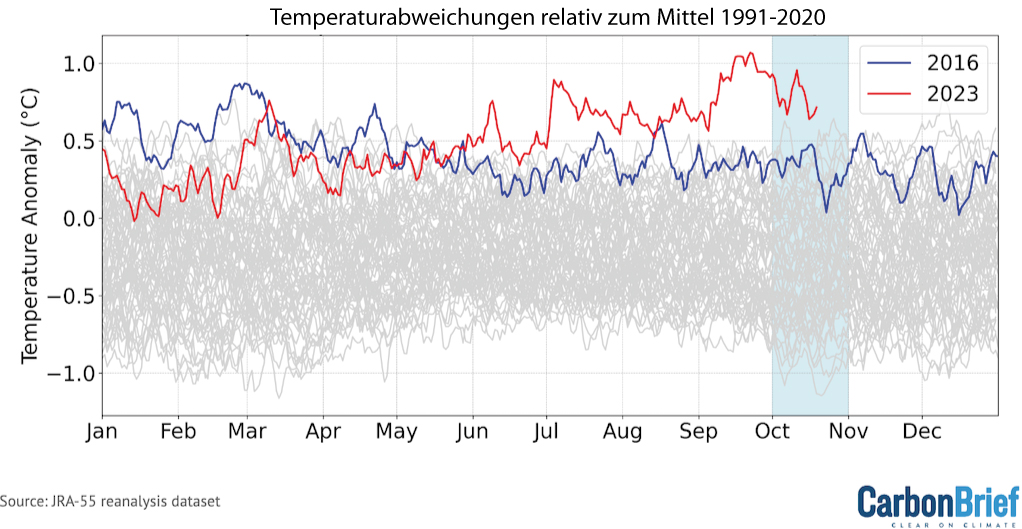
| 17:44, 2. Nov. 2023 | Temp-2016-2023.jpg (Datei) |  |
261 KB | == Beschreibung == Temperaturabweichungen relativ zum Mittel 1991-2020. 2023 ist verglichen mit dem bisher wärmsten Jahr 2016 ==Lizenzhinweis== {| style="border:1px solid #8888aa; background-color:#f7f8ff;padding:5px;font-size:95%;" | Quelle: Hausfather, Z., Carbon Brief (2023): State of the climate: Global temperatures throughout mid-2023 shatter records https://www.carbonbrief.org/state-of-the-climate-global-temperatures-throughout-mid-2023-shatter-records/<br> Lizenz: public domain |} | 1 |
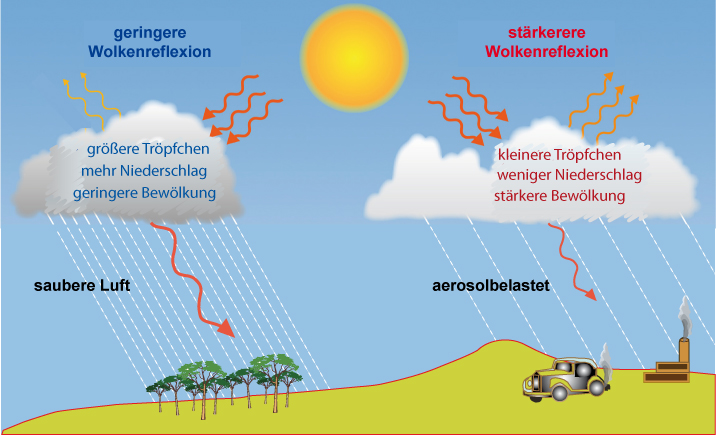
| 12:59, 31. Okt. 2023 | Aerosole-Wolken-Strahlung.jpg (Datei) |  |
197 KB | 2 | |
| 13:55, 30. Okt. 2023 | Aerosol-radiation-SSP1-2030.jpg (Datei) |  |
251 KB | Strahlungsantrieb durch Aerosole bis 2030 nach dem SSP-Szenario SSP1-1.9, verändert ==Lizenzhinweis== {| style="border:1px solid #8888aa; background-color:#f7f8ff;padding:5px;font-size:95%;" | Quelle: Lund, M. T., Myhre, G., and Samset, B. H.: Anthropogenic aerosol forcing under the Shared Socioeconomic Pathways, Atmos. Chem. Phys., 19, 13827–13839, https://doi.org/10.5194/acp-19-13827-2019<br> Lizenz: [https://creativecommons.org/licenses/by/4.0/deed.de CC BY] |} | 1 |
| 17:01, 29. Okt. 2023 | Aerosole-SSP-emissionen-antrieb.jpg (Datei) |  |
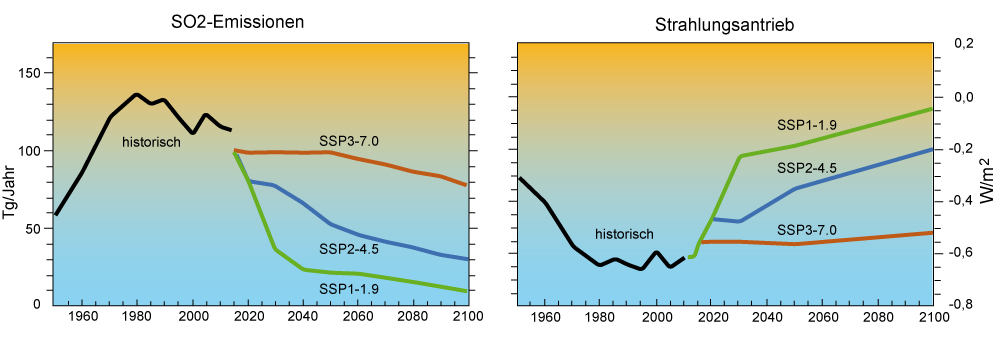
126 KB | Links: SO2-Emissionen 1950 bis 2100 beobachtet und nach den Szenarien SSP1-1.9, SSP2-4.5 und SSP3-7.0; rechts: der globale Strahlungsantrieb durch anthropogene Aerosole von 1950 bis 2100, wobei 0,0 W/m2 dem vorindustriellen Wert entspricht; verändert. Die Aerosol-Zunahme in den ersten 30 Jahren bis ca. 1980 sorgt für eine deutliche Abnahme des Strahlungsantriebs, d.h. der Sonneneinstrahlung, die anschließend bis 2010 auf einem niedrigen Niveau von -0,6 W/m2 stagniert. Bis 2100 nimmt der Strahl… | 1 |
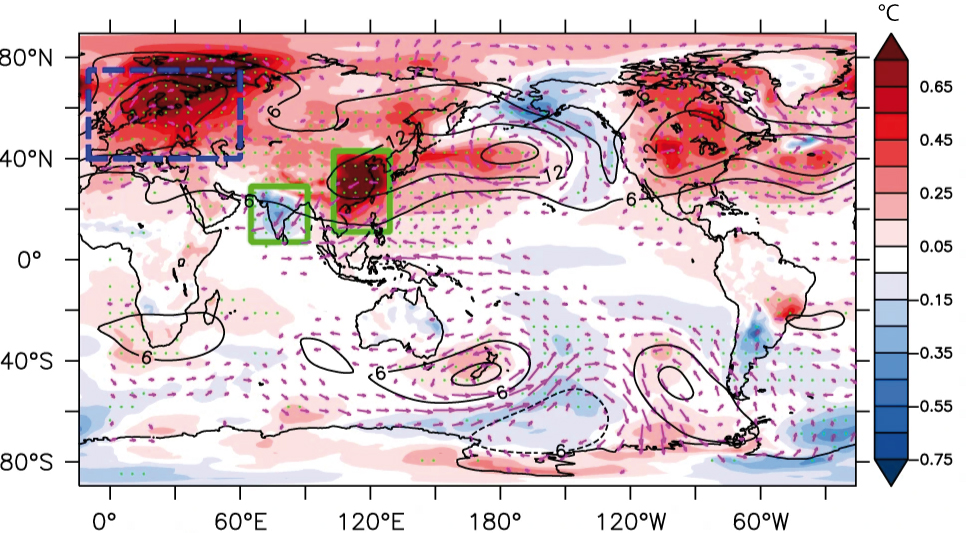
| 15:24, 24. Okt. 2023 | Asian-aerosol-dipole-remote-warming.jpg (Datei) |  |
430 KB | == Beschreibung == Fernwirkungen der Aerosolentwicklung in Süd- und Ostasien. Dargestellt ist die Änderung der Jahresmitteltemperatur in °C, sowie Windströmungen bei 850 hPa. ==Lizenzhinweis== {| style="border:1px solid #8888aa; background-color:#f7f8ff;padding:5px;font-size:95%;" | Quelle: Xiang, B., Xie, SP., Kang, S.M. et al. (2023): An emerging Asian aerosol dipole pattern reshapes the Asian summer monsoon and exacerbates northern hemisphere warming. npj Clim Atmos Sci 6, 77. https://doi.or… | 1 |
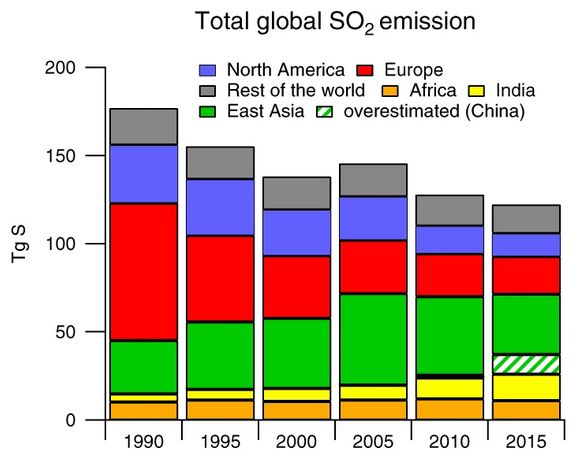
| 09:54, 19. Okt. 2023 | SO2 Emissions 1990-2015.jpg (Datei) |  |
35 KB | == Beschreibung == Änderung der globalen SO2-Emissionen 1990 bis 2015 in TgS. Der grün gestreifte Bereich zeigt aufgrund der unsicheren Datenlage eine mögliche Überschätzung der chinesischen Emissionen. ==Lizenzhinweis== {| style="border:1px solid #8888aa; background-color:#f7f8ff;padding:5px;font-size:95%;" | Quelle: Aas, W., A. Mortier, V. Bowersox et al. (2019): Global and regional trends of atmospheric sulfur. Sci Rep 9, 953. https://doi.org/10.1038/s41598-018-37304-0 <br> Lizenz: [https://… | 1 |
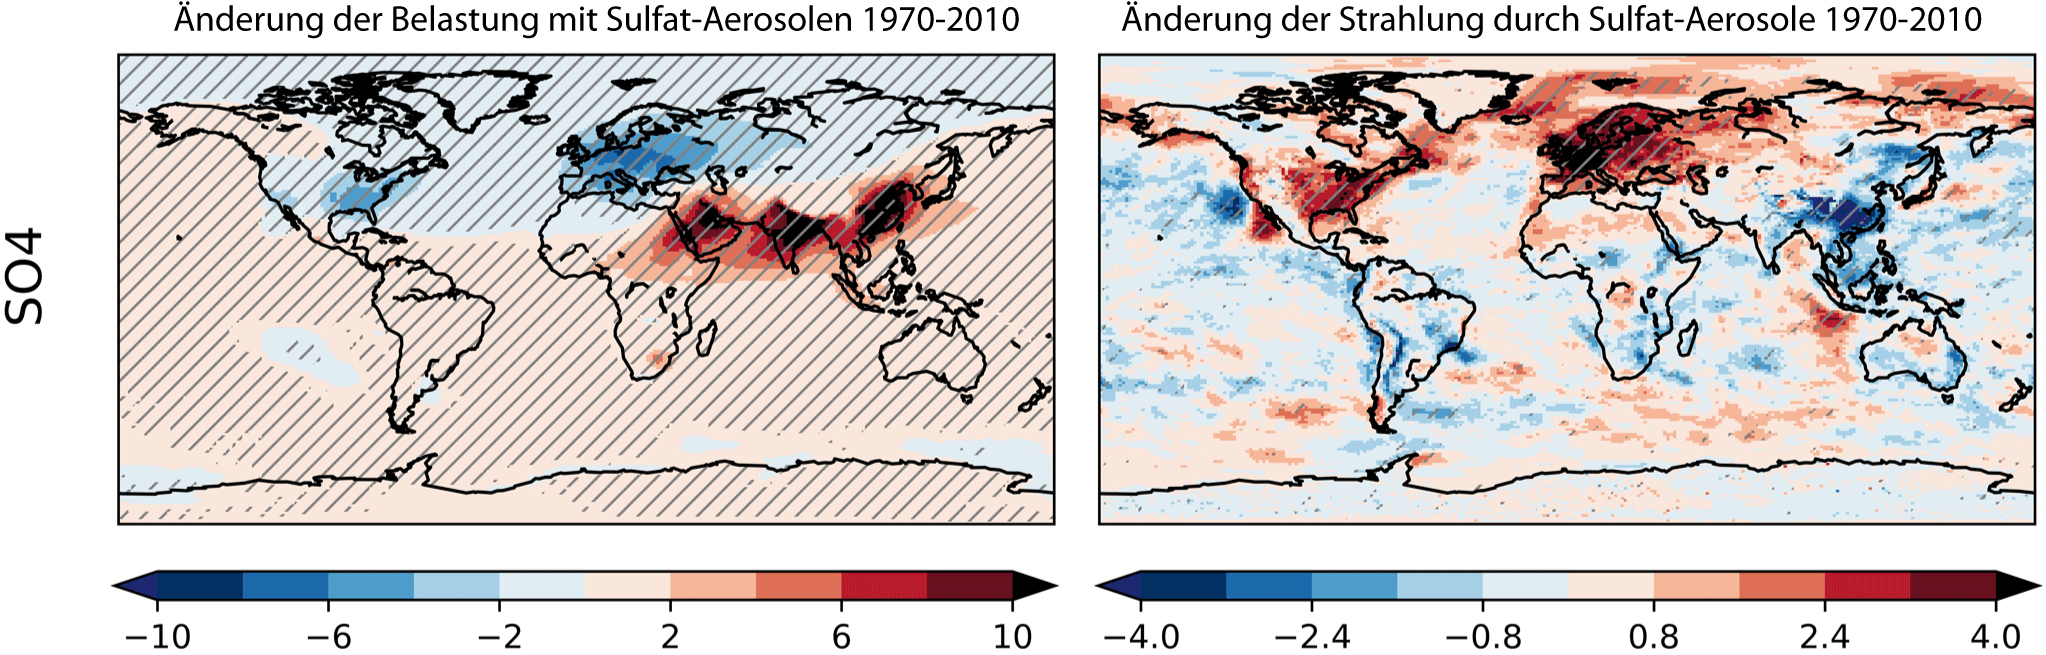
| 09:14, 19. Okt. 2023 | SO4 Strahlung 1970-2010-lg.jpg (Datei) |  |
1,11 MB | == Beschreibung == Änderung der Sulfat-Belastung 1970-2010 (links) und die resultierende Änderung der Strahlung (rechts) ==Lizenzhinweis== {| style="border:1px solid #8888aa; background-color:#f7f8ff;padding:5px;font-size:95%;" | Quelle: Zhao, A., M.A. Bollasina, M. Crippa, and D.S. Stevenson (2019): [https://doi.org/10.5194/acp-19-14517-2019 Significant climate impacts of aerosol changes driven by growth in energy use and advances in emission control technology], Atmos. Chem. Phys., 19, 14517–… | 1 |
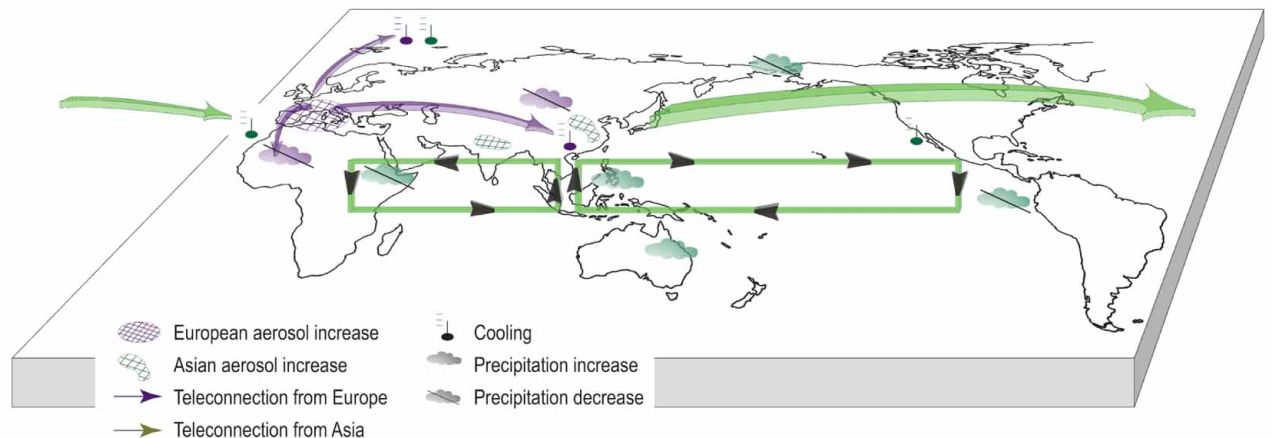
| 12:21, 18. Okt. 2023 | Aerosol teleconnections.jpg (Datei) |  |
60 KB | Fernwirkungen von Aerosolen. Die lila Pfeile zeigen die Fernwirkungen europäischer Aerosole, die grünen Pfeile die von Ostasien. Außerdem ist die Walkerzirkulation als zentraler Transportweg in den Tropen eingezeichnet. == Lizenzhinweis == {| style="border:1px solid #8888aa; background-color:#f7f8ff;padding:5px;font-size:95%;" |Quelle: Persad, G., B.H. Samset and L.J. Wilcox et al. (2023): Rapidly evolving aerosol emissions are a dangerous omission from near-term climate risk assessments, Envir… | 1 |
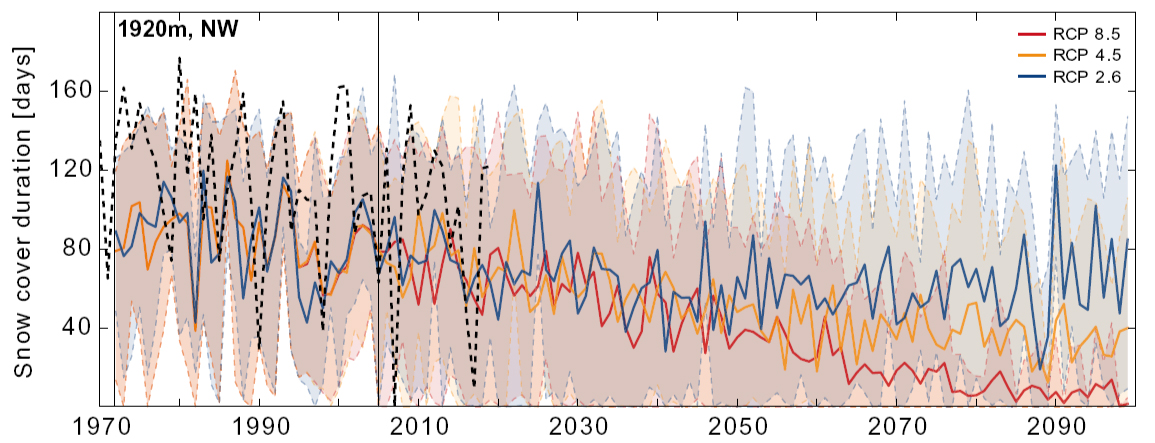
| 15:57, 2. Okt. 2023 | Ötztal-snow-cover-duration-2100.jpg (Datei) |  |
360 KB | == Beschreibung == Änderung der Schneebedeckungsdauer (Schneelagen >30 cm) in Tagen im Winter (Nov.-April) in den Ötztaler Alpen in 1920 m Höhe nach den Szenarien RCP8.5, RCP4.5 und RCP2.6. == Lizenzhinweis == {| style="border:1px solid #8888aa; background-color:#f7f8ff;padding:5px;font-size:95%;" |Quelle: Kotlarski, S., A. Gobiet, S. Morin et. al (2023): [https://doi.org/10.1007/s00382-022-06303-3 21st Century alpine climate change], Clim. Dynam., 60, 65–86<br> Lizenz: [http://creativecommons.… | 1 |
