Von Dieter Kasang hochgeladene Dateien
Aus Klimawandel
Diese Spezialseite listet alle hochgeladenen Dateien auf.
| Datum | Name | Vorschaubild | Größe | Beschreibung | Versionen |
|---|---|---|---|---|---|
| 15:55, 2. Okt. 2023 | Alps snow mass 2100 RCPs.jpg (Datei) |  |
56 KB | == Beschreibung == Änderung der Masse der Schneebedeckung in den Alpen und Alpenvorländern bis 2070-2099 im Vergleich zu 1981-2020 nach den Szenarien RCP4.5 und RCP8.5 in %. == Lizenzhinweis == {| style="border:1px solid #8888aa; background-color:#f7f8ff;padding:5px;font-size:95%;" |Quelle: Kotlarski, S., A. Gobiet, S. Morin et. al (2023): [https://doi.org/10.1007/s00382-022-06303-3 21st Century alpine climate change], Clim. Dynam., 60, 65–86<br> Lizenz: [http://creativecommons.org/licenses/by/… | 1 |
| 15:30, 2. Okt. 2023 | Switzerland-temp-2100.jpg (Datei) |  |
57 KB | == Beschreibung == Temperaturveränderung in der Schweiz nach Beobachtung und verschiedenen Szenarien bis 2100 == Lizenzhinweis == {| style="border:1px solid #8888aa; background-color:#f7f8ff;padding:5px;font-size:95%;" |Quelle: Kotlarski, S., A. Gobiet, S. Morin et. al (2023): [https://doi.org/10.1007/s00382-022-06303-3 21st Century alpine climate change], Clim. Dynam., 60, 65–86<br> Lizenz: [http://creativecommons.org/licenses/by/4.0/ CC BY] |} | 1 |
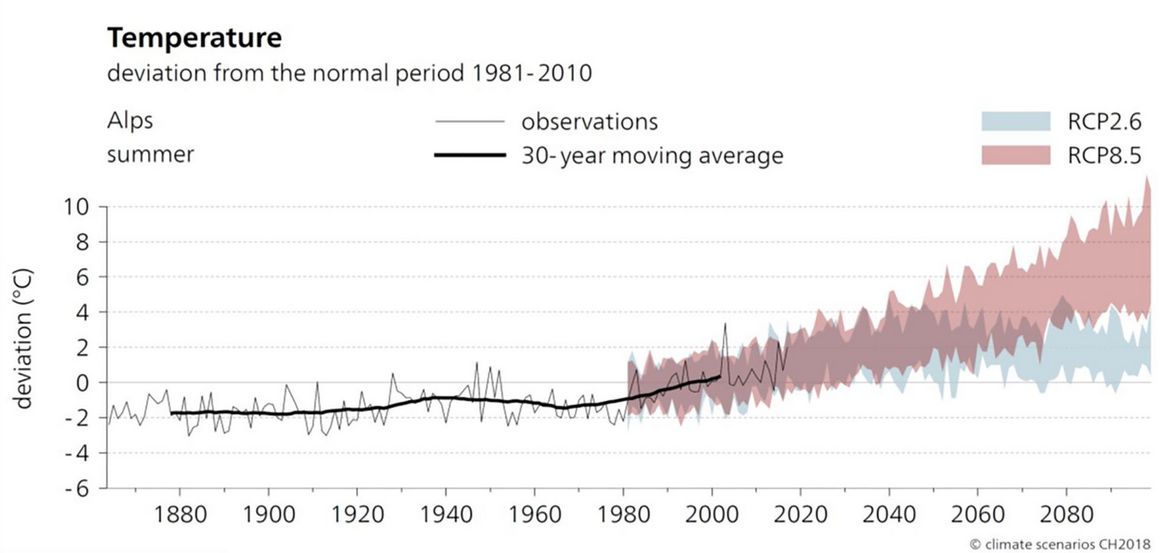
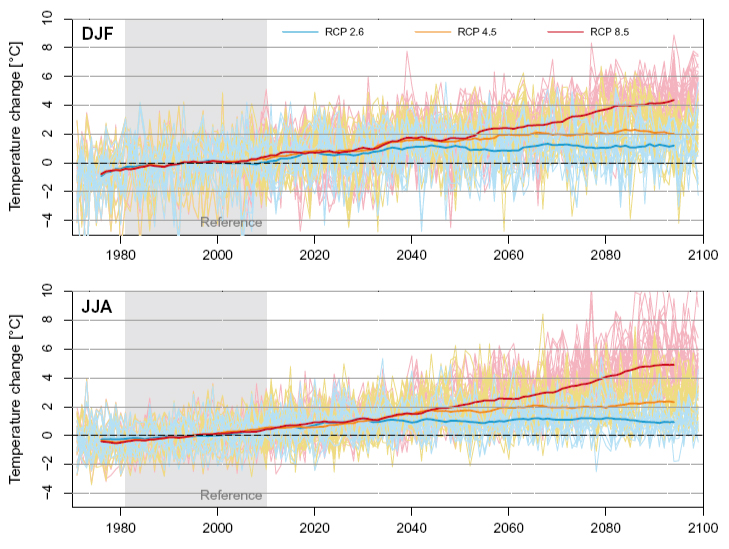
| 14:54, 2. Okt. 2023 | Alps-temp-2100-RCP.jpg (Datei) |  |
274 KB | == Beschreibung == Temperaturveränderung in den Nordost-Alpen im Winter (oben) und Sommer (unten) im Vergleich zum Mittel der Referenzperiode 1981-2020 nach verschiedenen Szenarien == Lizenzhinweis == {| style="border:1px solid #8888aa; background-color:#f7f8ff;padding:5px;font-size:95%;" |Quelle: Kotlarski, S., A. Gobiet, S. Morin et. al (2023): [https://doi.org/10.1007/s00382-022-06303-3 21st Century alpine climate change], Clim. Dynam., 60, 65–86<br> Lizenz: [http://creativecommons.org/licen… | 1 |
| 14:34, 2. Okt. 2023 | Alps regions.jpg (Datei) |  |
31 KB | Mögliche Einteilung der Alpen in drei Großregionen == Lizenzhinweis == {| style="border:1px solid #8888aa; background-color:#f7f8ff;padding:5px;font-size:95%;" |Quelle: Kotlarski, S., A. Gobiet, S. Morin et. al (2023): 21st Century alpine climate change], Clim. Dynam., 60, 65–86, https://doi.org/10.1007/s00382-022-06303-3<br> Lizenz: CC BY http://creativecommons.org/licenses/by/4.0/ |} | 1 |
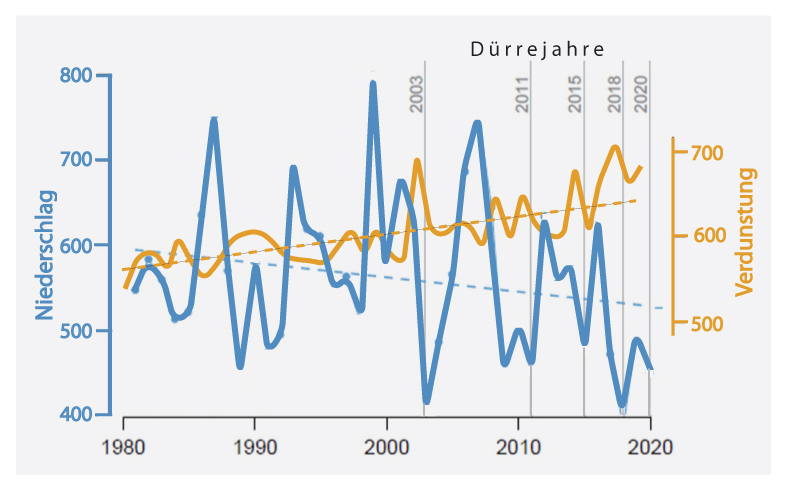
| 19:20, 28. Sep. 2023 | Switzerland-summer-drying.jpg (Datei) |  |
146 KB | == Beschreibung == Änderung der Jahresniederschläge und der Verdunstung 1981-2020 in mm == Lizenzhinweis == {| style="border:1px solid #8888aa; background-color:#f7f8ff;padding:5px;font-size:95%;" | Quelle: Scherrer, S.C., M. Hirschi, C. Spirig, F. Maurer, S. Kotlarski (2022): Trends and drivers of recent summer drying in Switzerland. Environ Res Commun 4:025004. https://iopscience.iop.org/article/10.1088/2515-7620/ac4fb9<br> Lizenz: CC BY http://creativecommons.org/licenses/by/4.0 |} | 1 |
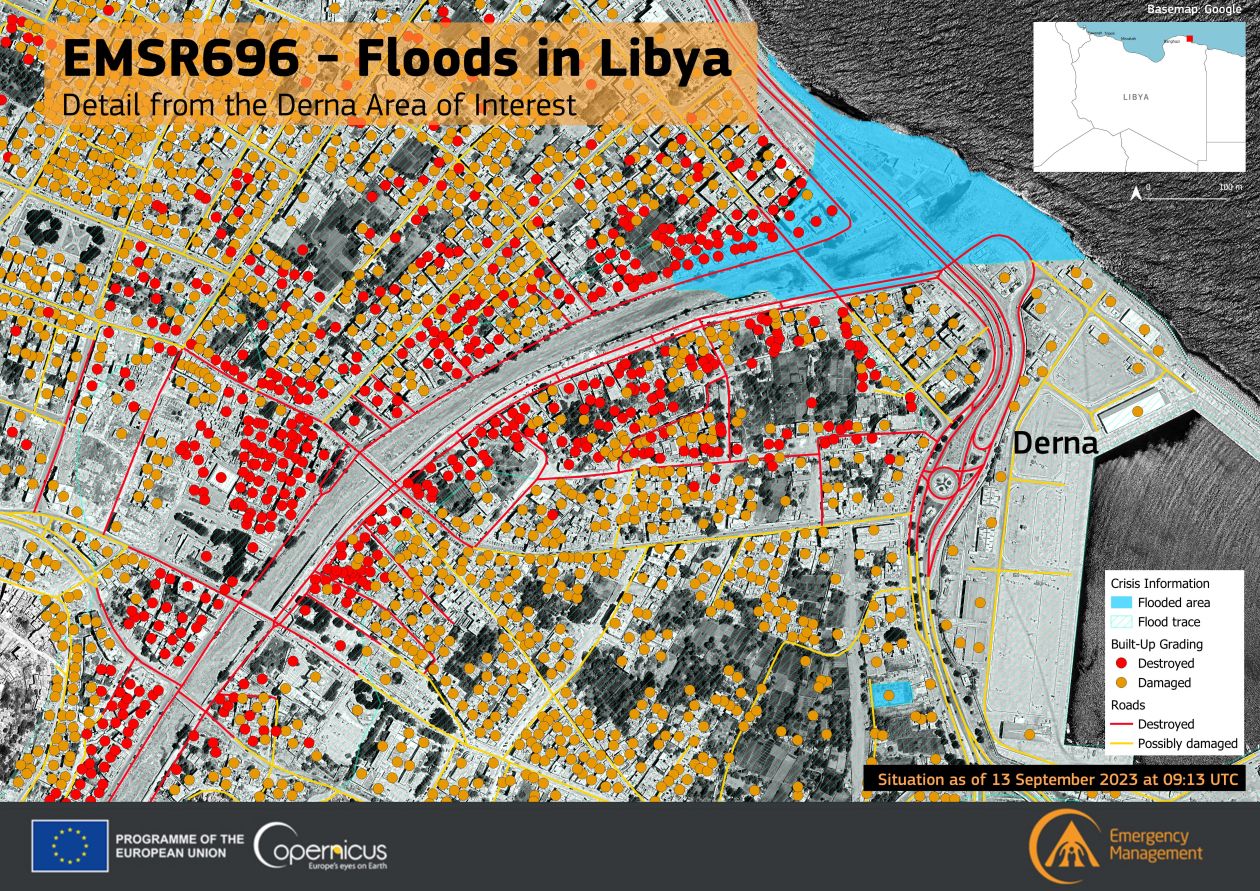
| 09:23, 28. Sep. 2023 | Medicane Daniel DernaFloods.jpg (Datei) |  |
472 KB | == Beschreibung == Zerstörungen in der libyschen Stadt Derna durch den Medicane Daniel ==Lizenzhinweis== {| style="border:1px solid #8888aa; background-color:#f7f8ff;padding:5px;font-size:95%;" | Quelle: European Union, Copernicus Sentinel-X, https://www.copernicus.eu/en/media/image-day-gallery/severe-floods-devastate-derna-libya<br> Lizenz: This Image of the Day may be reused freely and without prior authorisation by the media provided the following attribution is included (s.o.) |} | 1 |
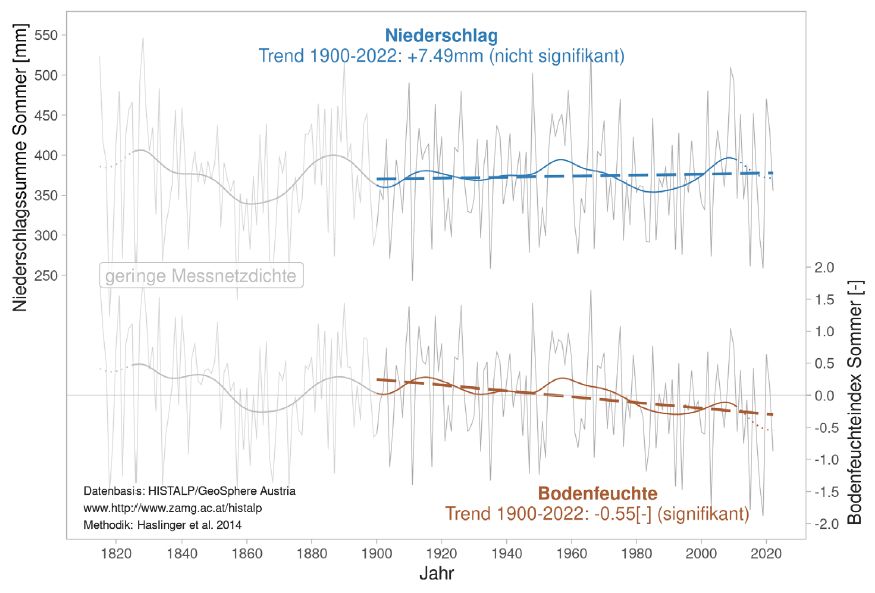
| 16:21, 27. Sep. 2023 | Österreich Niederschlag Bodenfeuchte.jpg (Datei) |  |
62 KB | == Beschreibung == Änderung des Niederschlags und der Bodenfeuchte in Österreich 1820-2022 mit Trends über den Zeitraum 1900-2022 == Lizenzhinweis == {| style="border:1px solid #8888aa; background-color:#f7f8ff;padding:5px;font-size:95%;" | Quelle: Maraun, D., L. Roither, ZAMG (2023): Dürren im Klimawandel: Niederschlag und Bodenfeuchte https://ccca.ac.at/fileadmin/00_DokumenteHauptmenue/02_Klimawissen/FactSheets/45_duerre_20230925.pdf<br> Lizenz: [https://creativecommons.org/licenses/by-nc-s… | 1 |
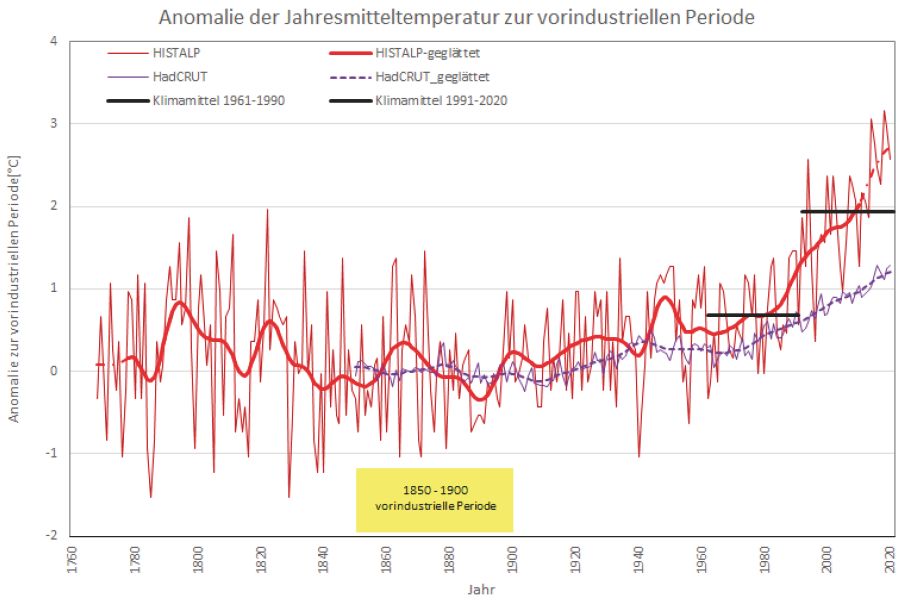
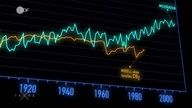
| 19:15, 26. Sep. 2023 | Österreich temp 1765-2020.jpg (Datei) |  |
62 KB | Änderung der globalen (lila) und der österreichischen (rot) jährlichen Mitteltemperatur 1765 bis 2020 sowie die Mittel der Klimaperioden 1961-1990 und 1991-2020, im Vergleich zur vorindustriellen Periode (1850-1900). == Lizenzhinweis == {| style="border:1px solid #8888aa; background-color:#f7f8ff;padding:5px;font-size:95%;" | Quelle: Chimani, B., M. Ganekind, M. Olefs, ZAMG (2021): Temperaturentwicklung in Österreich im globalen Kontext, https://ccca.ac.at/fileadmin/00_DokumenteHauptmenue/02_Kl… | 1 |
| 13:26, 26. Sep. 2023 | Alpen Lage Höhe.jpg (Datei) |  |
100 KB | Lage, Einteilung und Höhenkarte der Alpen == Lizenzhinweis == {| style="border:1px solid #8888aa; background-color:#f7f8ff;padding:5px;font-size:95%;" | Quelle: Monteiro, D. and S. Morin (2023): Multi-decadal analysis of past winter temperature, precipitation and snow cover data in the European Alps from reanalyses, climate models and observational datasets, The Cryosphere, 17, 3617–3660, https://doi.org/10.5194/tc-17-3617-2023<br> Lizenz: CC BY 4.0 |} | 1 |
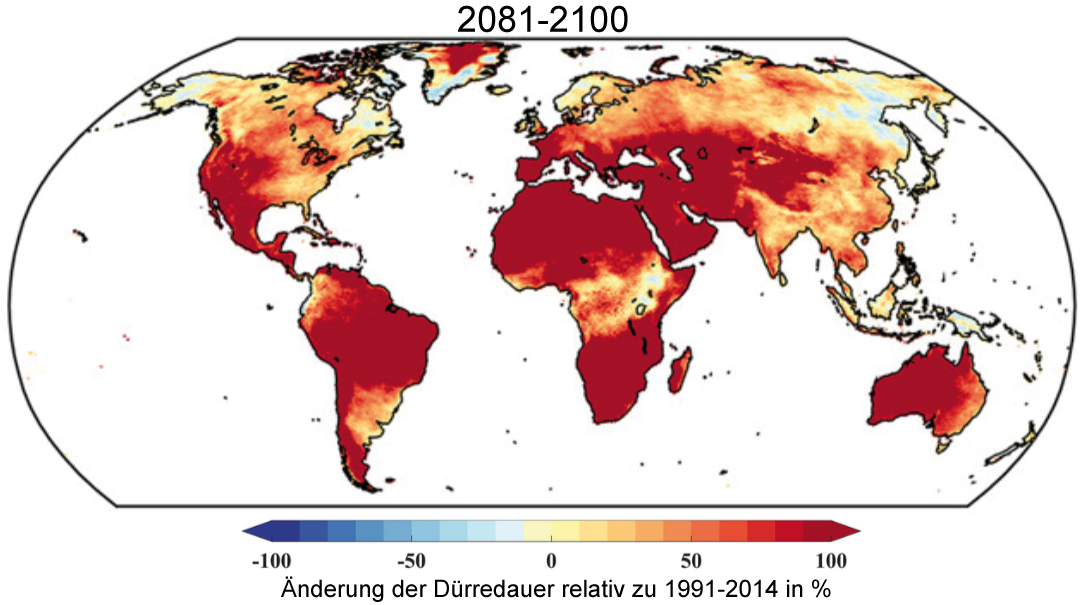
| 09:50, 20. Sep. 2023 | Drought-duration-regional-2100.jpg (Datei) |  |
261 KB | == Beschreibung == Regionale Änderung der Dauer von Dürreereignissen bis 2081-2100 relativ zu 1991-2014 in %. ==Lizenzhinweis== {| style="border:1px solid #8888aa; background-color:#f7f8ff;padding:5px;font-size:95%;" | Quelle: Wang, G., Zhang, Q., et al. (2023): [https://doi.org/10.1029/2022EF003420 Projecting global drought risk under various SSP-RCP scenarios]. Earth's Future, 11, e2022EF003420.<br> Lizenz: [http://creativecommons.org/licenses/by-nc-nd/4.0/ CC BY-NC-ND] |} | 1 |
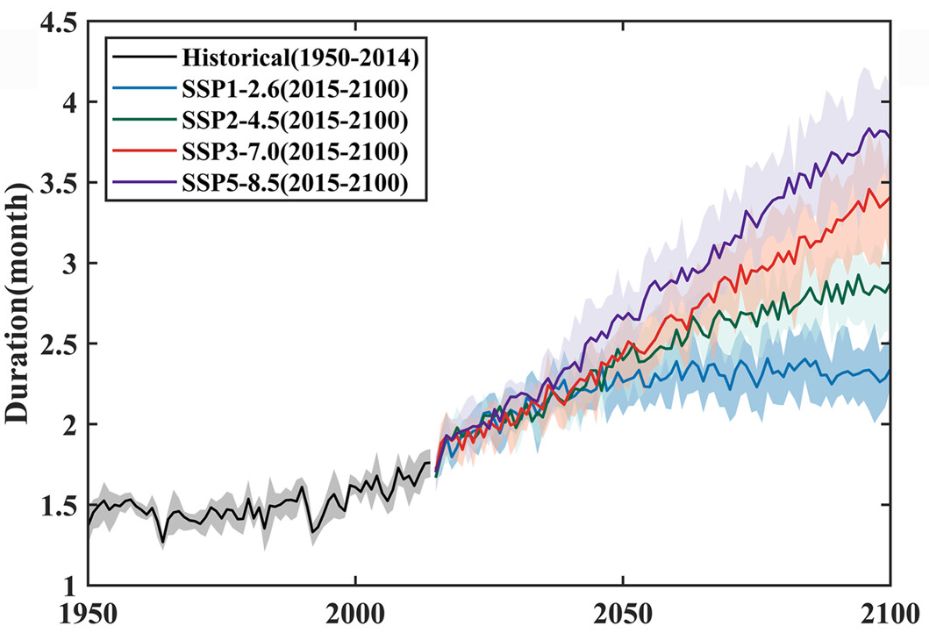
| 09:49, 20. Sep. 2023 | Drought duration 2015-2100.jpg (Datei) |  |
59 KB | == Beschreibung == Dauer von Dürreereignissen in Monaten 2015 bis 2100. ==Lizenzhinweis== {| style="border:1px solid #8888aa; background-color:#f7f8ff;padding:5px;font-size:95%;" | Quelle: Wang, G., Zhang, Q., et al. (2023): [https://doi.org/10.1029/2022EF003420 Projecting global drought risk under various SSP-RCP scenarios]. Earth's Future, 11, e2022EF003420.<br> Lizenz: [http://creativecommons.org/licenses/by-nc-nd/4.0/ CC BY-NC-ND] |} | 1 |
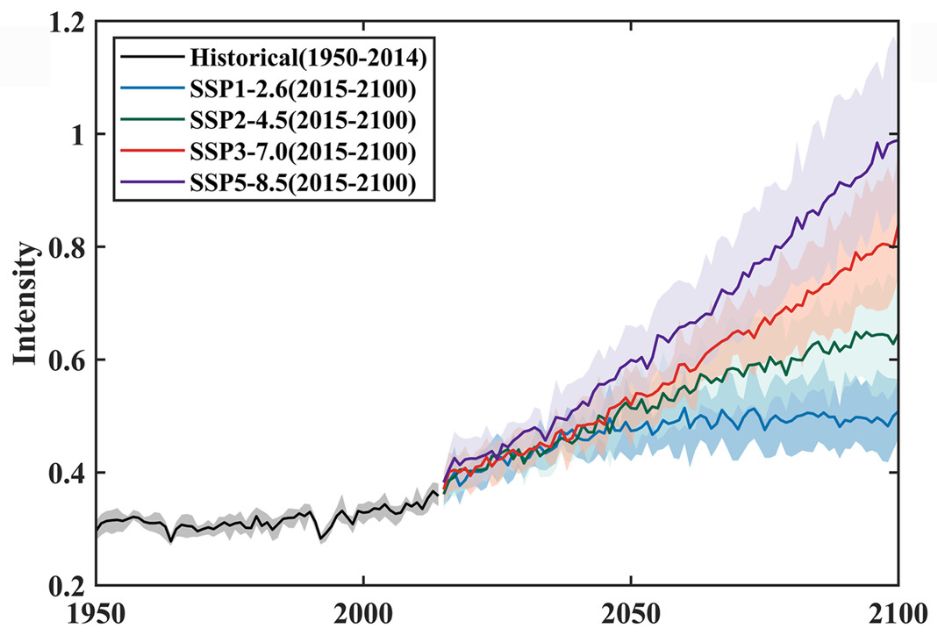
| 16:53, 19. Sep. 2023 | Drought intensity 2015-2100.jpg (Datei) |  |
54 KB | == Beschreibung == Dürrehäufigkeit in Ereignisse pro Jahr 2015 bis 2100. ==Lizenzhinweis== {| style="border:1px solid #8888aa; background-color:#f7f8ff;padding:5px;font-size:95%;" | Quelle: Wang, G., Zhang, Q., et al. (2023): [https://doi.org/10.1029/2022EF003420 Projecting global drought risk under various SSP-RCP scenarios]. Earth's Future, 11, e2022EF003420.<br> Lizenz: [http://creativecommons.org/licenses/by-nc-nd/4.0/ CC BY-NC-ND] |} | 1 |
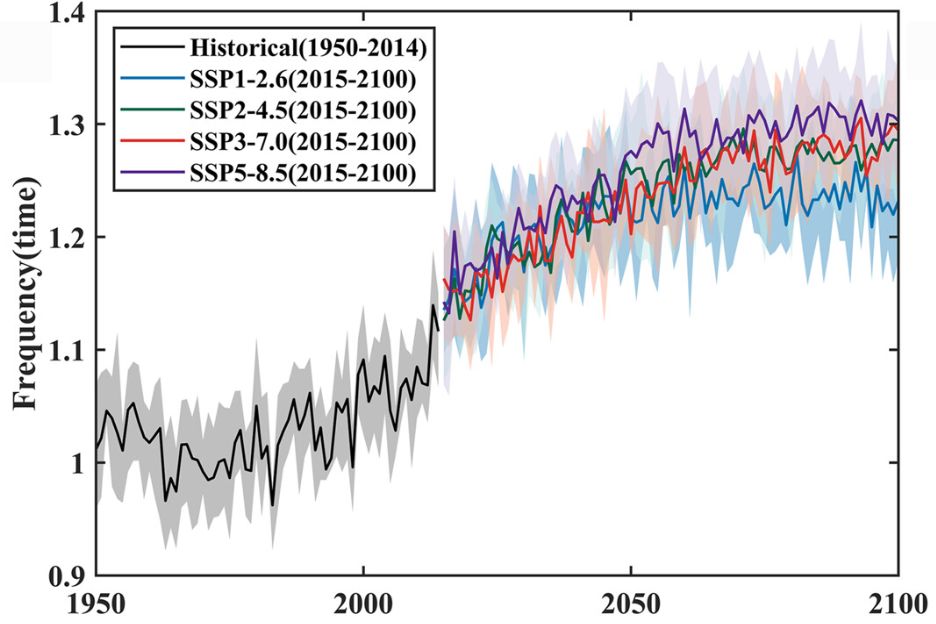
| 16:51, 19. Sep. 2023 | Drought frequency 2015-2100.jpg (Datei) |  |
66 KB | == Beschreibung == Dürrehäufigkeit in Ereignisse pro Jahr 2015 bis 2100. ==Lizenzhinweis== {| style="border:1px solid #8888aa; background-color:#f7f8ff;padding:5px;font-size:95%;" | Quelle: Wang, G., Zhang, Q., et al. (2023): Projecting global drought risk under various SSP-RCP scenarios. Earth's Future, 11, e2022EF003420. https://doi. org/10.1029/2022EF003420 <br> Lizenz: CC BY-NC-ND http://creativecommons.org/licenses/by-nc-nd/4.0/ |} | 1 |
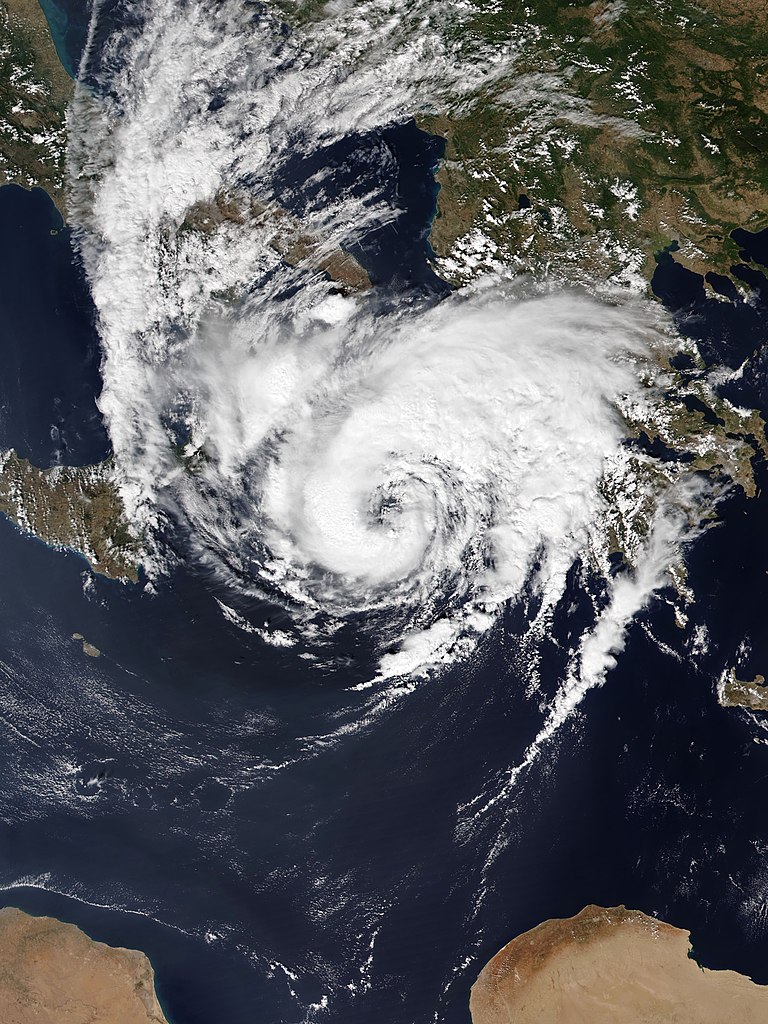
| 15:24, 14. Sep. 2023 | Medicane Ianos.jpg (Datei) |  |
266 KB | Medicane Ianos Zwischen Sizilien und Griechenland am 17.9.2020 Quelle: Wikipedia (2020): Medicane Ianos approaching Greece at peak intensity on 17 September 2020, https://commons.wikimedia.org/wiki/File:Ianos_2020-09-17_1140Z.jpg Lizenz: public domain, ursprgl. NASA | 1 |
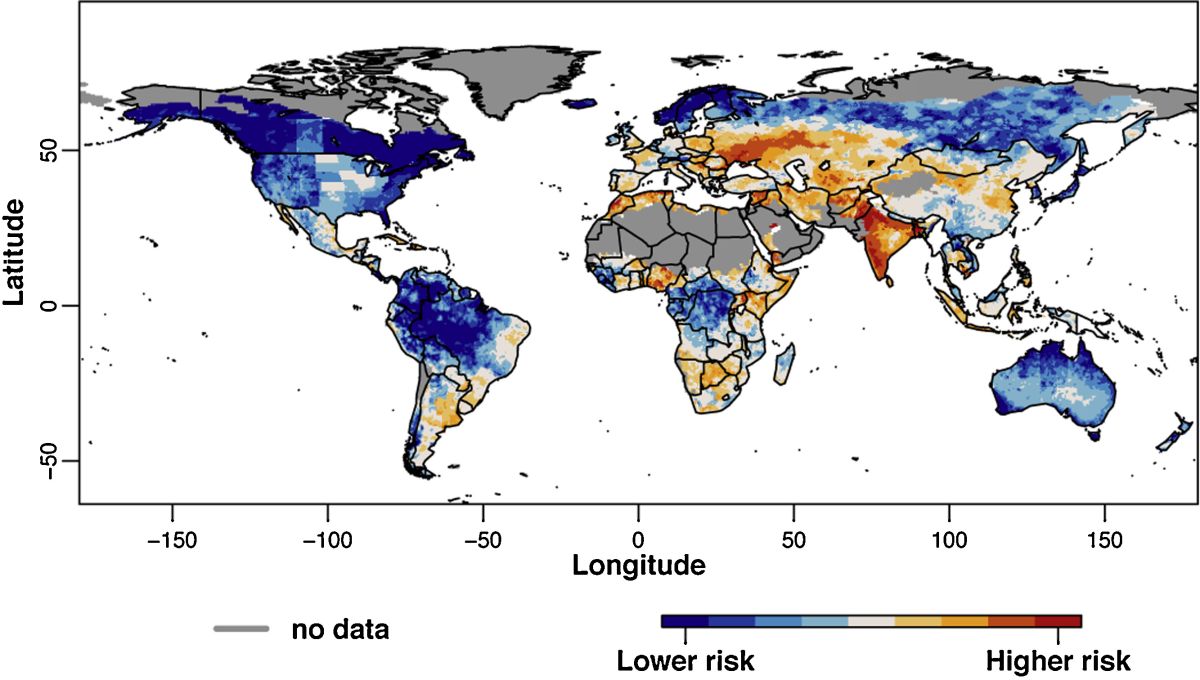
| 15:53, 13. Sep. 2023 | Global drought risk.jpg (Datei) |  |
124 KB | == Beschreibung == Globale Dürre-Risiko ==Lizenzhinweis== {| style="border:1px solid #8888aa; background-color:#f7f8ff;padding:5px;font-size:95%;" | Quelle: Carrão, H., G. Naumann and P. Barbosa (2016): Mapping global patterns of drought risk: an empirical framework based on sub-national estimates of hazard, exposure and vulnerability. Glob. Environ. Chang., 39, 108–124, doi:10.1016/j.gloenvcha.2016.04.012<br> Lizenz: [https://creativecommons.org/licenses/by/4.0/ CC BY] |} | 1 |
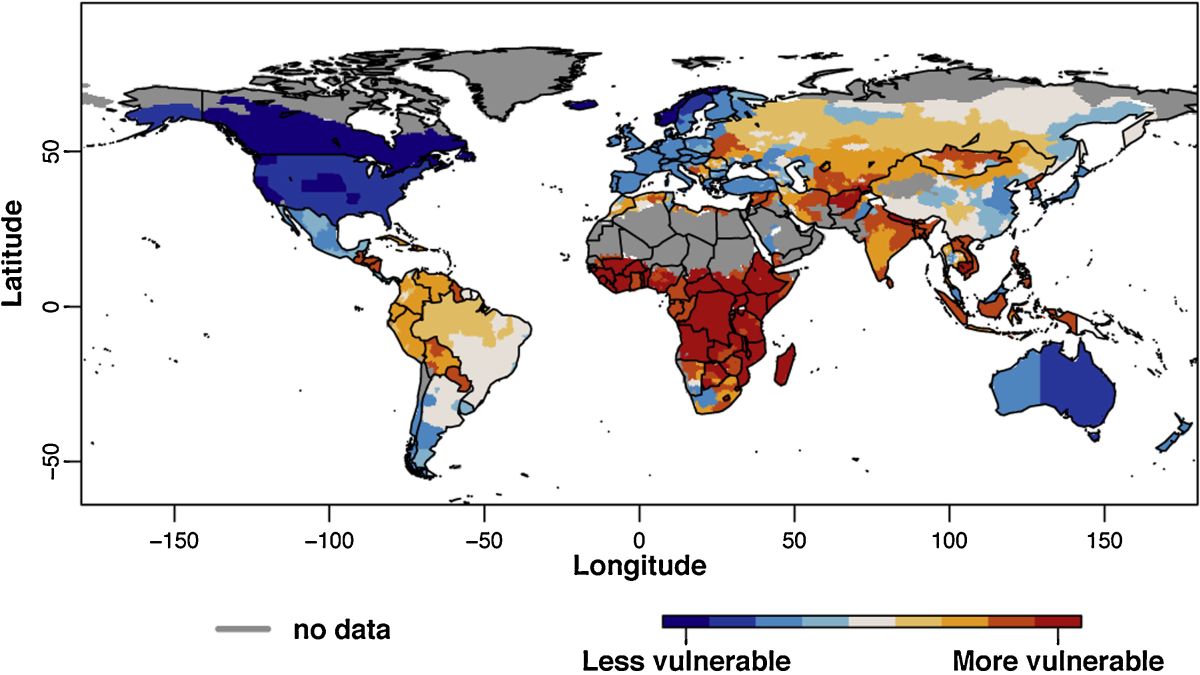
| 15:52, 13. Sep. 2023 | Global drought vulnerability.jpg (Datei) |  |
107 KB | == Beschreibung == Globale Verletzlichkeit durch Dürren ==Lizenzhinweis== {| style="border:1px solid #8888aa; background-color:#f7f8ff;padding:5px;font-size:95%;" | Quelle: Carrão, H., G. Naumann and P. Barbosa (2016): Mapping global patterns of drought risk: an empirical framework based on sub-national estimates of hazard, exposure and vulnerability. Glob. Environ. Chang., 39, 108–124, doi:10.1016/j.gloenvcha.2016.04.012<br> Lizenz: [https://creativecommons.org/licenses/by/4.0/ CC BY] |} | 1 |
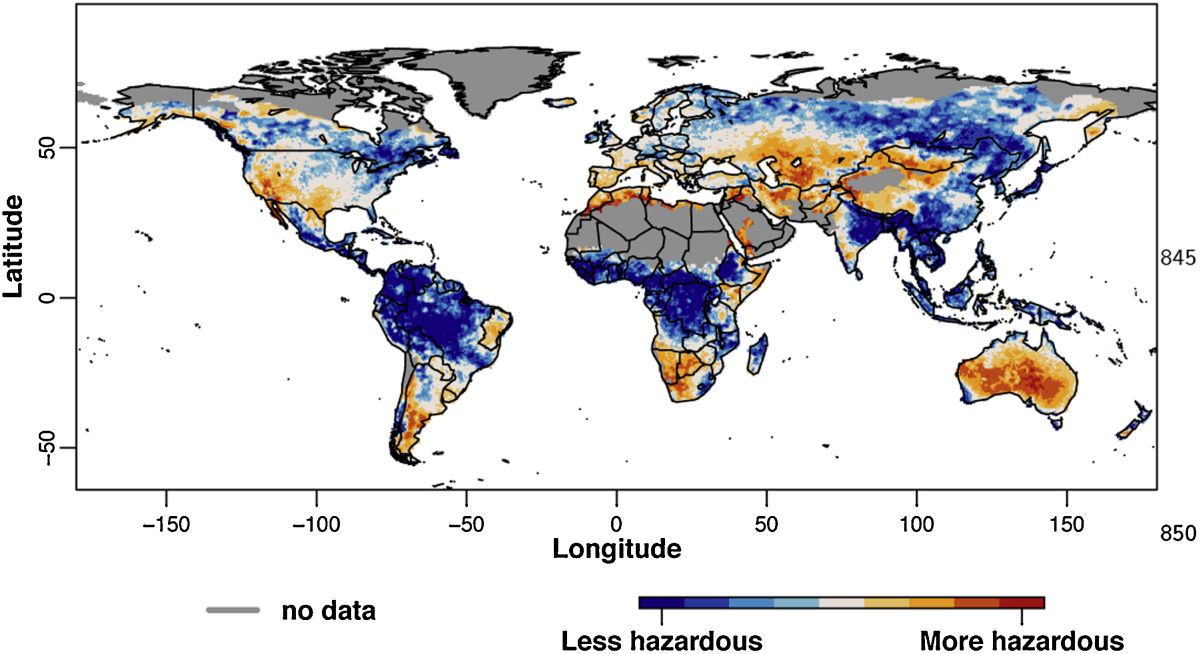
| 15:51, 13. Sep. 2023 | Global drought hazards.jpg (Datei) |  |
122 KB | == Beschreibung == Globale Dürre-Ereignisse ==Lizenzhinweis== {| style="border:1px solid #8888aa; background-color:#f7f8ff;padding:5px;font-size:95%;" | Quelle: Carrão, H., G. Naumann and P. Barbosa (2016): Mapping global patterns of drought risk: an empirical framework based on sub-national estimates of hazard, exposure and vulnerability. Glob. Environ. Chang., 39, 108–124, doi:10.1016/j.gloenvcha.2016.04.012<br> Lizenz: [https://creativecommons.org/licenses/by/4.0/ CC BY] |} | 1 |
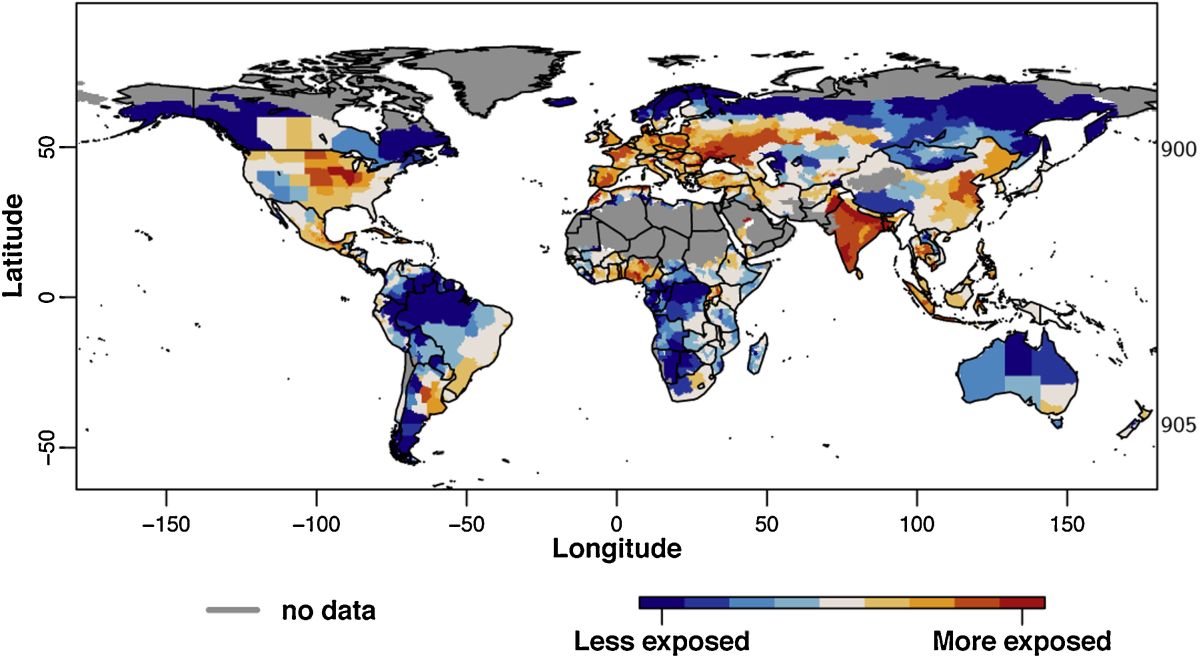
| 15:48, 13. Sep. 2023 | Global drought exposure.jpg (Datei) |  |
107 KB | == Beschreibung == Anteil von Dürregebieten an der globalen Landfläche. Die Abb. zeigt farbig unterschiedlich starke Dürren entsprechend ihrer Dauer: blau = schwache Dürre (3 Monate -Dauer), orange = starke Dürre (6 Monate), rot = extreme Dürre (12 Monate). ==Lizenzhinweis== {| style="border:1px solid #8888aa; background-color:#f7f8ff;padding:5px;font-size:95%;" | Quelle: Carrão, H., G. Naumann and P. Barbosa (2016): Mapping global patterns of drought risk: an empirical framework based on sub-n… | 1 |
| 17:24, 12. Sep. 2023 | HH Sommer- Frosttage 1951-2020.jpg (Datei) |  |
44 KB | Veränderung der Anzahl der Sommer- und der Frosttage 1951 bis 2020 == Lizenzhinweis == {| style="border:1px solid #8888aa; background-color:#f7f8ff;padding:5px;font-size:95%;" |Quelle: DWD (2021): Klimareport Hamburg; Deutscher Wetterdienst, Offenbach am Main Lizenz: CC BY-NC-ND http://creativecommons.org/licenses/by-nc-nd/4.0/deed.de |} | 1 |
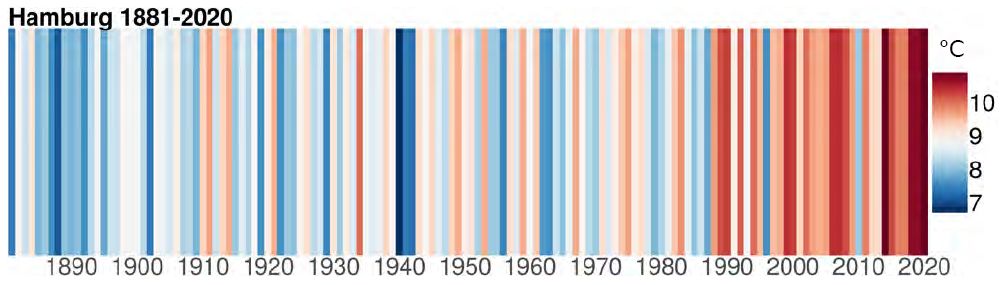
| 09:07, 12. Sep. 2023 | HH 1881-2020 climate stripes.jpg (Datei) |  |
46 KB | == Beschreibung == Klima-Streifen für Hamburg 1881-2020 ==Lizenzhinweis== {| style="border:1px solid #8888aa; background-color:#f7f8ff;padding:5px;font-size:95%;" | Quelle: DWD (2021): Klimareport Hamburg; Deutscher Wetterdienst, Offenbach am Main https://www.dwd.de/DE/leistungen/klimareports/klimareport_hh_2021_download.html <br> Lizenz: CC BY-NC-ND http://creativecommons.org/licenses/by-nc-nd/4.0/deed.de | 1 |
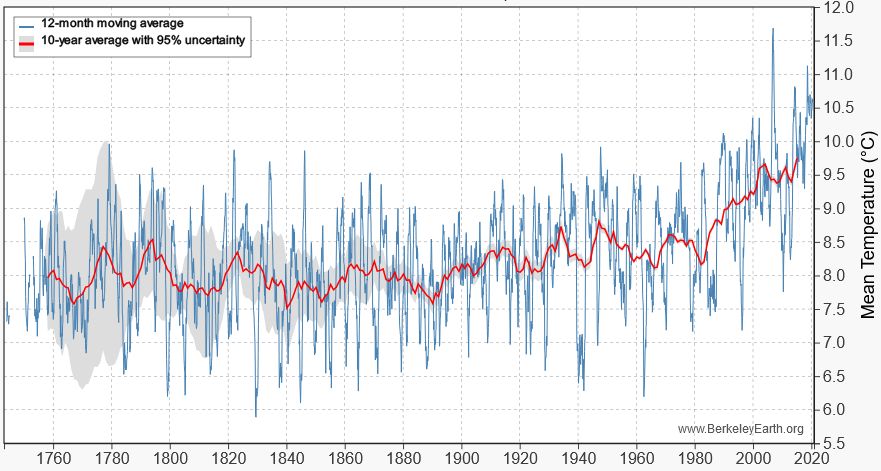
| 08:50, 12. Sep. 2023 | Hamburg temp 1760-2020.jpg (Datei) |  |
78 KB | Änderung der Jahresmitteltemperatur in Hamburg 1760-2020 ==Lizenzhinweis== {| style="border:1px solid #8888aa; background-color:#f7f8ff;padding:5px;font-size:95%;" | Quelle: Berkeley Earth (2021): Local Climate Change, Hamburg, http://berkeleyearth.lbl.gov/locations/53.84N-9.55E# <br> Lizenz: ??? | 1 |
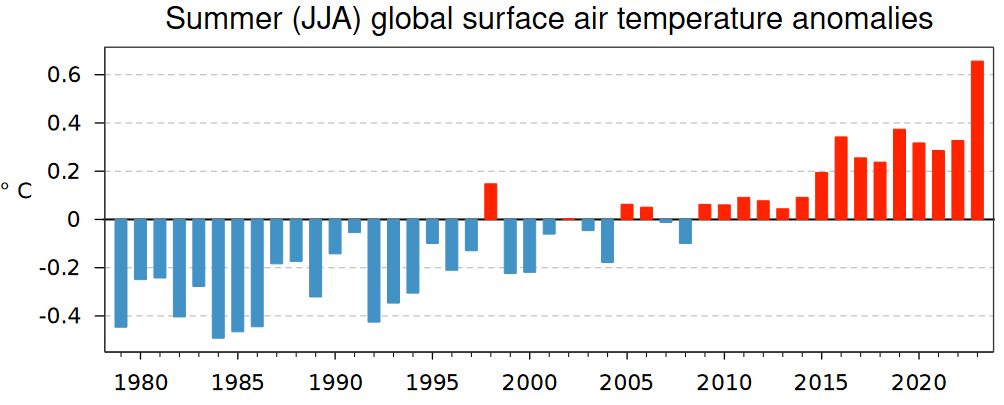
| 17:11, 10. Sep. 2023 | Summer temp global 1979-2023.jpg (Datei) |  |
51 KB | == Beschreibung == Die global wärmsten Sommer 1940-2023 im Vergleich zu 1991-2020 ==Lizenzhinweis== {| style="border:1px solid #8888aa; background-color:#f7f8ff;padding:5px;font-size:95%;" | Quelle: Copernicus (2023): Surface air temperature for August 2023 https://climate.copernicus.eu/surface-air-temperature-august-2023 <br> Lizenz: Reproduction of the publicly available content of this website is authorised, provided the source is acknowledged, save where otherwise stated. https://climat… | 1 |
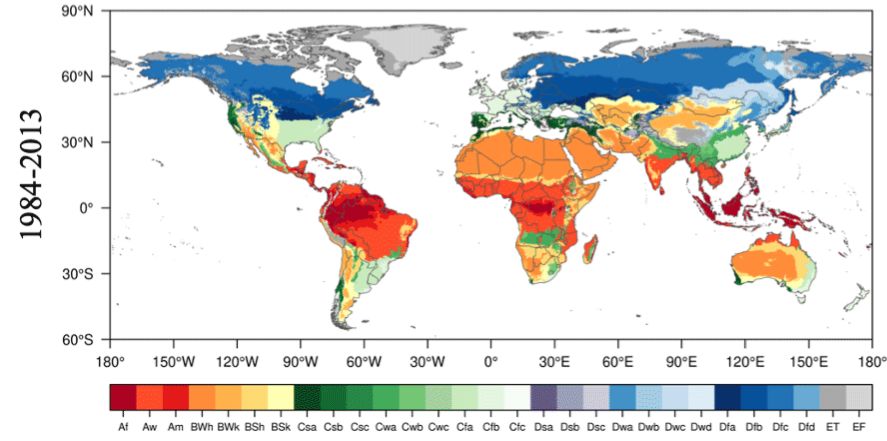
| 08:15, 8. Sep. 2023 | K-G Klimazonen 1984-2013.jpg (Datei) |  |
56 KB | == Beschreibung == Räumliche und zeitliche Skalen typischer Antriebskräfte von Hitzewellen. ==Lizenzhinweis== {| style="border:1px solid #8888aa; background-color:#f7f8ff;padding:5px;font-size:95%;" | Quelle: Sieekns etc.<br> Lizenz: [http://creativecommons.org/licenses/by/4.0 CC BY] |} | 1 |
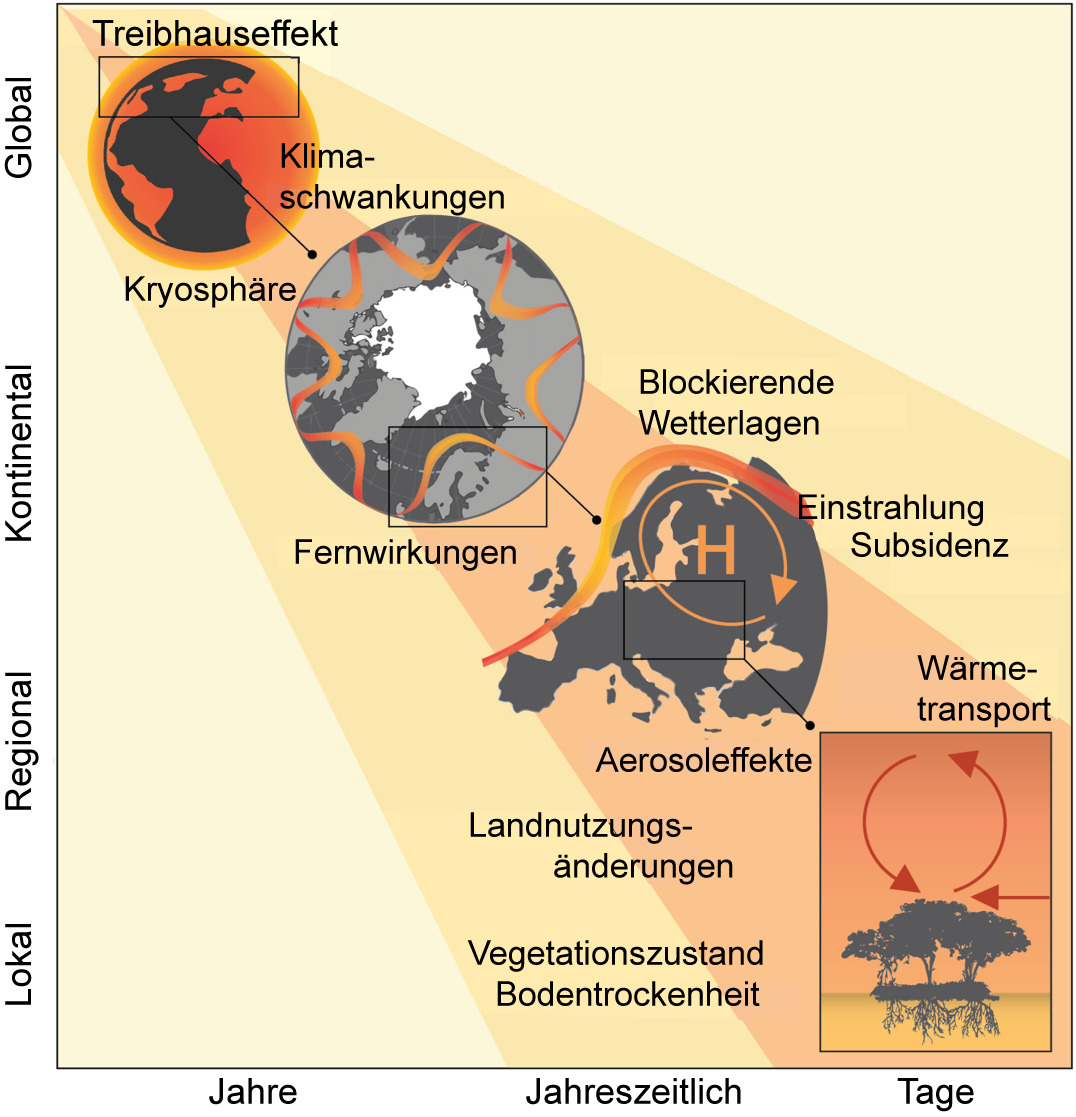
| 18:06, 4. Sep. 2023 | Antriebskräfte-Hitzewellen.jpg (Datei) |  |
417 KB | == Beschreibung == Räumliche und zeitliche Skalen typischer Antriebskräfte von Hitzewellen. ==Lizenzhinweis== {| style="border:1px solid #8888aa; background-color:#f7f8ff;padding:5px;font-size:95%;" | Quelle: Barriopedro, D., R. García-Herrera, C. Ordóñez et al. (2023): [https://doi.org/10.1029/2022RG000780 Heat waves: Physical understanding and scientific challenges.] Reviews of Geophysics 61, e2022RG000780. - übersetzt<br> Lizenz: [http://creativecommons.org/licenses/by/4.0 CC BY] |} | 1 |
| 16:20, 4. Sep. 2023 | Hitzewellentage-2-4°C.jpg (Datei) |  |
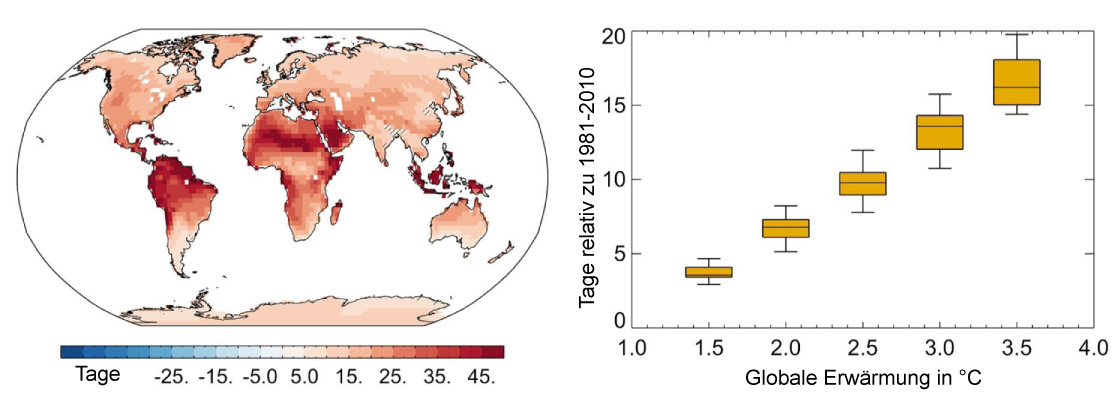
141 KB | Links: regionale Zunahme der Tage mit Hitzewellen im Vergleich zum Mittel 1981-2010 bei einer globalen Erwärmung um 2,0 °C, rechts: globale Zunahme der Tage mit Hitzewellen im Vergleich zum Mittel 1981-2010 bei verschiedenen Niveaus globaler Erwärmung. ==Lizenzhinweis== {| style="border:1px solid #8888aa; background-color:#f7f8ff;padding:5px;font-size:95%;" | Quelle: Barriopedro, D., R. García-Herrera, C. Ordóñez et al. (2023): [https://doi.org/10.1029/2022RG000780 Heat waves: Physical understa… | 1 |
| 19:27, 28. Aug. 2023 | N-America 2021 temp-exceedance.jpg (Datei) |  |
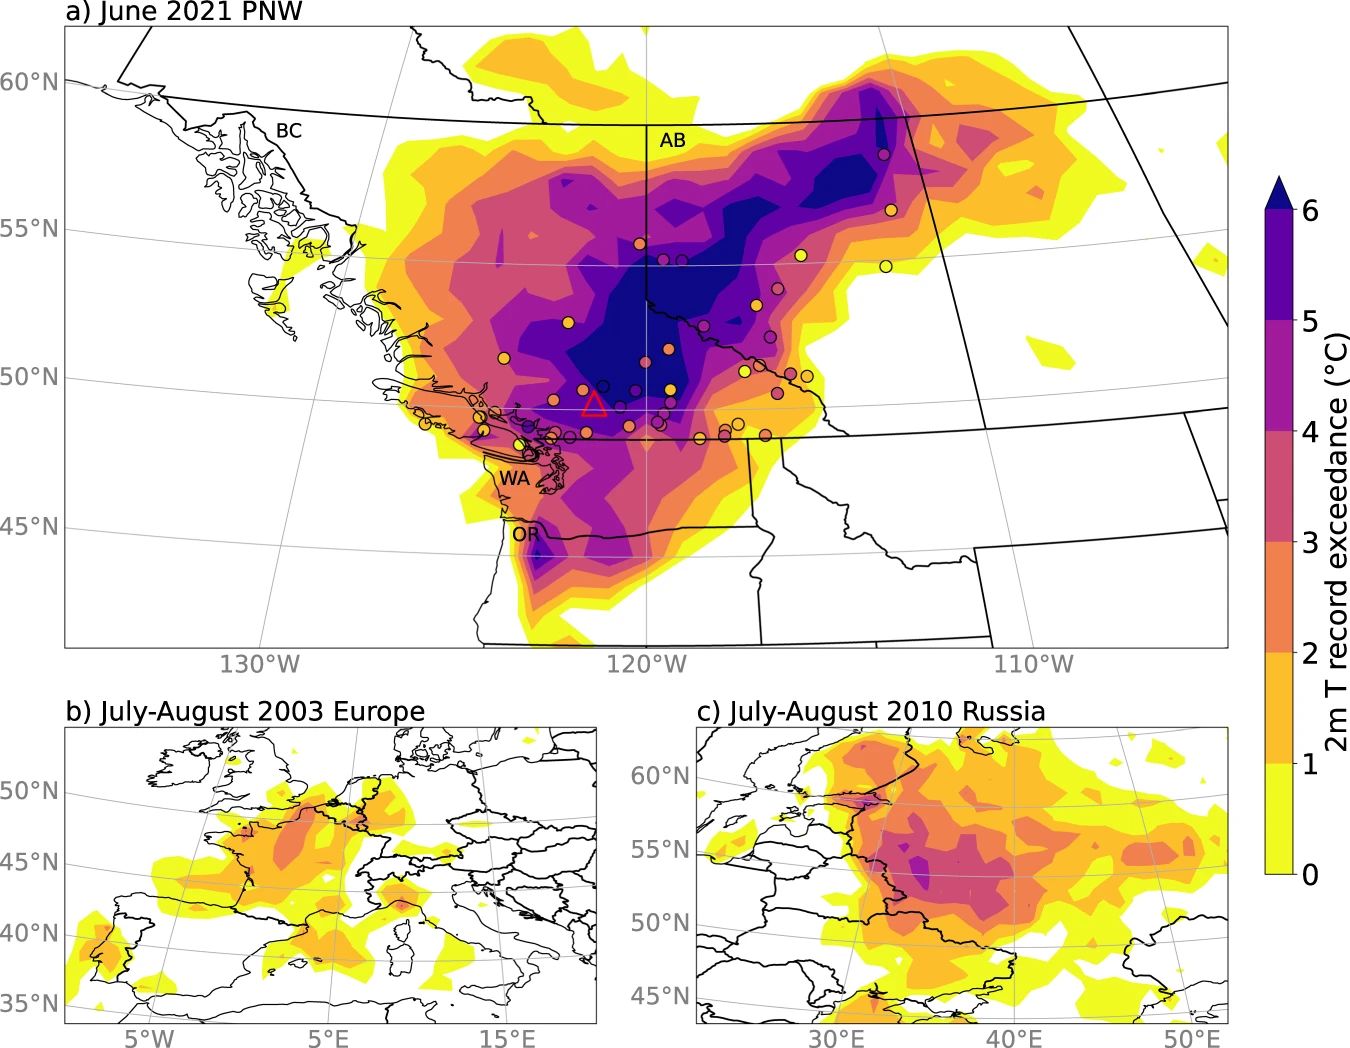
193 KB | == Beschreibung == Überschreitung vorheriger Temperaturrekorde während der Hitzewelle im Juni 2021 im Nordwesten der USA und westlichen Kanada (oben) und während der Hitzewellen 2003 in Europa und 2010 in Russland. ==Lizenzhinweis== {| style="border:1px solid #8888aa; background-color:#f7f8ff;padding:5px;font-size:95%;" | Quelle: White, R.H., S. Anderson, J.F. Booth et al. (2023): [https://doi.org/10.1038/s41467-023-36289-3 The unprecedented Pacific Northwest heatwave of June 2021]. Nat Comm… | 1 |
| 19:07, 28. Aug. 2023 | N-America heat 2021 temp-anomaly.jpg (Datei) |  |
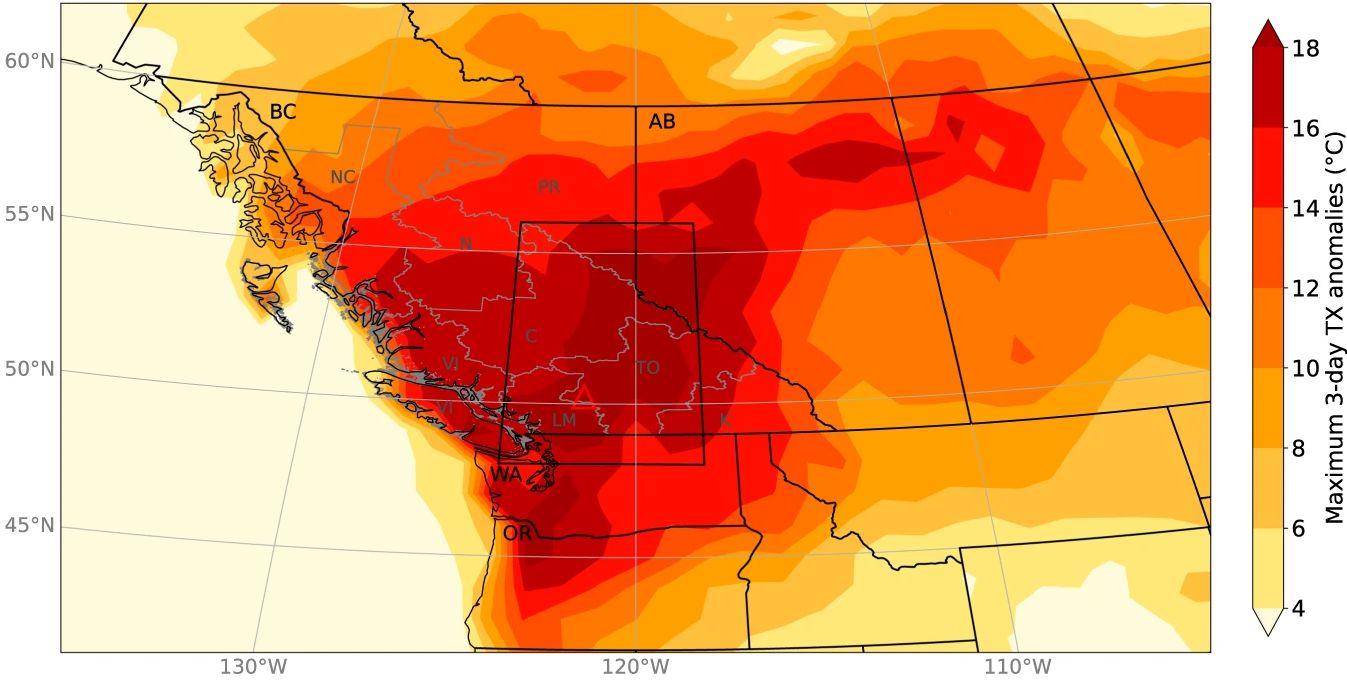
102 KB | == Beschreibung == Temperaturabweichungen am 27. Juni 2021 vom Mittel 2014-2020 am selben Tag ==Lizenzhinweis== {| style="border:1px solid #8888aa; background-color:#f7f8ff;padding:5px;font-size:95%;" | Quelle: NASA Earth Observational (2021): Exceptional Heat Hits Pacific Northwest https://earthobservatory.nasa.gov/images/148506/exceptional-heat-hits-pacific-northwest<br /> Lizenz: public domain |} | 1 |
| 17:44, 28. Aug. 2023 | Europe temp 1950-2022 summer.png (Datei) |  |
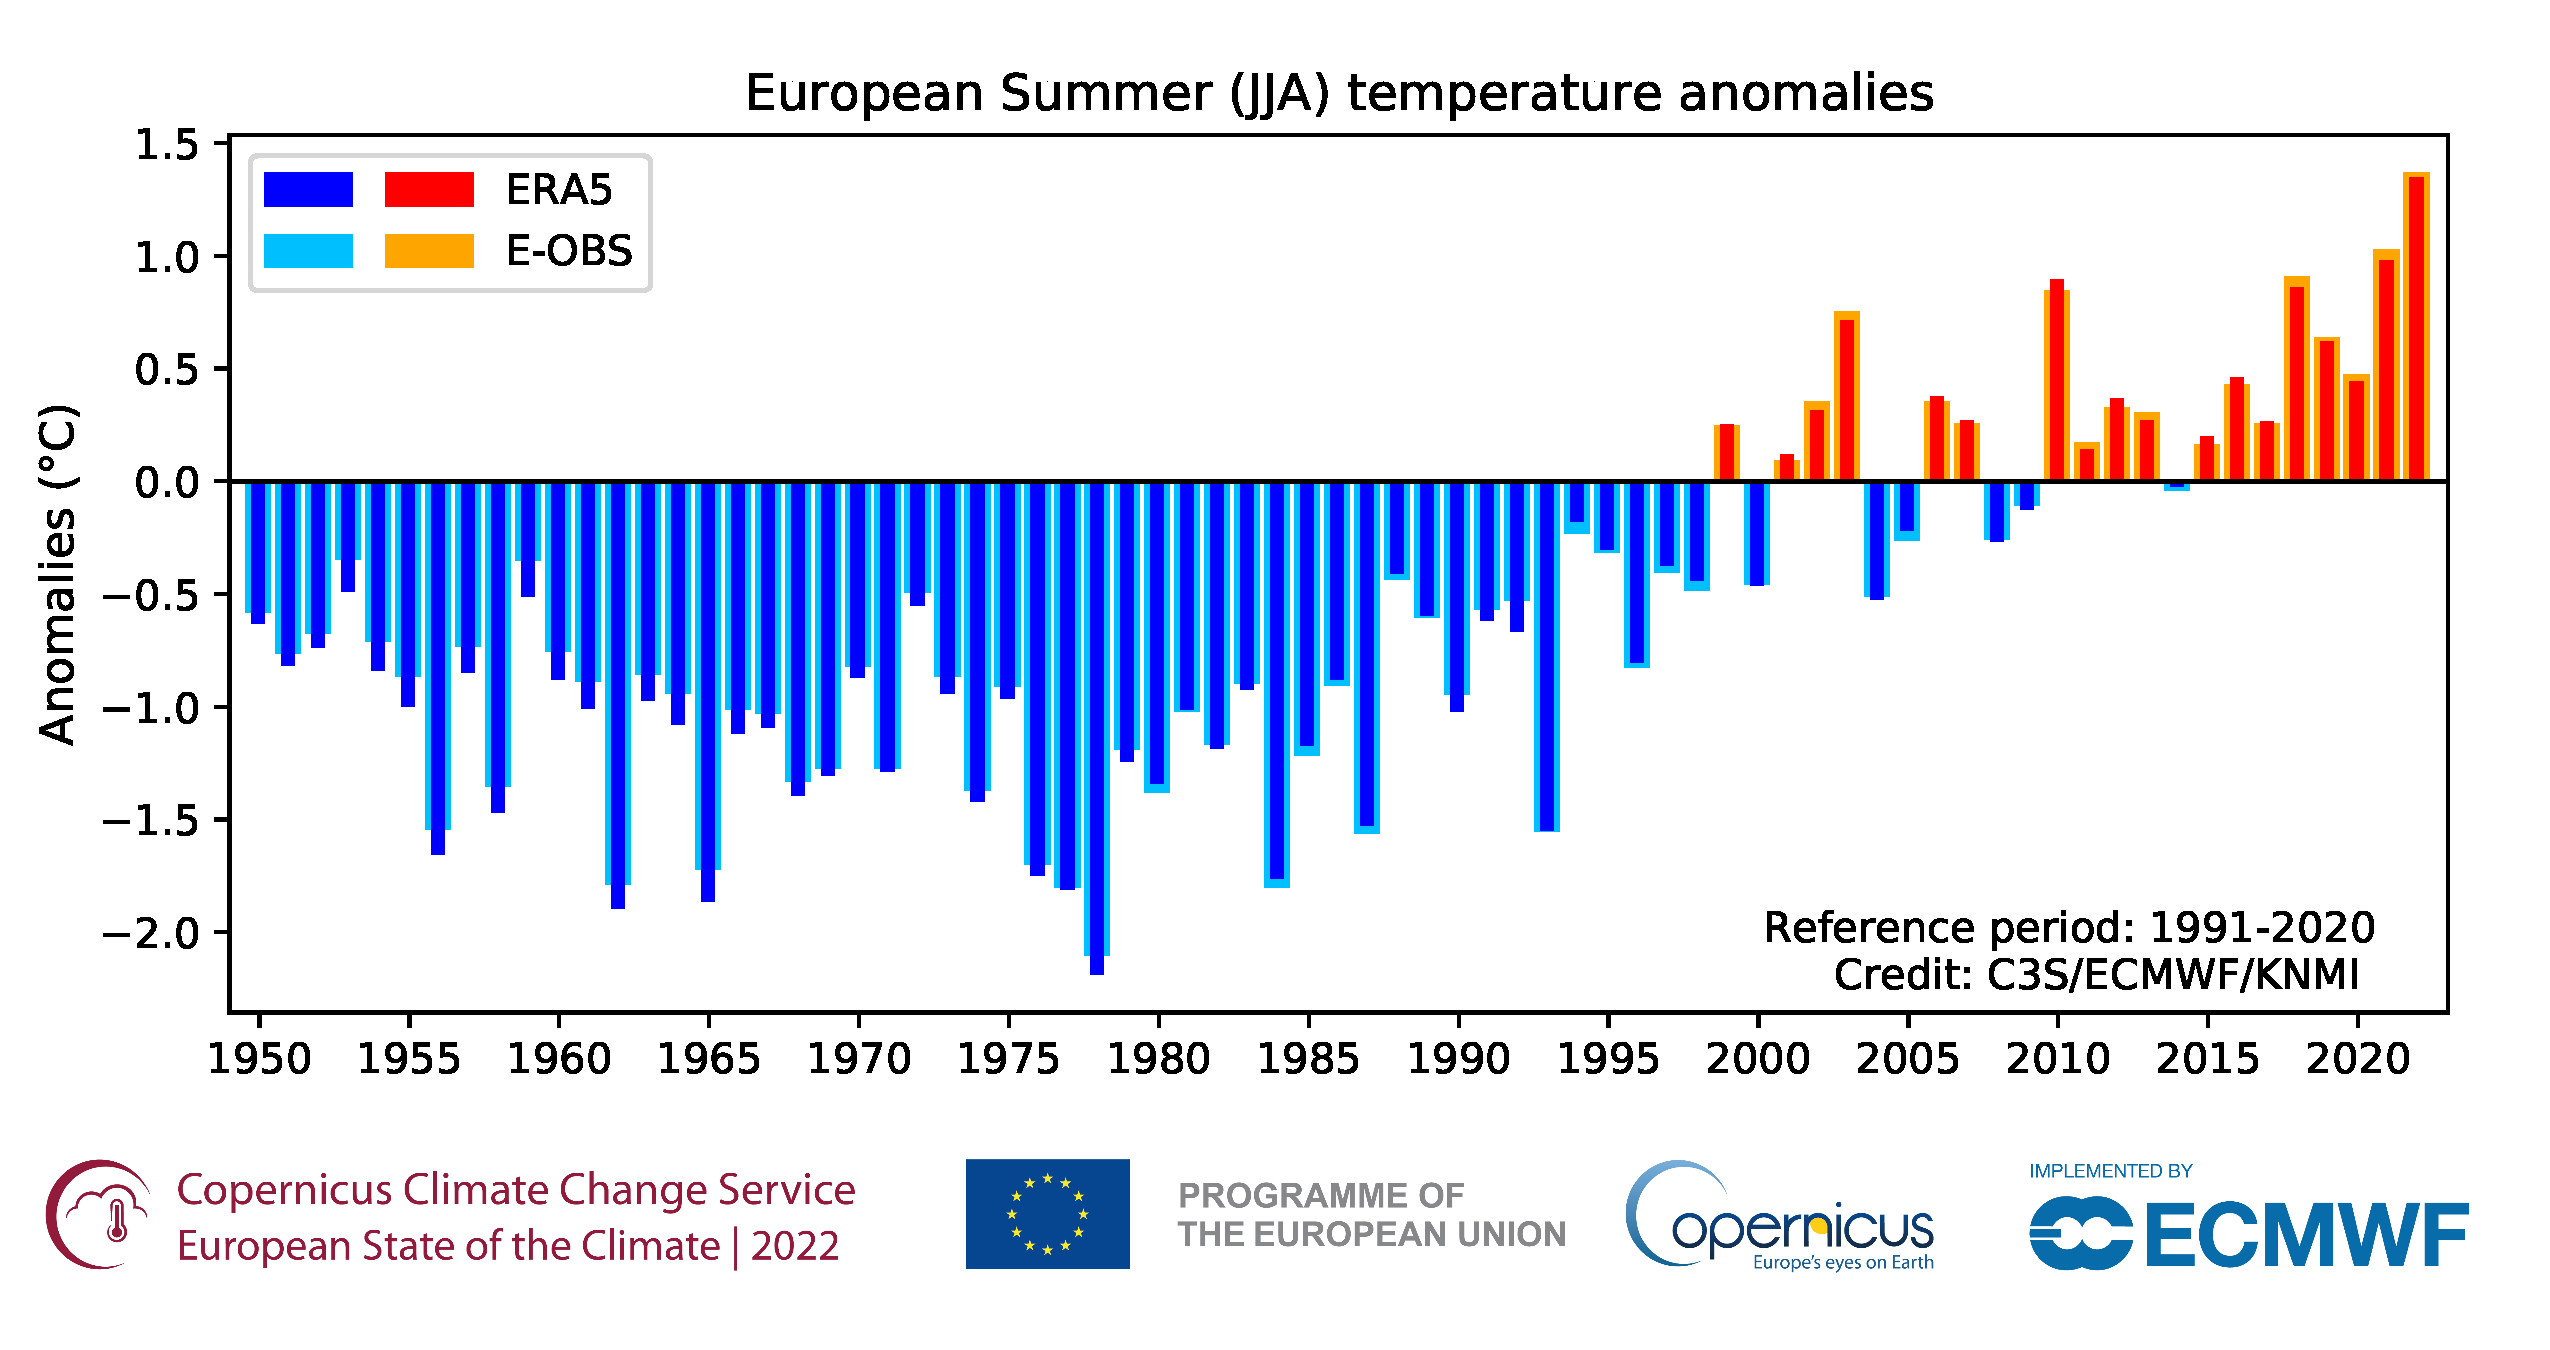
93 KB | == Beschreibung == Abweichung der europäischen Sommertemperaturen 1950-2022 vom Mittel 1991-2020 ==Lizenzhinweis== {| style="border:1px solid #8888aa; background-color:#f7f8ff;padding:5px;font-size:95%;" | Quelle: Copernicus Climate Change (2022): Temperature; https://climate.copernicus.eu/esotc/2022/temperature, <br> Lizenz: [https://climate.copernicus.eu/disclaimer-and-privacy Reproduction of the publically available content of this website is authorised, provided the source is acknowled… | 1 |
| 14:57, 28. Aug. 2023 | Heatwave April 2023 W-Mediterranean.jpg (Datei) |  |
44 KB | == Beschreibung == Abweichung der maximalen Tagestemperatur am 26.-28.4.2023 im Vergleich zum Mittel 1991-2020 ==Lizenzhinweis== {| style="border:1px solid #8888aa; background-color:#f7f8ff;padding:5px;font-size:95%;" | Quelle: Philip, S., S. Kew1, R. Vautard et al. (2023): Extreme April heat in Spain, Portugal, Morocco & Algeria almost impossible without climate change <br> Lizenz: [https://climate.copernicus.eu/disclaimer-and-privacy Reproduction of the publically available content of th… | 1 |
| 10:36, 14. Aug. 2023 | Temp SSP 1-2-3-5 2100.jpg (Datei) |  |
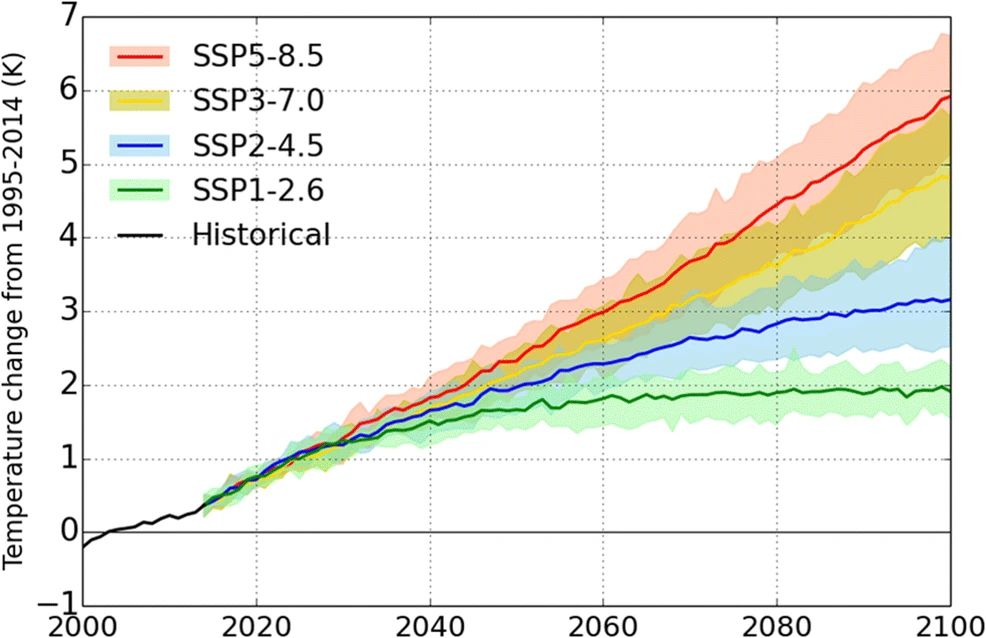
69 KB | == Beschreibung == Änderung der globalen Mitteltemperatur von 2000 bis Ende des 21. Jahrhunderts im Vergleich zur gegenwärtigen Vergleichsperiode 1995-2014 nach verschiedenen SSP-Szenarien == Lizenzhinweis == {| style="border:1px solid #8888aa; background-color:#f7f8ff;padding:5px;font-size:95%;" | Quelle: Sung, H.M., Kim, J., Shim, S. et al. (2021): Climate Change Projection in the Twenty-First Century Simulated by NIMS-KMA CMIP6 Model Based on New GHGs Concentration Pathways. Asia-Pacific J A… | 1 |
| 10:32, 14. Aug. 2023 | Temp 1850-2100 SSP-Szenarien.jpg (Datei) |  |
214 KB | Änderung der globalen Mitteltemperatur 1850 bis 2100 nach Beobachtungen (gelb) und SSP-Szenarien. Control: Kontrolllauf ohne menschlichen Einfluss. == Lizenzhinweis == {| style="border:1px solid #8888aa; background-color:#f7f8ff;padding:5px;font-size:95%;" | Quelle: DKRZ: CMIP6 Aktivitäten am DKRZ, https://www.dkrz.de/de/kommunikation/klimasimulationen/cmip6-de/cmip6-aktivitaeten-am-dkrz-ueberblick?set_language=de<br /> Lizenz: CC BY-NC-SA |} | 1 |
| 17:51, 11. Aug. 2023 | D Temp 2000-2100.png (Datei) |  |
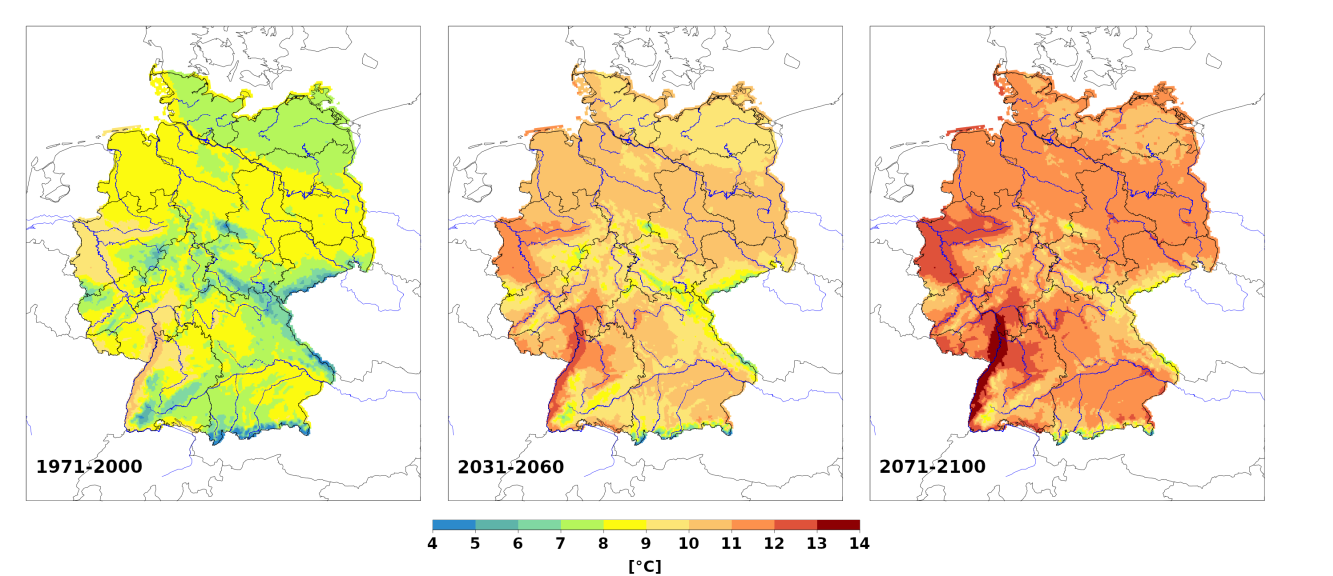
405 KB | 30-Jahresmittel für den historischen Zeitraum (1971-2000, links), die nahe Zukunft (2031-2060, Mitte) und die ferne Zukunft (2071-2100, rechts). Die Projektionen für nahe und ferne Zukunft wurden mit dem RCP8.5-Szenario gerechnet. == Lizenzhinweis == {| style="border:1px solid #8888aa; background-color:#f7f8ff;padding:5px;font-size:95%;" |DWD (?): Klimawandel – ein Überblick, https://www.dwd.de/DE/klimaumwelt/klimawandel/klimawandel_node.html |} | 1 |
| 16:56, 11. Aug. 2023 | D prec Winter Sommer 2100.jpg (Datei) |  |
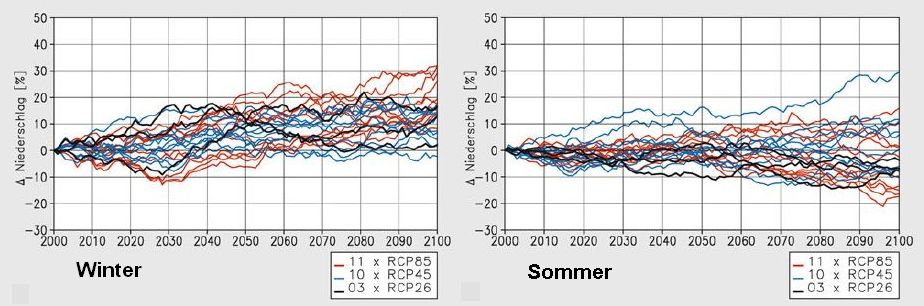
64 KB | Änderungen des Niederschlags im Winter (links) und im Sommer (rechts) nach verschiedenen Szenarien und Modellläufen. == Lizenzhinweis == {| style="border:1px solid #8888aa; background-color:#f7f8ff;padding:5px;font-size:95%;" |Quelle: Brasseur, G.P., D. Jacob, S. Schuck-Zöller (Hrsg.; 2017): Klimawandel in Deutschland, Entwicklung, Folgen, Risiken und Perspektiven, Berlin Heidelberg<br> Lizenz: [https://creativecommons.org/licenses/by/4.0/deed.de CC BY] |} | 1 |
| 16:41, 11. Aug. 2023 | D temp 1881-2100.jpg (Datei) |  |
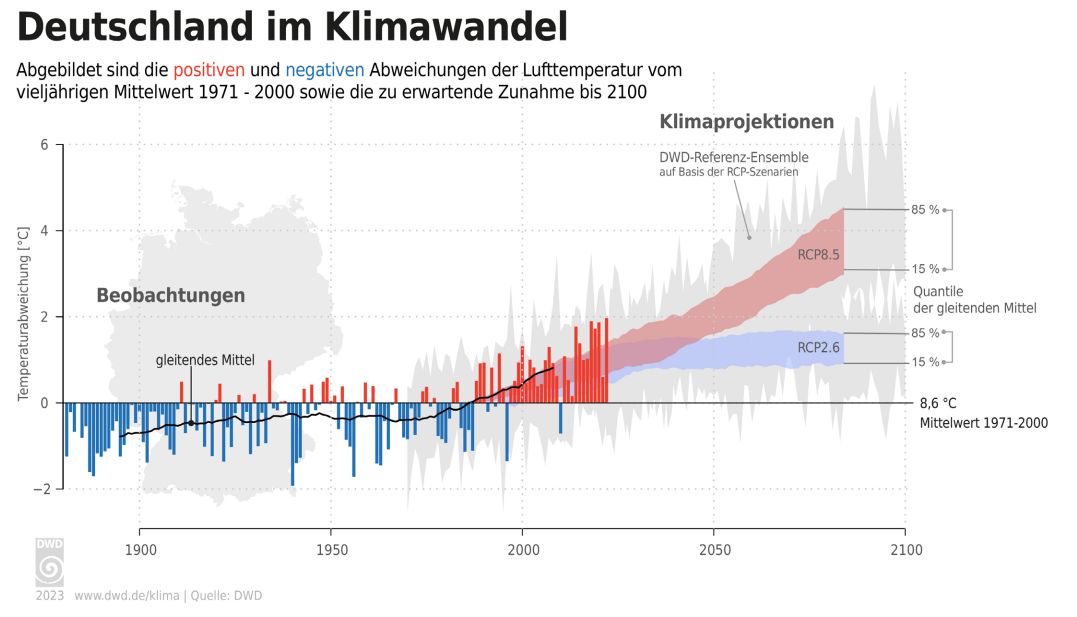
70 KB | 2 | |
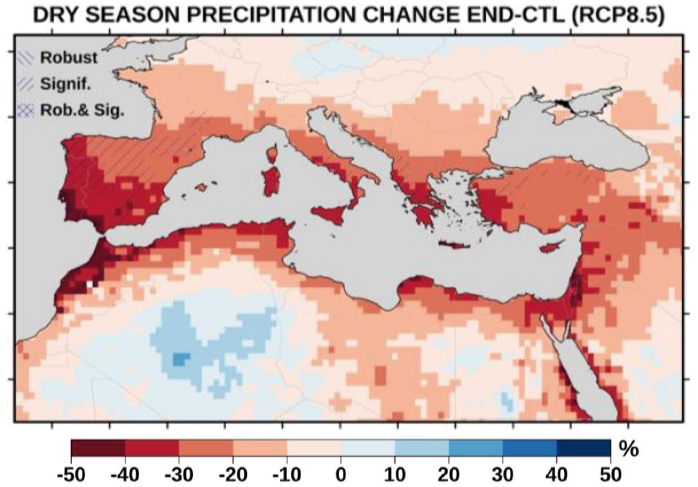
| 14:41, 9. Aug. 2023 | Mediterranea prec RCP8.5 summer 2100.jpg (Datei) |  |
187 KB | == Beschreibung == Änderung der Sommer-Niederschläge in % nach dem Szenario RCP8.5 im Mittelmeerraum bis 2100. ==Lizenzhinweis== {| style="border:1px solid #8888aa; background-color:#f7f8ff;padding:5px;font-size:95%;" | Quelle: Zittis, G., P. Hadjinicolaou, M. Klangidou, et al. (2019): [https://doi.org/10.1007/s10113-019-01565-w A multi-model, multi-scenario, and multi-domain analysis of regional climate projections for the Mediterranean.] Reg Environ Change 19, 2621–2635. <br> Lizenz: [htt… | 1 |
| 14:40, 9. Aug. 2023 | Mediterranean-prec-RCP8.5.jpg (Datei) |  |
190 KB | == Beschreibung == Änderung der Jahres-Niederschläge in % nach dem Szenario RCP8.5 im Mittelmeerraum bis 2100. ==Lizenzhinweis== {| style="border:1px solid #8888aa; background-color:#f7f8ff;padding:5px;font-size:95%;" | Quelle: Zittis, G., P. Hadjinicolaou, M. Klangidou, et al. (2019): [https://doi.org/10.1007/s10113-019-01565-w A multi-model, multi-scenario, and multi-domain analysis of regional climate projections for the Mediterranean.] Reg Environ Change 19, 2621–2635. <br> Lizenz: [htt… | 1 |
| 14:38, 9. Aug. 2023 | NE-Mediterranean temp 2100.jpg (Datei) |  |
99 KB | == Beschreibung == Änderung der Jahresmitteltemperatur im nordöstlichen Mittelmeerraum 1950 bis 2100. ==Lizenzhinweis== {| style="border:1px solid #8888aa; background-color:#f7f8ff;padding:5px;font-size:95%;" | Quelle: Zittis, G., P. Hadjinicolaou, M. Klangidou, et al. (2019): [https://doi.org/10.1007/s10113-019-01565-w A multi-model, multi-scenario, and multi-domain analysis of regional climate projections for the Mediterranean.] Reg Environ Change 19, 2621–2635. <br> Lizenz: [http://creat… | 1 |
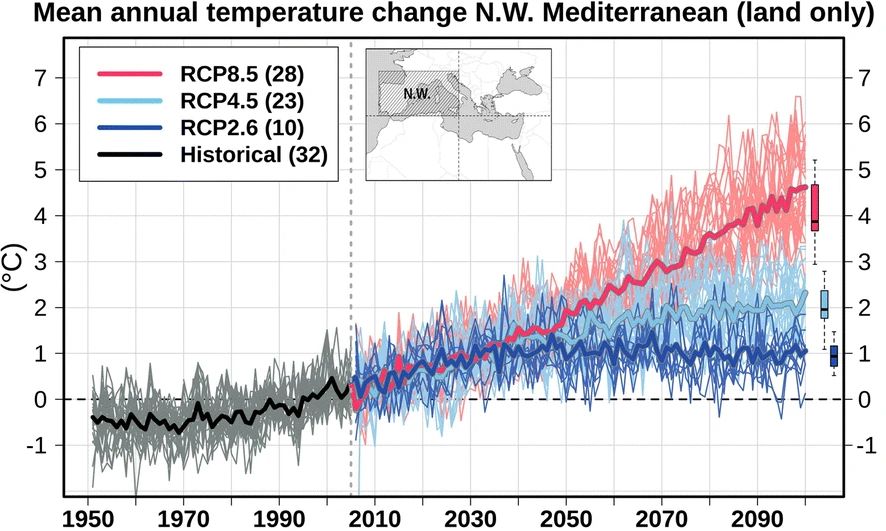
| 14:33, 9. Aug. 2023 | NW-Mediterranean temp 2100.jpg (Datei) |  |
94 KB | == Beschreibung == Änderung der Jahresmitteltemperatur im nordwestlichen Mittelmeerraum 1950 bis 2100. ==Lizenzhinweis== {| style="border:1px solid #8888aa; background-color:#f7f8ff;padding:5px;font-size:95%;" | Quelle: Zittis, G., P. Hadjinicolaou, M. Klangidou, et al. (2019): A multi-model, multi-scenario, and multi-domain analysis of regional climate projections for the Mediterranean. Reg Environ Change 19, 2621–2635. https://doi.org/10.1007/s10113-019-01565-w <br> Lizenz: CC BY, http://… | 1 |
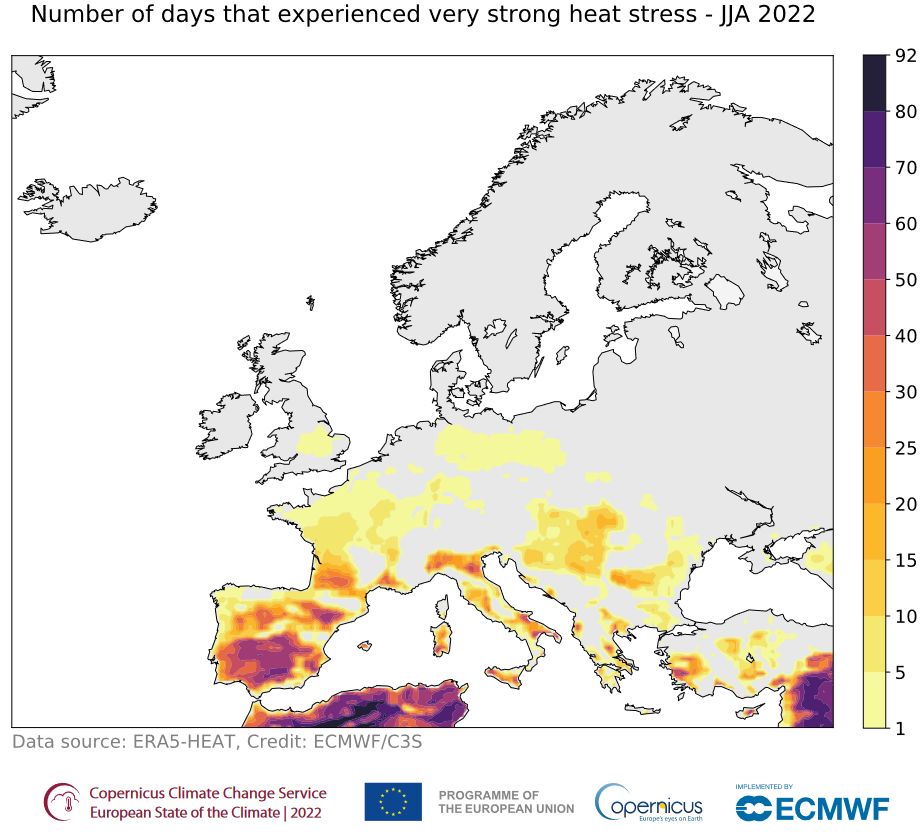
| 12:17, 9. Aug. 2023 | EU strong heat stress JJA 2022.jpg (Datei) |  |
104 KB | == Beschreibung == Anzahl der Tage unter sehr starkem Hitzestress (38-46 °C) im Sommer 2022 ==Lizenzhinweis== {| style="border:1px solid #8888aa; background-color:#f7f8ff;padding:5px;font-size:95%;" | Quelle: Copernicus Climate Change (2023): [https://climate.copernicus.eu/esotc/2022/extreme-heat European State oft the Climate 2022. Extreme heat], <br> Lizenz: [https://climate.copernicus.eu/disclaimer-and-privacy Reproduction of the publically available content of this website is authorised… | 1 |
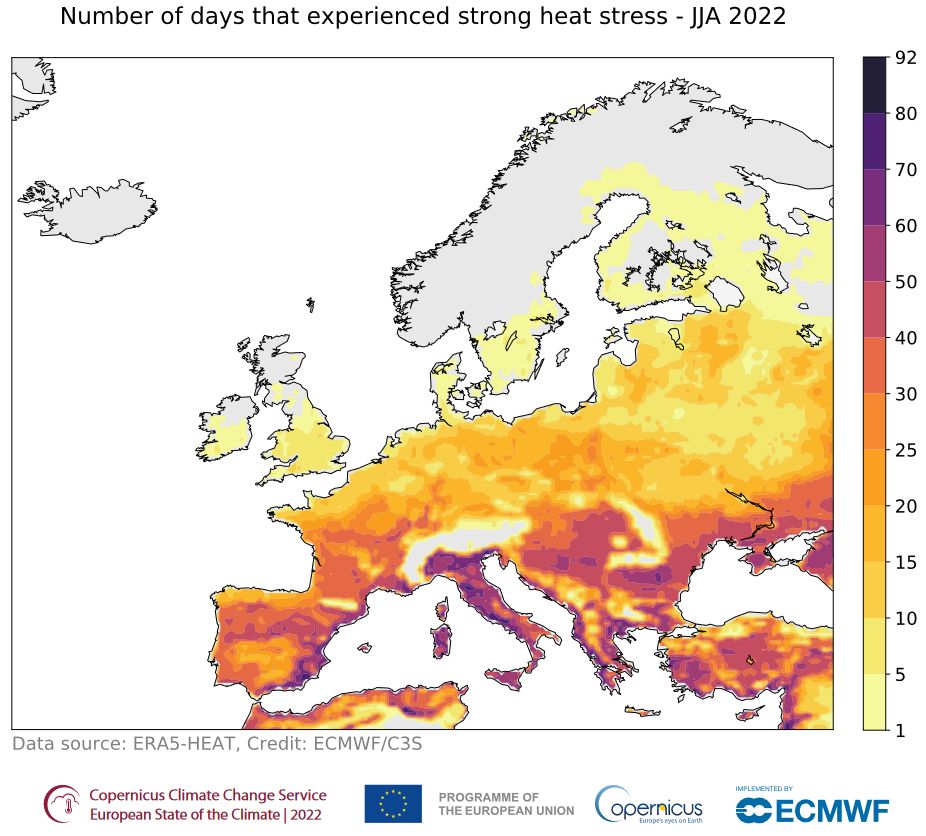
| 12:15, 9. Aug. 2023 | EU heat stress JJA 2022.jpg (Datei) |  |
115 KB | == Beschreibung == Anzahl der Tage unter starkem Hitzestress (32-38 °C) im Sommer 2022 ==Lizenzhinweis== {| style="border:1px solid #8888aa; background-color:#f7f8ff;padding:5px;font-size:95%;" | Quelle: Copernicus Climate Change (2023): [https://climate.copernicus.eu/esotc/2022/extreme-heat European State oft the Climate 2022. Extreme heat], <br> Lizenz: [https://climate.copernicus.eu/disclaimer-and-privacy Reproduction of the publically available content of this website is authorised, pro… | 1 |
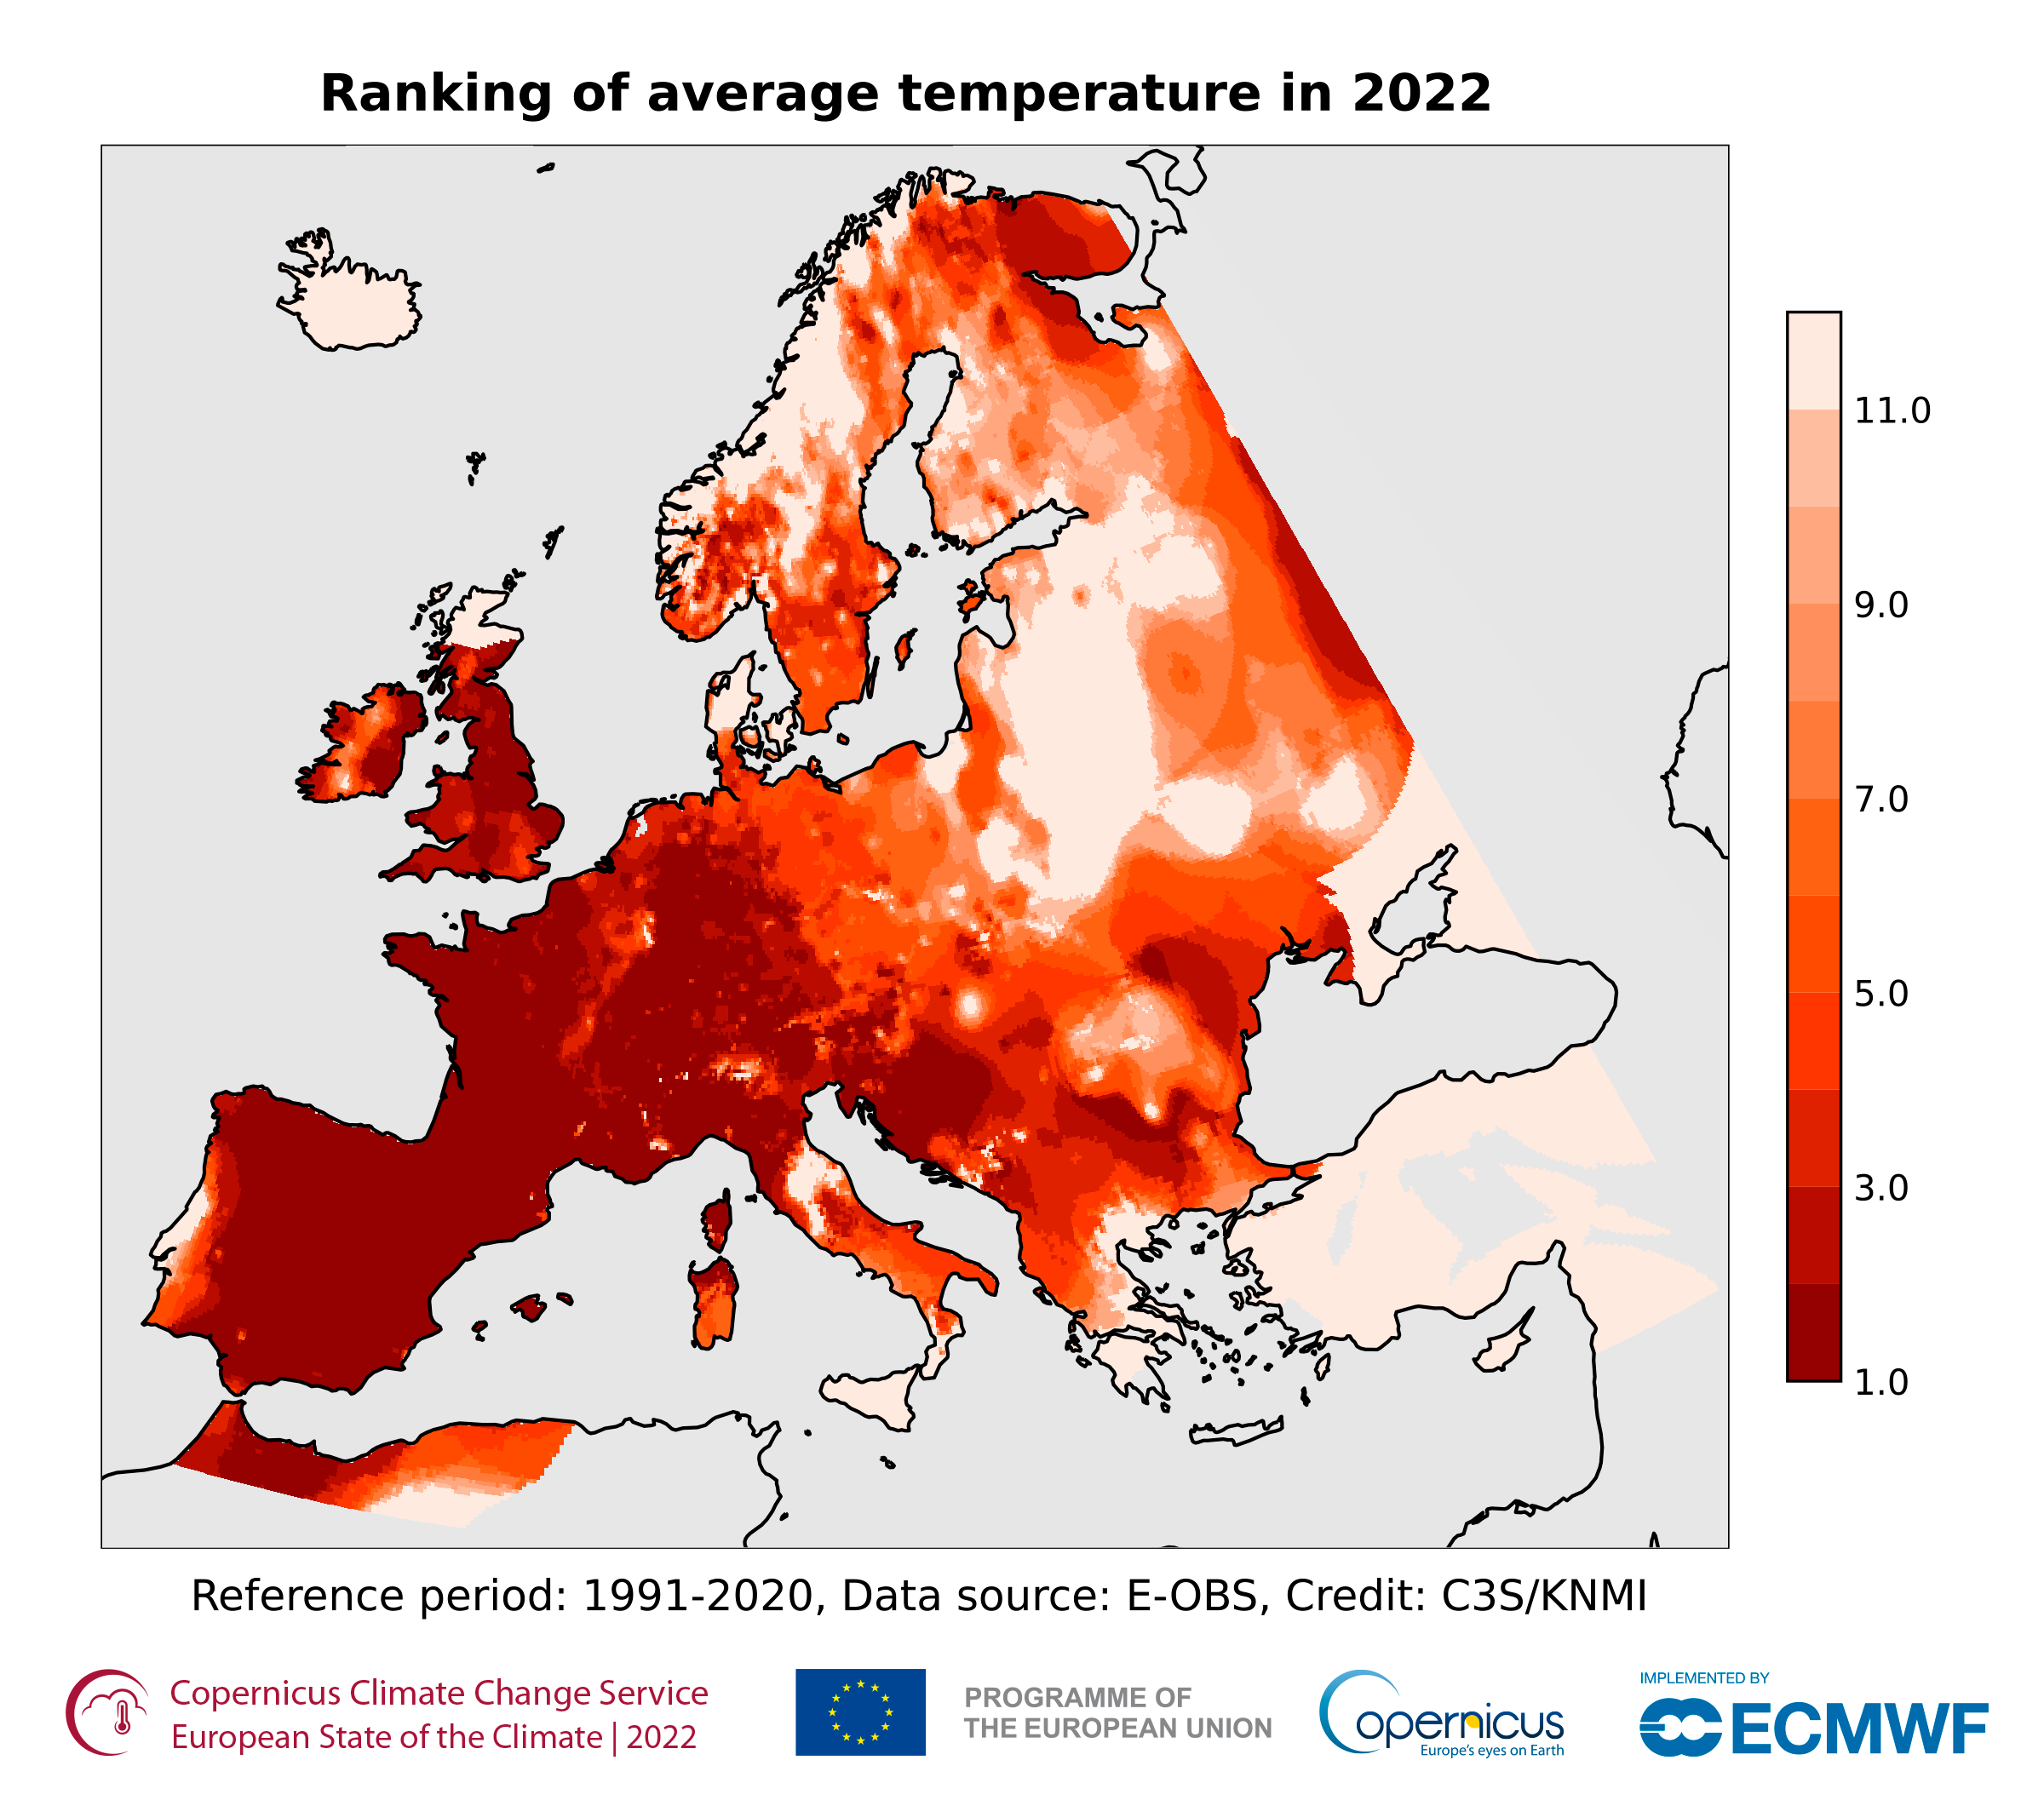
| 12:06, 9. Aug. 2023 | EU ranking temp 2022.png (Datei) |  |
524 KB | == Beschreibung == Ranking der mittleren Tagestemperaturen 2022 für die Periode 195ß-2022. „1“ bedeutet, dass die höchste Tagestemperatur seit 1950 im Jahr 2022 gemessen, „5“, dass 2022 die fünfhöchste Tagestemperatur gemessen wurde usw. ==Lizenzhinweis== {| style="border:1px solid #8888aa; background-color:#f7f8ff;padding:5px;font-size:95%;" | Quelle: Copernicus Climate Change (2023): European State oft the Climate 2022. Extreme heat, https://climate.copernicus.eu/esotc/2022/extreme-heat <br… | 1 |
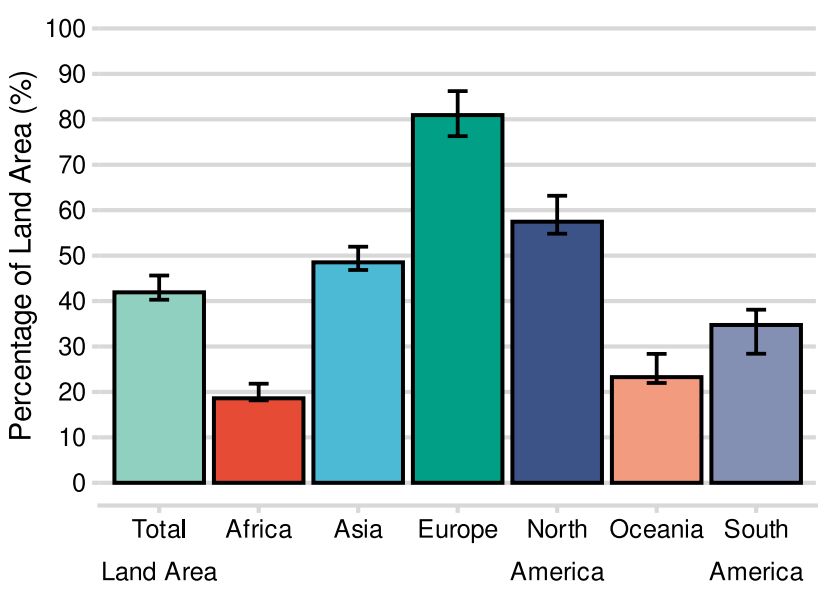
| 18:21, 5. Aug. 2023 | K-G Klimazonen Kontinente 2071-2100.jpg (Datei) |  |
42 KB | == Beschreibung == Klimazonenänderung nach Flächenanteilen der einzelnen Kontinente nach Köppen-Geiger bis 2071-2100 nach dem Szenario SSP5-8.5 == Lizenzhinweis == {| style="border:1px solid #8888aa; background-color:#f7f8ff;padding:5px;font-size:95%;" | Quelle: Bayar, A. S., Yılmaz, M. T., Yücel, İ., & Dirmeyer, P. (2023): [https://doi.org/10.1029/2022EF002972 CMIP6 Earth system models project greater acceleration of climate zone change due to stronger warming rates.] Earth's Future, 11, e202… | 1 |
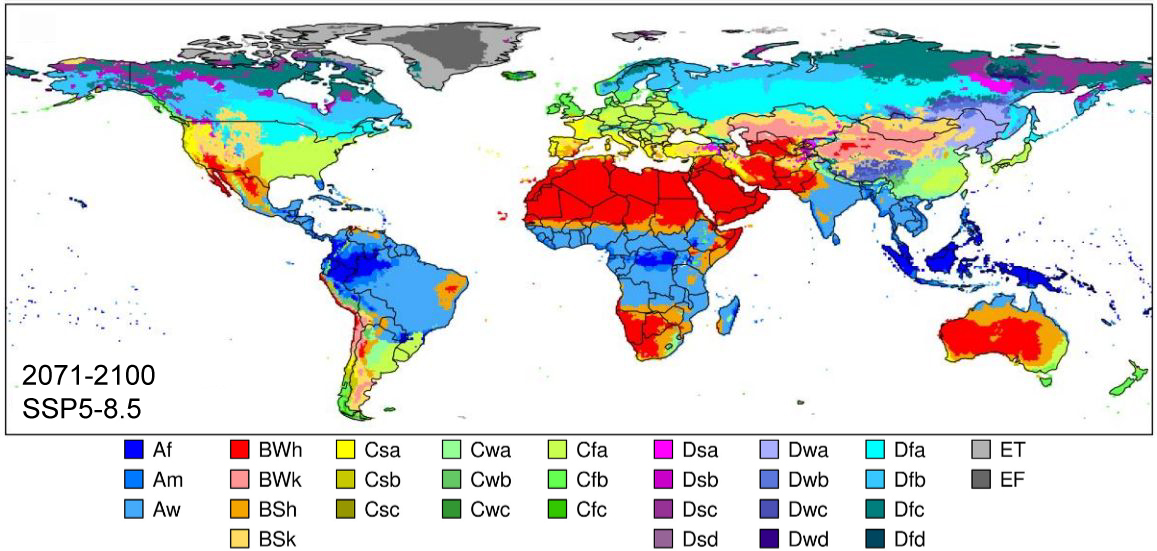
| 18:17, 5. Aug. 2023 | K-G-Klimazonen-2071-2100.jpg (Datei) |  |
310 KB | == Beschreibung == Änderung der Klimazonen nach Köppen-Geiger bis 2071-2100 nach dem Szenario SSP5-8.5 == Lizenzhinweis == {| style="border:1px solid #8888aa; background-color:#f7f8ff;padding:5px;font-size:95%;" | Quelle: Bayar, A. S., Yılmaz, M. T., Yücel, İ., & Dirmeyer, P. (2023): [https://doi.org/10.1029/2022EF002972 CMIP6 Earth system models project greater acceleration of climate zone change due to stronger warming rates.] Earth's Future, 11, e2022EF002972. Lizenz: [http://creativecommon… | 1 |
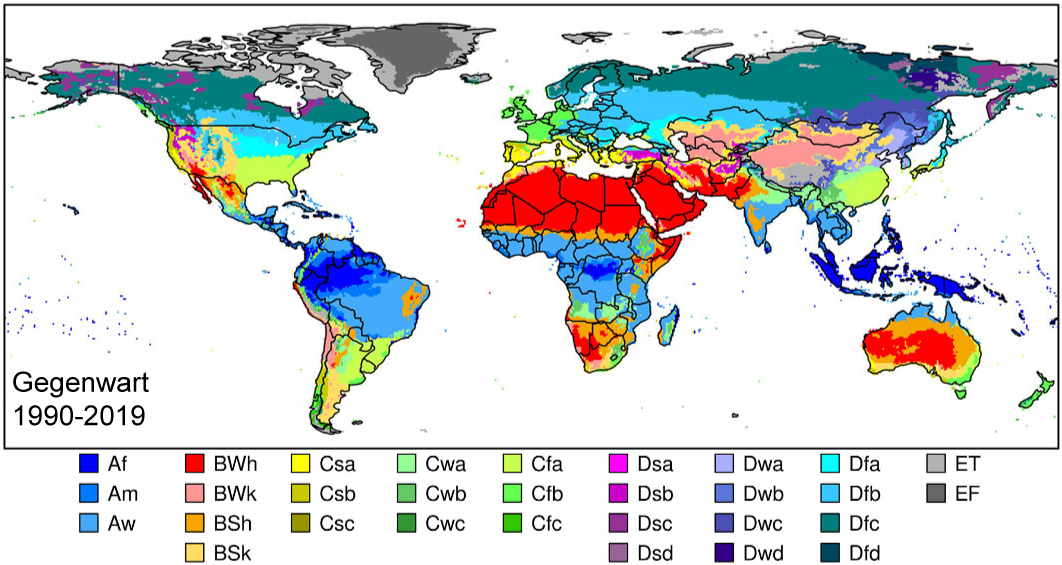
| 18:13, 5. Aug. 2023 | K-G-Klimazonen-Gegenwart.jpg (Datei) |  |
385 KB | == Beschreibung == Verteilung der Klimnazonen in der Gegenwart (1990-2019) nach Köppen-Geiger == Lizenzhinweis == {| style="border:1px solid #8888aa; background-color:#f7f8ff;padding:5px;font-size:95%;" | Quelle: Bayar, A. S., Yılmaz, M. T., Yücel, İ., & Dirmeyer, P. (2023): [https://doi.org/10.1029/2022EF002972 CMIP6 Earth system models project greater acceleration of climate zone change due to stronger warming rates.] Earth's Future, 11, e2022EF002972. Lizenz: [http://creativecommons.org/lic… | 1 |
| 15:53, 4. Aug. 2023 | Permafrost Video TerraX.jpg (Datei) |  |
12 KB | == Beschreibung == Die wichtigsten Klimafaktoren - Vorschaubild ==Lizenzhinweis== {| style="border:1px solid #8888aa; background-color:#f7f8ff;padding:5px;font-size:95%;" | Quelle: Terra X (2021): Warum ist Permafrost wichtig? https://www.zdf.de/dokumentation/terra-x/warum-ist-permafrost-wichtig-creative-commons-clip-100.html , ZDF/logo/Christian Hill/Maximilian Mohr <br> Lizenz: CC BY 4.0 https://creativecommons.org/licenses/by/4.0/legalcode.de |} | 1 |
| 14:41, 4. Aug. 2023 | Klimamodell Video TerraX.jpg (Datei) |  |
12 KB | == Beschreibung == So funktionieren Klimamodelle – Vorschaubild ==Lizenzhinweis== {| style="border:1px solid #8888aa; background-color:#f7f8ff;padding:5px;font-size:95%;" | Quelle: Terra X (2029): So funktionieren Klimamodelle, https://www.zdf.de/dokumentation/terra-x/so-funktionieren-klimamodelle-erklaerclip-klimawandel-100.html , ZDF/Terra X/Gruppe 5/Luise Wagner, Jonas Sichert, Andreas Hougardy <br> Lizenz: CC BY 4.0 https://creativecommons.org/licenses/by/4.0/legalcode.de |} | 1 |
| 15:36, 3. Aug. 2023 | Film Klimafaktoren.jpg (Datei) |  |
5 KB | == Beschreibung == Die wichtigsten Klimafaktoren ==Lizenzhinweis== {| style="border:1px solid #8888aa; background-color:#f7f8ff;padding:5px;font-size:95%;" | Quelle: Terra X (2023): Klimalehrfilme https://commons.wikimedia.org/w/index.php?search=terra+x+klima&title=Special:MediaSearch&go=Go&type=video <br> Lizenz: CC BY 4.0, via Wikimedia Commons |} | 1 |
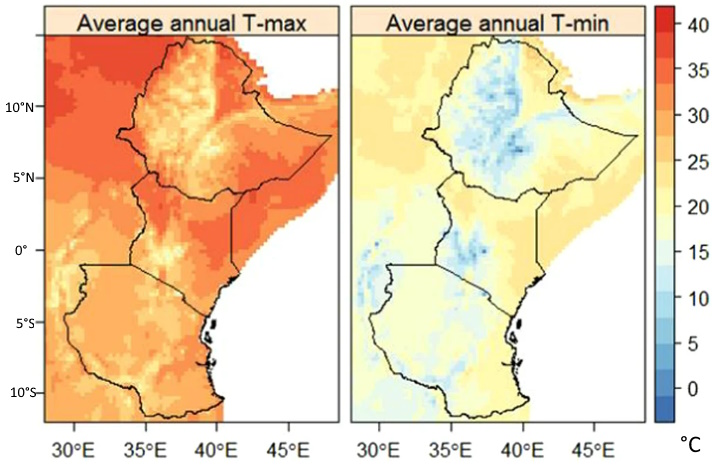
| 16:20, 20. Jul. 2023 | E-Africa temp 1979-2010.jpg (Datei) |  |
106 KB | == Beschreibung == Mittlere Jahresmaximum- und -minimumtemperaturen 1979-2010 in Ostafrika (Äthiopien, Kenia, Tansania) ==Lizenzhinweis== {| style="border:1px solid #8888aa; background-color:#f7f8ff;padding:5px;font-size:95%;" | Quelle: Gebrechorkos, S.H., S. Hülsmann & C. Bernhofer (2019): [https://doi.org/10.1038/s41598-019-47933-8 Long-term trends in rainfall and temperature using high-resolution climate datasets in East Africa]. Sci Rep 9, 11376 <br /> Lizenz: [http://creativecommons.org/l… | 1 |
| 16:14, 20. Jul. 2023 | E-Africa rainfall 1981–2016.jpg (Datei) |  |
42 KB | == Beschreibung == Mittlerer Jahresniederschlag 1981-2016 in mm in Ostafrika (Äthiopien, Kenia, Tansania) ==Lizenzhinweis== {| style="border:1px solid #8888aa; background-color:#f7f8ff;padding:5px;font-size:95%;" | Quelle: Gebrechorkos, S.H., S. Hülsmann & C. Bernhofer (2019): Long-term trends in rainfall and temperature using high-resolution climate datasets in East Africa. Sci Rep 9, 11376 https://doi.org/10.1038/s41598-019-47933-<br /> Lizenz: [http://creativecommons.org/licenses/by/4.0/ CC… | 1 |
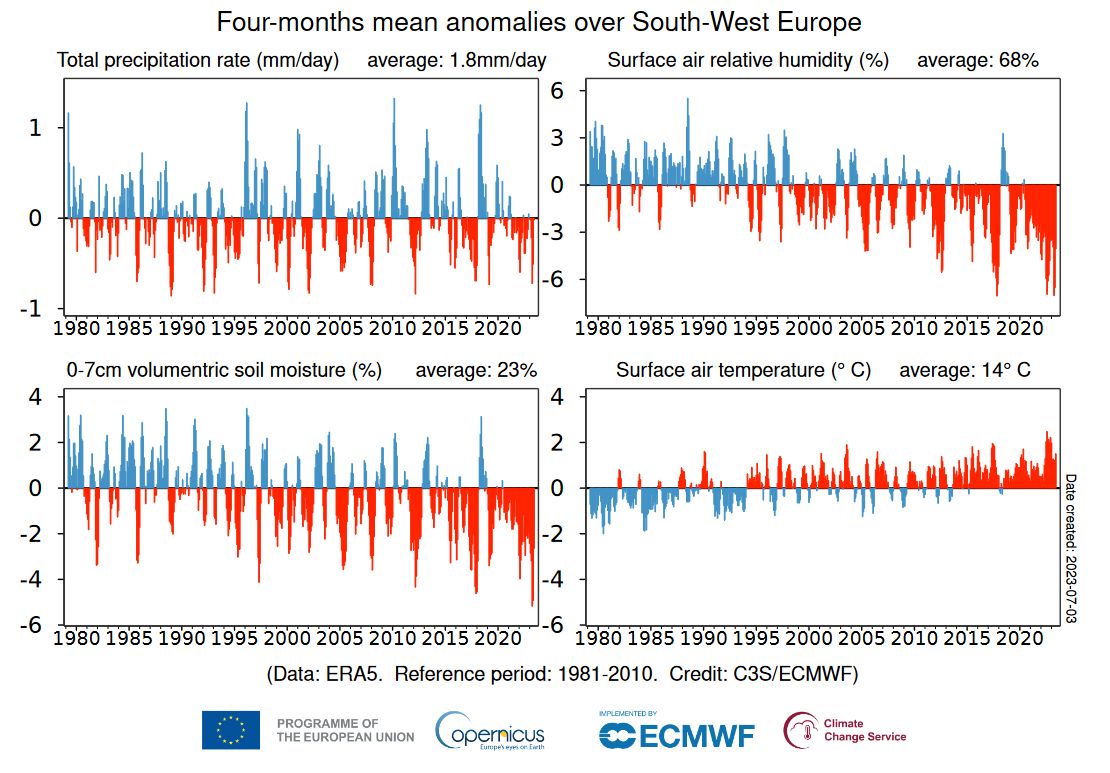
| 13:51, 18. Jul. 2023 | SW-EU hydro temp1979-2023.jpg (Datei) |  |
146 KB | == Beschreibung == Niederschlag, relative Luftfeuchtigkeit, Bodenfeuchte und Lufttemperatur 1979-2023 in SW-Europa ==Lizenzhinweis== {| style="border:1px solid #8888aa; background-color:#f7f8ff;padding:5px;font-size:95%;" | Quelle: Copernicus Climate Change Service: Precipitation, relative humidity and soil moisture for June 2023, https://climate.copernicus.eu/precipitation-relative-humidity-and-soil-moisture-june-2023 <br> Lizenz: Reproduction of the publically available content of this w… | 1 |
