Von Dieter Kasang hochgeladene Dateien
Aus Klimawandel
Diese Spezialseite listet alle hochgeladenen Dateien auf.
| Datum | Name | Vorschaubild | Größe | Beschreibung | Versionen |
|---|---|---|---|---|---|
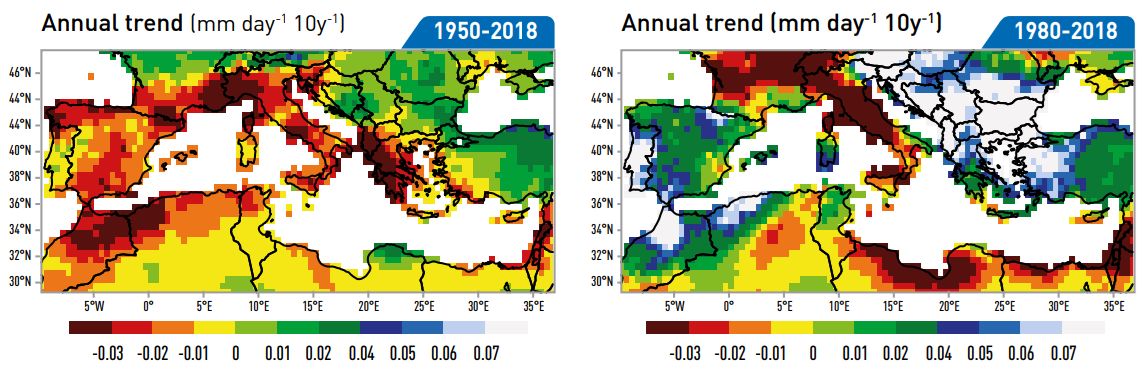
| 09:02, 18. Jul. 2023 | Prec trend 1950-2018 1980-2018.jpg (Datei) |  |
112 KB | == Beschreibung == Regionale Niederschlagsänderungen in m/Tag 1950-2018 (links) und 1980-2018 (rechts) ==Lizenzhinweis== {| style="border:1px solid #8888aa; background-color:#f7f8ff;padding:5px;font-size:95%;" | Quelle: MedECC (2020): [https://www.medecc.org/first-mediterranean-assessment-report-mar1 Climate and Environmental Change in the Mediterranean Basin – Current Situation and Risks for the Future.] First Mediterranean Assessment Report, [Cramer, W., Guiot, J., Marini, K. (eds.)] Union… | 1 |
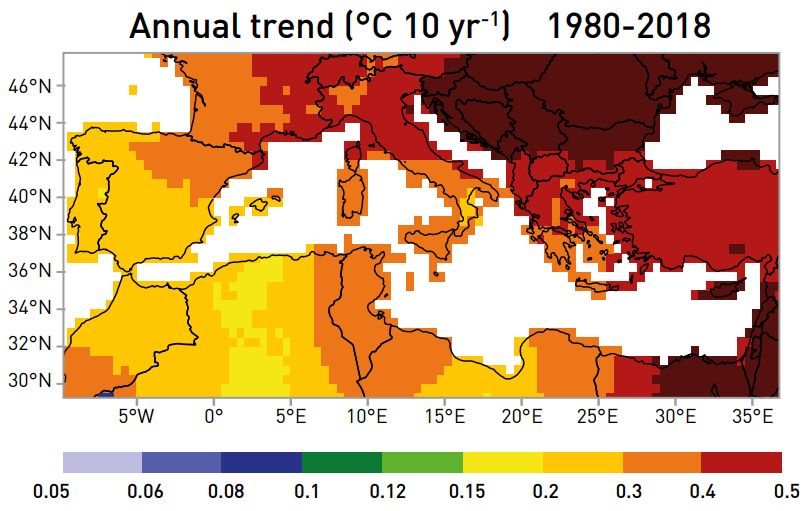
| 08:53, 18. Jul. 2023 | Mediterranean temp trend 1980-2018.jpg (Datei) |  |
75 KB | == Beschreibung == Änderung der regionalen Temperatur im Mittelmeerraum 1980-2018 in °C/Jahrzehnt ==Lizenzhinweis== {| style="border:1px solid #8888aa; background-color:#f7f8ff;padding:5px;font-size:95%;" | Quelle: MedECC (2020): [https://www.medecc.org/first-mediterranean-assessment-report-mar1 Climate and Environmental Change in the Mediterranean Basin – Current Situation and Risks for the Future.] First Mediterranean Assessment Report, [Cramer, W., Guiot, J., Marini, K. (eds.)] Union for t… | 1 |
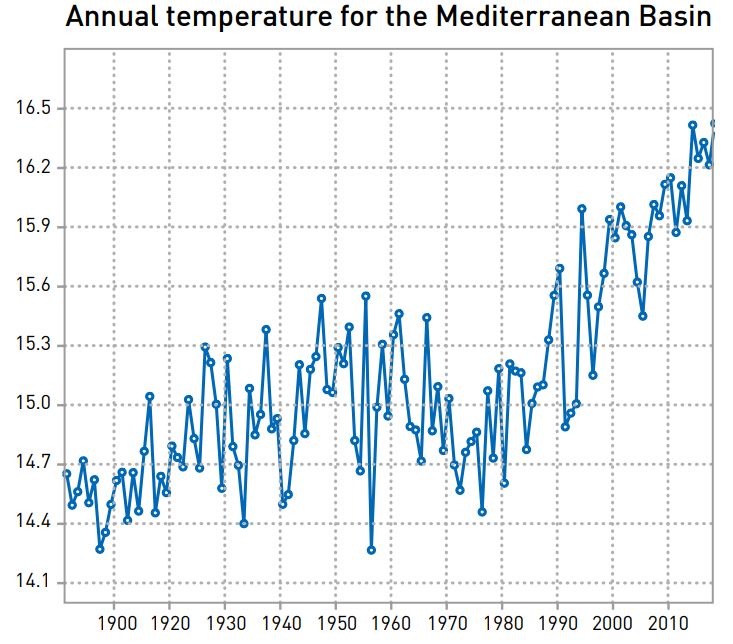
| 08:48, 18. Jul. 2023 | Mediterranean mean temp 1980-2018.jpg (Datei) |  |
82 KB | == Beschreibung == Änderung der Mitteltemperatur im Mittelmeerraum 1891-2018 in absoluten Werten. ==Lizenzhinweis== {| style="border:1px solid #8888aa; background-color:#f7f8ff;padding:5px;font-size:95%;" | Quelle: MedECC (2020): Climate and Environmental Change in the Mediterranean Basin – Current Situation and Risks for the Future. First Mediterranean Assessment Report, [Cramer, W., Guiot, J., Marini, K. (eds.)] Union for the Mediterranean, Plan Bleu, UNEP/MAP, Marseille, France, 632pp. ISB… | 1 |
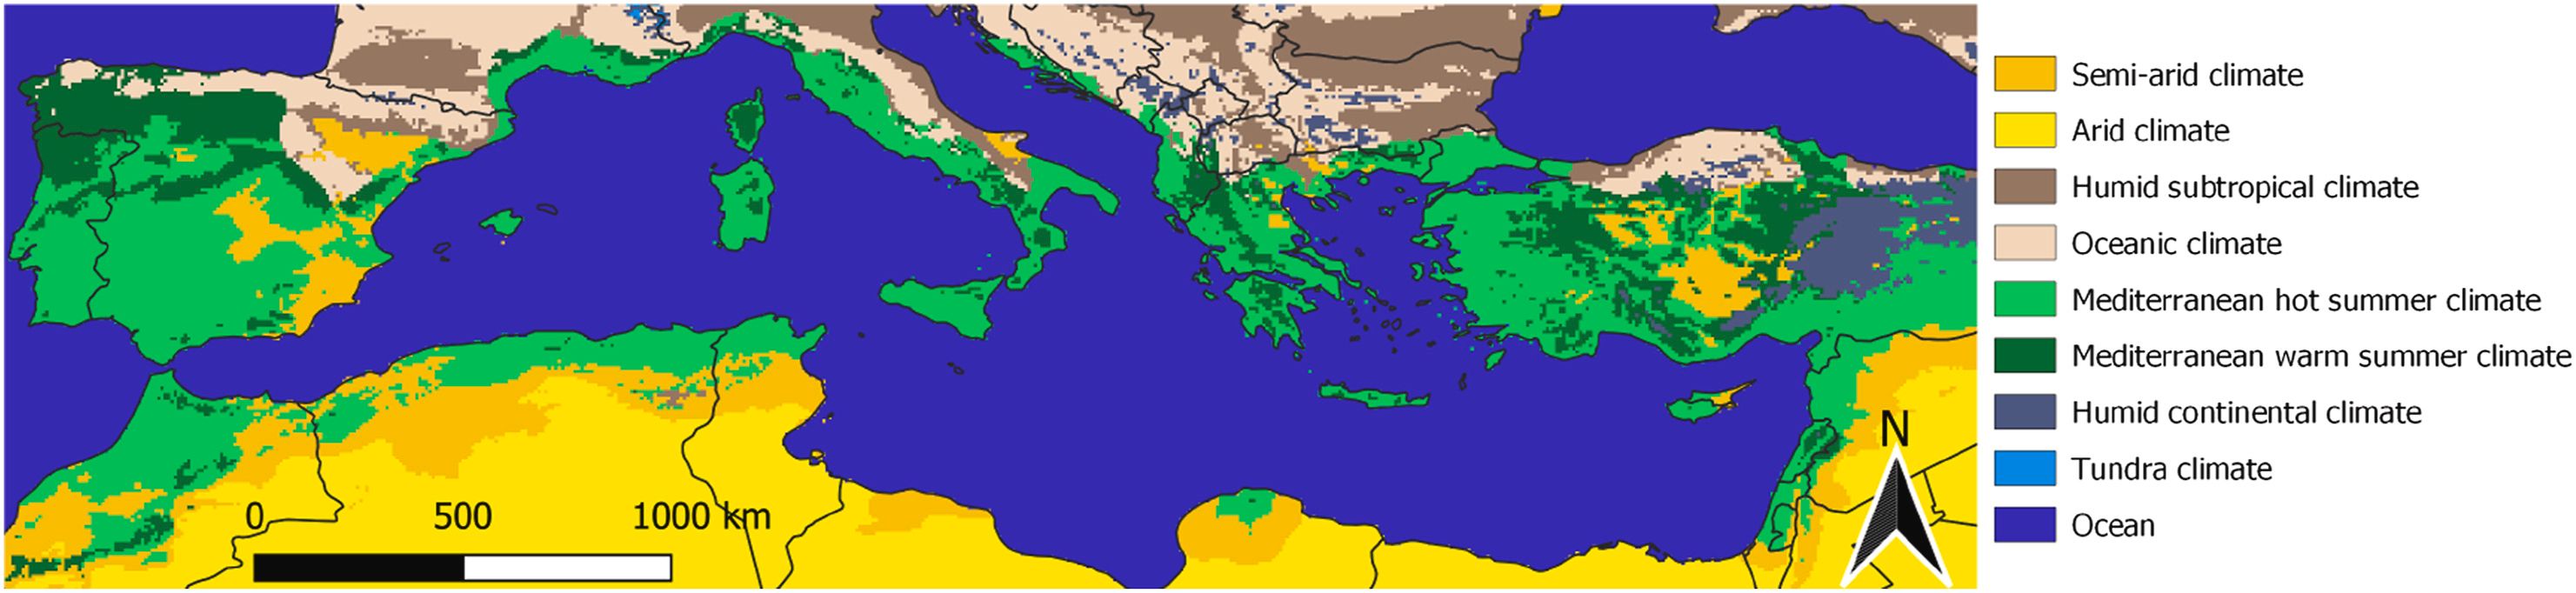
| 16:06, 12. Jul. 2023 | Mediterrane Klimazonen.jpg (Datei) | 216 KB | Klimazonen des Mittelmeeraums ==Lizenzhinweis== {| style="border:1px solid #8888aa; background-color:#f7f8ff;padding:5px;font-size:95%;" | Quelle: Vogel, J., E. Paton, V. Aich, A. Bronstert (2021): Increasing compound warm spells and droughts in the Mediterranean Basin, Weather and Climate Extremes 32, ISSN 2212-0947, https://doi.org/10.1016/j.wace.2021.100312. <br> Lizenz: CC BY http://creativecommons.org/licenses/by/4.0/ |} | 1 | |
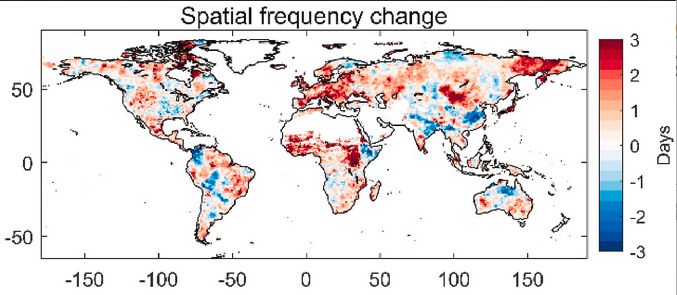
| 10:37, 12. Jul. 2023 | Coastal compund extremes returnperiod.jpg (Datei) |  |
110 KB | == Beschreibung == Änderung der Wiederkehrperiode von zusammengesetzten Extremen aus Niederschlägen und Sturmfluten an den globalen Küsten bis 2070-2099 im Vergleich zu 1970-2004. Eine abnehmende Wiederkehrperiode bedeutet ein häufigeres Vorkommen der Ereignisse. Orte mit lila Punkten verweisen auf fehlende Übereinstimmung der Modellergebnisse, grau unterlegte Bereiche auf starke Veränderungen im Vergleich zur natürlichen Variabilität. ==Lizenzhinweis== {| style="border:1px solid #8888aa; back… | 1 |
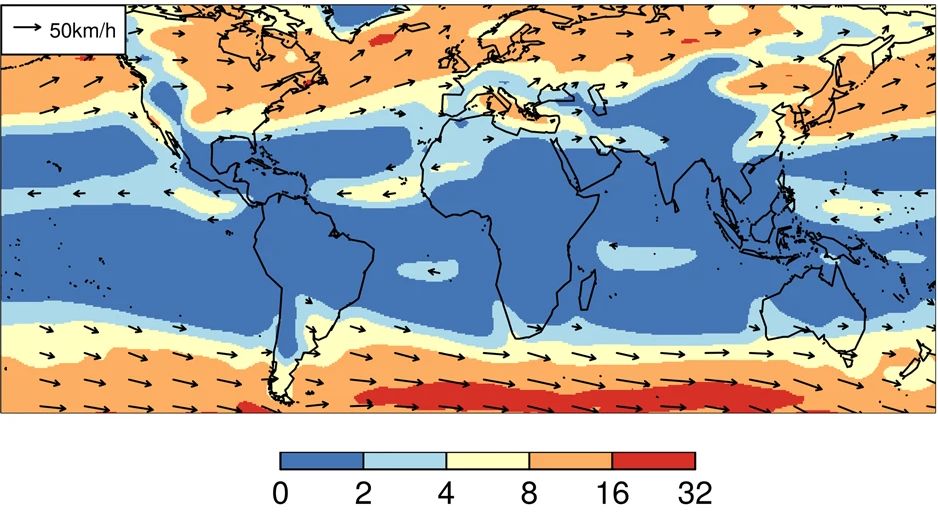
| 10:23, 12. Jul. 2023 | Extratropical Cyclones.jpg (Datei) |  |
93 KB | == Beschreibung == Außertropische Stürme in Anzahl pro Monat ==Lizenzhinweis== {| style="border:1px solid #8888aa; background-color:#f7f8ff;padding:5px;font-size:95%;" | Quelle: Bevacqua, E., Vousdoukas, M.I., Zappa, G. et al. (2020): More meteorological events that drive compound coastal flooding are projected under climate change. Commun Earth Environ 1, 47 https://doi.org/10.1038/s43247-020-00044-z<br> Lizenz: CC BY http://creativecommons.org/licenses/by/4.0/ |} | 1 |
| 20:14, 11. Jul. 2023 | CDHW duration 1951-2100.jpg (Datei) |  |
63 KB | == Beschreibung == Dauer von Zusammengesetzten Hitze- und Dürreextremen 1950-2100 in Tagen pro Jahr. ==Lizenzhinweis== {| style="border:1px solid #8888aa; background-color:#f7f8ff;padding:5px;font-size:95%;" | Quelle: Zhang, Q., She, D., Zhang, L., Wang, G., Chen, J., & Hao, Z. (2022). High sensitivity of compound drought and heatwave events to global warming in the future. Earth's Future, 10, e2022EF002833. https://doi. org/10.1029/2022EF002833<br> Lizenz: [http://creativecommons.org/license… | 1 |
| 19:55, 11. Jul. 2023 | Dry hot frequency 1951-2012.jpg (Datei) |  |
43 KB | == Beschreibung == Änderung der Häufigkeit von Dürre- und Hitzeextremen in Tagen pro Jahr zwischen 1951 und 2012 ==Lizenzhinweis== {| style="border:1px solid #8888aa; background-color:#f7f8ff;padding:5px;font-size:95%;" | Quelle: Feng, S., Wu, X., Hao, Z., Hao, Y., Zhang, X., Hao, F. (2020): [https://doi.org/10.1016/j.wace.2020.100299 A database for characteristics and variations of global compound dry and hot events]. Weather Clim. Extrem. 30, 100299<br> Lizenz: [http://creativecommons.org/l… | 1 |
| 19:45, 11. Jul. 2023 | Italy drought heat 1951-2012.jpg (Datei) |  |
79 KB | == Beschreibung == Häufigkeit, Intensität und Dauer von Dürre- und Hitzeereignissen in Tagen pro Jahr, nach Index-Klassen und nach Tagen pro Ereignis in Italien zwischen 1951 und 2012. ==Lizenzhinweis== {| style="border:1px solid #8888aa; background-color:#f7f8ff;padding:5px;font-size:95%;" | Quelle: Feng, S., Wu, X., Hao, Z., Hao, Y., Zhang, X., Hao, F. (2020): A database for characteristics and variations of global compound dry and hot events. Weather Clim. Extrem. 30, 100299. https://doi.o… | 1 |
| 19:23, 4. Jul. 2023 | E-Africa drought areas scenarios.jpg (Datei) |  |
98 KB | == Beschreibung == Änderung der Dürregebiete in Ostafrika nach verschiedenen Szenarien und Modellsimulationen. Die farbigen Linien zeigen die Mittelwerte der Modelle, die Flächen die Unsicherheitsbereiche. ==Lizenzhinweis== {| style="border:1px solid #8888aa; background-color:#f7f8ff;padding:5px;font-size:95%;" | Quelle: Haile, G. G., Tang, Q., Hosseini‐ Moghari, S.‐M., Liu, X., Gebremicael, T. G., Leng, G., et al. (2020): [https://doi.org/10.1029/2020EF001502 Projected impacts of climate cha… | 1 |
| 19:12, 4. Jul. 2023 | E-Africa SPI SPEI 2100.jpg (Datei) |  |
90 KB | == Beschreibung == Die Änderung der Dürreanzahl nach dem SPI- und dem SPEI-Index sowie dem mittleren Szenario RCP 4.5 und dem hohen Szenario RCP8.5. Negative Werte zeigen trockene (ab -1), positive Werte feuchtere Verhältnisse. ==Lizenzhinweis== {| style="border:1px solid #8888aa; background-color:#f7f8ff;padding:5px;font-size:95%;" | Quelle: Haile, G. G., Tang, Q., Hosseini‐ Moghari, S.‐M., Liu, X., Gebremicael, T. G., Leng, G., et al. (2020): [https://doi.org/10.1029/2020EF001502 Projected i… | 1 |
| 18:56, 4. Jul. 2023 | E-Africa droughts 2021-2022 SPI SPEI.jpg (Datei) |  |
38 KB | Regionale Verbreitung der Dürren 2021-2022 in Ostafrika nach dem Dürre-Index SPI (links) und SPEI (rechts) ==Lizenzhinweis== {| style="border:1px solid #8888aa; background-color:#f7f8ff;padding:5px;font-size:95%;" | Quelle: Haile, G. G., Tang, Q., Hosseini‐ Moghari, S.‐M., Liu, X., Gebremicael, T. G., Leng, G., et al. (2020): Projected impacts of climate change on drought patterns over East Africa. Earth's Future, 8, e2020EF001502. https://doi. org/10.1029/2020EF001502 Lizenz: CC BY-NC-ND |} | 1 |
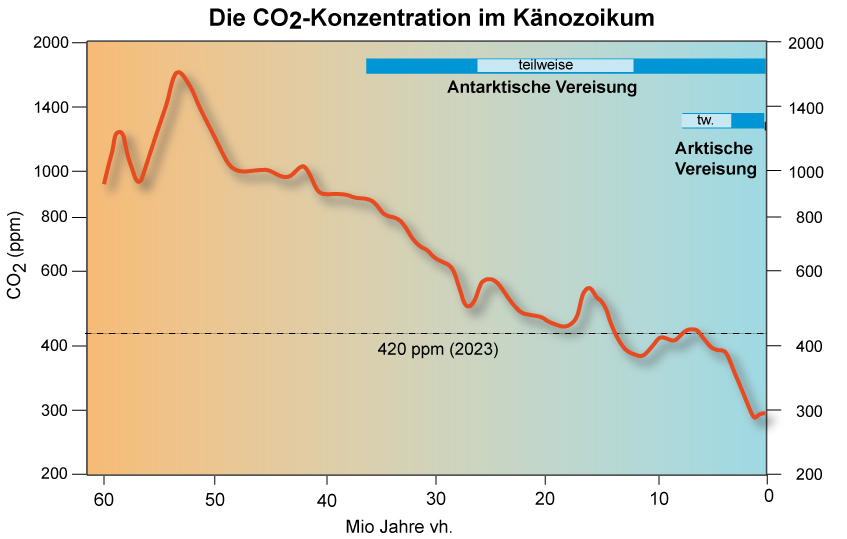
| 19:00, 29. Jun. 2023 | CO2 erdneuzeit IPCC-AR6.jpg (Datei) |  |
125 KB | Der Kohlendioxidgehalt der Atmosphäre in den letzten 65 Millionen Jahren. Die Konzentration zu Beginn des Känozoikums entspricht etwa dem extremen IPCC-Szenario (A1Fl) für das Ende des 21. Jahrhunderts. == Lizenzhinweis == {| style="border:1px solid #8888aa; background-color:#f7f8ff;padding:5px;font-size:95%;" |Eigene Darstellung nach Hansen, J. et al. (2008): [http://www.columbia.edu/~jeh1/2008/TargetCO2_20080407.pdf Target Atmospheric CO2: Where Should Humanity Aim?] |} | 1 |
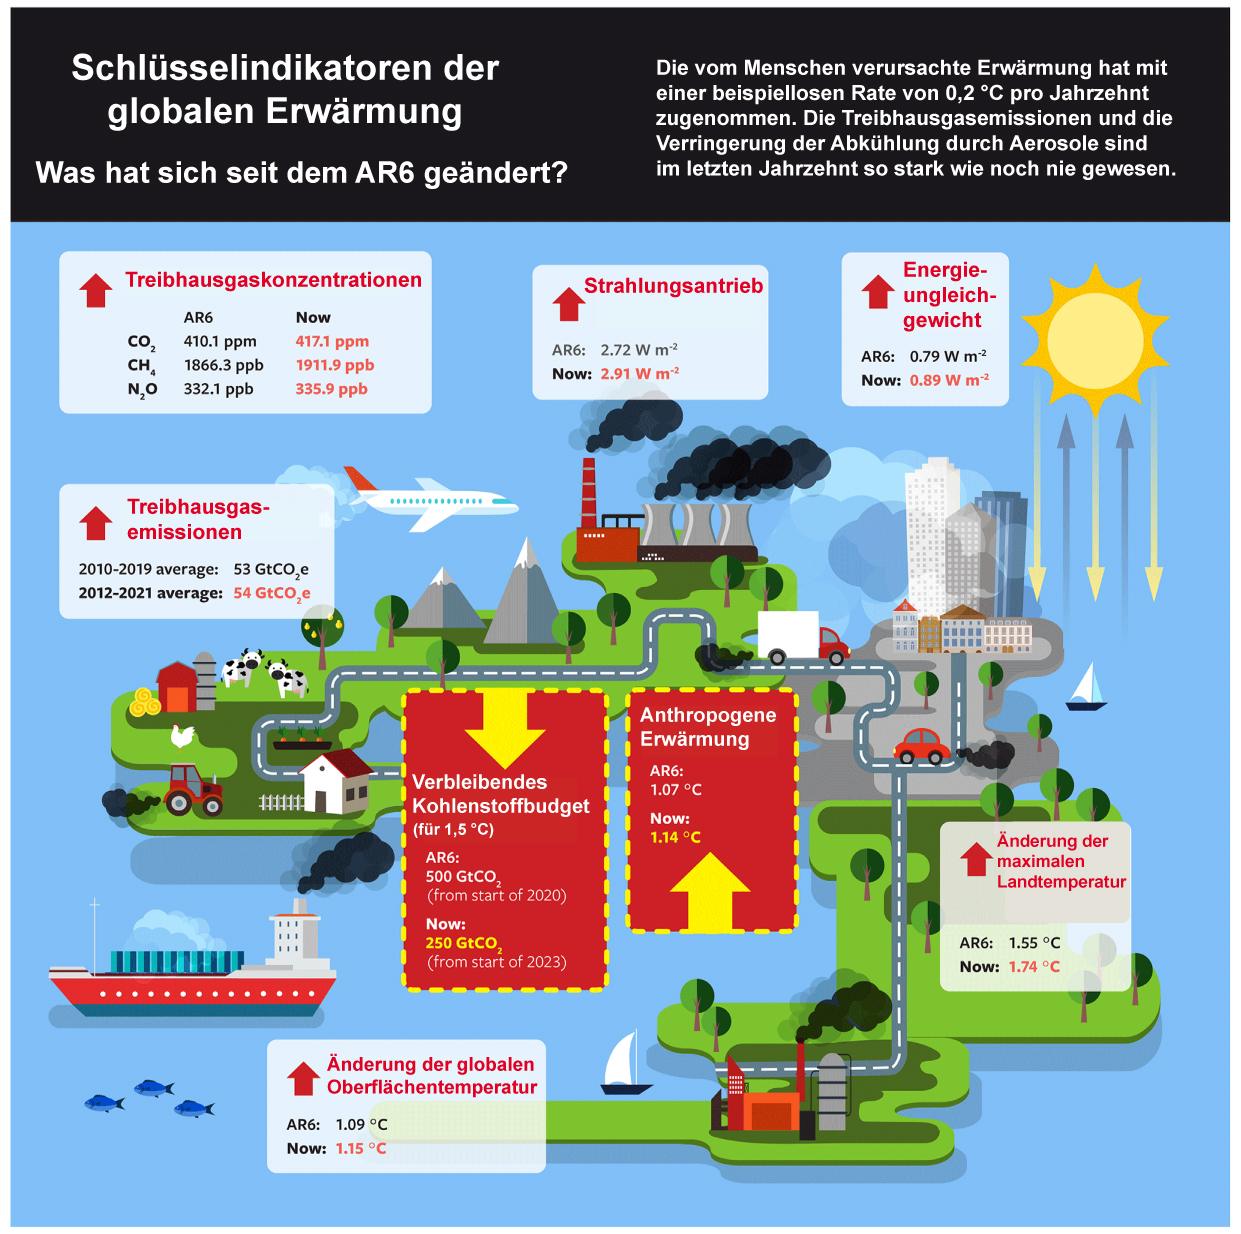
| 20:53, 28. Jun. 2023 | Key-indicators-cc dt.jpg (Datei) |  |
862 KB | 4 | |
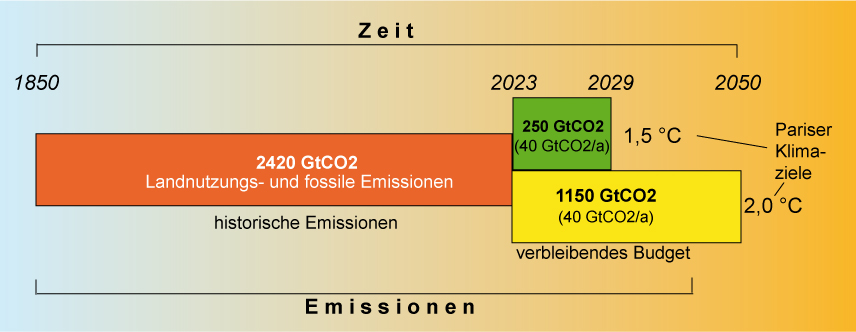
| 18:24, 28. Jun. 2023 | Remaining-carbon-budget2023.jpg (Datei) |  |
114 KB | == Beschreibung == Die Graphik zeigt die historischen Kohlendioxid-Emissionen in Gt C zwischen 1850 und 2021 und das verbleibende Kohlenstoffbudget, um die Klimaziele des Paris-Abkommens mit einer Wahrscheinlichkeit von 50% zu erreichen. Bei der gegenwärtigen Emissionsrate von 11 GtC/Jahr wäre das Budget 2031 bzw. 2052 aufgebraucht. ==Lizenzhinweis== {| style="border:1px solid #8888aa; background-color:#f7f8ff;padding:5px;font-size:95%;" | Quelle: IPCC AR6, WGI (2022): The Physical Science Bas… | 1 |
| 20:08, 26. Jun. 2023 | Temperatur 2022.jpg (Datei) |  |
27 KB | == Beschreibung == Die globale Mitteltemperatur 2013-2022 und 2022 im Vergleich zur vorindustriellen Zeit 1850-1900 == Lizenzhinweis == {| style="border:1px solid #8888aa; background-color:#f7f8ff;padding:5px;font-size:95%;" | Quelle: Forster, P. M., C.J. Smith, T. Walsh et al. (2023): Indicators of Global Climate Change 2022: Annual update of large-scale indicators of the state of the climate system and the human influence, Earth System Science Data, doi.org/10.5194/essd-2023-166<br> Lizenz… | 1 |
| 20:01, 26. Jun. 2023 | Temperatur Land Ozean 1880-2022.png (Datei) |  |
134 KB | == Beschreibung == Änderung der Mitteltemperatur über dem Land und über dem Ozean 1880-2022 im Vergleich zu 1951-1980. Jahresmittel: dünne Linien; 5-Jahresmittel: dicke Linien. == Lizenzhinweis == {| style="border:1px solid #8888aa; background-color:#f7f8ff;padding:5px;font-size:95%;" | Quelle: NASA (2023): GISS Surface Temperature Analysis (v4) https://data.giss.nasa.gov/gistemp/graphs_v4/ Lizenz: public domain |} | 1 |
| 19:19, 26. Jun. 2023 | Energy-accumulation-1971-2020.jpg (Datei) |  |
93 KB | == Beschreibung == Historischer Strahlungsantrieb durch Treibhausgase, Landnutzung, Aerosole und die Sonne 1750 bis 2022 == Lizenzhinweis == {| style="border:1px solid #8888aa; background-color:#f7f8ff;padding:5px;font-size:95%;" | Quelle: Forster, P. M., C.J. Smith, T. Walsh et al. (2023): Indicators of Global Climate Change 2022: Annual update of large-scale indicators of the state of the climate system and the human influence, Earth System Science Data, doi.org/10.5194/essd-2023-166 Lizenz:… | 1 |
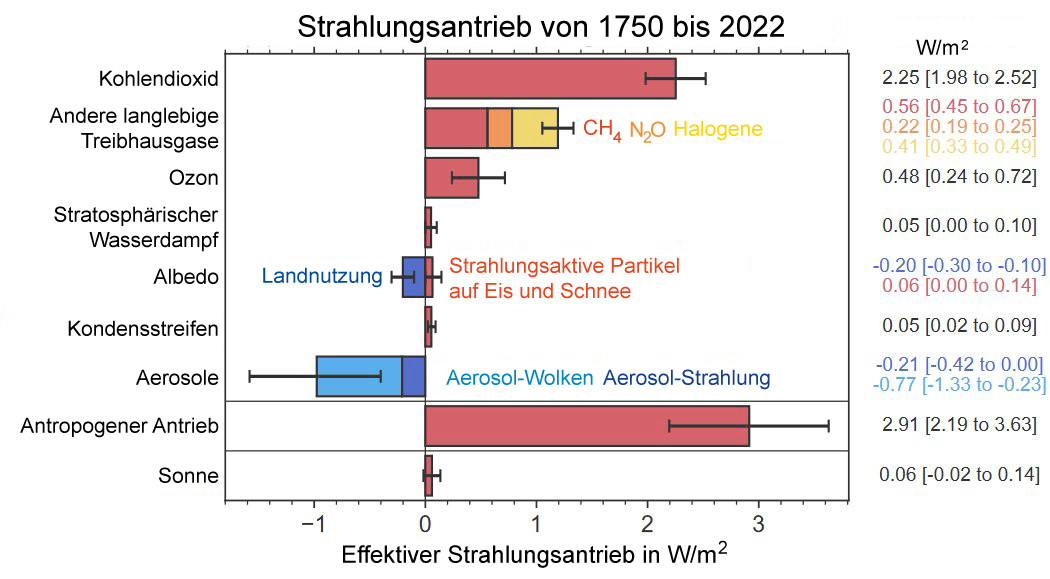
| 19:16, 26. Jun. 2023 | Strahlungsantrieb 1750-2022.jpg (Datei) |  |
36 KB | == Beschreibung == Anthropogener Strahlungsantrieb 1750 bis 2022 ==Lizenzhinweis== {| style="border:1px solid #8888aa; background-color:#f7f8ff;padding:5px;font-size:95%;" | Quelle: Forster, P. M., C.J. Smith, T. Walsh et al. (2023): Indicators of Global Climate Change 2022: Annual update of large-scale indicators of the state of the climate system and the human influence, Earth System Science Data, doi.org/10.5194/essd-2023-166<br> Lizenz: [https://creativecommons.org/licenses/by/4.0/ CC BY… | 1 |
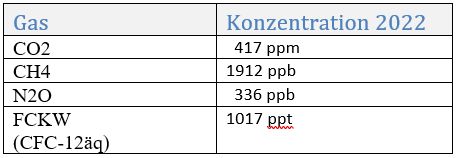
| 14:50, 26. Jun. 2023 | THG-Konzentration 2022.jpg (Datei) |  |
13 KB | == Beschreibung == Mittlere Treibhausgasemissionen 2000-2009, 2012-2021 und 2021 in Gt CO<sub>2</sub>-Äquivalent ==Lizenzhinweis== {| style="border:1px solid #8888aa; background-color:#f7f8ff;padding:5px;font-size:95%;" | Quelle: Forster, P. M., C.J. Smith, T. Walsh et al. (2023): Indicators of Global Climate Change 2022: Annual update of large-scale indicators of the state of the climate system and the human influence, Earth System Science Data, doi.org/10.5194/essd-2023-166<br> Lizenz: [h… | 1 |
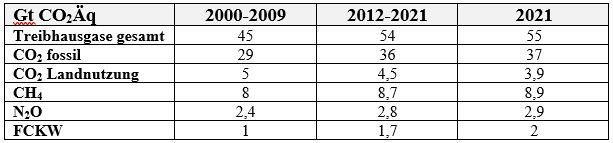
| 14:11, 26. Jun. 2023 | THG-Emissionen 2000-2021.jpg (Datei) | 26 KB | == Beschreibung == Mittlere Treibhausgasemissionen 2000-2009, 2012-2021 und 2021 in Gt CO2-Äquivalent ==Lizenzhinweis== {| style="border:1px solid #8888aa; background-color:#f7f8ff;padding:5px;font-size:95%;" | Quelle: Forster, P. M., C.J. Smith, T. Walsh et al. (2023): Indicators of Global Climate Change 2022: Annual update of large-scale indicators of the state of the climate system and the human influence, Earth System Science Data, doi.org/10.5194/essd-2023-166<br> Lizenz: [https://creat… | 1 | |
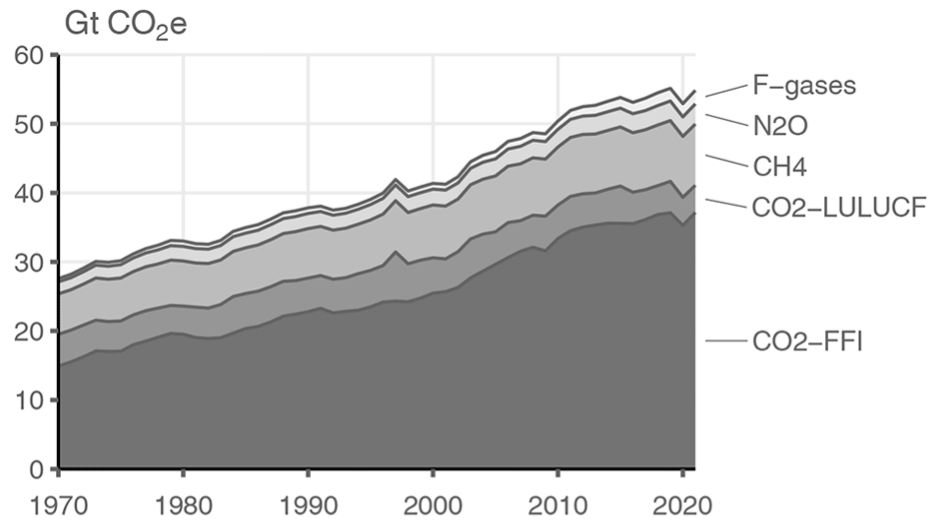
| 14:05, 26. Jun. 2023 | Global THG emissions.jpg (Datei) |  |
36 KB | == Beschreibung == Treibhausgasemissionen 1970 bis 2021. F-gases = fluorierte Kohlenwasserstoffe, N2O = Distickstoffoxid, CH4= Methan, CO2-LULUCF = CO2 aus Landnutzungsänderungen, CO2-FFI = fossile und industrielle CO2-Emissionen ==Lizenzhinweis== {| style="border:1px solid #8888aa; background-color:#f7f8ff;padding:5px;font-size:95%;" | Quelle: Forster, P. M., C.J. Smith, T. Walsh et al. (2023): Indicators of Global Climate Change 2022: Annual update of large-scale indicators of the state of th… | 1 |
| 14:24, 19. Jun. 2023 | GHG-emissions2000-2021 Tab.jpg (Datei) | 19 KB | 3 | ||
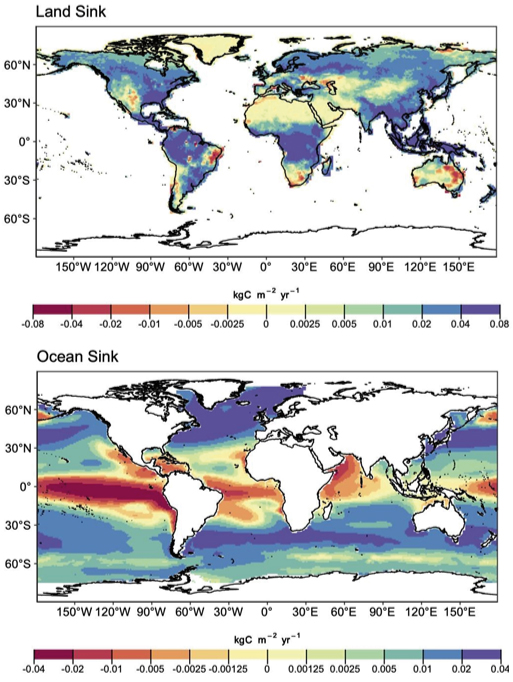
| 14:10, 19. Jun. 2023 | CO2-Land-Ocean-sink.jpg (Datei) |  |
212 KB | == Beschreibung == CO2-Senken auf dem Land und im Ozean. Grüne und blaue Farben bezeichnen Netto-CO2-Aufnahmen aus der Atmosphäre (Senken), gelbe und rote Farben Netto-CO2-Abgaben an die Atmosphäre (Quellen). == Lizenzhinweis == {| style="border:1px solid #8888aa; background-color:#f7f8ff;padding:5px;font-size:95%;" |Quelle: Darstellung nach Le Quéré et al. (2019): [https://www.globalcarbonproject.org/carbonbudget/19/presentation.htm Global Carbon Budget 2019]; Daten 2022 nach Friedlingstein,… | 1 |
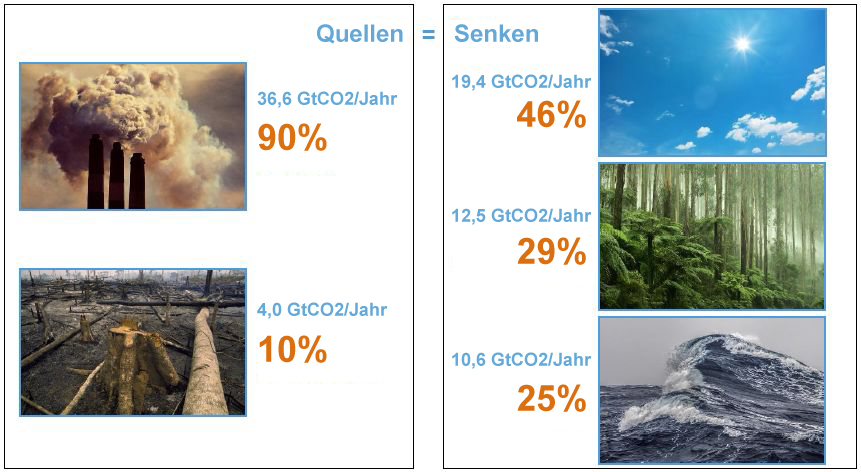
| 13:37, 19. Jun. 2023 | CO2 sources sinks2022.jpg (Datei) |  |
179 KB | Quellen und Senken von Kohlendioxid 2022. Die Prozentangaben sind gerundet. == Lizenzhinweis == {| style="border:1px solid #8888aa; background-color:#f7f8ff;padding:5px;font-size:95%;" |Quelle: Darstellung nach Le Quéré et al. (2019): Global Carbon Budget 2019 https://www.globalcarbonproject.org/carbonbudget/19/presentation.htm; Daten 2022 nach Frielingstein 2022 Lizenz: CC BY |} | 1 |
| 09:14, 16. Jun. 2023 | GHG-emissions1970-2021 Tab.jpg (Datei) | 19 KB | == Beschreibung == Treibhausgasemissionen 2000-2021. F-gases = FCKW (Fluorchlorkohlenwasserstoffe), CO<sub>2</sub>-LULUCF = CO<sub>2</sub> aus Landnutzungsänderungen, CO<sub>2</sub>-FFI = fossile CO<sub>2</sub>-Emissionen ==Lizenzhinweis== {| style="border:1px solid #8888aa; background-color:#f7f8ff;padding:5px;font-size:95%;" | Quelle: Forster, P. M., C.J. Smith, T. Walsh et al. (2023): Indicators of Global Climate Change 2022: Annual update of large-scale indicators of the state of the clima… | 1 | |
| 09:09, 16. Jun. 2023 | GHG-emissions1970-2021.jpg (Datei) |  |
30 KB | == Beschreibung == Treibhausgasemissionen 1970-2021. F-Gase = FCKW (Fluorkohlenwasserstoffe), CO2-LULUCF = CO2 aus Landnutzungsänderungen, CO2-FFI = fossile CO2-Emissionen ==Lizenzhinweis== {| style="border:1px solid #8888aa; background-color:#f7f8ff;padding:5px;font-size:95%;" | Quelle: Forster, P. M., C.J. Smith, T. Walsh et al. (2023): Indicators of Global Climate Change 2022: Annual update of large-scale indicators of the state of the climate system and the human influence, Earth System Sc… | 1 |
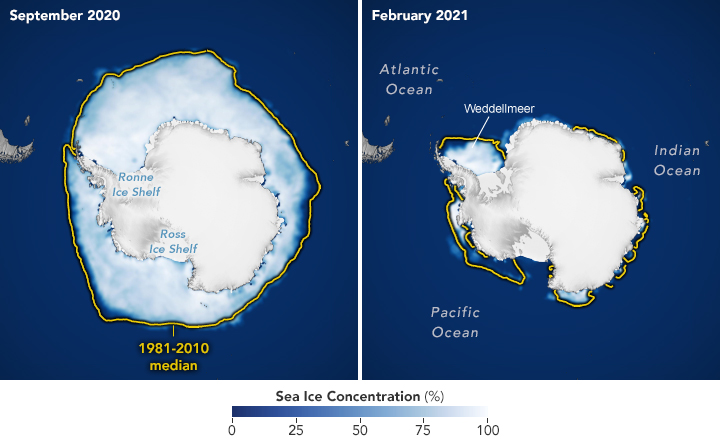
| 07:12, 16. Jun. 2023 | Antarctic nsidc 2021.png (Datei) |  |
201 KB | 2 | |
| 15:36, 15. Jun. 2023 | Radiative-forcing-1750-2022 dt.jpg (Datei) |  |
220 KB | 2 | |
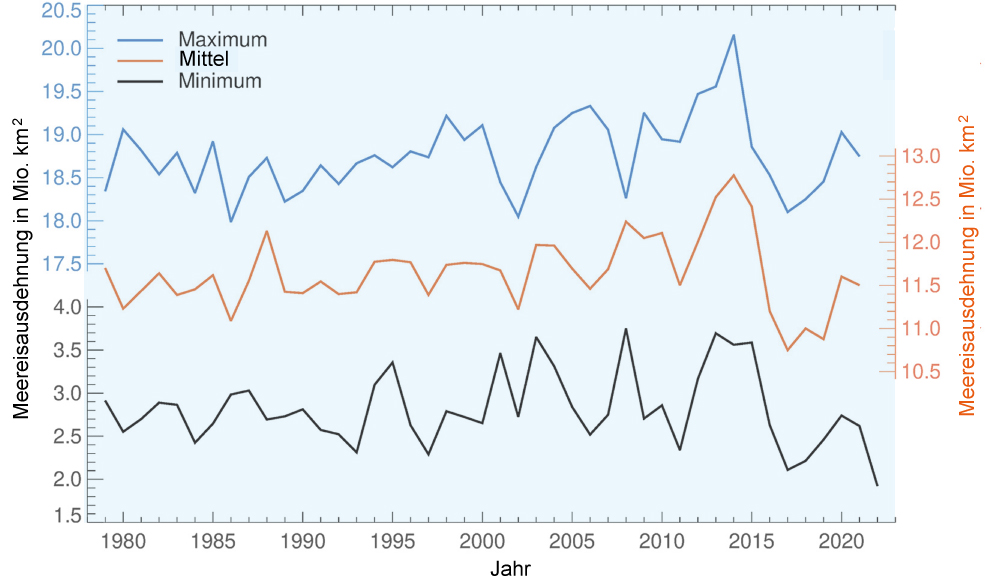
| 09:18, 12. Jun. 2023 | Antarktis Meereisausdehnung-1979-2022.jpg (Datei) |  |
177 KB | == Beschreibung == Änderung der antarktischen Meereisausdehnung im jährlichen Mittel (Orange), Maximum (blau) und Minimum (schwarz) ==Lizenzhinweis== {| style="border:1px solid #8888aa; background-color:#f7f8ff;padding:5px;font-size:95%;" | Quelle: Turner, J., C. Holmes, C. Harrison et al. (2022). Record low Antarctic sea ice cover in February 2022. Geophysical Research Letters, 49, e2022GL098904. https://doi.org/10.1029/2022GL098904 <br> Lizenz: CC BY http://creativecommons.org/licenses/by/4.… | 1 |
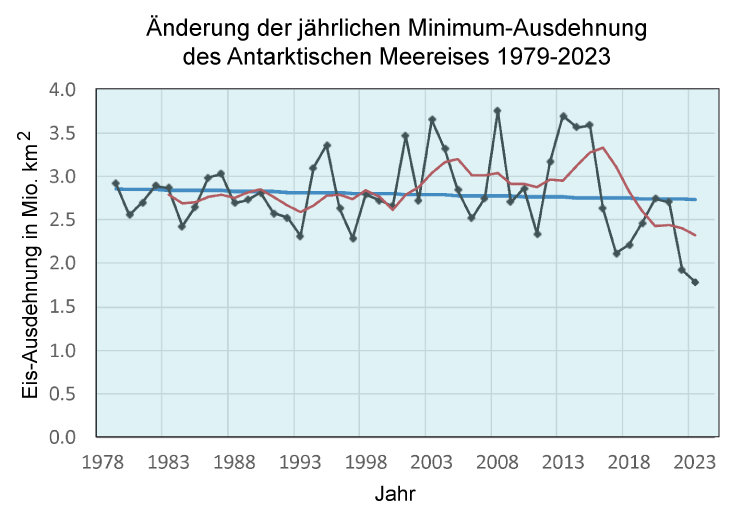
| 07:32, 12. Jun. 2023 | AntarcticMinExtent Febr-2023.jpg (Datei) |  |
99 KB | == Beschreibung == Änderung der Meereisausdehnung in der Antarktis im Februar 1979-2023. Trend: 1%/Jahrzehnt in Blau, 5-Jahresmittel in Rot. ==Lizenzhinweis== {| style="border:1px solid #8888aa; background-color:#f7f8ff;padding:5px;font-size:95%;" |Quelle: National Snow and Ice Data Center (2023): [https://nsidc.org/arcticseaicenews/2023/02/antarctic-sea-ice-minimum-settles-on-record-low-extent-again/ Sea Ice Index Daily and Monthly Image Viewer]<br /> Lizenz: NOAA public domain: [http://www.nw… | 1 |
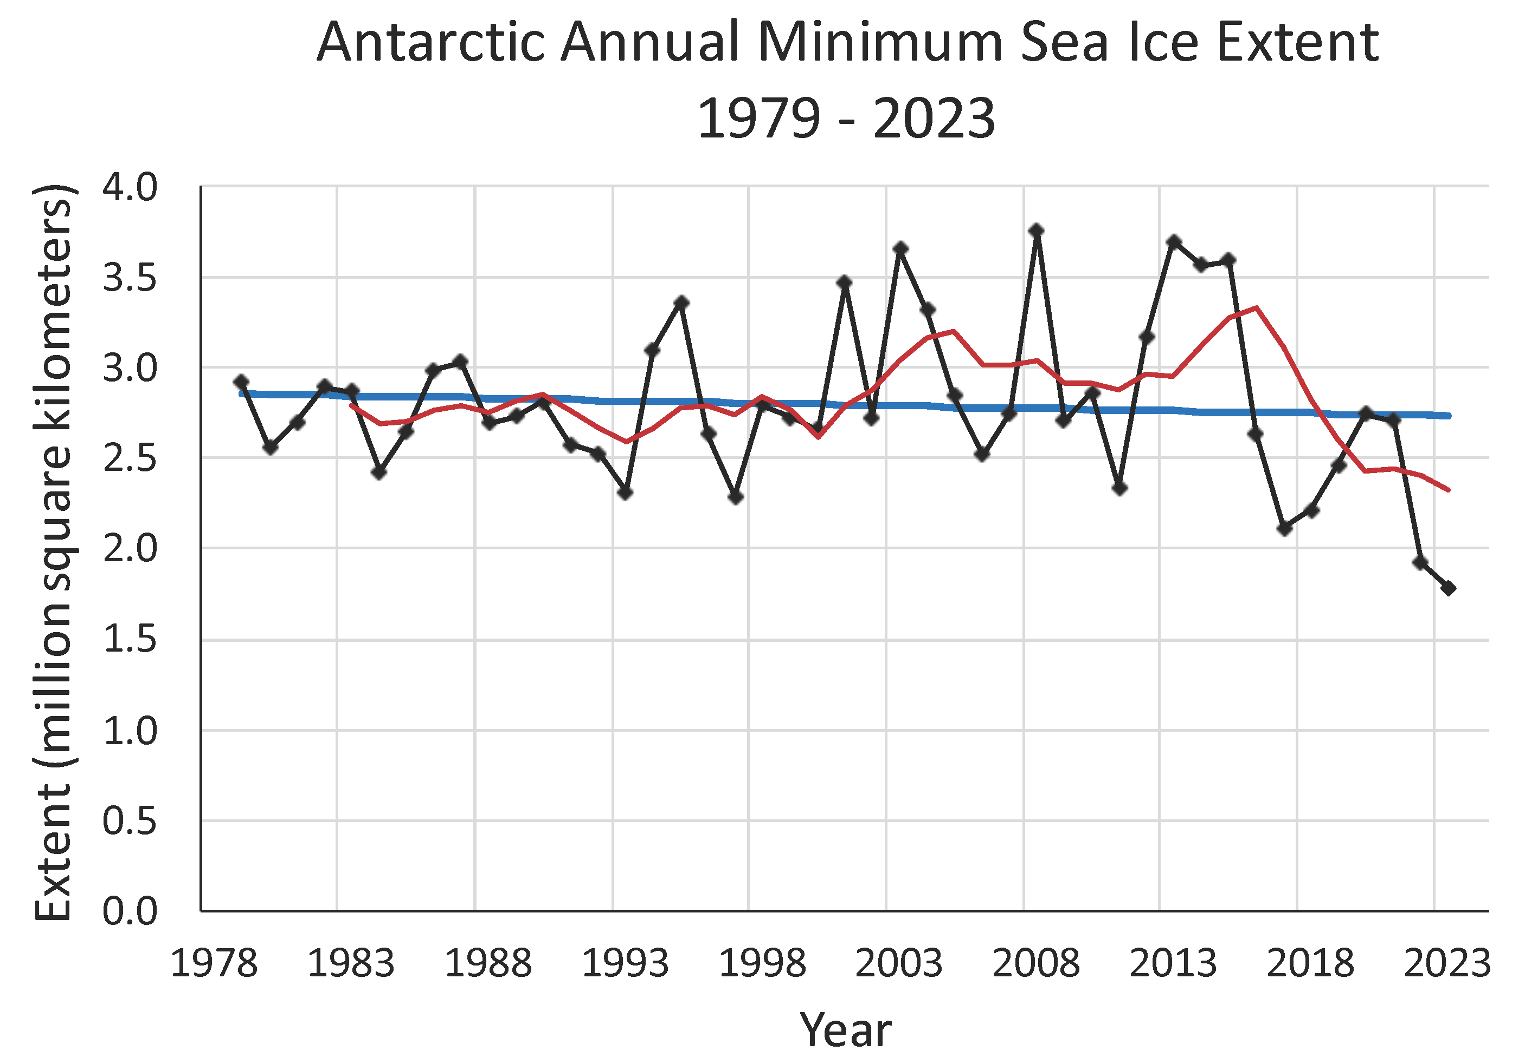
| 13:30, 11. Jun. 2023 | AntarcticMinExtent Febr-2023.png (Datei) |  |
190 KB | Änderung der Meereisausdehnung in der Antarktis im Mai 1979-2023 im Februar ==Lizenzhinweis== {| style="border:1px solid #8888aa; background-color:#f7f8ff;padding:5px;font-size:95%;" |Quelle: National Snow and Ice Data Center (2023): Sea Ice Index Daily and Monthly Image Viewer, https://nsidc.org/arcticseaicenews/2023/02/antarctic-sea-ice-extent-sets-a-new-record-low/<br /> Lizenz: NOAA public domain: [http://www.nws.noaa.gov/disclaimer.php Use of Data and Products] |} | 1 |
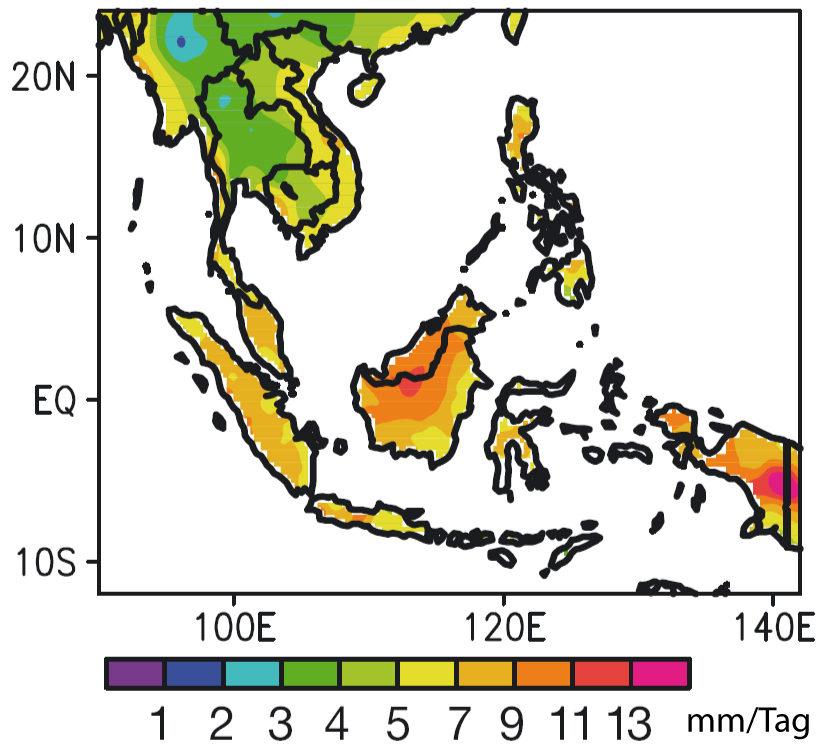
| 17:11, 26. Mai 2023 | Prec-SE-Asia-annual.jpg (Datei) |  |
225 KB | == Beschreibung == Jährlicher Niederschlag in Südostasien in mm/Tag ==Lizenzhinweis== {| style="border:1px solid #8888aa; background-color:#f7f8ff;padding:5px;font-size:95%;" | Quelle: Ratna, S.B., J.V. Ratnam, S.K. Behera, F.T. Tangang, and T. Yamagata, 2017: Validation of the WRF regional climate model over the subregions of Southeast Asia: climatology and interannual variability. Climate Research, 71(3), 263–280, doi:10.3354/cr01445<br> Lizenz: [http://creativecommons.org/licenses/by/4.0/ CC… | 1 |
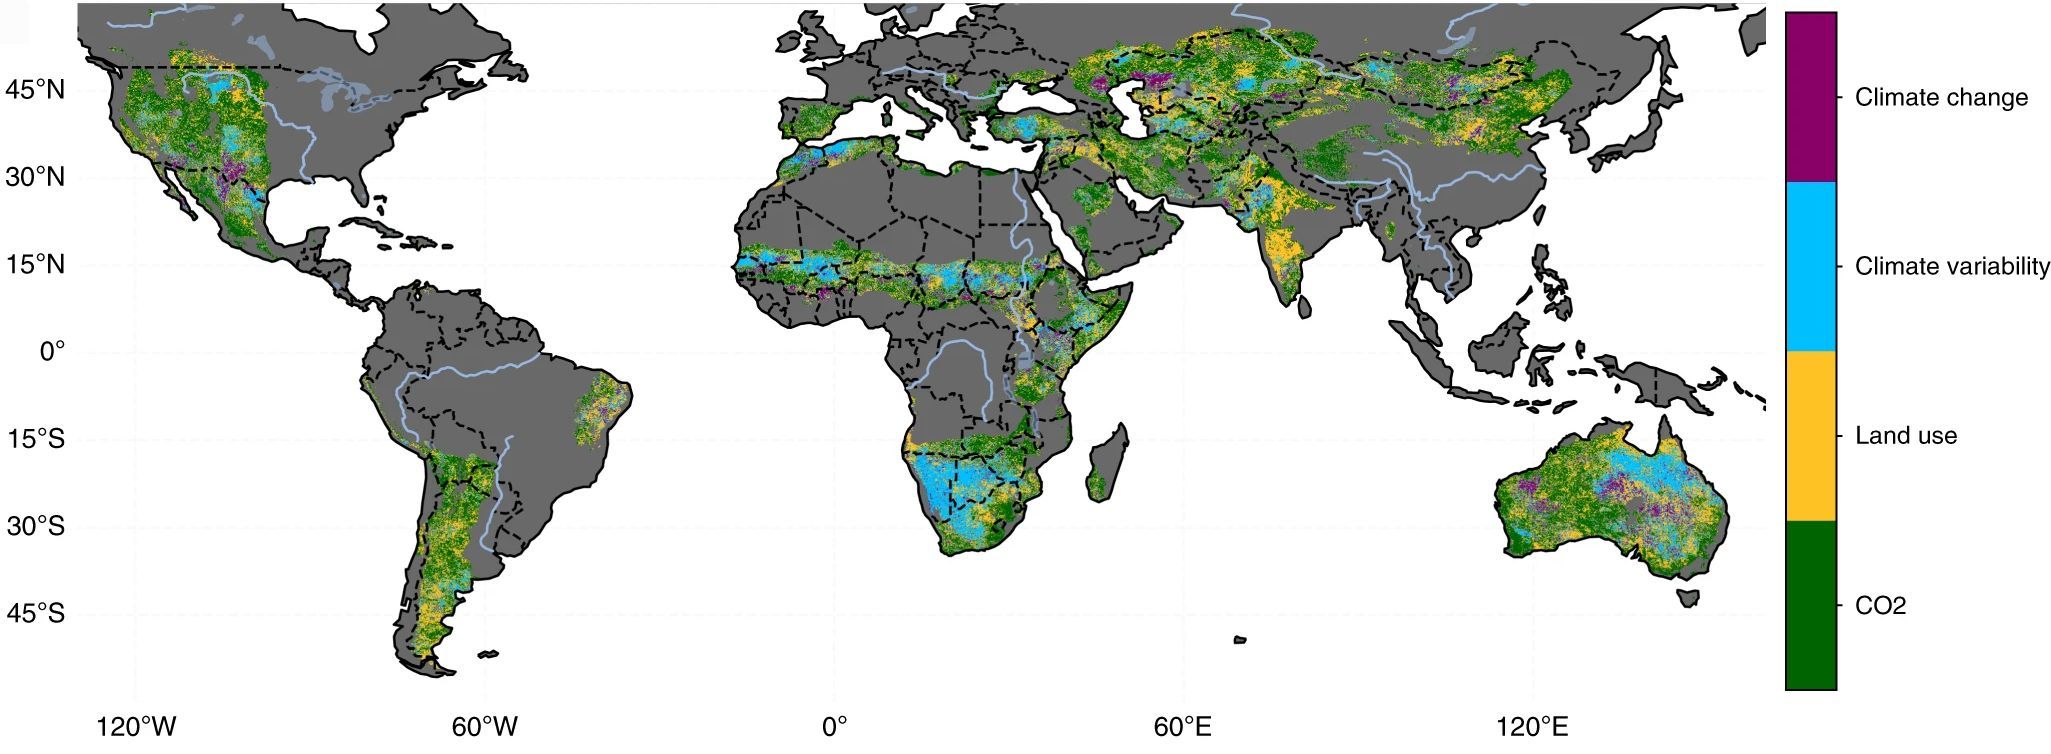
| 19:25, 22. Mai 2023 | Greening causes.jpg (Datei) |  |
186 KB | 2 | |
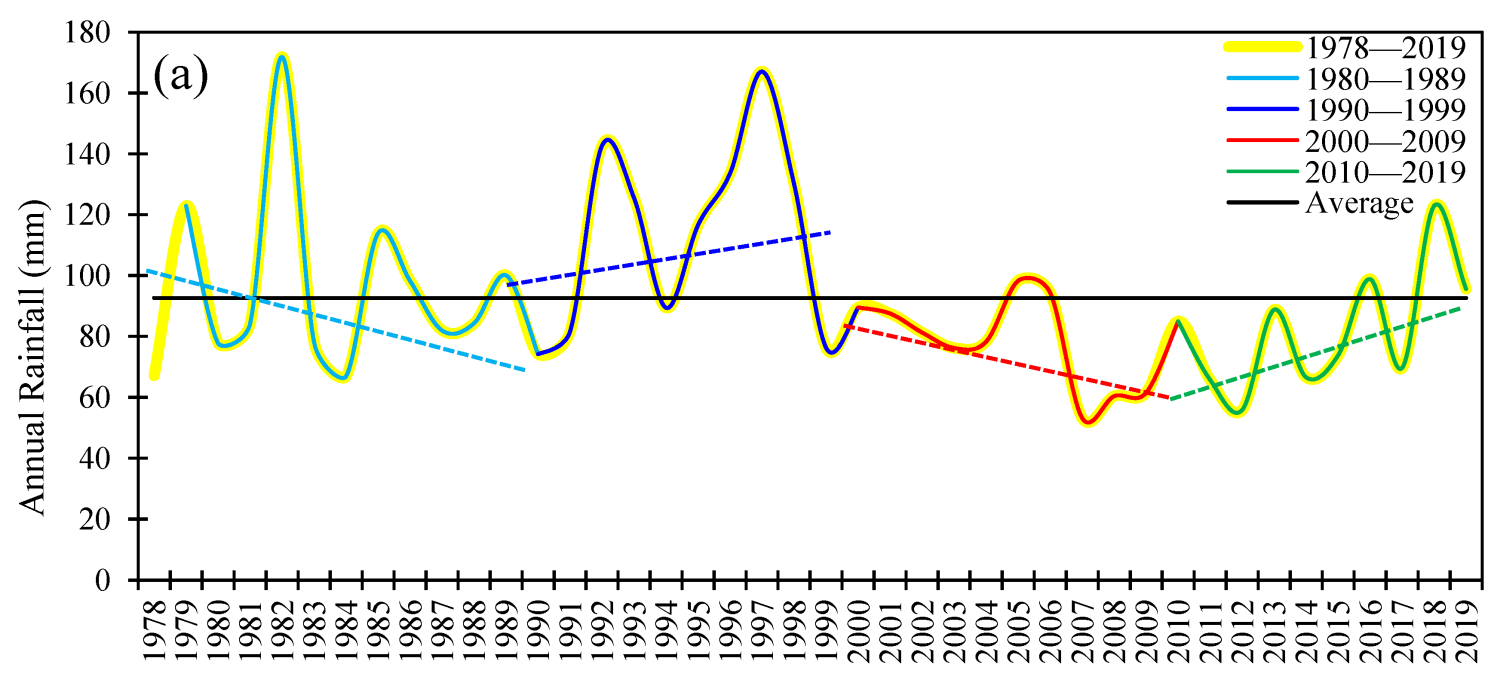
| 16:20, 22. Mai 2023 | Saudi-Arabien prec 1978-2019.png (Datei) |  |
180 KB | == Beschreibung == Änderung der Jahresmitteltemperatur in Saudi-Arabien 1978-2019 ==Lizenzhinweis== {| style="border:1px solid #8888aa; background-color:#f7f8ff;padding:5px;font-size:95%;" | Quelle: Almazroui, M. (2020b): Rainfall Trends and Extremes in Saudi Arabia in Recent Decades. Atmosphere, 11(9), 964, doi:10.3390/atmos11090964<br> Lizenz: [http://creativecommons.org/licenses/by/4.0/ CC BY] |} | 1 |
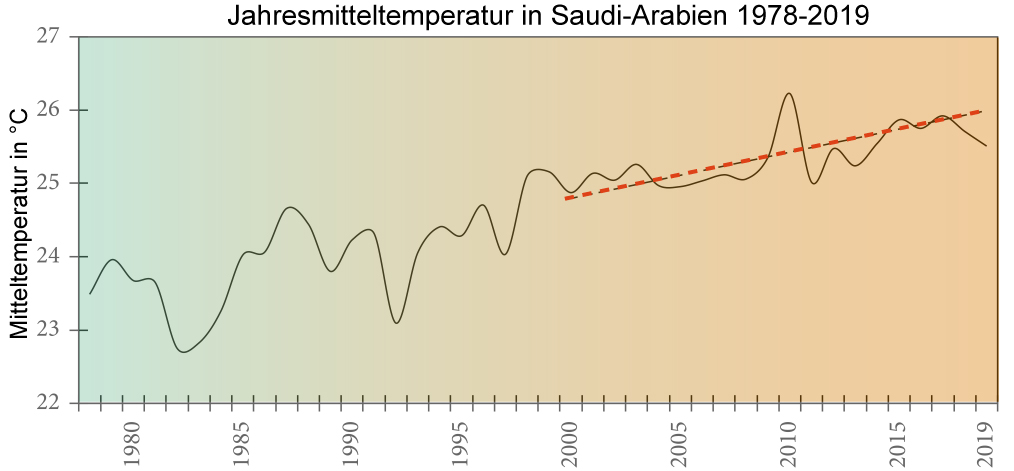
| 16:14, 22. Mai 2023 | SaudiArabien-temp-1978-2019.jpg (Datei) |  |
95 KB | == Beschreibung == Monatliche Niederschläge im Januar und Juli als Mittel über den Zeitraum 1980-2019 in der Region um den Persischen Golf ==Lizenzhinweis== {| style="border:1px solid #8888aa; background-color:#f7f8ff;padding:5px;font-size:95%;" | Quelle: Dasari, H.P., Y. Viswanadhapalli, S. Langodan et al. (2022): [https://doi.org/10.1002/met.2102 High-resolution climate characteristics of the Arabian Gulf based on a validated regional reanalysis], Meteorological Applications; 29:e2102.<br> Li… | 1 |
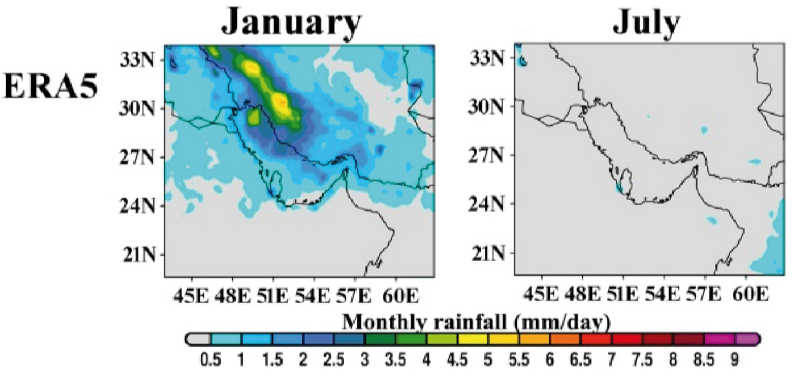
| 16:07, 22. Mai 2023 | Golf-region-monthly-rain.jpg (Datei) |  |
126 KB | == Beschreibung == Monatliche Niederschläge im Januar und Juli als Mittel über den Zeitraum 1980-2019 in der Region um den Persischen Golf ==Lizenzhinweis== {| style="border:1px solid #8888aa; background-color:#f7f8ff;padding:5px;font-size:95%;" | Quelle: Dasari, H.P., Y. Viswanadhapalli, S. Langodan et al. (2022): High-resolution climate characteristics of the Arabian Gulf based on a validated regional reanalysis, Meteorological Applications; 29:e2102. https://doi.org/10.1002/met.2102<br> Lize… | 1 |
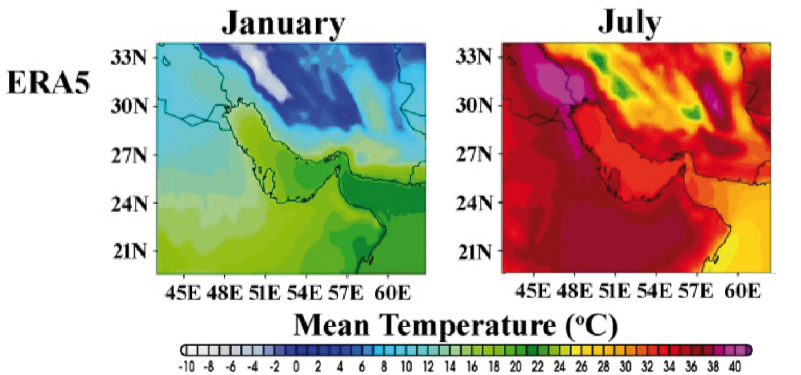
| 16:02, 22. Mai 2023 | Golf-region-monthly-temp.jpg (Datei) |  |
154 KB | == Beschreibung == Monatliche Niederschläge im Januar und Juli in der Region um den Persischen Golf ==Lizenzhinweis== {| style="border:1px solid #8888aa; background-color:#f7f8ff;padding:5px;font-size:95%;" | Quelle: Dasari, H.P., Y. Viswanadhapalli, S. Langodan et al. (2022): High-resolution climate characteristics of the Arabian Gulf based on a validated regional reanalysis, Meteorological Applications; 29:e2102. https://doi.org/10.1002/met.2102<br> Lizenz: CC BY-NC-ND http://creativecommons.… | 1 |
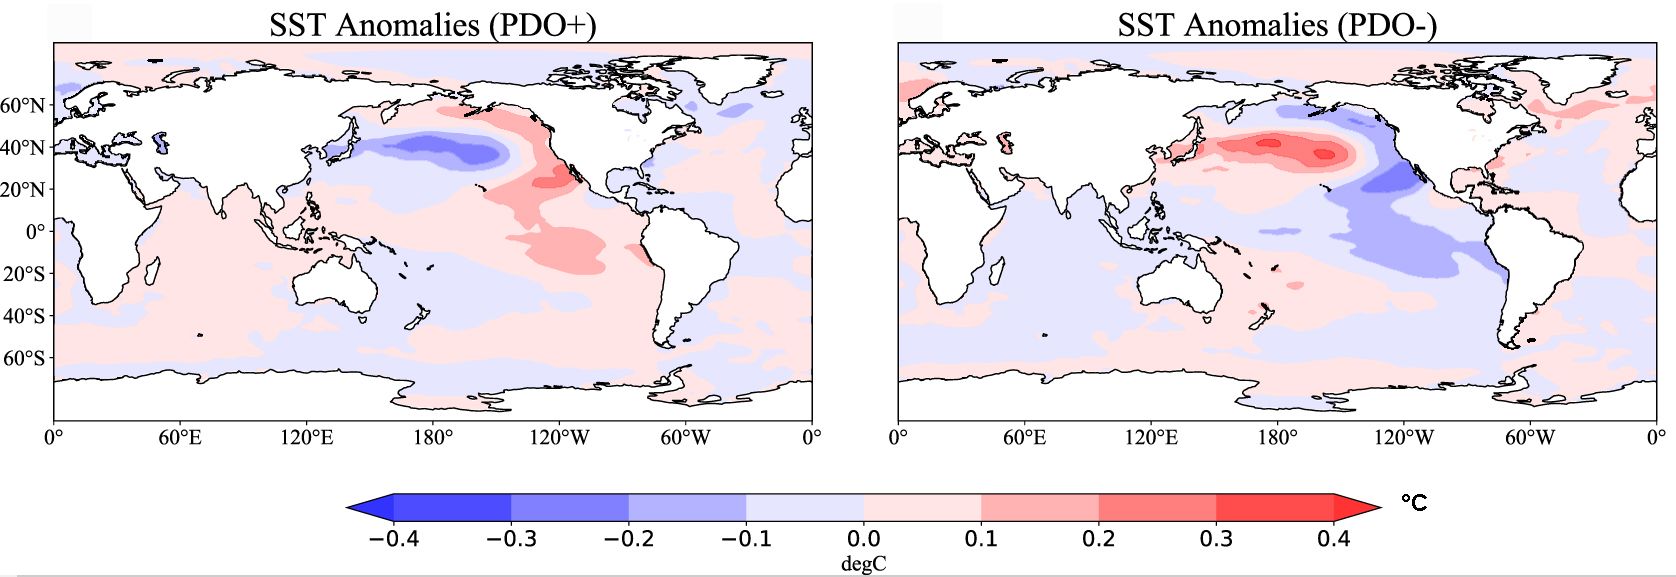
| 19:11, 16. Mai 2023 | PDO + - SST Pazifik.jpg (Datei) |  |
132 KB | Positive (links) und negative (rechts) Phase der Pazifischen Dekadenoszillation PDO in °C der Meeresoberflächentemperatur im nördlichen Pazifik. == Lizenzhinweis == {| style="border:1px solid #8888aa; background-color:#f7f8ff;padding:5px;font-size:95%;" |Quelle: Wie, W., Z. Yan and Z. Li (2021): Influence of Pacific Decadal Oscillation on global precipitation extremes, Environ. Res. Lett. 16 044031, DOI 10.1088/1748-9326/abed7c Lizenz: CC BY http://creativecommons.org/licenses/by/4.0/ |} | 1 |
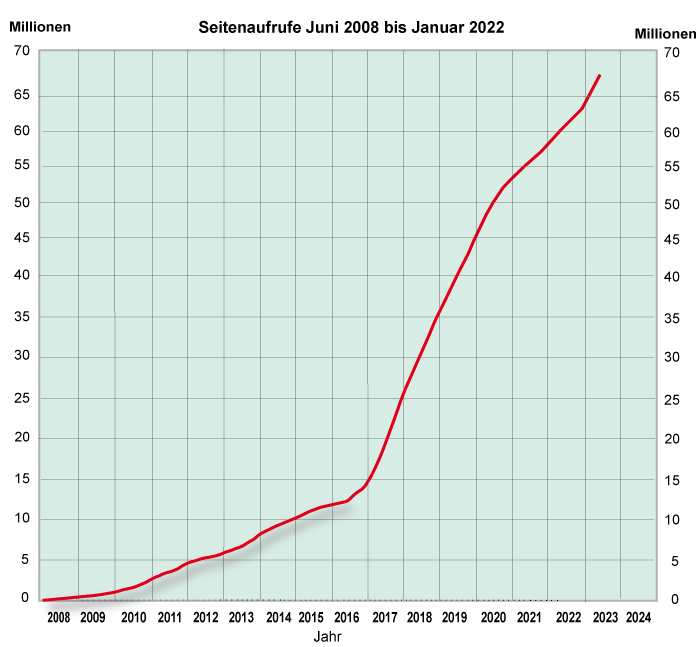
| 11:10, 14. Mai 2023 | Seitenaufrufe.jpg (Datei) |  |
121 KB | 25 | |
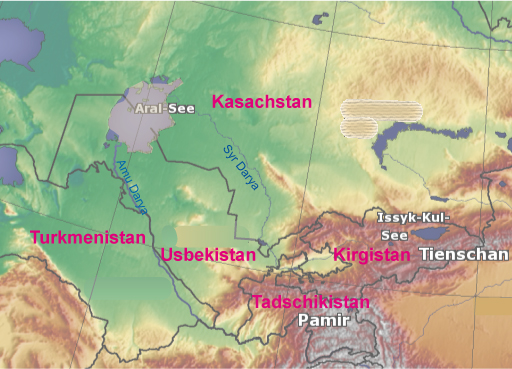
| 08:38, 14. Mai 2023 | Mittelasien.jpg (Datei) |  |
173 KB | == Beschreibung == Mittelasien ==Lizenzhinweis== {| style="border:1px solid #8888aa; background-color:#f7f8ff;padding:5px;font-size:95%;" | Quelle: Kartenausschnitt aus Wikimedia Commons (2005): [https://commons.wikimedia.org/wiki/File:Zentralasien%20topo.png Topografische Karte von Zentralasien], Ländernamen ergänzt.<br> Lizenz: CC BY-SA https://creativecommons.org/licenses/by-sa/3.0/deed.en |} | 1 |
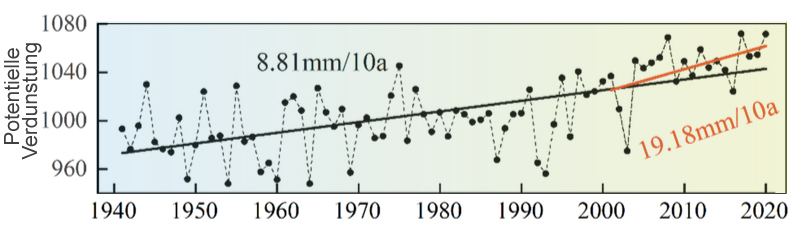
| 14:43, 13. Mai 2023 | CA-evapo-1941-2020.jpg (Datei) |  |
84 KB | == Beschreibung == Änderung der Potentiellen Verdunstung in Mittelasien 1941 bis 2020 in mm pro Jahrzehnt ==Lizenzhinweis== {| style="border:1px solid #8888aa; background-color:#f7f8ff;padding:5px;font-size:95%;" | Quelle: Yan, X., Q. Zhang X. Ren, et al. (2022): Climatic Change Characteristics towards the “Warming–Wetting” Trend in the Pan-Central-Asia Arid Region. Atmosphere 2022, 13, 467. https://doi.org/10.3390/atmos13030467<br> Lizenz: [https://creativecommons.org/licenses/by/4.0/ CC BY 4.… | 1 |
| 14:14, 13. Mai 2023 | Mittelasien-prec-Änderung.jpg (Datei) |  |
105 KB | == Beschreibung == Regionale Änderung der jährlichen Niederschläge 1950 bis 2016 ==Lizenzhinweis== {| style="border:1px solid #8888aa; background-color:#f7f8ff;padding:5px;font-size:95%;" | Quelle: Haag, I., P.D. Jones, and C. Samimi (2019): Central Asia’s Changing Climate: How Temperature and Precipitation Have Changed across Time, Space, and Altitude" Climate 7, no. 10: 123. https://doi.org/10.3390/cli7100123<br> Lizenz: [https://creativecommons.org/licenses/by/4.0/ CC BY 4.0] |} | 1 |
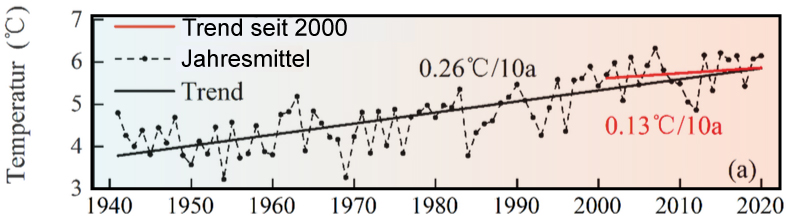
| 20:03, 12. Mai 2023 | Mittelasien-temp-1941-2020.jpg (Datei) |  |
87 KB | == Beschreibung == Änderung der Jahresmitteltemperatur in Mittelasien 1941 bis 2020 ==Lizenzhinweis== {| style="border:1px solid #8888aa; background-color:#f7f8ff;padding:5px;font-size:95%;" | Quelle: Yan, X., Q. Zhang X. Ren, et al. (2022): Climatic Change Characteristics towards the “Warming–Wetting” Trend in the Pan-Central-Asia Arid Region. Atmosphere 2022, 13, 467. https://doi.org/10.3390/atmos13030467<br> Lizenz: [https://creativecommons.org/licenses/by/4.0/ CC BY 4.0] |} | 1 |
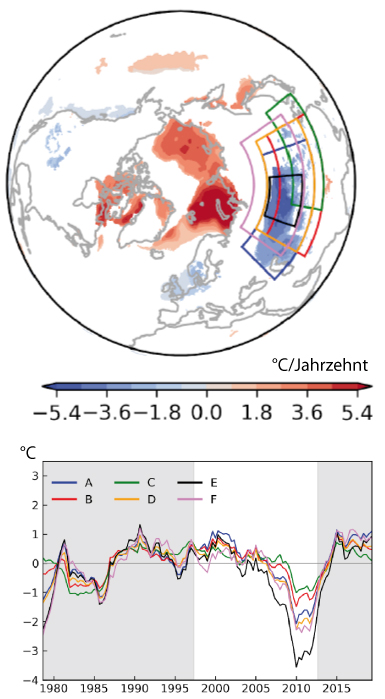
| 18:15, 10. Mai 2023 | Arctic-A Eurasia-cooling.jpg (Datei) |  |
124 KB | == Beschreibung == Arktische Verstärkung und eurasische Abkühlung. Die Karte zeigt die starke Erwärmung der Arktis, insbesondere über der Barents- und Karasee, sowie die Abkühlung in den mittleren Breiten Eurasiens. Die farbig eingerahmten Gebiete beziehen sich auf Temperaturänderungen in der Graphik darunter. ==Lizenzhinweis== {| style="border:1px solid #8888aa; background-color:#f7f8ff;padding:5px;font-size:95%;" | Quelle: Outten, S., C. Li, M.P. King et al. (2023): Reconciling conflicting e… | 1 |
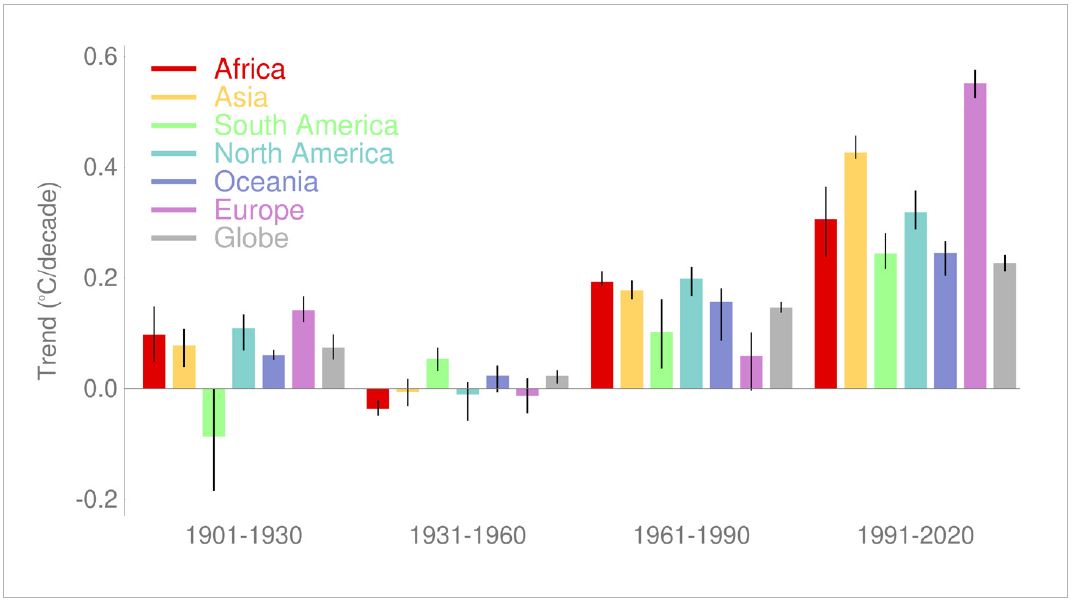
| 16:08, 8. Mai 2023 | Kontinente °C Jahrzehnt.jpg (Datei) |  |
39 KB | == Beschreibung == Änderung der globalen Mitteltemperatur von sechs WMO-Regionen (Kontinenten) in vier Klimaperioden ==Lizenzhinweis== {| style="border:1px solid #8888aa; background-color:#f7f8ff;padding:5px;font-size:95%;" | Quelle: World Meteorological Organization, WMO (2022): State of the Climate in Asia 2021<br> Lizenz: Short extracts from WMO publications may be reproduced without authorization, provided that the complete source is clearly indicated. |} | 1 |
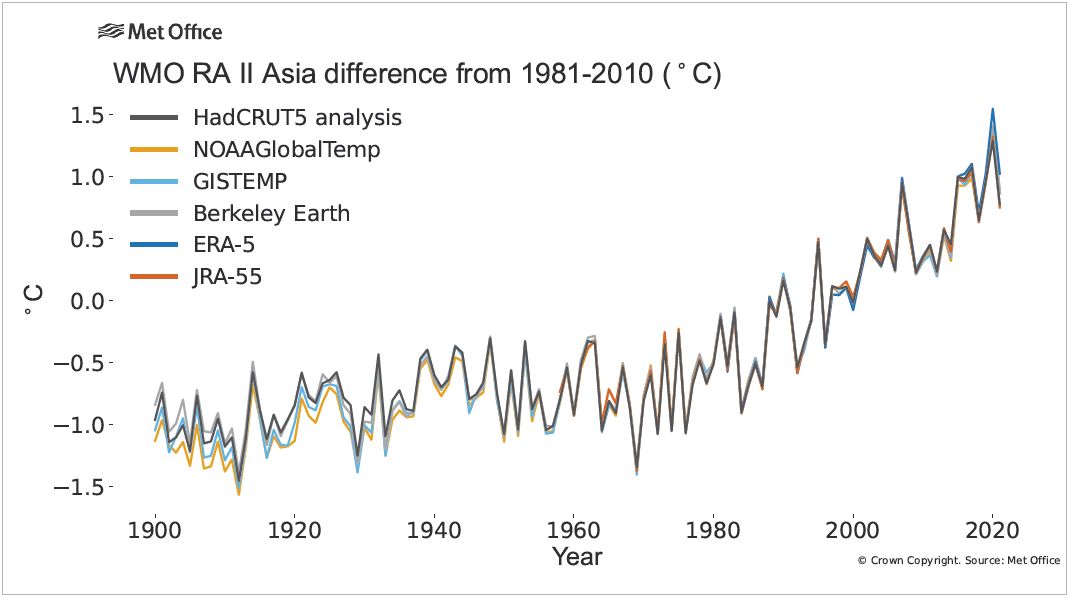
| 15:56, 8. Mai 2023 | Asia temp 1900-2021.jpg (Datei) |  |
57 KB | == Beschreibung == Änderung der Jahresmitteltemperatur 1900-2021 im Vergleich zum Mittel 1981-2020 in °C in der WMO-Region Asien ==Lizenzhinweis== {| style="border:1px solid #8888aa; background-color:#f7f8ff;padding:5px;font-size:95%;" | Quelle: World Meteorological Organization, WMO (2022): State of the Climate in Asia 2021; ursprgl. HadCRUT.5.0.1.0 http://www.metoffice.gov.uk/hadobs/hadcrut5<br> Lizenz: Short extracts from WMO publications may be reproduced without authorization, provided tha… | 1 |
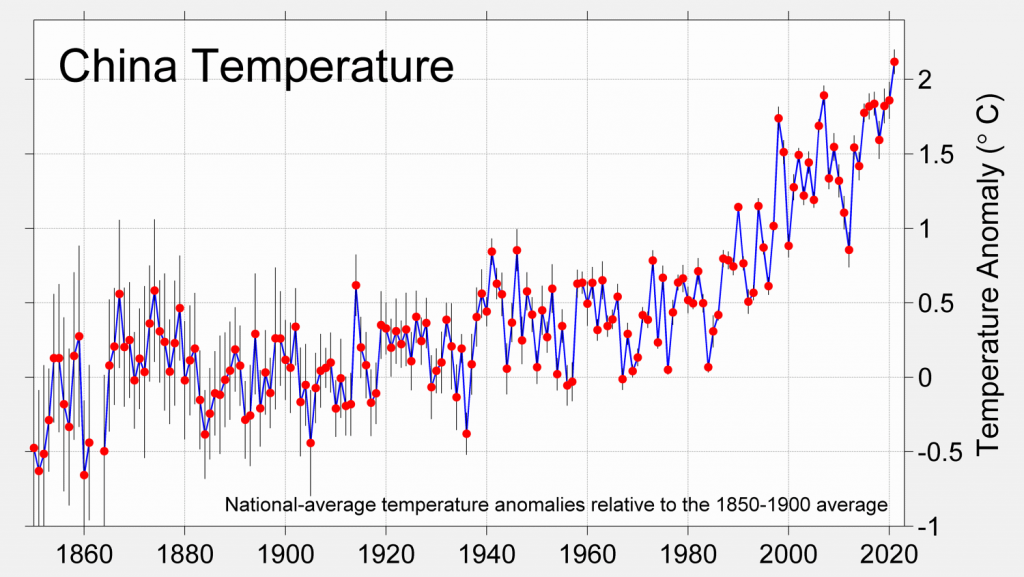
| 09:24, 8. Mai 2023 | ChinaTemperature-1850-2021.png (Datei) |  |
248 KB | Änderung der mittleren Jahrestemperatur in China 1850-2021 ==Lizenzhinweis== {| style="border:1px solid #8888aa; background-color:#f7f8ff;padding:5px;font-size:95%;" | Rohde, R. (2021): Global Temperature Report for 2021, http://berkeleyearth.org/global-temperature-report-for-2021/ CC BY 4.0 https://creativecommons.org/licenses/by/4.0/ |} | 1 |
| 10:06, 4. Mai 2023 | SO4-trends2000-2014.jpg (Datei) |  |
205 KB | == Beschreibung == Änderung der Sulfataerosol-Konzentration 2000-2015 in % ==Lizenzhinweis== {| style="border:1px solid #8888aa; background-color:#f7f8ff;padding:5px;font-size:95%;" | Quelle: Mortier, A., J. Gliß, J., M. Schulz et al. (2020): Evaluation of climate model aerosol trends with ground-based observations over the last 2 decades – an AeroCom and CMIP6 analysis, Atmos. Chem. Phys., 20, 13355–13378, https://doi.org/10.5194/acp-20-13355-2020<br /> Lizenz: [https://creativecommons.org/lic… | 1 |
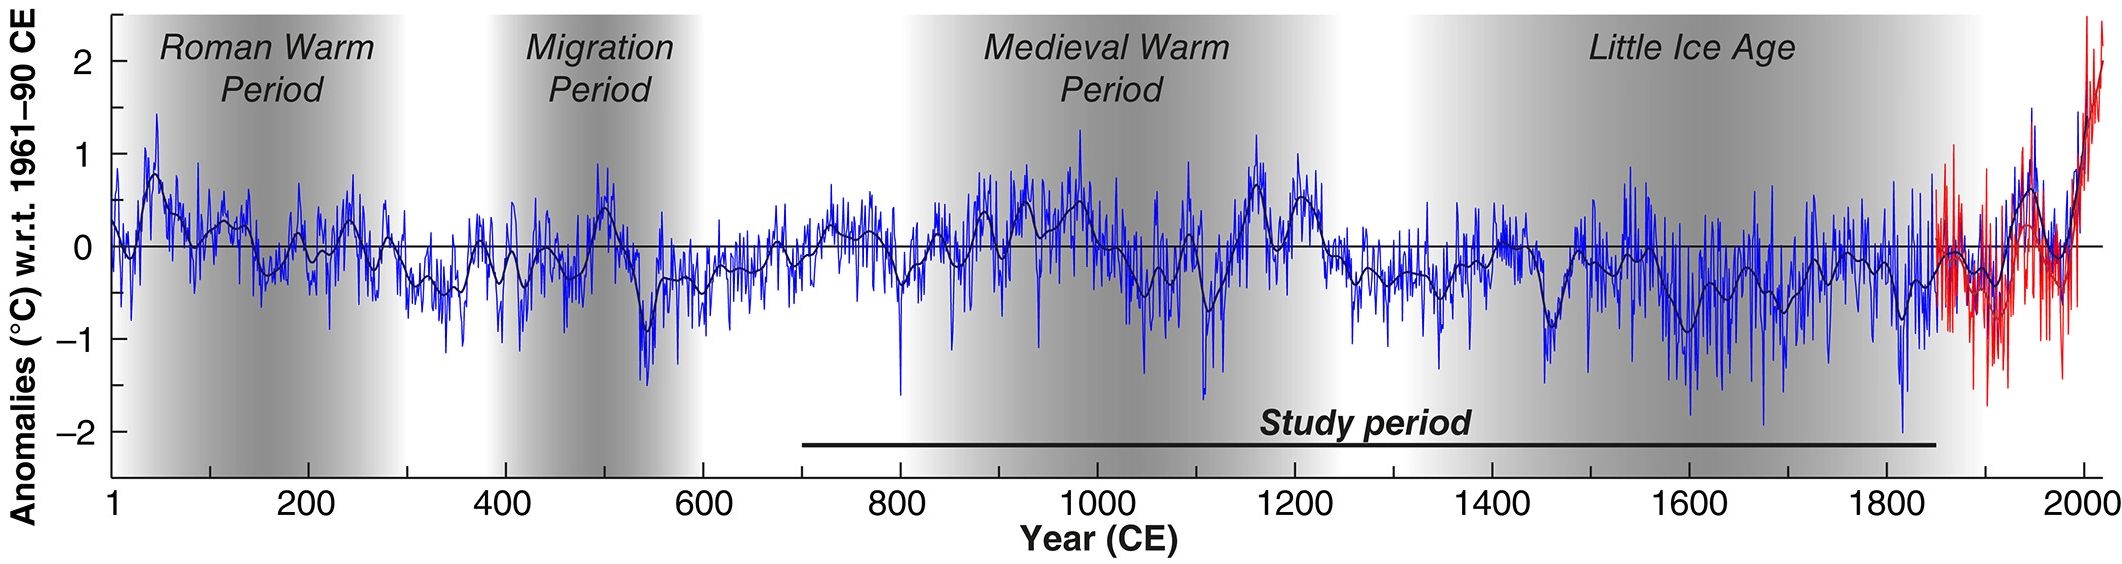
| 10:14, 29. Apr. 2023 | Europe summer temp 2000years.jpg (Datei) | 155 KB | == Beschreibung == Sommertemperaturen in Europa in den letzten 2000 Jahren in °C im Vergleich zum Mittel 1961-1990 ==Lizenzhinweis== {| style="border:1px solid #8888aa; background-color:#f7f8ff;padding:5px;font-size:95%;" | Quelle: Ljungqvist, F., A. Seim and H. Huhtamaa (2021): Climate and society in European history, WIREs Climate Change, 12, e691, https://doi.org/10.1002/wcc.691; nach Luterbacher, J., J.P. Werner, J.E. Smerdon et al. (2016). European summer temperatures since Roman times. En… | 1 |
