Von Dieter Kasang hochgeladene Dateien
Aus Klimawandel
Diese Spezialseite listet alle hochgeladenen Dateien auf.
| Datum | Name | Vorschaubild | Größe | Beschreibung | Versionen |
|---|---|---|---|---|---|
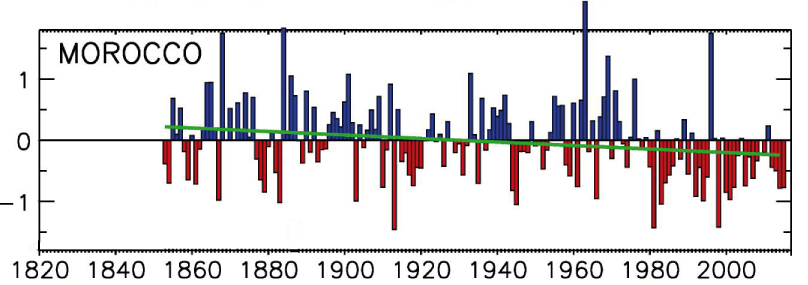
| 15:32, 10. Sep. 2022 | Morocco-rainfall.jpg (Datei) |  |
99 KB | == Beschreibung == Änderung der mittleren Jahresniederschläge 1850-2015 als Standardabweichung ==Lizenzhinweis== {| style="border:1px solid #8888aa; background-color:#f7f8ff;padding:5px;font-size:95%;" | Quelle: Nicholson, S. E., C. Funk and A. H. Fink, 2018: Rainfall over the African continent from the 19th through the 21st century. Global and Planetary Change, 165, 114–127, doi:https://doi.org/10.1016/j.gloplacha.2017.12.014<br> Lizenz: CC BY-NC-ND https://creativecommons.org/licenses/by-n… | 1 |
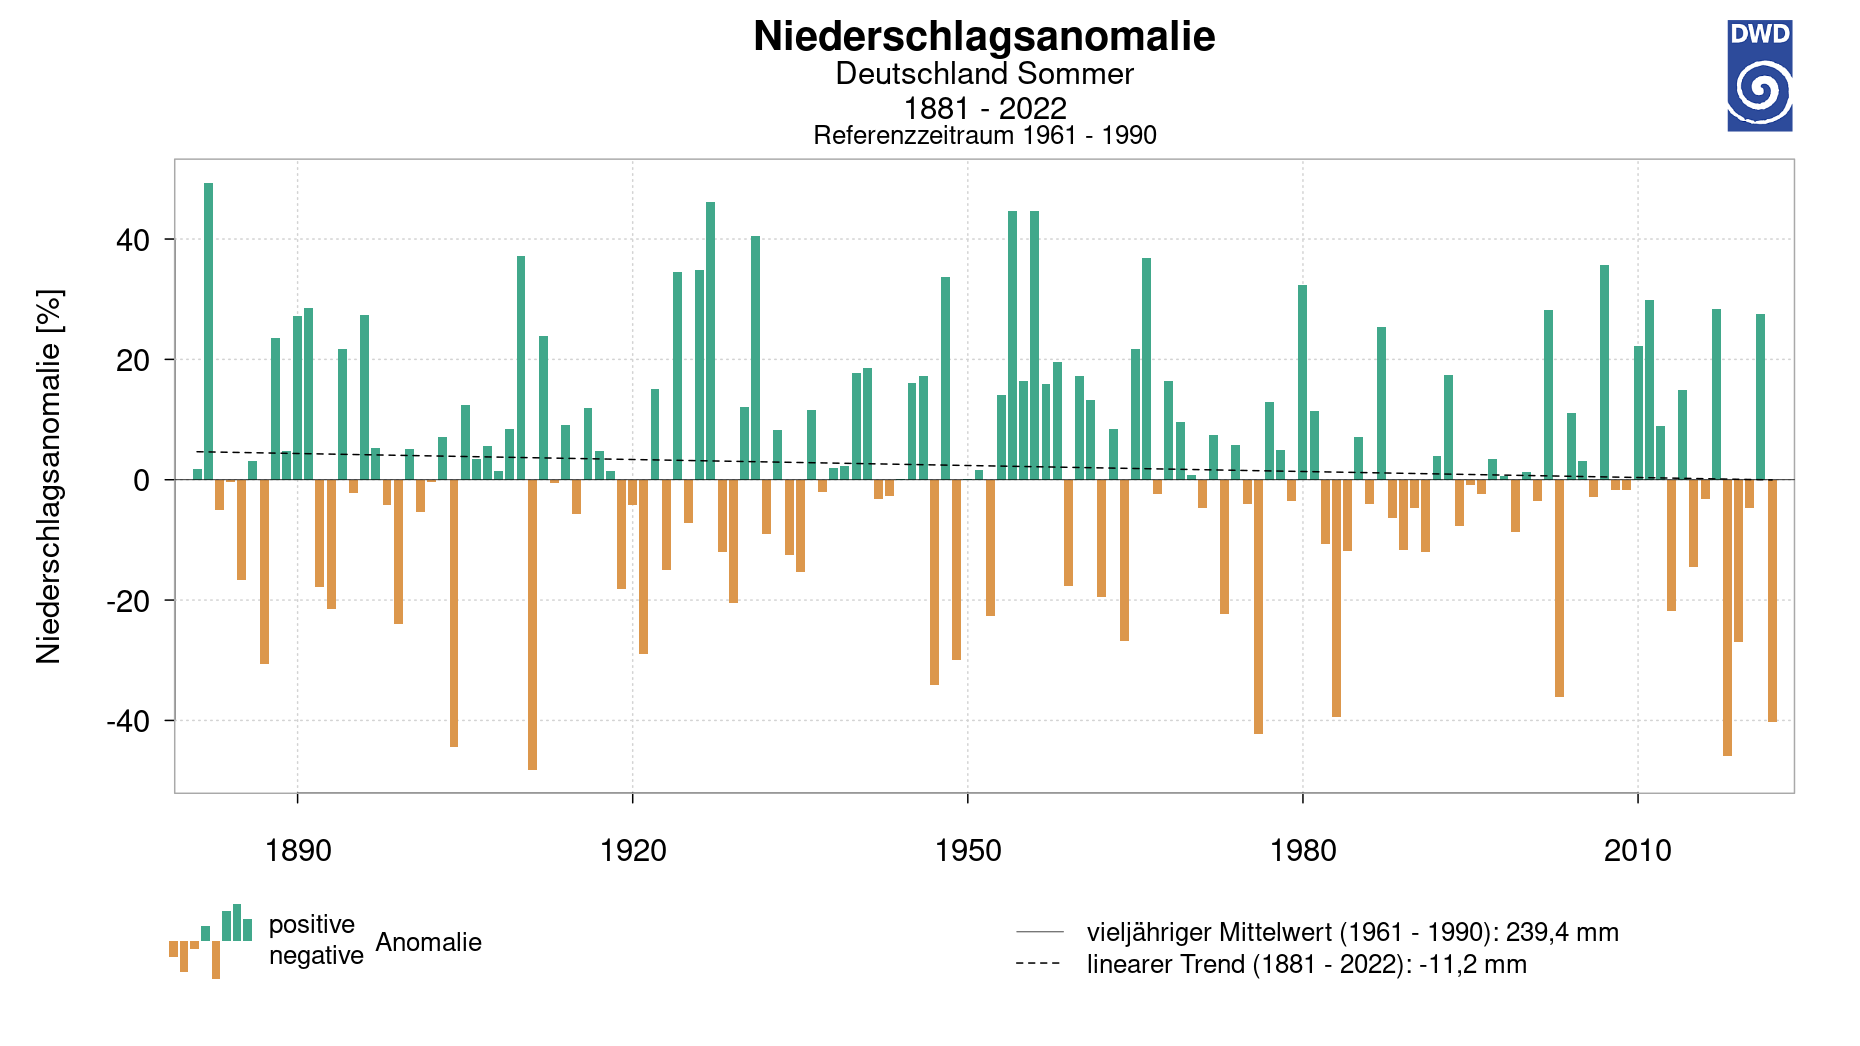
| 08:39, 4. Sep. 2022 | D Niederschlag 1881-2022.png (Datei) |  |
99 KB | == Beschreibung == Sommerniederschläge in Deutschland 1881 bis 2022 im Vergleich zum Mittel 1961-1990 == Lizenzhinweis == {| style="border:1px solid #8888aa; background-color:#f7f8ff;padding:5px;font-size:95%;" |Quelle: [https://www.dwd.de/DE/leistungen/zeitreihen/zeitreihen.html?nn=480164 DWD: Zeitreihen und Trends, Deutschland Sommer, 1881-2022]<br> Lizenz: [http://creativecommons.org/licenses/by-nc-nd/4.0/deed.de CC BY-NC-ND] |} | 1 |
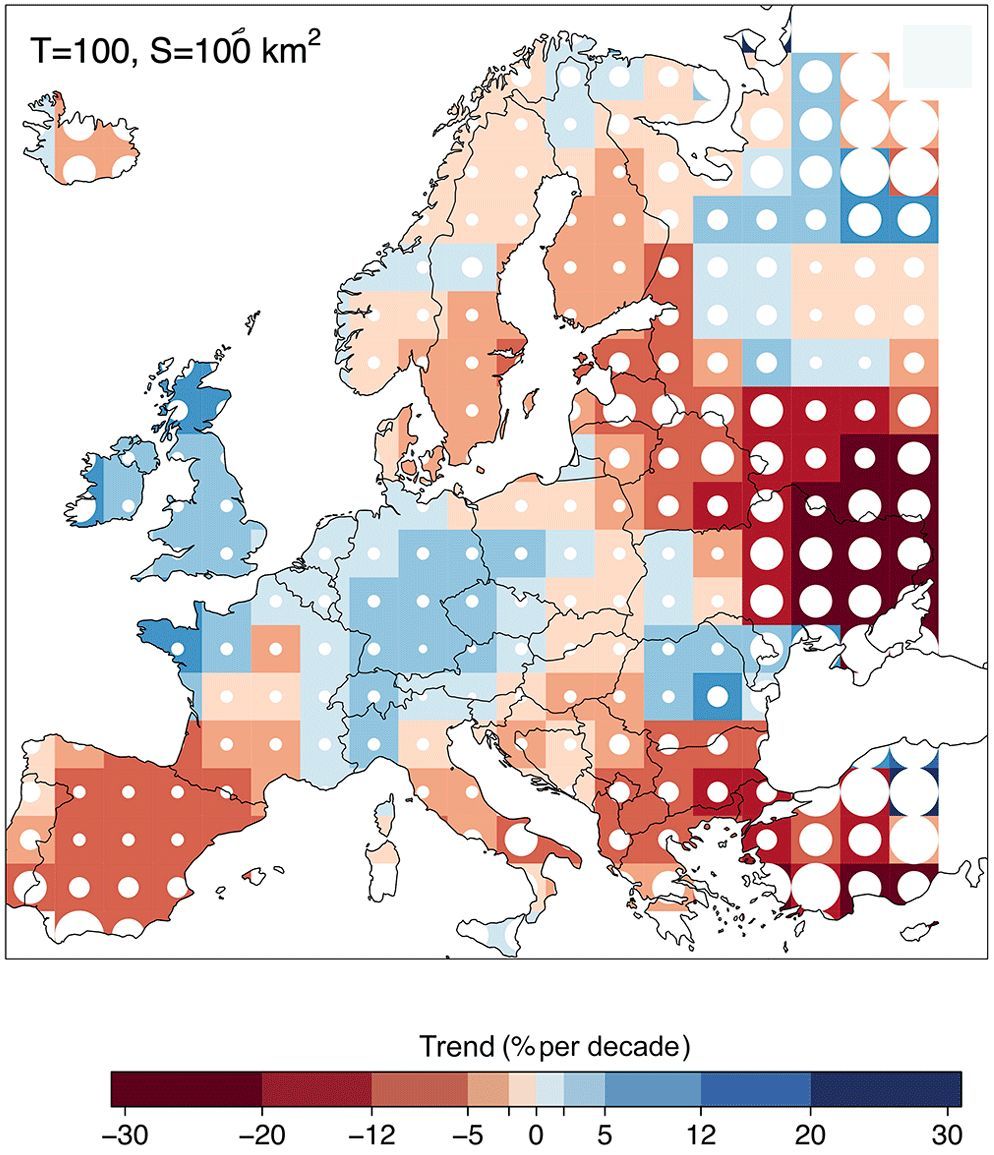
| 11:30, 24. Aug. 2022 | Europe flood trends 1960-2010.jpg (Datei) |  |
182 KB | == Beschreibung == Änderung von Hochwasser-Ereignissen mit einer Wiederkehrperiode von 100 Jahren und in kleineren Flussbecken von ca. 100 km2 ==Lizenzhinweis== {| style="border:1px solid #8888aa; background-color:#f7f8ff;padding:5px;font-size:95%;" | Quelle: Bertola, M., Viglione, A., Lun, D., Hall, J., and Blöschl, G. (2020): Flood trends in Europe: are changes in small and big floods different? Hydrol. Earth Syst. Sci., 24, 1805–1822, https://doi.org/10.5194/hess-24-1805-2020 <br> Lizenz:… | 2 |
| 10:48, 24. Aug. 2022 | EU exposed to floods1870-2020.jpg (Datei) |  |
75 KB | == Beschreibung == Änderung der Exponiertheit von Bevölkerung, Bruttoinlandsprodukt und Sachwerten 1870-2020 in Europa ==Lizenzhinweis== {| style="border:1px solid #8888aa; background-color:#f7f8ff;padding:5px;font-size:95%;" | Quelle: Paprotny, D., Sebastian, A., Morales-Nápoles, O. et al. (2018): Trends in flood losses in Europe over the past 150 years. Nat Commun 9, 1985. https://doi.org/10.1038/s41467-018-04253-1 <br> Lizenz: CC BY http://creativecommons.org/licenses/by/4.0/ |} | 1 |
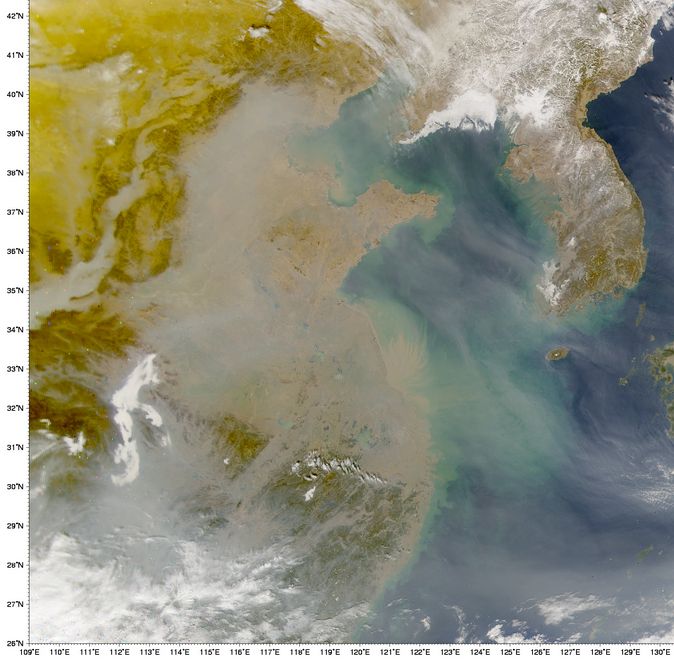
| 11:06, 19. Aug. 2022 | Aerosole Ostchina.jpg (Datei) |  |
70 KB | Aerosolbelastung über Ostasien ==Lizenzhinweis== {| style="border:1px solid #8888aa; background-color:#f7f8ff;padding:5px;font-size:95%;" | Quelle: Wikimedia Commons (2002): Asian Dust, NASA aerospace photography.jpg, Autor: Image courtesy the SeaWiFS Project, NASA/Goddard Space Flight Center, and ORBIMAGE https://commons.wikimedia.org/wiki/File:Asian_Dust,_NASA_aerospace_photography.jpg <br> Lizenz: public domain |} | 1 |
| 10:43, 19. Aug. 2022 | Aerosol forcing1860-2100.jpg (Datei) |  |
36 KB | == Beschreibung == Strahlungsantrieb von Aerosolen historisch ab 1860 und nach Szenarien bis 2100 ==Lizenzhinweis== {| style="border:1px solid #8888aa; background-color:#f7f8ff;padding:5px;font-size:95%;" | Quelle: Westervelt, D. M., Horowitz, L. W., Naik, V., Golaz, J.-C., and Mauzerall, D. L.: [https://doi.org/10.5194/acp-15-12681-2015 Radiative forcing and climate response to projected 21st century aerosol decreases], Atmos. Chem. Phys., 15, 12681–12703<br> Lizenz: [https://creativecommons.o… | 1 |
| 10:35, 19. Aug. 2022 | Aerosol temp 2100 RCP8.5.jpg (Datei) |  |
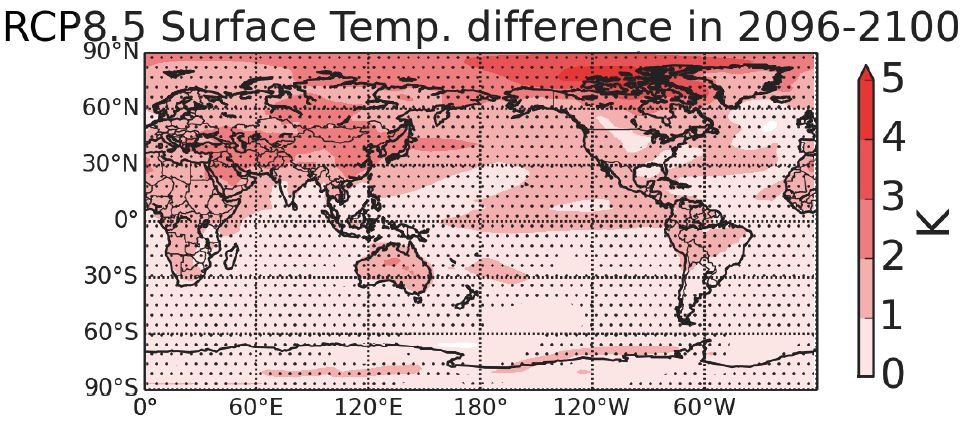
128 KB | == Beschreibung == Regionale Veränderung der Temperatur durch Aerosolabnahme 2096-2100 im Vergleich zu 2005 nach dem Szenario RCP8.5 ==Lizenzhinweis== {| style="border:1px solid #8888aa; background-color:#f7f8ff;padding:5px;font-size:95%;" | Quelle: Westervelt, D. M., Horowitz, L. W., Naik, V., Golaz, J.-C., and Mauzerall, D. L.: [https://doi.org/10.5194/acp-15-12681-2015 Radiative forcing and climate response to projected 21st century aerosol decreases], Atmos. Chem. Phys., 15, 12681–12703<br>… | 1 |
| 10:32, 19. Aug. 2022 | Aerosol temp 2100 RCP8.5 E-Asia.jpg (Datei) |  |
48 KB | == Beschreibung == Temperaturzunahme durch den Rückgang der Aerosolemissionen bis 2100 nach verschiedenen Szenarien in Ostasien ==Lizenzhinweis== {| style="border:1px solid #8888aa; background-color:#f7f8ff;padding:5px;font-size:95%;" | Quelle: Westervelt, D. M., Horowitz, L. W., Naik, V., Golaz, J.-C., and Mauzerall, D. L.: [https://doi.org/10.5194/acp-15-12681-2015 Radiative forcing and climate response to projected 21st century aerosol decreases], Atmos. Chem. Phys., 15, 12681–12703<br> Lize… | 1 |
| 10:28, 19. Aug. 2022 | Aerosol temp RCP 2100.jpg (Datei) |  |
43 KB | Temperaturzunahme durch den Rückgang der Aerosolemissionen bis 2100 nach verschiedenen Szenarien ==Lizenzhinweis== {| style="border:1px solid #8888aa; background-color:#f7f8ff;padding:5px;font-size:95%;" | Quelle: Westervelt, D. M., Horowitz, L. W., Naik, V., Golaz, J.-C., and Mauzerall, D. L.: Radiative forcing and climate response to projected 21st century aerosol decreases, Atmos. Chem. Phys., 15, 12681–12703, https://doi.org/10.5194/acp-15-12681-2015 <br> Lizenz: CC BY https://creativecommo… | 1 |
| 09:37, 3. Aug. 2022 | Arctic amplification vertical2100.jpg (Datei) |  |
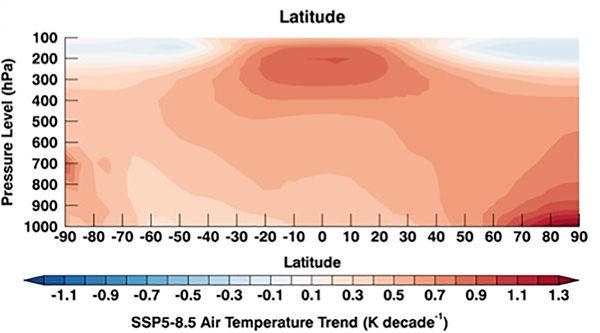
26 KB | Änderung der Temperatur in der Troposphäre in °C pro Jahrzehnt bis 2100 nach dem Szenario SSP5-8.5 ==Lizenzhinweis== {| style="border:1px solid #8888aa; background-color:#f7f8ff;padding:5px;font-size:95%;" | Quelle: Taylor P.C., R.C. Boeke, L.N. Boisvert et al. (2022): Process Drivers, Inter-Model Spread, and the Path Forward: A Review of Amplified Arctic Warming. Front. Earth Sci. 9:758361. doi: 10.3389/feart.2021.758361<br> Lizenz: CC BY http://creativecommons.org/licenses/by/4.0/ |} | 1 |
| 08:58, 3. Aug. 2022 | Arctic temp1979-2020.jpg (Datei) |  |
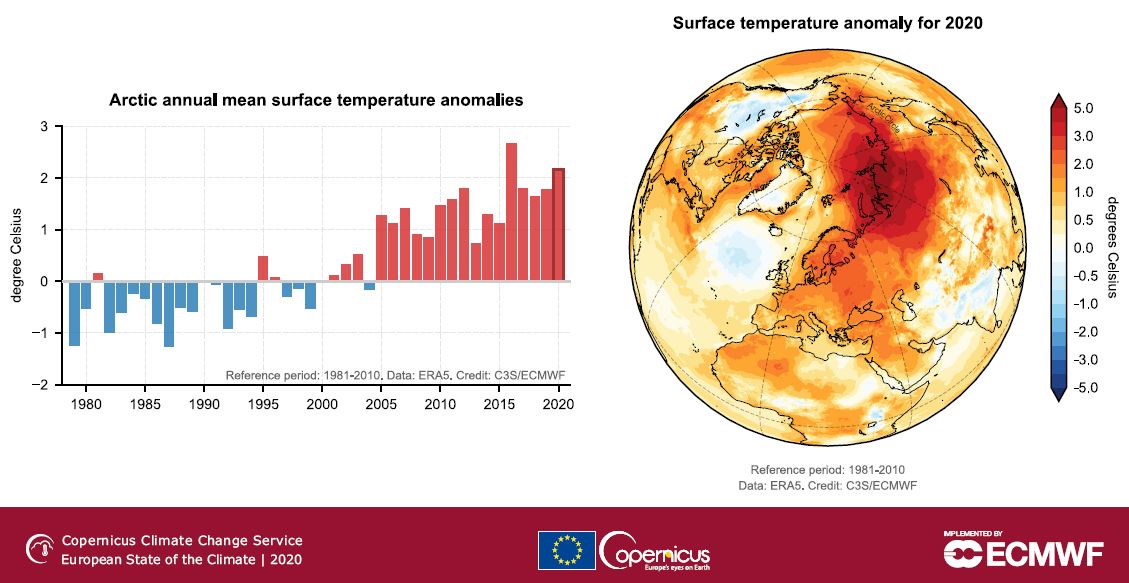
100 KB | Änderung der Jahresmitteltemperatur 1979-2020 in der Arktis (66.6°N–90°N) sowie Karte der Jahresmitteltemperatur 2020. Alle Daten relativ zum Mittel 1981-2010 ==Lizenzhinweis== {| style="border:1px solid #8888aa; background-color:#f7f8ff;padding:5px;font-size:95%;" | Quelle: Copernicus Climate Change: (2020): Arctic Temperatures, https://climate.copernicus.eu/esotc/2020/arctic-temperatures<br /> Lizenz: Reproduction of the publically available content of this website is authorised, provided the… | 1 |
| 10:56, 30. Jul. 2022 | Hot-days-1950-2018.jpg (Datei) |  |
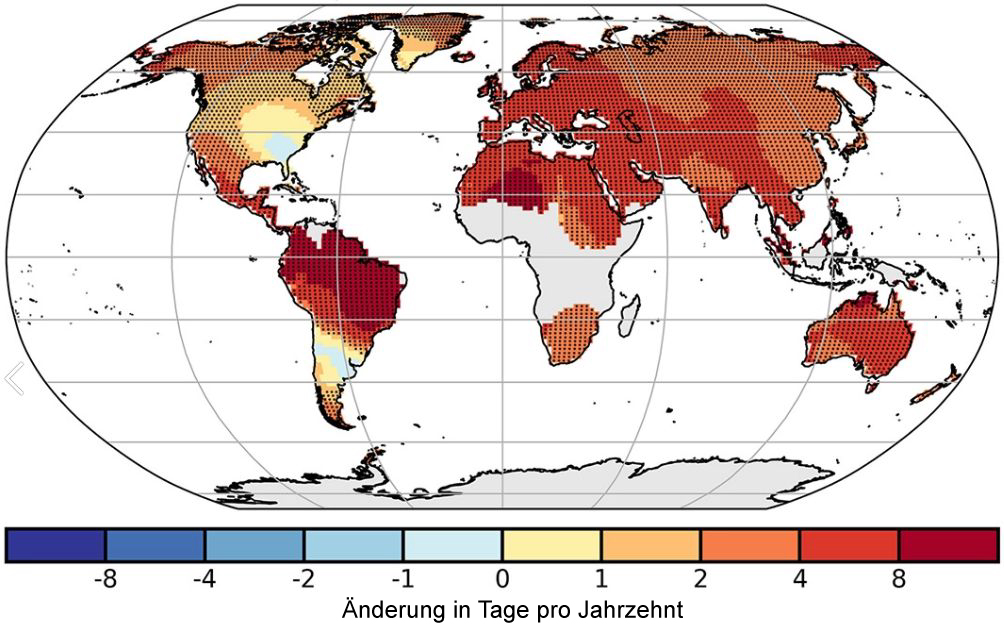
274 KB | == Beschreibung == Zunahme heißer Tage (>90 %-Perzentil) 1950 bis 2018 in Tage pro Jahrzehnt ==Lizenzhinweis== {| style="border:1px solid #8888aa; background-color:#f7f8ff;padding:5px;font-size:95%;" | Quelle: Dunn, R. J. H., Alexander, L. V., Donat, M. G., Zhang, X., Bador, M., Herold, N., et al. (2020). Development of an Updated Global Land In Situ-Based Data Set of Temperature and Precipitation Extremes: HadEX3. J. Geophys. 38 Res. Atmos. 125. doi:10.1029/2019JD032263<br> Lizenz: [https://cr… | 1 |
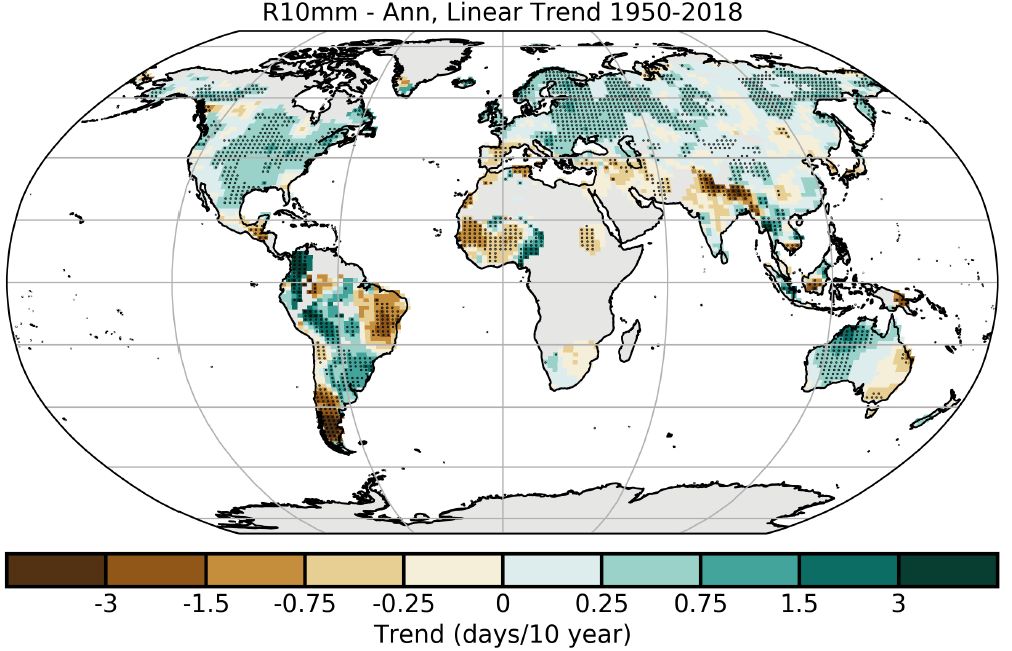
| 10:45, 30. Jul. 2022 | R10mm trend 1950-2018.jpg (Datei) |  |
116 KB | Änderung der Anzahl von Starkregentagen (Tage mit >10 mm Niederschlag) in Tage pro Dekade 1950-2018. ==Lizenzhinweis== {| style="border:1px solid #8888aa; background-color:#f7f8ff;padding:5px;font-size:95%;" | Quelle: Dunn, R. J. H., Alexander, L. V., Donat, M. G., Zhang, X., Bador, M., Herold, N., et al. (2020). Development of an Updated Global Land In Situ-Based Data Set of Temperature and Precipitation Extremes: HadEX3. J. Geophys. 38 Res. Atmos. 125. doi:10.1029/2019JD032263<br> Lizenz: [ht… | 1 |
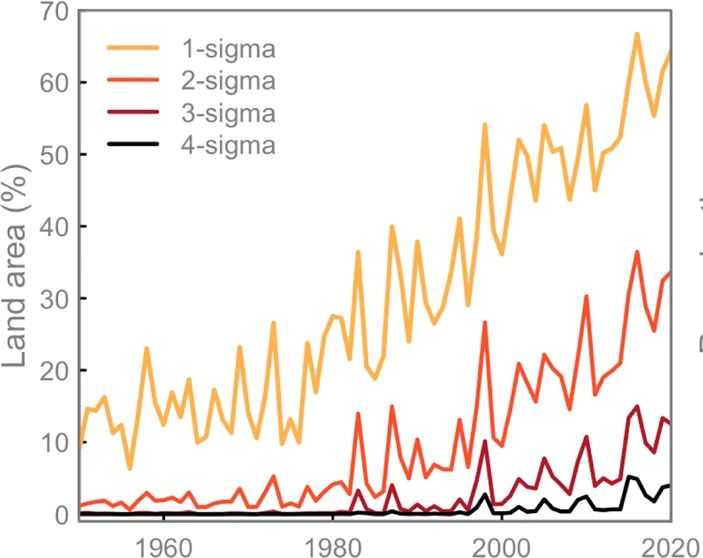
| 13:48, 29. Jul. 2022 | Heat extremes sigma1950-2020.jpg (Datei) |  |
42 KB | Prozentualer Anteil an der globalen Landfläche mit monatlichen extremen Temperaturen verschiedener Standardabweichungen (1-4) von monatlichen Mittel, die übers Jahr gemittelten sind, von 1950 bis 2020. Referenzperiode: 1951-1980 ==Lizenzhinweis== {| style="border:1px solid #8888aa; background-color:#f7f8ff;padding:5px;font-size:95%;" | Quelle: Robinson, A., Lehmann, J., Barriopedro, D. et al. Increasing heat and rainfall extremes now far outside the historical climate. npj Clim Atmos Sci 4, 45… | 1 |
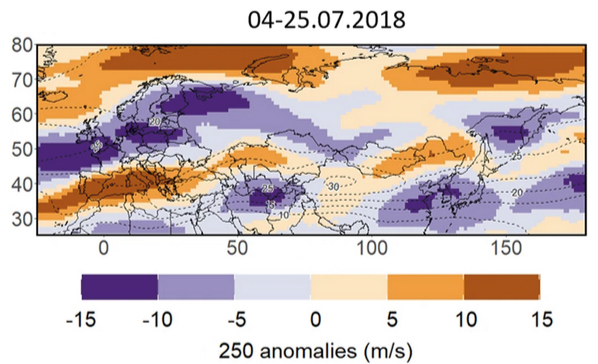
| 10:24, 20. Jul. 2022 | Double-Jet-2018.jpg (Datei) |  |
142 KB | == Beschreibung == Zweigeteilter Jetstream in der oberen Troposphäre (250 hPa) während der Hitzewelle im Juli 2018. Gezeigt werden Abweichungen der Windgeschwindigkeit vom Mittel der Periode 1979-2020 in den Monaten Juni-August in m/sek. ==Lizenzhinweis== {| style="border:1px solid #8888aa; background-color:#f7f8ff;padding:5px;font-size:95%;" | Quelle: Rousi, E., Kornhuber, K., Beobide-Arsuaga, G. et al. (2022): Accelerated western European heatwave trends linked to more-persistent double jets… | 1 |
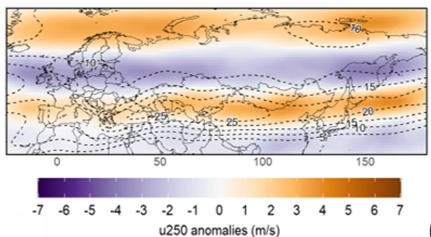
| 10:14, 20. Jul. 2022 | Splittet Jetstream.png (Datei) |  |
131 KB | Zweigeteilter Jetstream in der oberen Troposphäre (250 hPa). Gezeigt werden Zunahmen der Windgeschwindigkeit 1979 bis 2020 in den Monaten Juni-August in m/sek. ==Lizenzhinweis== {| style="border:1px solid #8888aa; background-color:#f7f8ff;padding:5px;font-size:95%;" | Quelle: Rousi, E., Kornhuber, K., Beobide-Arsuaga, G. et al. (2022): Accelerated western European heatwave trends linked to more-persistent double jets over Eurasia. Nat Commun 13, 3851, https://doi.org/10.1038/s41467-022-31432-y<… | 1 |
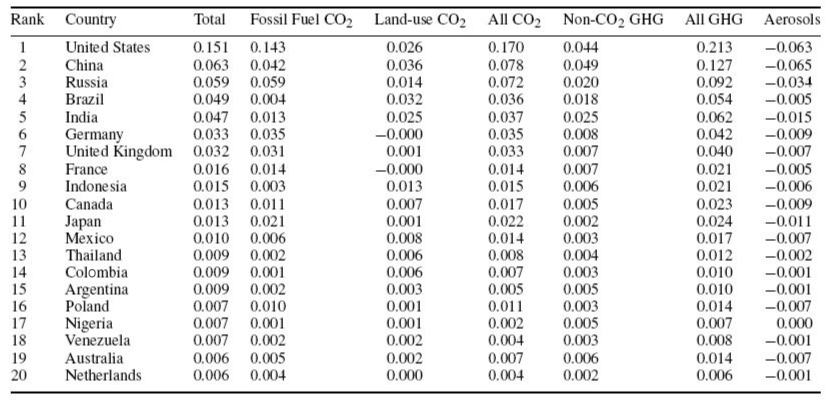
| 10:59, 28. Jun. 2022 | TG-Emissionen historisch 20Staaten.jpg (Datei) |  |
133 KB | Treibhausgasemissionen und Aerosole der 20 Staaten mit dem größten Anteil am historischen Klimawandel. In den einzelnen Säulen wird der Anteil an der gesamten Klimaänderung von 0,7 °C im Zeitraum 1800-2005 angegeben. Fossil Fuel CO<sub>2</sub>: CO<sub>2</sub>-Emissionen aus Verbrennung fossiler Energierohstoffe, Land-use CO<sub>2</sub>: CO<sub>2</sub>-Emissionen aus Änderungen der Landnutzung, GHG: Greeenhouse Gases (Treibhausgase), Non-CO<sub>2</sub>-GHG: Nicht-CO<sub>2</sub>-Treibhausgase (Me… | 1 |
| 16:10, 25. Jun. 2022 | Prec 1950-2100-SSP.jpg (Datei) |  |
246 KB | == Beschreibung == Änderung der globalen Niederschläge über dem Land 1950-2100 nach SSP-Szenarien, relativ zur jüngsten Vergangenheit 1995-2014. Die Zahlen neben den Szenarien geben die Anzahl der Modelle an (auch die historische Änderung der Niederschläge wurde mit Modellen berechnet). == Lizenzhinweis == {| style="border:1px solid #8888aa; background-color:#f7f8ff;padding:5px;font-size:95%;" | Quelle: IPCC AR6: (2021): Climate Change 2021, Working Group I: The Science of Climate Change, Ch.… | 1 |
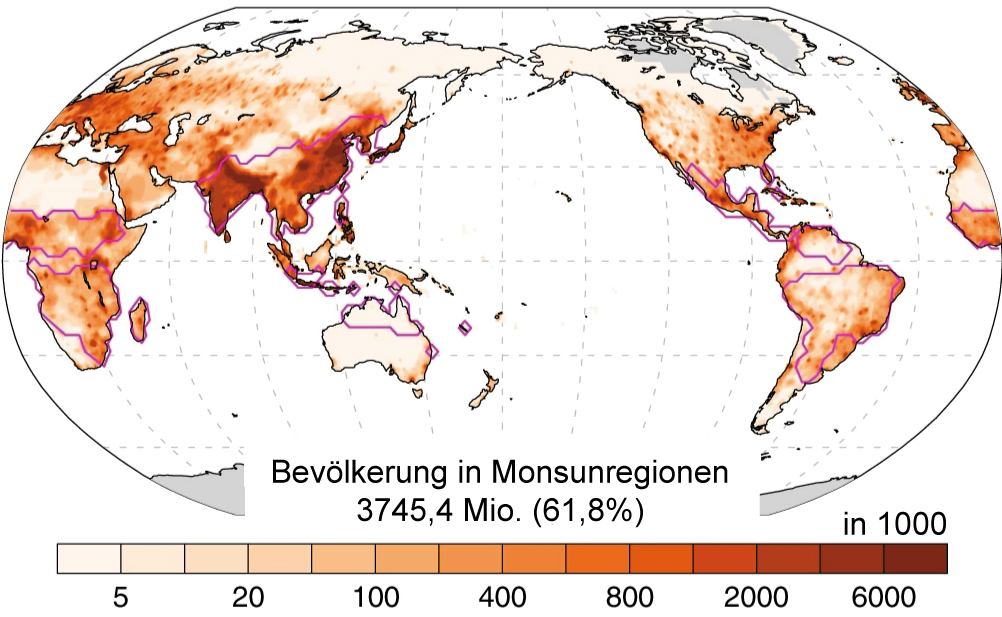
| 19:18, 16. Jun. 2022 | Monsungebiete-Bevölkerung-global.jpg (Datei) |  |
296 KB | == Beschreibung == Bevölkerung in Monsunregionen ==Lizenzhinweis== {| style="border:1px solid #8888aa; background-color:#f7f8ff;padding:5px;font-size:95%;" | Quelle: Zhang, W., Zhou, T., Zou, L. et al. (2018): Reduced exposure to extreme precipitation from 0.5 °C less warming in global land monsoon regions. Nat Commun 9, 3153, https://doi.org/10.1038/s41467-018-05633-3<br> Lizenz: CC BY http://creativecommons.org/licenses/by/4.0/ |} | 1 |
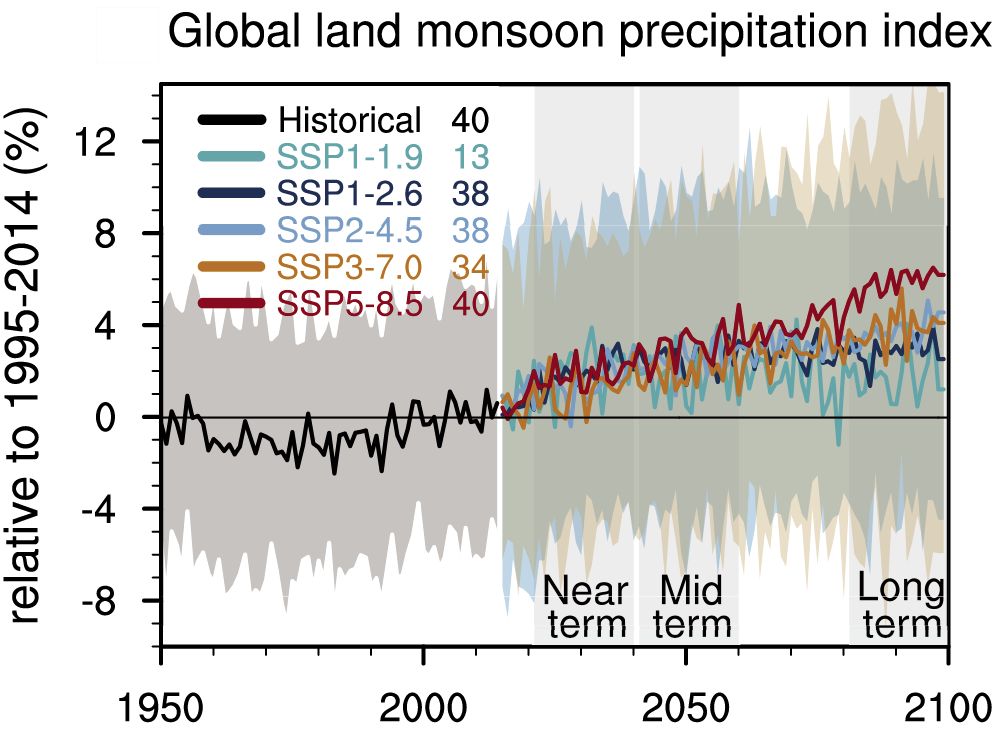
| 14:58, 16. Jun. 2022 | Monsoon prec 2100.jpg (Datei) |  |
99 KB | == Beschreibung == Änderung der Monsunniederschläge in % im Vergleich zum Mittel 1995-2014 nach Modellsimulationen. Schwarz: historische Simulationen, farbig: Projektionen, farbige Flächen: Unsicherheitsbereiche; Ziffern neben den Szenarien: Anzahl der beteiligten Modelle ==Lizenzhinweis== {| style="border:1px solid #8888aa; background-color:#f7f8ff;padding:5px;font-size:95%;" | Quelle: IPCC WGI (2021): Climate Change 2021, The Physical Science Basis, Figure 4.14<br> Lizenz: [https://www.ipcc.c… | 1 |
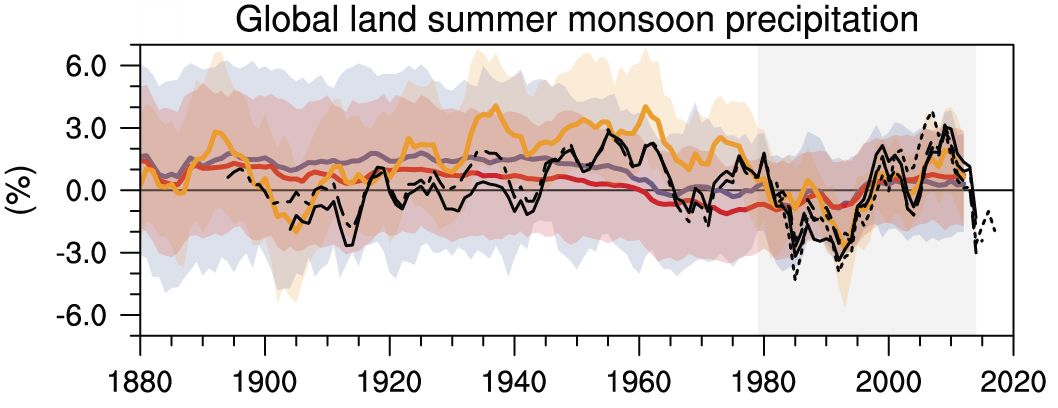
| 14:22, 15. Jun. 2022 | Global monsun prec 1880-2020.jpg (Datei) |  |
61 KB | == Beschreibung == Änderung des globalen Monsunniederschlags im Sommer 1880-2020 über Land, gezeigt als prozentuale Abweichung vom Mittel 1979-2014. Schwarze Linien: Beobachtungsreihen; farbige Linien: Modellrechnungen mit Unsicherheitsbereich. ==Lizenzhinweis== {| style="border:1px solid #8888aa; background-color:#f7f8ff;padding:5px;font-size:95%;" | Quelle: IPCC WGI (2021): Climate Change 2021, The Physical Science Basis, Technical Summary, Figure 3.17<br> Lizenz: [https://www.ipcc.ch/home_co… | 1 |
| 14:14, 15. Jun. 2022 | Monsoon domains IPCC.jpg (Datei) |  |
124 KB | Globale Monsungebiete: Nordamerikanisches Monsunsystem (NAMS), Südamerikanisches Monsunsystem (SAMS), Nordafrikanischer Monsun (NAF), Südafrikanischer Monsun (SAF), Südasiatischer Monsun (SAS), Ostasiatischer Monsun (EAS), Austral-Maritimer Kontinent (AUSMC) ==Lizenzhinweis== {| style="border:1px solid #8888aa; background-color:#f7f8ff;padding:5px;font-size:95%;" | Quelle: IPCC (2013): Climate Change 2013, Working Group I: The Science of Climate Change, Figure 14.3 <br> Lizenz: [https://www.ip… | 1 |
| 19:32, 10. Jun. 2022 | Global energy balance.jpg (Datei) |  |
57 KB | Strahlungshaushalt der Atmosphäre == Lizenzhinweis == {| style="border:1px solid #8888aa; background-color:#f7f8ff;padding:5px;font-size:95%;" |Quelle: Wild, M., A. Ohmura, C. Schär et al. (2017): [https://doi.org/10.5194/essd-9-601-2017 The Global Energy Balance Archive (GEBA) version 2017: a database for worldwide measured surface energy fluxes], Earth Syst. Sci. Data, 9, 601–613, <br> Lizenz: [https://creativecommons.org/licenses/by/3.0/ CC BY] |} | 1 |
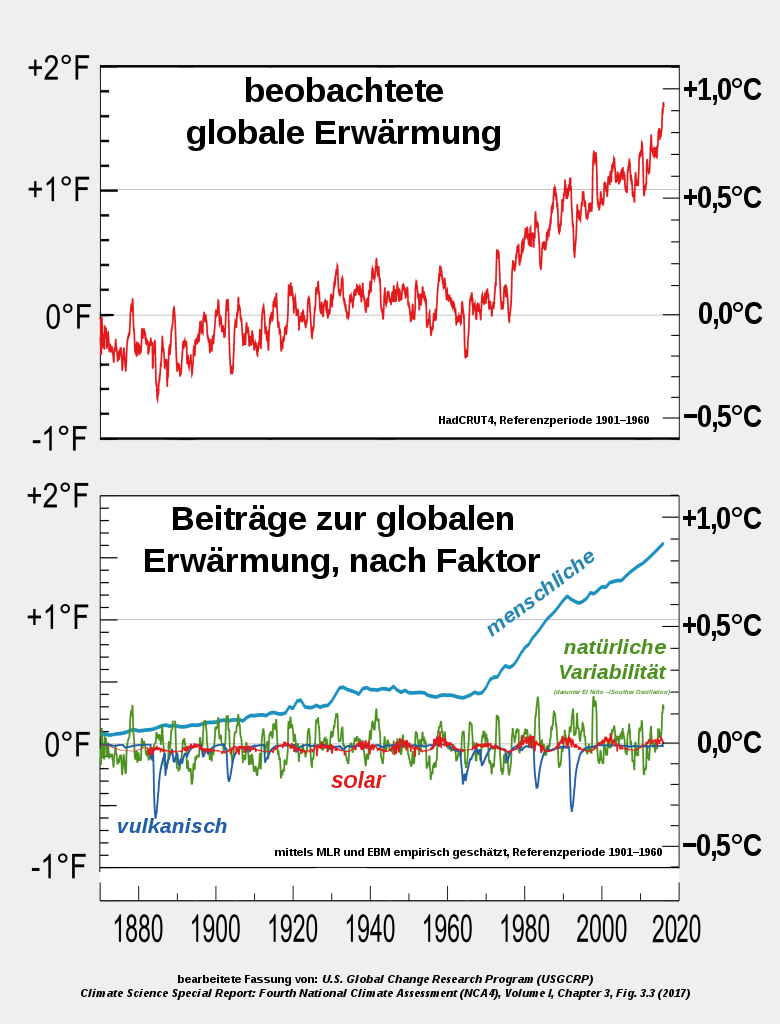
| 18:31, 1. Jun. 2022 | Global warming attribution.png (Datei) |  |
178 KB | == Beschreibung == Beobachtete globale Erwärmung und ihre Ursachen. ==Lizenzhinweis== {| style="border:1px solid #8888aa; background-color:#f7f8ff;padding:5px;font-size:95%;" | Quelle: Wikimedia Commons (2020): Global warming attribution, https://commons.wikimedia.org/wiki/File:2017_Global_warming_attribution_-_based_on_NCA4_Fig_3.3-de.svg?uselang=de-formal <br /> Lizenz: CC BY-SA |} | 1 |
| 18:23, 1. Jun. 2022 | Global Warming Index2019.jpg (Datei) |  |
94 KB | == Beschreibung == Klimaänderung 1850-2019 durch anthropogenen und natürlichen Antrieb ==Lizenzhinweis== {| style="border:1px solid #8888aa; background-color:#f7f8ff;padding:5px;font-size:95%;" | Quelle: Current Global Warming Index, http://globalwarmingindex.org/ ; Basiert auf Artikel: Haustein, K., Allen, M.R., Forster, P.M. et al. A real-time Global Warming Index. Sci Rep 7, 15417 (2017). https://doi.org/10.1038/s41598-017-14828-5; <br /> Lizenz: CC BY |} | 1 |
| 18:18, 1. Jun. 2022 | Temp-solar 1880-2020.jpg (Datei) |  |
405 KB | == Beschreibung == Temperaturveränderung und Sonneneinstrahlung 1880 bis 2020. ==Lizenzhinweis== {| style="border:1px solid #8888aa; background-color:#f7f8ff;padding:5px;font-size:95%;" | Quelle: NASA Global Climate Change (2020): The Causes of Climate Change<br /> Lizenz: public domain |} | 2 |
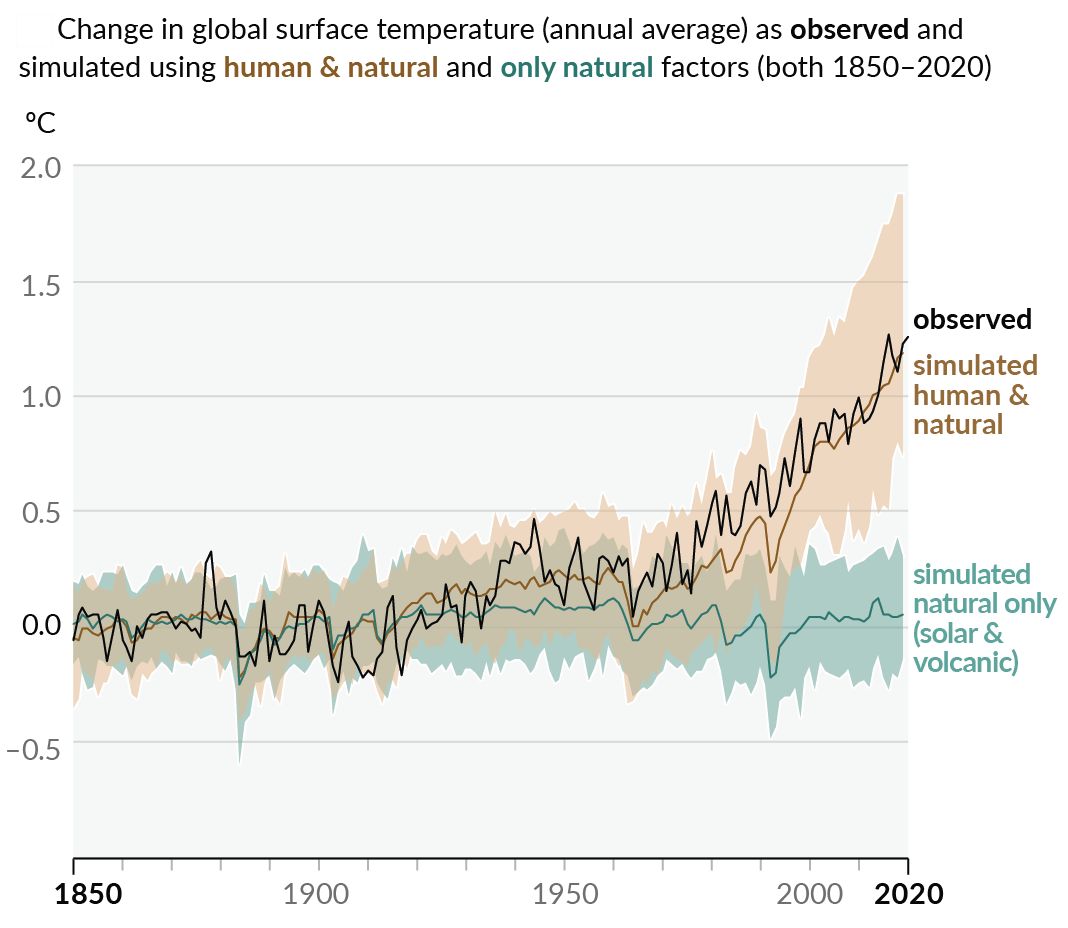
| 17:57, 1. Jun. 2022 | Temp human natural 1850-2020.jpg (Datei) |  |
82 KB | Beobachtete und modellierte Ursachen der Globalen Temperaturveränderung 1850-2017. Schwarze Punkte: beobachtete Temperatur, graue Linie: modellierter Einfluss aller Faktoren auf die Temperatur, blaue Linie: natürlicher Einfluss, rote Linie: anthropogener Einfluss. ==Lizenzhinweis== {| style="border:1px solid #8888aa; background-color:#f7f8ff;padding:5px;font-size:95%;" | Quelle: Carbon Brief (2017): Analysis: Why scientists think 100% of global warming is due to humans, https://www.carbonbrief.… | 1 |
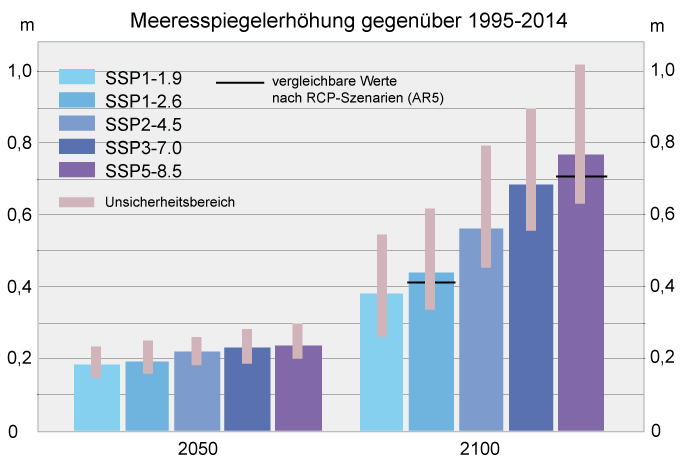
| 14:37, 1. Jun. 2022 | AR6 SLR 2100.jpg (Datei) |  |
79 KB | == Beschreibung == Anstieg des globalen Meeresspiegels nach den SSP-Szenarien bis 2050 und 2100 == Lizenzhinweis == {| style="border:1px solid #8888aa; background-color:#f7f8ff;padding:5px;font-size:95%;" |Quelle: Eigene Darstellung, Daten nach IPCC AR6 WGI (2021): Climate Change 2021: The Physical Science Basis, Ch..9: Ocean, Cryosphere and Sea Level Change<br> Lizenz: CC BY-SA |} | 1 |
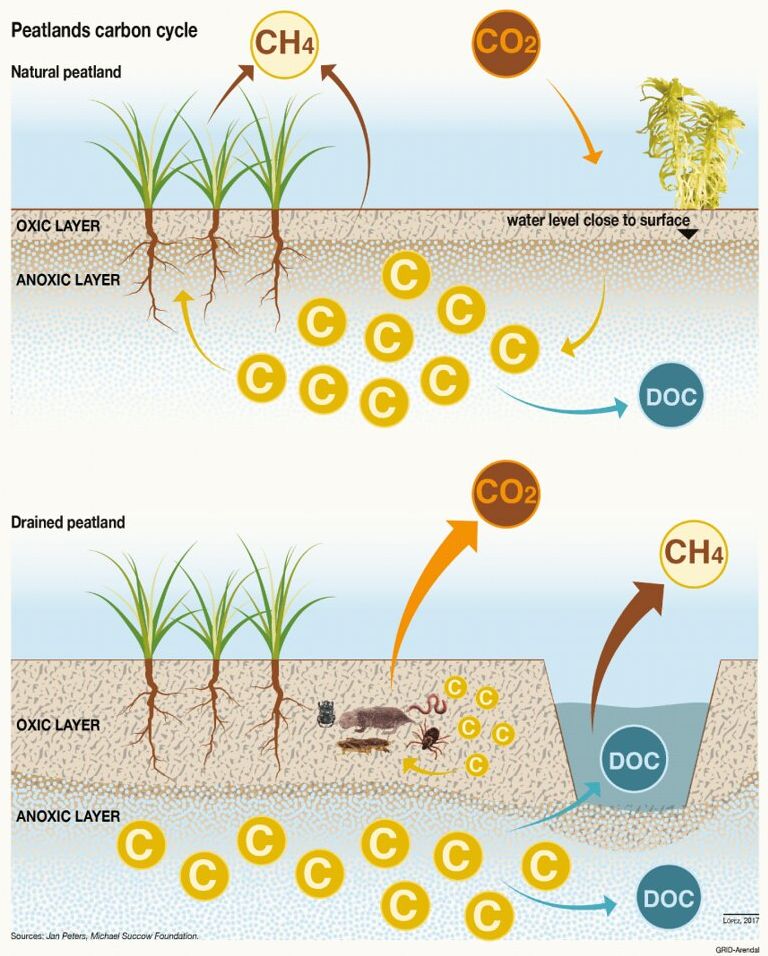
| 14:19, 31. Mai 2022 | Peatlands carbon cycle.jpg (Datei) |  |
120 KB | == Beschreibung == Kohlenstoffzyklus von natürlichen (oben) und entwässerten (unten) Mooren. Natürliche Moore emittieren Methan und speichern Kohlendioxid. Die Böden von entwässerten Mooren emittieren CO2, aber kaum noch Methan, das dafür aber aus Entwässerungsgräben entweicht. ==Lizenzhinweis== {| style="border:1px solid #8888aa; background-color:#f7f8ff;padding:5px;font-size:95%;" | Quelle: Flickr (2017): Peatlands carbon cycle, https://www.flickr.com/photos/gridarendal/38139044355/in/album-7… | 1 |
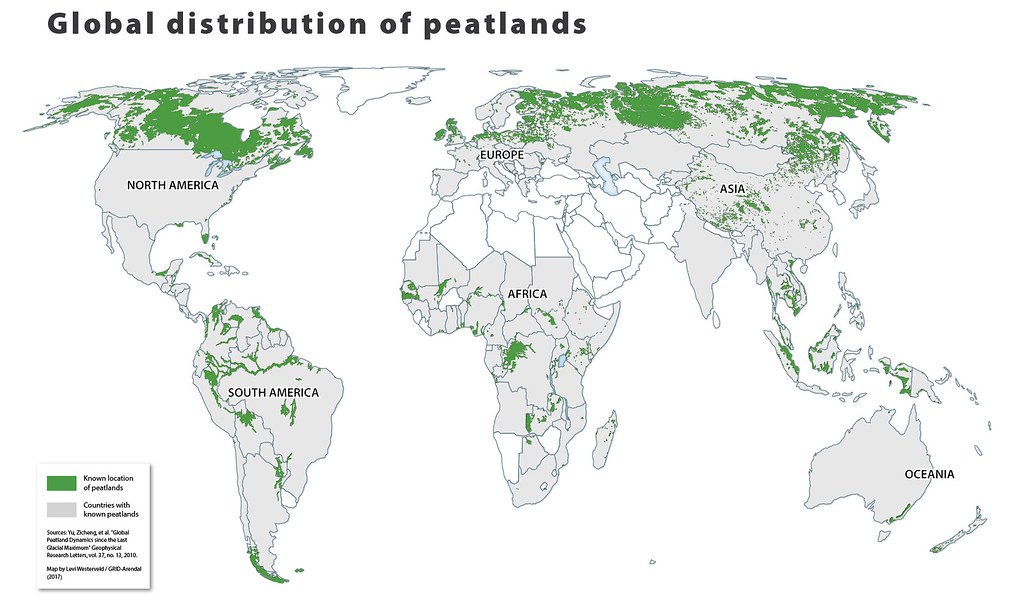
| 14:10, 31. Mai 2022 | Global peatlands.jpg (Datei) |  |
111 KB | == Beschreibung == Globale Verteilung von Mooren. ==Lizenzhinweis== {| style="border:1px solid #8888aa; background-color:#f7f8ff;padding:5px;font-size:95%;" | Quelle: The Conversation (2020): Peatlands keep a lot of carbon out of Earth’s atmosphere, but that could end with warming and development, https://theconversation.com/peatlands-keep-a-lot-of-carbon-out-of-earths-atmosphere-but-that-could-end-with-warming-and-development-151364<br /> Lizenz: CC BY-ND http://creativecommons.org/licenses/by… | 1 |
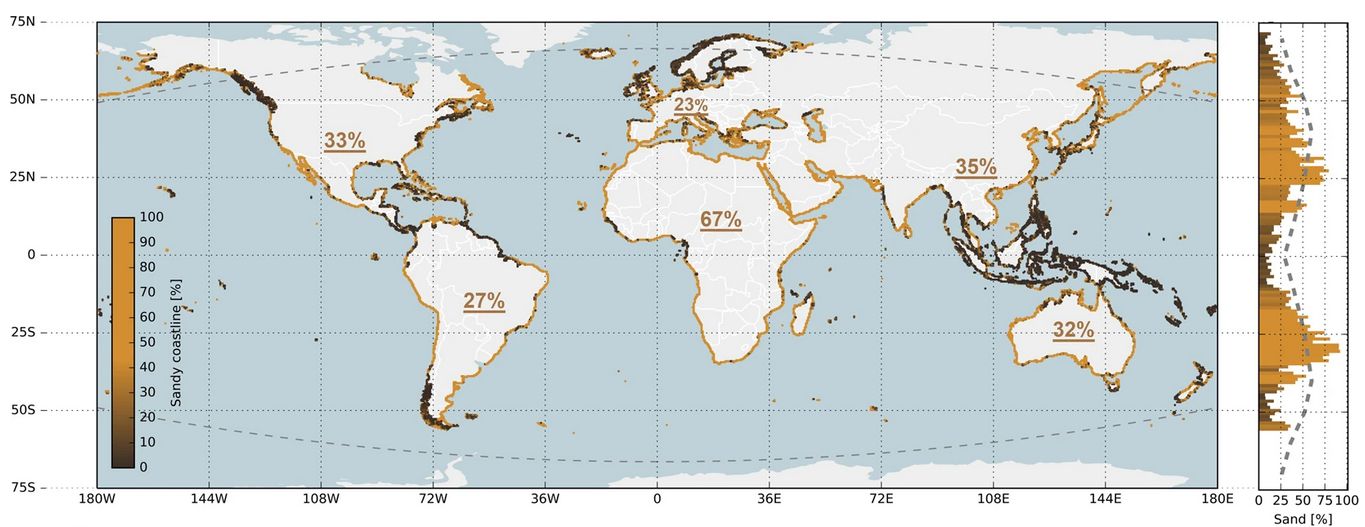
| 08:00, 31. Mai 2022 | Global beaches.jpg (Datei) |  |
109 KB | Verteilung der globalen Strände: Die Farben von Ocker bis Schwarz zeigen den lokalen Anteil von Stränden, die Prozentangaben den Anteil von Stränden an den Küsten der Kontinente. Am rechten Rand der Abb. wird der Anteil von Stränden pro Breitengrad dargestellt. ==Lizenzhinweis== {| style="border:1px solid #8888aa; background-color:#f7f8ff;padding:5px;font-size:95%;" | Quelle: Luijendijk, A., Hagenaars, G., Ranasinghe, R. et al. The State of the World’s Beaches. Sci Rep 8, 6641 (2018). https://d… | 1 |
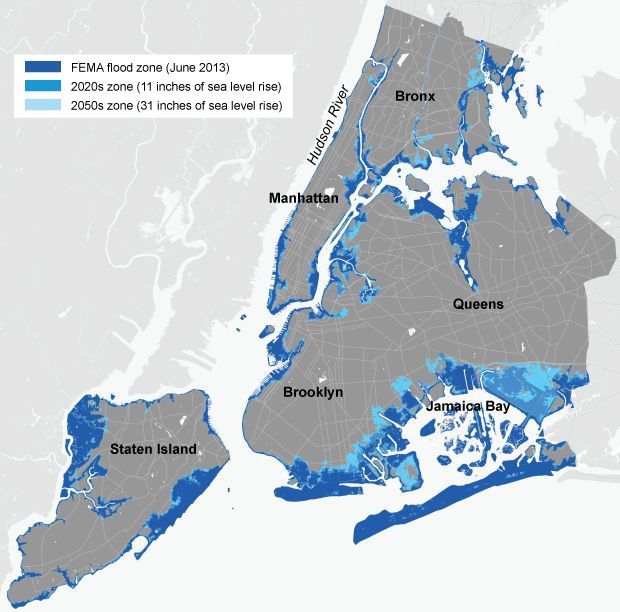
| 18:56, 6. Mai 2022 | NYC 100year flood.jpg (Datei) |  |
61 KB | == Beschreibung == Potenzielle Hochwassergebiete in NYC bei einem 100-Jahres-Hochwasser um 2010 (nach Einschätzung der Federal Emergency Management Agency, FEMA) sowie bei gleicher Wiederkehrperiode in den 2020er (bei einem zusätzlichen Meeresspiegelanstieg von 28 cm) und 2050er Jahren (bei einem zusätzlichen Meeresspiegelanstieg von 79 cm) ==Lizenzhinweis== {| style="border:1px solid #8888aa; background-color:#f7f8ff;padding:5px;font-size:95%;" | Quelle: Kennedy, C. (2014): Future Flood Zones… | 1 |
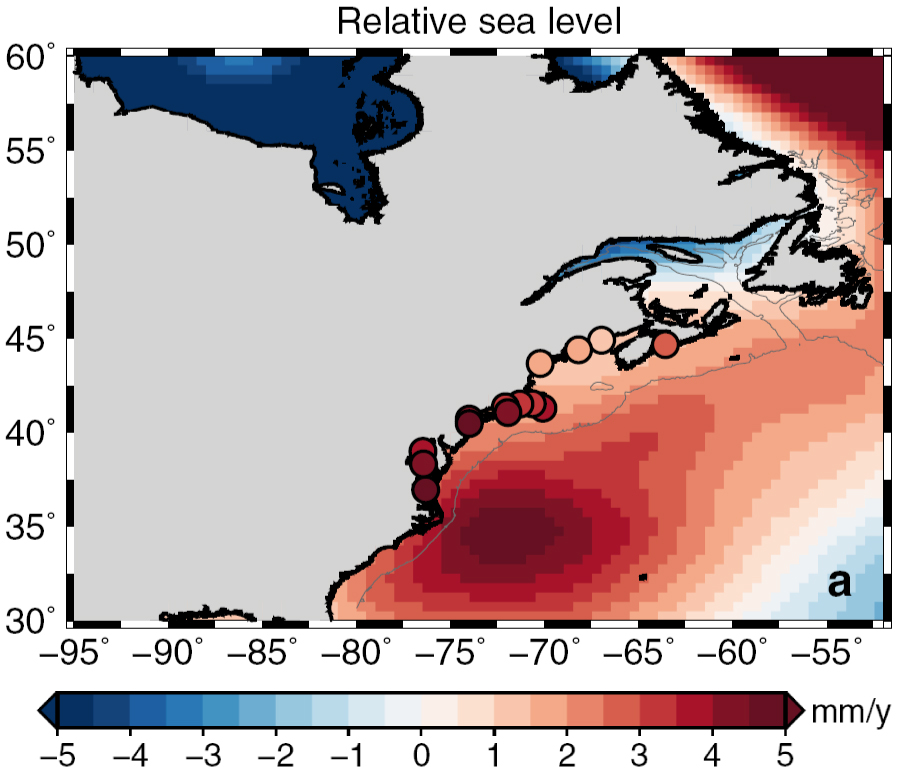
| 18:48, 6. Mai 2022 | RSL-US-NE-coast1965-2014.jpg (Datei) |  |
224 KB | == Beschreibung == Relative Änderungen des Meeresspiegels an der Nordostküste der USA in mm/Jahr. Die Kreise geben die Änderungen für einzelne Pegel-Stationen an. ==Lizenzhinweis== {| style="border:1px solid #8888aa; background-color:#f7f8ff;padding:5px;font-size:95%;" | Quelle: Frederikse, T., K. Simon, C. A. Katsman, and R. Riva (2017), The sea-level budget along the Northwest Atlantic coast: GIA, mass changes, and large-scale ocean dynamics, J. Geophys. Res. Oceans, 122, 5486–5501, doi:10.10… | 1 |
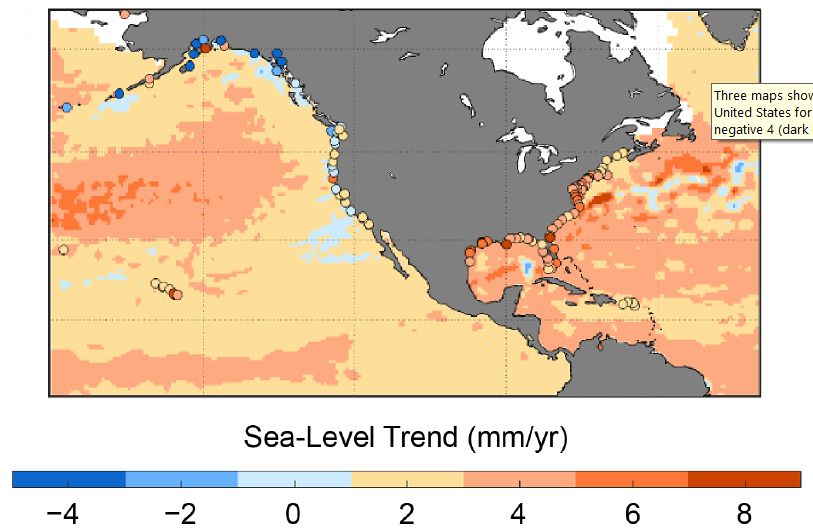
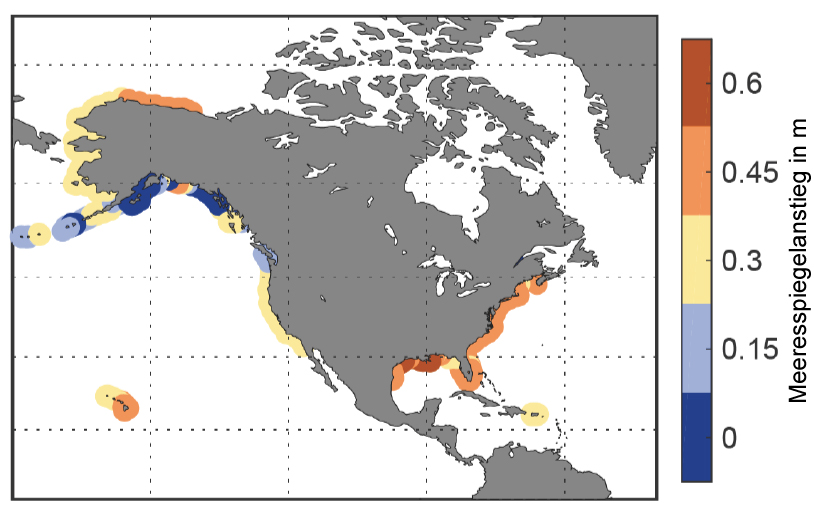
| 18:29, 6. Mai 2022 | SLR 1993-2020 N-America.jpg (Datei) |  |
63 KB | == Beschreibung == Änderungen des relativen Meeresspiegels 1993-2020 nach Satelliten- und Pegelmessungen (Kreise). ==Lizenzhinweis== {| style="border:1px solid #8888aa; background-color:#f7f8ff;padding:5px;font-size:95%;" | Quelle: Sweet, W.V., B.D. Hamlington, R.E. Kopp et al. (2022): Global and Regional Sea Level Rise Scenarios for the United States: Up¬dated Mean Projections and Extreme Water Level Probabilities Along U.S. Coastlines, NOAA Technical Report, https://oceanservice.noaa.gov/haza… | 1 |
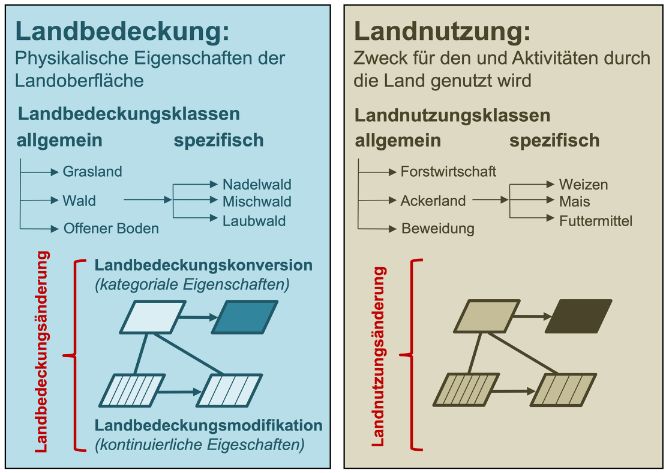
| 19:32, 30. Apr. 2022 | Landnutzung -bedeckung.jpg (Datei) |  |
54 KB | == Beschreibung == Definition von Landbedeckung, Landnutzung und Landnutzungsänderung ==Lizenzhinweis== {| style="border:1px solid #8888aa; background-color:#f7f8ff;padding:5px;font-size:95%;" | Quelle: Pongratz, J., Dolman, H., Don, A., Erb, K.-H., Fuchs, R., Herold, M., Jones, C., Luyssaert, S., Kuemmerle, T., Meyfroidt, P. & Naudts, K. (2018). Models meet data: challenges and opportunities in implementing land management in Earth System Models. Global Change Biology, 24, 1470-1487. doi:10.11… | 1 |
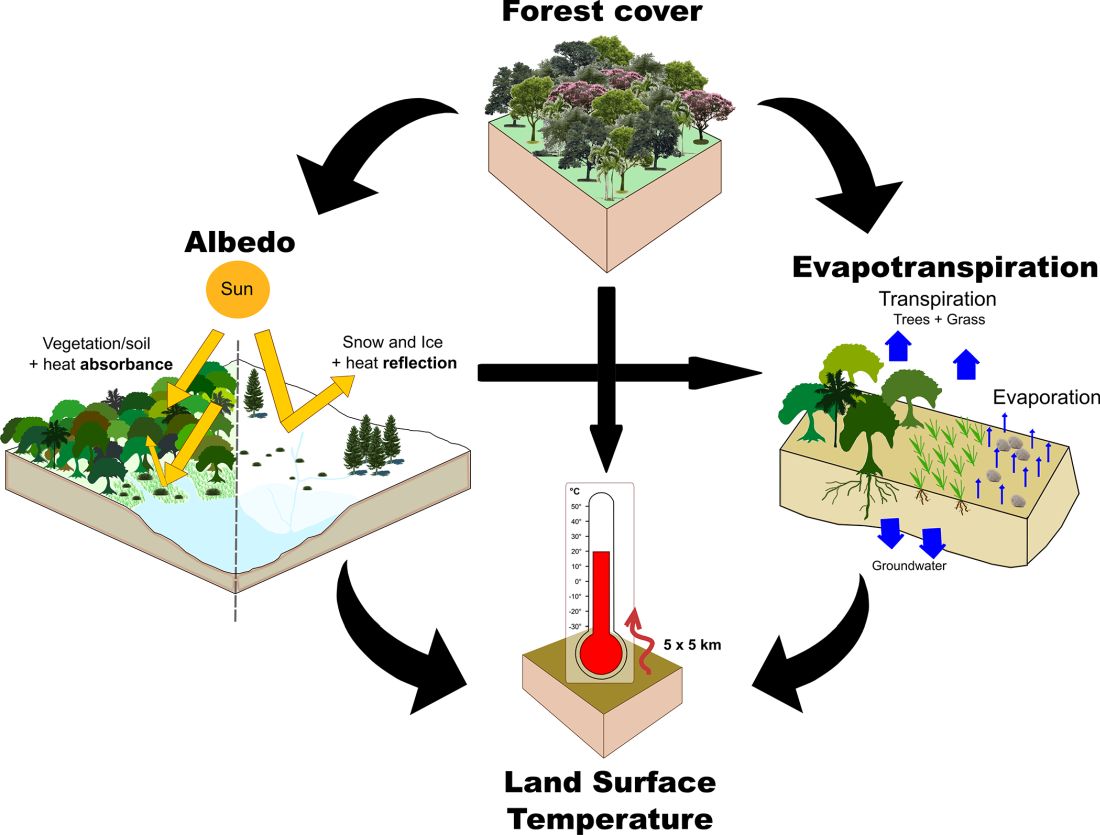
| 19:15, 30. Apr. 2022 | Forestcover albedo ET temp.jpg (Datei) |  |
95 KB | == Beschreibung == Beziehung zwischen Waldbedeckung, Albedo, Evapotranspiration und Temperatur ==Lizenzhinweis== {| style="border:1px solid #8888aa; background-color:#f7f8ff;padding:5px;font-size:95%;" | Quelle: Prevedello JA, Winck GR, Weber MM, Nichols E, Sinervo B (2019) Impacts of forestation and deforestation on local temperature across the globe. PLoS ONE 14(3): e0213368. https://doi.org/10.1371/journal.pone.0213368<br> Lizenz: [http://creativecommons.org/licenses/by/4.0/ CC BY] |} | 1 |
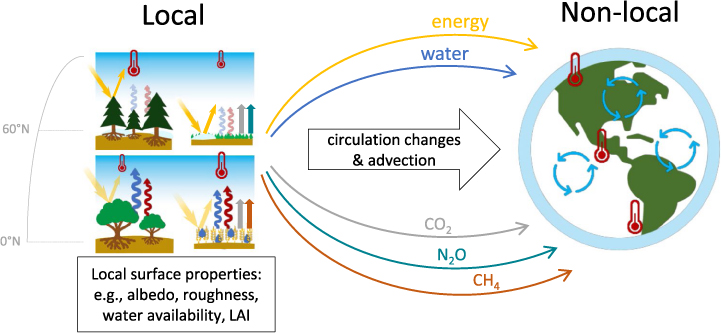
| 19:08, 30. Apr. 2022 | Land-Use-Effects-on-Climate.jpg (Datei) |  |
126 KB | == Beschreibung == Lokale und nicht-lokale Auswirkungen von Landnutzungsänderungen auf das Klima ==Lizenzhinweis== {| style="border:1px solid #8888aa; background-color:#f7f8ff;padding:5px;font-size:95%;" | Quelle: Pongratz, J., C. Schwingshackl, S. Bultan et al. (2021): Land Use Effects on Climate: Current State, Recent Progress, and Emerging Topics. Curr Clim Change Rep https://doi.org/10.1007/s40641-021-00178-y <br> Lizenz: CC BY http://creativecommons.org/licenses/by/4.0/ |} | 1 |
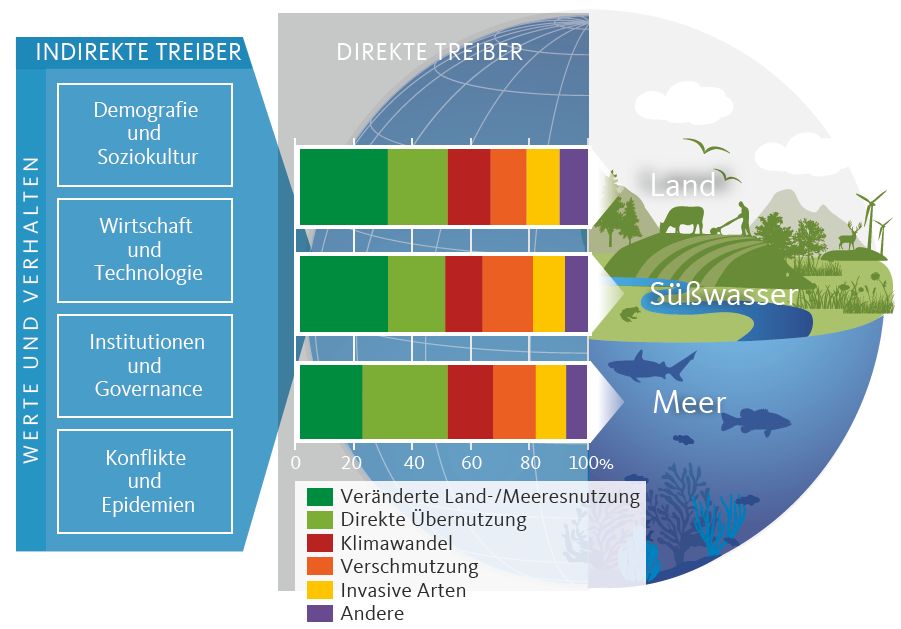
| 19:02, 30. Apr. 2022 | Treiber des Biodiversitätsverlusts.jpg (Datei) |  |
72 KB | == Beschreibung == Treiber des Biodiversitätsverlusts ==Lizenzhinweis== {| style="border:1px solid #8888aa; background-color:#f7f8ff;padding:5px;font-size:95%;" | Quelle: WBGU – Wissenschaftlicher Beirat der Bundesregierung Globale Umweltveränderungen (2020): Landwende im Anthropozän: Von der Konkurrenz zur Integration. Berlin: WBGU.<br> Lizenz: Die Vervielfältigung und Verbreitung originären Text- und Bildmaterials des WBGU ist, auch auszugsweise, mit Quellenangabe für nicht-kommerzielle Z… | 1 |
| 18:47, 30. Apr. 2022 | Managed-forests-croplands.jpg (Datei) |  |
226 KB | == Beschreibung == Landnutzungspraktiken ==Lizenzhinweis== {| style="border:1px solid #8888aa; background-color:#f7f8ff;padding:5px;font-size:95%;" | Quelle: Pongratz, J., C. Schwingshackl, S. Bultan et al. (2021): Land Use Effects on Climate: Current State, Recent Progress, and Emerging Topics. Curr Clim Change Rep https://doi.org/10.1007/s40641-021-00178-y<br> Lizenz: CC BY http://creativecommons.org/licenses/by/4.0/ |} | 1 |
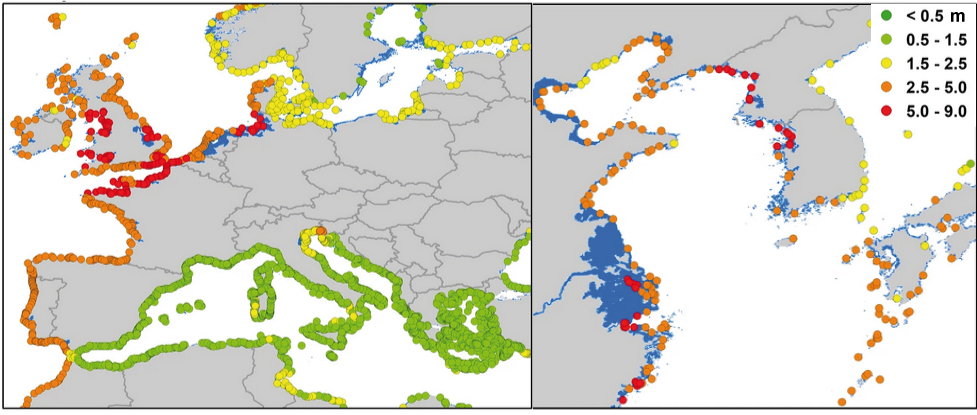
| 19:54, 28. Apr. 2022 | Hist-ESL-Europe-E-Asia.jpg (Datei) |  |
244 KB | == Beschreibung == Extreme Meeresspiegelanstiege mit einer Wiederkehrperiode von 100 Jahren in Europa und Ostasien bis 2100 nach dem Szenario RCP8.5. In blau sind die von Hochwasser betroffenen Flächen gezeigt. ==Lizenzhinweis== {| style="border:1px solid #8888aa; background-color:#f7f8ff;padding:5px;font-size:95%;" | Quelle: Kirezci, E., Young, I.R., Ranasinghe, R. et al. (2020): Projections of global-scale extreme sea levels and resulting episodic coastal flooding over the 21st Century. Sci R… | 1 |
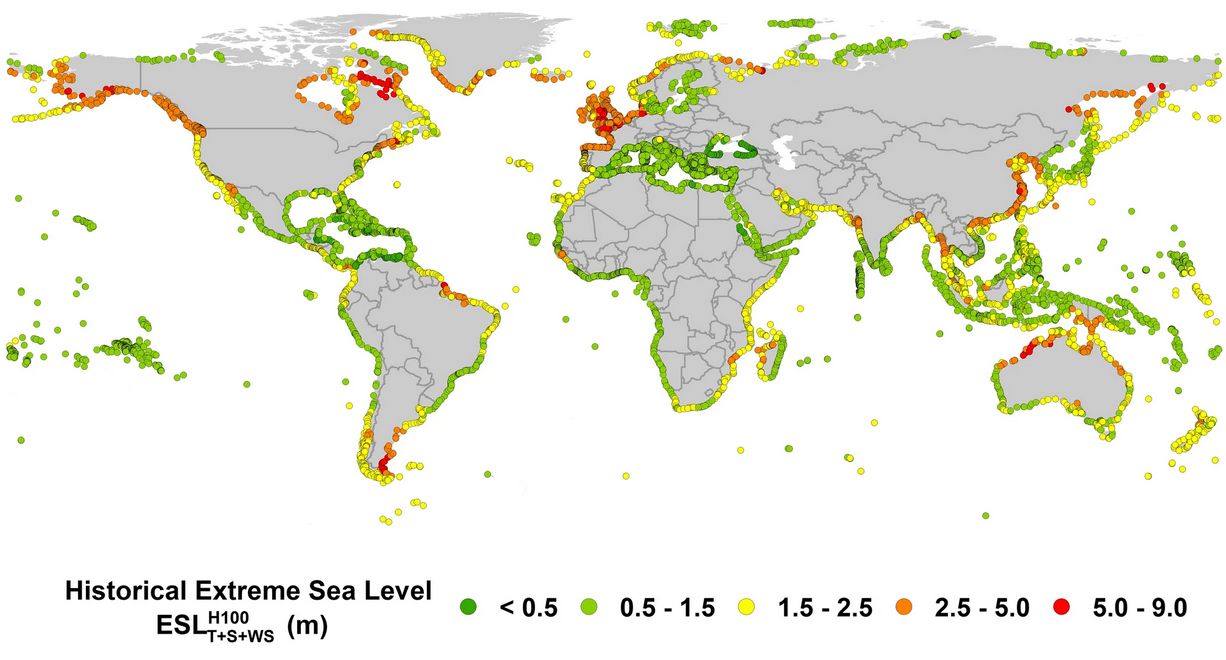
| 19:50, 28. Apr. 2022 | Hist global extreme SL.jpg (Datei) |  |
102 KB | == Beschreibung == Durch den Meeresspiegelanstieg gefährdete Bevölkerung in einzelnen Staaten bis 2050 ==Lizenzhinweis== {| style="border:1px solid #8888aa; background-color:#f7f8ff;padding:5px;font-size:95%;" | Quelle: Kulp, S.A., B.H. Strauss (2019): New elevation data triple estimates of global vulnerability to sea-level rise and coastal flooding. Nat Commun 10, 4844. https://doi.org/10.1038/s41467-019-12808-z<br> Lizenz: [http://creativecommons.org/licenses/by/4.0/ CC BY] |} | 1 |
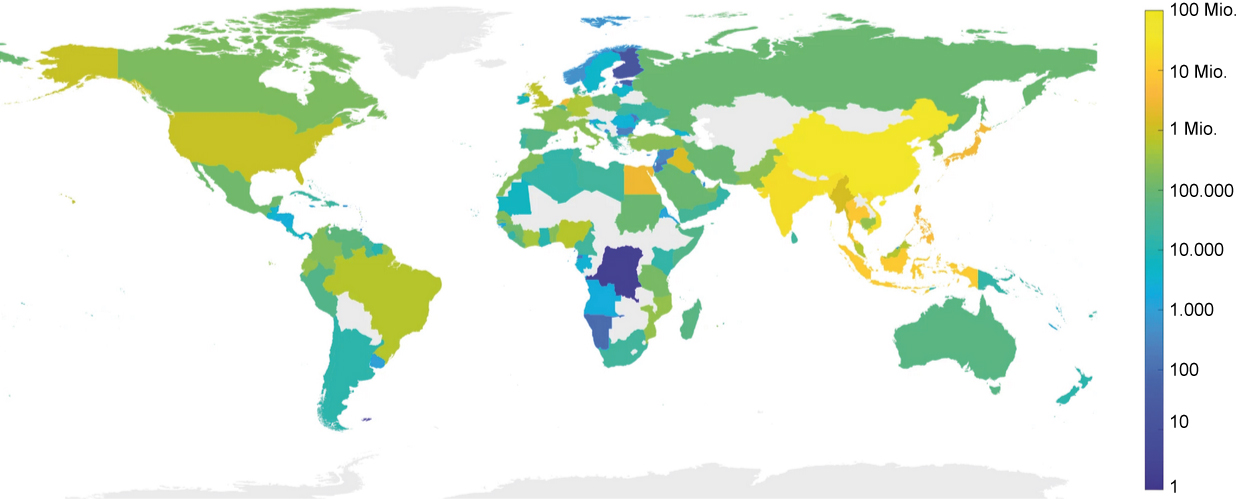
| 19:39, 28. Apr. 2022 | SLR-exposed-people-2050.jpg (Datei) |  |
191 KB | Durch den Meeresspiegelanstieg gefährdete Bevölkerung in einzelnen Staaten bis 2050 ==Lizenzhinweis== {| style="border:1px solid #8888aa; background-color:#f7f8ff;padding:5px;font-size:95%;" | Quelle: Kulp, S.A., B.H. Strauss (2019): New elevation data triple estimates of global vulnerability to sea-level rise and coastal flooding. Nat Commun 10, 4844. https://doi.org/10.1038/s41467-019-12808-z<br> Lizenz: [http://creativecommons.org/licenses/by/4.0/ CC BY] |} | 1 |
| 16:37, 26. Apr. 2022 | SLR-2050-North-America.jpg (Datei) |  |
141 KB | == Beschreibung == Meeresspiegelanstieg an den Küsten Nordamerikas bis 2050 im Vergleich zu 2000 nach einem mittleren bis hohen Szenario. ==Lizenzhinweis== {| style="border:1px solid #8888aa; background-color:#f7f8ff;padding:5px;font-size:95%;" | Quelle: : Sweet, W.V., B.D. Hamlington, R.E. Kopp et al. (2022): Global and Regional Sea Level Rise Scenarios for the United States: Up¬dated Mean Projections and Extreme Water Level Probabilities Along U.S. Coastlines, NOAA Technical Report, https://o… | 1 |
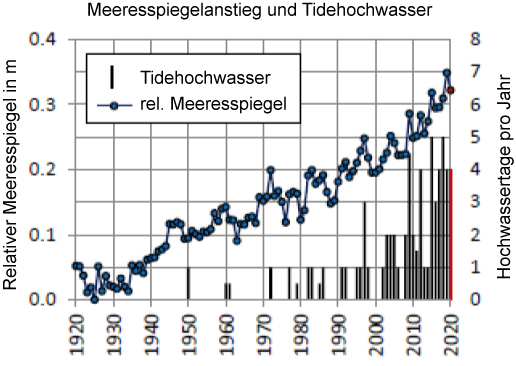
| 19:42, 24. Apr. 2022 | RSL-HTF-US-1920-2020.jpg (Datei) |  |
99 KB | == Beschreibung == Sterische Meeresspiegeländerungen vor den US-Küsten 1993-2018 ==Lizenzhinweis== {| style="border:1px solid #8888aa; background-color:#f7f8ff;padding:5px;font-size:95%;" | Quelle: Harvey, T.C., B.D. Hamlington, T. Frederikse et al. (2021): [https://doi.org/10.1038/s43247-021-00300-w Ocean mass, sterodynamic effects, and vertical land motion largely explain US coast relative sea level rise]. Commun Earth Environ 2, 233.<br> Lizenz: [http://creativecommons.org/licenses/by/4.0/ C… | 1 |
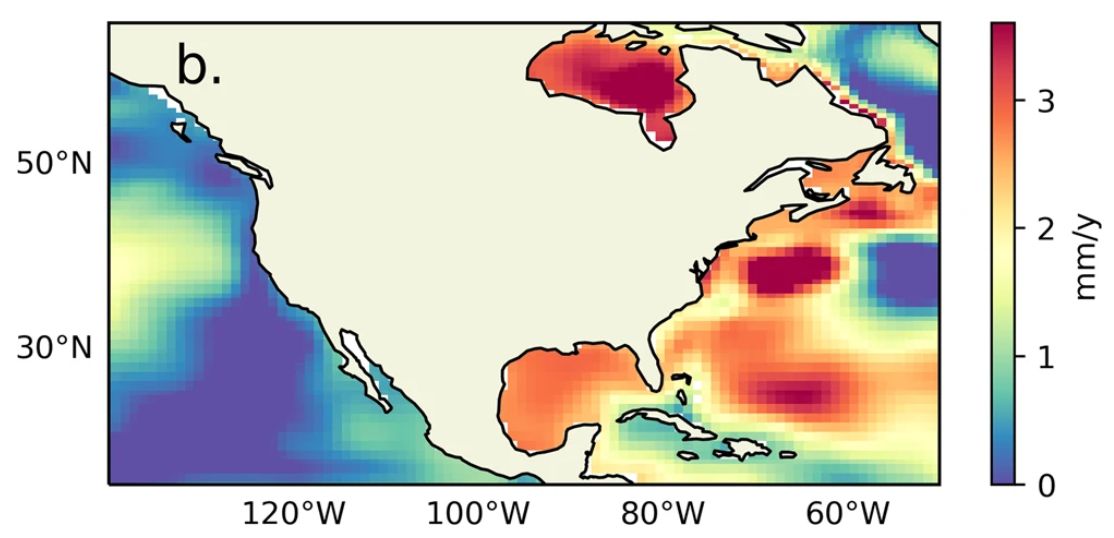
| 19:40, 24. Apr. 2022 | SLR steric US-coasts 1993-2018.jpg (Datei) |  |
59 KB | == Beschreibung == Sterische Meeresspiegeländerungen vor den US-Küsten 1993-2018 ==Lizenzhinweis== {| style="border:1px solid #8888aa; background-color:#f7f8ff;padding:5px;font-size:95%;" | Quelle: Harvey, T.C., B.D. Hamlington, T. Frederikse et al. (2021): [https://doi.org/10.1038/s43247-021-00300-w Ocean mass, sterodynamic effects, and vertical land motion largely explain US coast relative sea level rise]. Commun Earth Environ 2, 233.<br> Lizenz: [http://creativecommons.org/licenses/by/4.0/ C… | 1 |
| 19:34, 24. Apr. 2022 | VLM GIA 1993-2018 US-coasts.jpg (Datei) |  |
44 KB | == Beschreibung == Vertikale Änderungen der Landoberfläche durch isostatische Ausgleichsbewegungen. Rot: Heraushebung, blau: Absenkung der Landoberfläche. ==Lizenzhinweis== {| style="border:1px solid #8888aa; background-color:#f7f8ff;padding:5px;font-size:95%;" | Quelle: Harvey, T.C., Hamlington, B.D., Frederikse, T. et al. Ocean mass, sterodynamic effects, and vertical land motion largely explain US coast relative sea level rise. Commun Earth Environ 2, 233 (2021). https://doi.org/10.1038/s432… | 1 |
| 19:29, 24. Apr. 2022 | RSL-US-NE-coast-processes1965-2014.jpg (Datei) |  |
156 KB | == Beschreibung == Beobachteter Meeresspiegelanstieg und beteiligte Prozesse 1967-2013 an der Nordostküste der USA. Isostasie: s. Text, übrige vertikale Landbewegung: primär durch Grundwasserentnahme; Eisschmelze: Umwandlung von Eis in Meerwasser durch Erwärmung; ozean. u. atmosph. Dynamik: Erwärmung des Meerwassers, Umverteilung von Wassermassen durch Gravitation, Meeresströmungen, Luftdruck und Winde. ==Lizenzhinweis== {| style="border:1px solid #8888aa; background-color:#f7f8ff;padding:5px;f… | 1 |
| 18:02, 24. Apr. 2022 | SLR US-coasts 1993-2018.jpg (Datei) |  |
52 KB | == Beschreibung == Meeresspiegeländerungen vor den US-Küsten 1993-2018 nach Satelliten- und Pegelmessungen (Kreise). ==Lizenzhinweis== {| style="border:1px solid #8888aa; background-color:#f7f8ff;padding:5px;font-size:95%;" | Quelle: Harvey, T.C., Hamlington, B.D., Frederikse, T. et al. Ocean mass, sterodynamic effects, and vertical land motion largely explain US coast relative sea level rise. Commun Earth Environ 2, 233 (2021). https://doi.org/10.1038/s43247-021-00300-w<br> Lizenz: CC BY http:… | 1 |
| 17:58, 24. Apr. 2022 | US-SL-140years.jpg (Datei) |  |
185 KB | == Beschreibung == Änderungen des Meeresspiegels an den Küsten Nordamerikas über 30 Jahre in mm pro Jahr ==Lizenzhinweis== {| style="border:1px solid #8888aa; background-color:#f7f8ff;padding:5px;font-size:95%;" | Quelle: NOAA Tides&Currents (o.J.): Sea Level Trends, https://tidesandcurrents.noaa.gov/sltrends/<br> Lizenz: public domain |} | 1 |
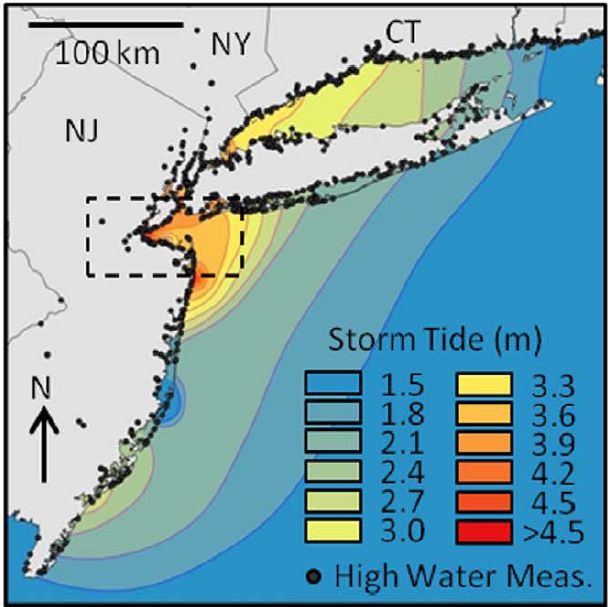
| 14:58, 24. Apr. 2022 | Sandy high water.jpg (Datei) |  |
54 KB | Sturmfluthöhe während des Hurrikans Sandy im Oktober 2012 vor New York ==Lizenzhinweis== {| style="border:1px solid #8888aa; background-color:#f7f8ff;padding:5px;font-size:95%;" | Quelle: Brandon, C.M., J.D. Woodruff, J.P. Donnelly, and R.M. Sullivan (2014): How Unique was Hurricane Sandy? Sedimentary Reconstructions of Extreme Flooding from New York Harbor, Scientific Reports 4, https://doi.org/10.1038/srep07366 Lizenz: CC BY-NC-ND |} | 1 |
