Von Dieter Kasang hochgeladene Dateien
Aus Klimawandel
Diese Spezialseite listet alle hochgeladenen Dateien auf.
| Datum | Name | Vorschaubild | Größe | Beschreibung | Versionen |
|---|---|---|---|---|---|
| 09:07, 12. Apr. 2022 | Mrd $ Ereignisse USA2021.jpg (Datei) |  |
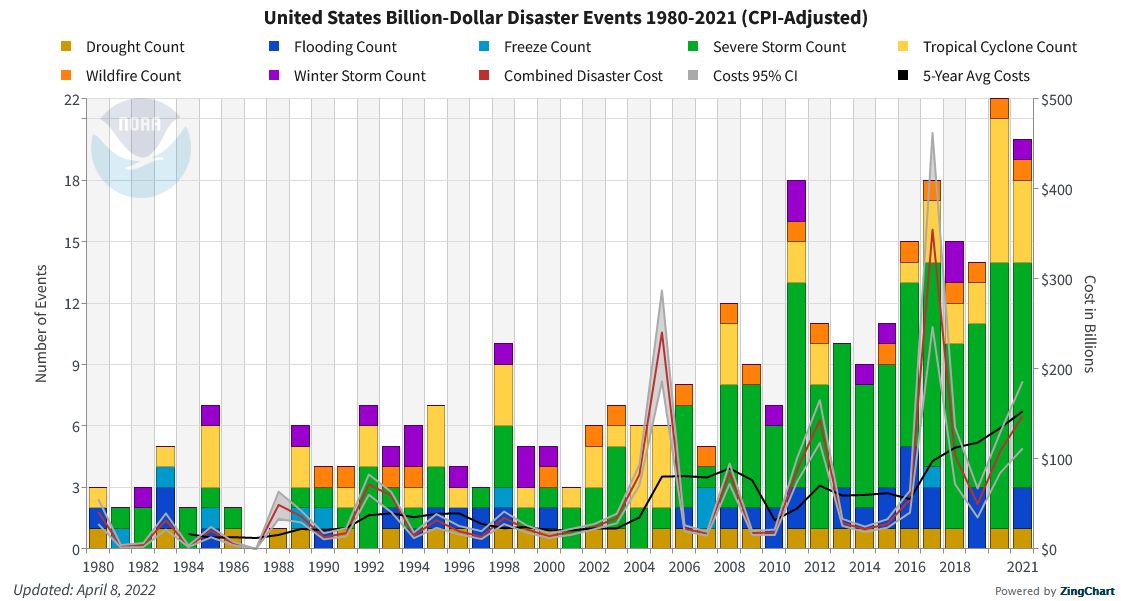
104 KB | == Beschreibung == Mrd.-Dollar-Extremereignisse in den USA nach Anzahl und Kosten bis April 2021 == Lizenzhinweis == {| style="border:1px solid #8888aa; background-color:#f7f8ff;padding:5px;font-size:95%;" | Quelle: NOAA National Centers for Environmental Information (NCEI) U.S. Billion-Dollar Weather and Climate Disasters (2018), https://www.ncei.noaa.gov/access/monitoring/billions/time-series <br> Lizenz: public domain |} | 1 |
| 08:57, 12. Apr. 2022 | Schäden-Trop-Wirbelstürme-1970-2019.jpg (Datei) |  |
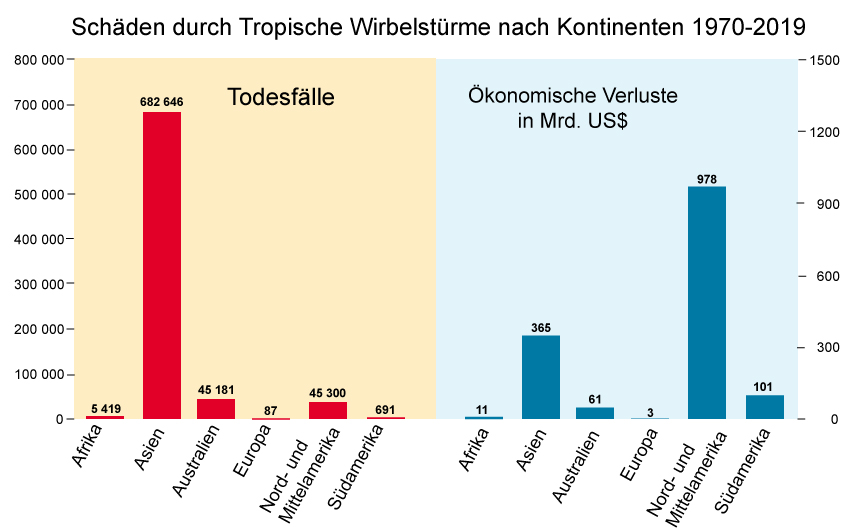
96 KB | == Beschreibung == Schäden durch Tropische Wirbelstürme nach Kontinenten 1970 bis 2019 == Lizenzhinweis == {| style="border:1px solid #8888aa; background-color:#f7f8ff;padding:5px;font-size:95%;" | Quelle: Eigene Darstellung nach Daten von WMO (2021): [https://library.wmo.int/doc_num.php?explnum_id=10989 WMO atlas of mortality and economic losses from weather, climate and water extremes (1970–2019)]<br> Lizenz: CC BY-SA Datei:CC-by-sa.png |} | 1 |
| 08:54, 12. Apr. 2022 | Schäden-1970-2019-N-Amerika.jpg (Datei) |  |
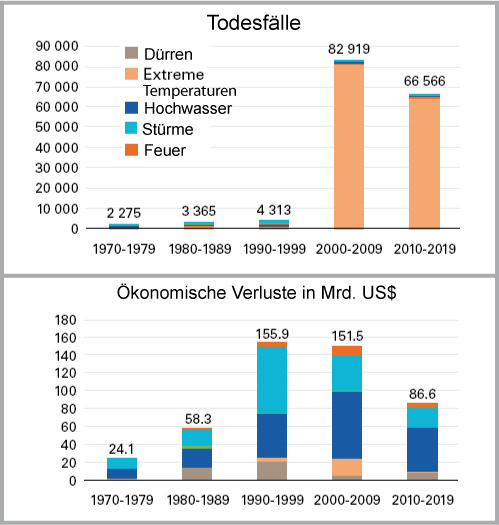
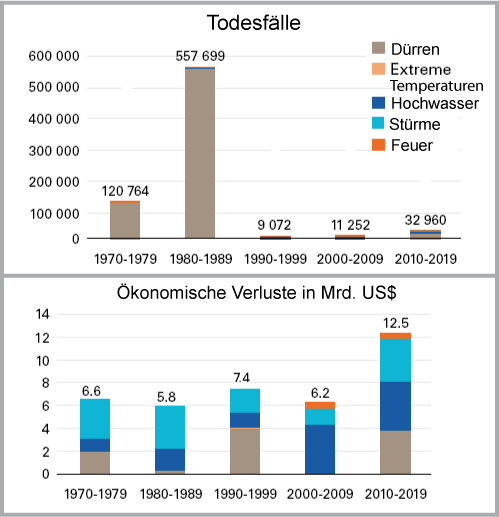
78 KB | == Beschreibung == Todesfälle und ökonomische Verluste durch Wetterextreme 1970 bis 2019 in Nord- und Mittelamerika == Lizenzhinweis == {| style="border:1px solid #8888aa; background-color:#f7f8ff;padding:5px;font-size:95%;" | Quelle: Eigene Darstellung nach Daten von WMO (2021): [https://library.wmo.int/doc_num.php?explnum_id=10989 WMO atlas of mortality and economic losses from weather, climate and water extremes (1970–2019)]<br> Lizenz: Short extracts from WMO publications may be reproduced… | 1 |
| 08:51, 12. Apr. 2022 | Schäden-1970-2019-Europa.jpg (Datei) |  |
83 KB | == Beschreibung == Todesfälle und ökonomische Verluste durch Wetterextreme 1970 bis 2019 in Europa == Lizenzhinweis == {| style="border:1px solid #8888aa; background-color:#f7f8ff;padding:5px;font-size:95%;" | Quelle: Eigene Darstellung nach Daten von WMO (2021): [https://library.wmo.int/doc_num.php?explnum_id=10989 WMO atlas of mortality and economic losses from weather, climate and water extremes (1970–2019)]<br> Lizenz: Short extracts from WMO publications may be reproduced without authoriza… | 1 |
| 08:50, 12. Apr. 2022 | Schäden-1970-2019-Asien.jpg (Datei) |  |
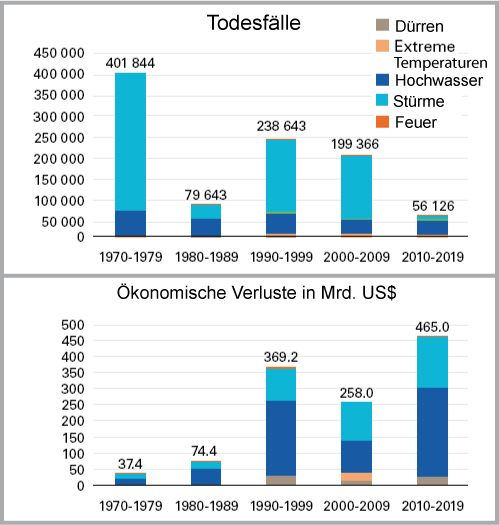
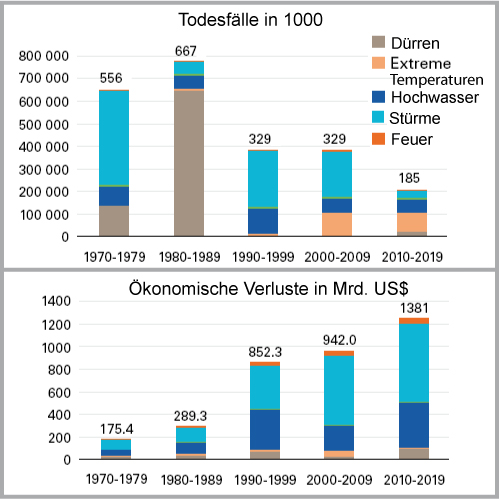
84 KB | == Beschreibung == Todesfälle und ökonomische Verluste durch Wetterextreme 1970 bis 2019 in Asien == Lizenzhinweis == {| style="border:1px solid #8888aa; background-color:#f7f8ff;padding:5px;font-size:95%;" | Quelle: Eigene Darstellung nach Daten von WMO (2021): [https://library.wmo.int/doc_num.php?explnum_id=10989 WMO atlas of mortality and economic losses from weather, climate and water extremes (1970–2019)]<br> Lizenz: Short extracts from WMO publications may be reproduced without authorizat… | 1 |
| 08:48, 12. Apr. 2022 | Schäden-1970-2019-Afrika.jpg (Datei) |  |
73 KB | == Beschreibung == Todesfälle und ökonomische Verluste durch Wetterextreme 1970 bis 2019 in Afrika == Lizenzhinweis == {| style="border:1px solid #8888aa; background-color:#f7f8ff;padding:5px;font-size:95%;" | Quelle: Eigene Darstellung nach Daten von WMO (2021): [https://library.wmo.int/doc_num.php?explnum_id=10989 WMO atlas of mortality and economic losses from weather, climate and water extremes (1970–2019)]<br> Lizenz: Short extracts from WMO publications may be reproduced without authoriza… | 1 |
| 08:40, 12. Apr. 2022 | Schäden-Wetterxtreme-1970-2019.jpg (Datei) |  |
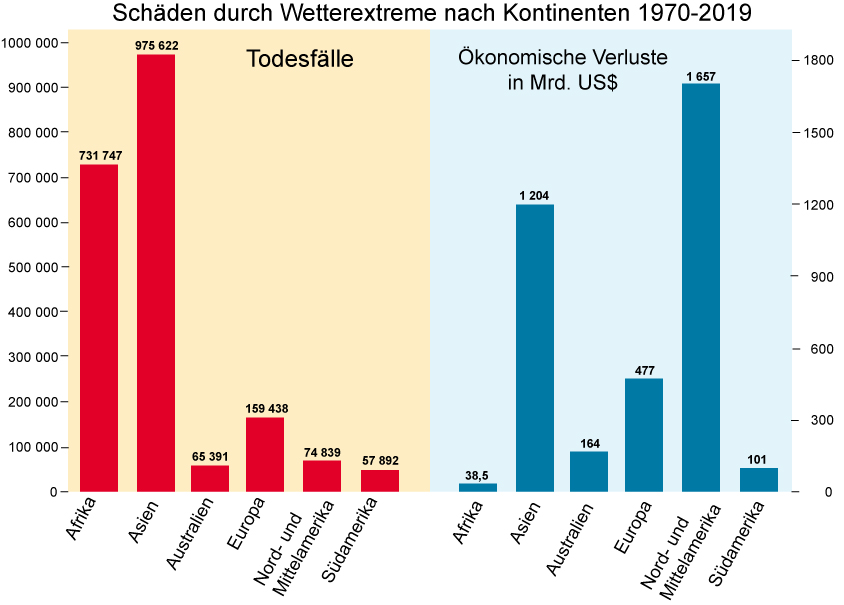
108 KB | == Beschreibung == Schäden durch Wetterextreme 1970 bis 2019 nach Kontinenten == Lizenzhinweis == {| style="border:1px solid #8888aa; background-color:#f7f8ff;padding:5px;font-size:95%;" | Quelle: Eigene Darstellung nach Daten von WMO (2021): [https://library.wmo.int/doc_num.php?explnum_id=10989 WMO atlas of mortality and economic losses from weather, climate and water extremes (1970–2019)]<br> Lizenz: Short extracts from WMO publications may be reproduced without authorization, provided that t… | 1 |
| 13:17, 11. Apr. 2022 | Natural disasters caused by climate change.png (Datei) |  |
133 KB | == Beschreibung == Naturkatastrophen durch den Klimawandel == Lizenzhinweis == {| style="border:1px solid #8888aa; background-color:#f7f8ff;padding:5px;font-size:95%;" | Quelle: Wikimedia Commons (2015): Natural disasters due to climate change, https://commons.wikimedia.org/wiki/File:Natural_disasters_caused_by_climate_change.png?uselang=de<br> Lizenz: CC BY-SA https://creativecommons.org/licenses/by-sa/3.0/deed.de |} | 1 |
| 12:58, 11. Apr. 2022 | Christmas flood 1717.jpg (Datei) |  |
181 KB | == Beschreibung == Sturmflut vom 24. Dezember auf den 25. Dezember 1717 == Lizenzhinweis == {| style="border:1px solid #8888aa; background-color:#f7f8ff;padding:5px;font-size:95%;" | Quelle: Wikimedia Commons (2010): https://commons.wikimedia.org/wiki/File:Christmas_flood_1717.jpg <br> Lizenz: public domain |} | 1 |
| 12:50, 11. Apr. 2022 | Erschrecklichewasserfluth.jpg (Datei) |  |
152 KB | == Beschreibung == „Die erschreckliche Wasser-Fluth“ – Burchardflut oder die 2. Mandränke 1634 == Lizenzhinweis == {| style="border:1px solid #8888aa; background-color:#f7f8ff;padding:5px;font-size:95%;" | Quelle: Wikimedia Commons (2009): Contemporary picture of the Burchardi flood https://commons.wikimedia.org/wiki/File:Erschrecklichewasserfluth.jpg<br> Lizenz: public domain |} | 1 |
| 12:38, 11. Apr. 2022 | Schäden-1970-2019.jpg (Datei) |  |
81 KB | == Beschreibung == Schäden durch Wetterxtreme 1970 bis 2019 global == Lizenzhinweis == {| style="border:1px solid #8888aa; background-color:#f7f8ff;padding:5px;font-size:95%;" | Quelle: Eigene Darstellung nach Daten von WMO (2021): WMO atlas of mortality and economic losses from weather, climate and water extremes (1970–2019), https://library.wmo.int/doc_num.php?explnum_id=10989 Lizenz: Short extracts from WMO publications may be reproduced without authorization, provided that the complete sour… | 1 |
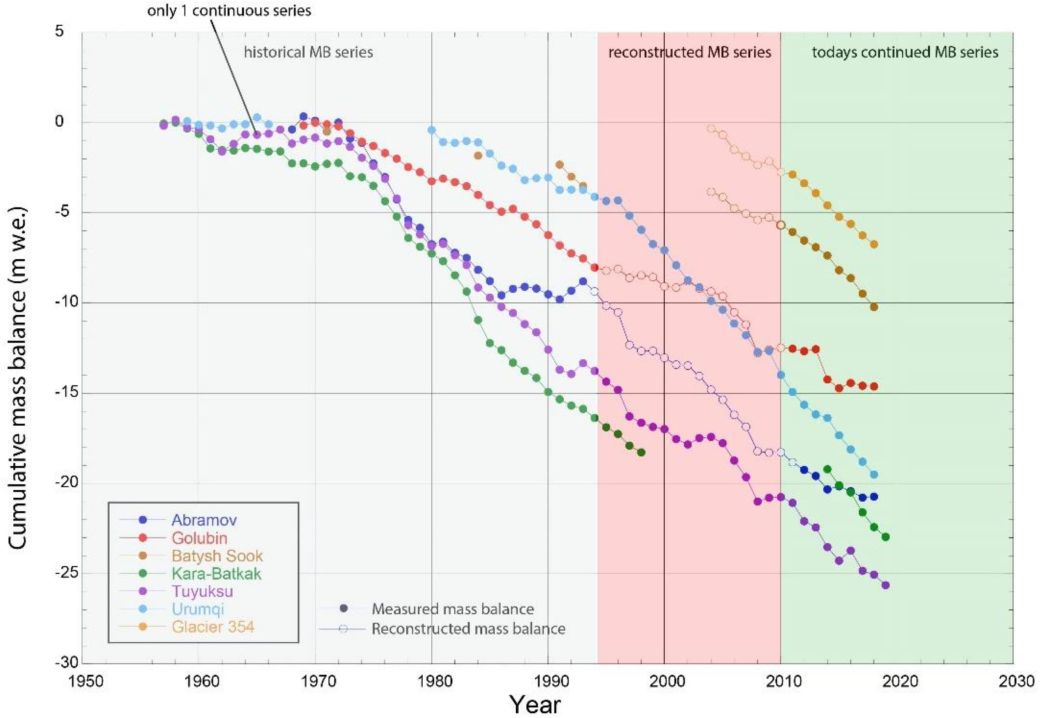
| 10:25, 4. Apr. 2022 | Glaciers Central Asia 1960-2020.jpg (Datei) |  |
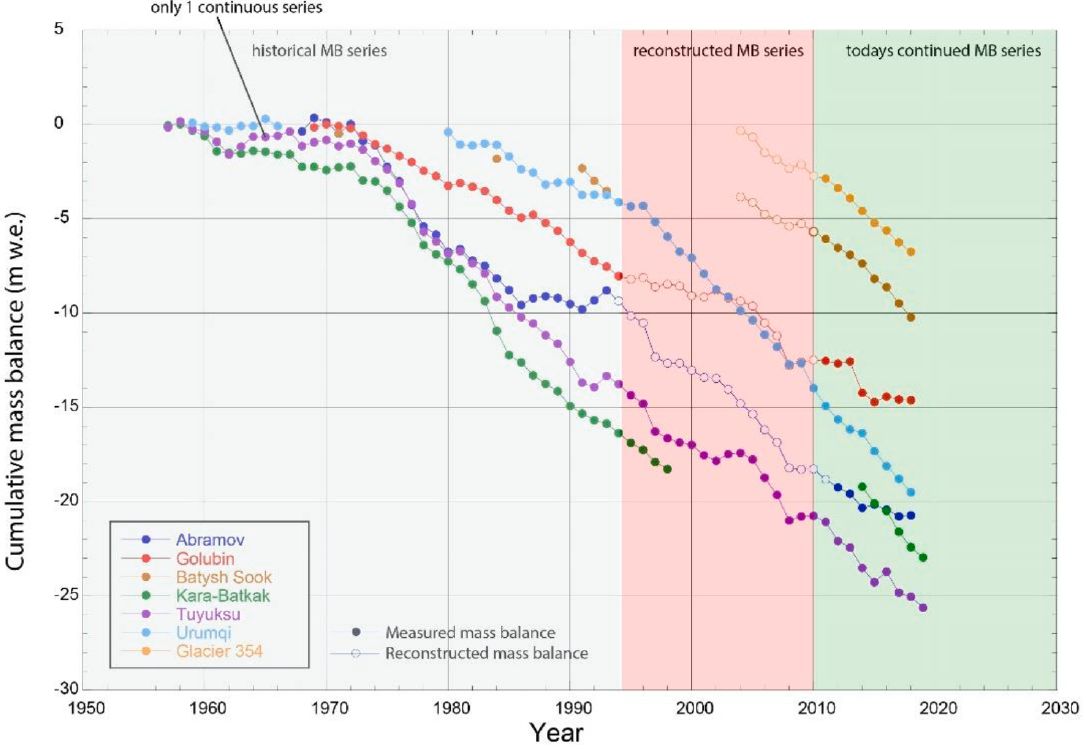
73 KB | Zeitserien der kumulativen Änderung der Massenbilanz von einzelnen Gletschern in Zentralasien in m Wasseräquivalent (Abramov: Pamir; alle anderen Gletscher: Tien Shan) ==Lizenzhinweis== {| style="border:1px solid #8888aa; background-color:#f7f8ff;padding:5px;font-size:95%;" | Quelle: M. Barandun, J. Fiddes, M. Scherler, T. Mathys, T. Saks, D. Petrakov, M. Hoelzle (2020): The state and future of the cryosphere in Central Asia, Water Secur., 11 (2020), Article 100072, 10.1016/j.wasec.2020.100072<… | 1 |
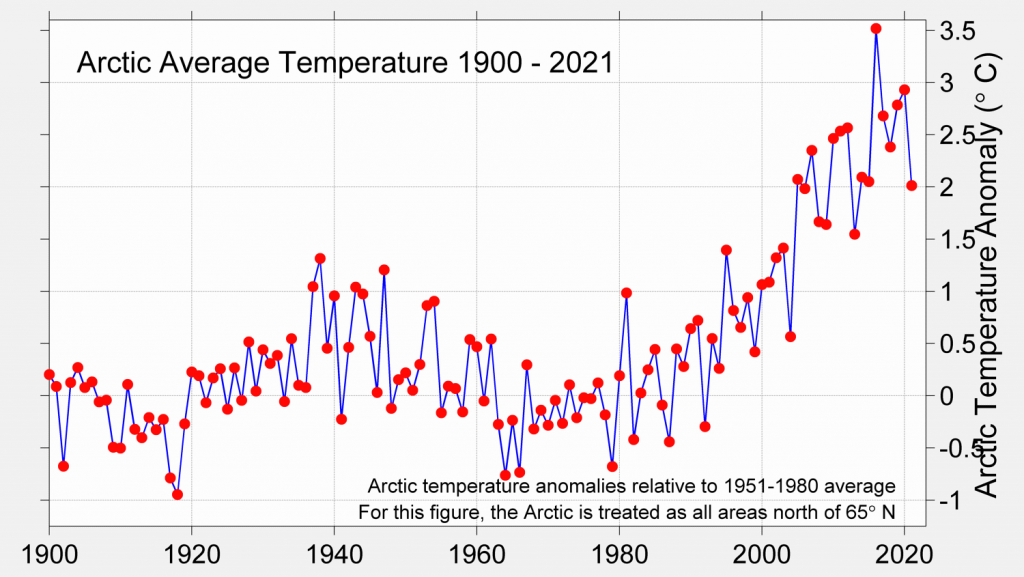
| 17:35, 14. Mär. 2022 | ArcticWarming-1900-2021.png (Datei) |  |
210 KB | Änderung der mittleren Jahrestemperatur in der Arktis 1900-2021 ==Lizenzhinweis== {| style="border:1px solid #8888aa; background-color:#f7f8ff;padding:5px;font-size:95%;" | Quelle: Rohde, R. (2022): Global Temperature Report for 2021, http://berkeleyearth.org/global-temperature-report-for-2021/ <br /> Lizenz: CC BY 4.0 https://creativecommons.org/licenses/by/4.0/ |} | 1 |
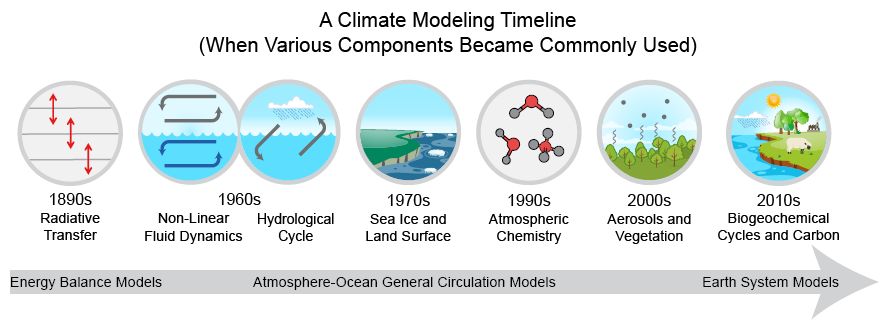
| 17:13, 8. Mär. 2022 | Modeling timeline.jpg (Datei) |  |
46 KB | Die Entwicklung von Klimamodellen von den 1890er Jahren bis zu den 2010er Jahren ==Lizenzhinweis== {| style="border:1px solid #8888aa; background-color:#f7f8ff;padding:5px;font-size:95%;" | Quelle: Hayhoe, K., et al. (2017): Climate models, scenarios, and projections. In: Climate Science Special Report: Fourth National Climate Assessment, Volume I, 133-160, doi: 10.7930/J0WH2N54.<br> Lizenz:public domain |} | 1 |
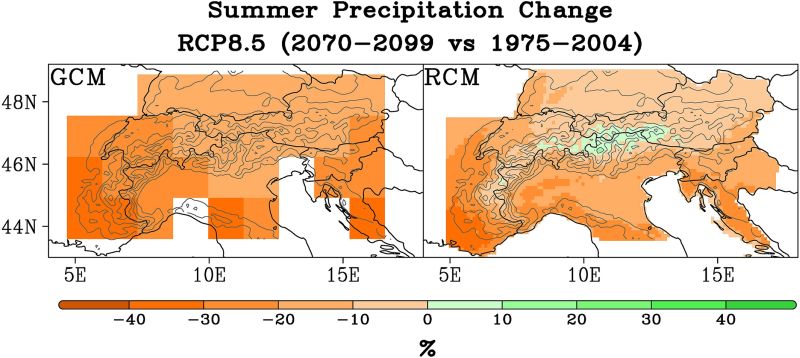
| 17:07, 8. Mär. 2022 | Summer prec alps projection.jpg (Datei) |  |
67 KB | == Beschreibung == Änderung der Sommerniederschläge in den Alpen nach dem Szenario RCP8.5 in einem Globalmodell mit 150 km Auflösung (links) und in Regionalmodellen mit 12 km Auflösung (rechts). Veränderung in % der mittleren Niederschläge 1975-2004 bis 2070-2099. Dass es in den höheren Lagen eine leichte Niederschlagszunahme gibt, wird vom Globalmodell nicht erfasst. ==Lizenzhinweis== {| style="border:1px solid #8888aa; background-color:#f7f8ff;padding:5px;font-size:95%;" | Quelle: Giorgi, F.… | 1 |
| 17:04, 8. Mär. 2022 | Summer prec alps models.jpg (Datei) |  |
49 KB | == Beschreibung == Sommerniederschläge in den Alpen nach Beobachtungsdaten (links), in einem Regionalmodell mit 50 km Auflösung (Mitte) und in einem Globalmodell mit 500 km Auflösung (rechts). Die höheren Niederschläge ab 6 mm/Tag werden vom Globalmodell nicht erfasst. ==Lizenzhinweis== {| style="border:1px solid #8888aa; background-color:#f7f8ff;padding:5px;font-size:95%;" | Quelle: Giorgi, F. (2019): [https://doi.org/10.1029/2018JD030094 Thirty years of regional climate modeling: where are we… | 1 |
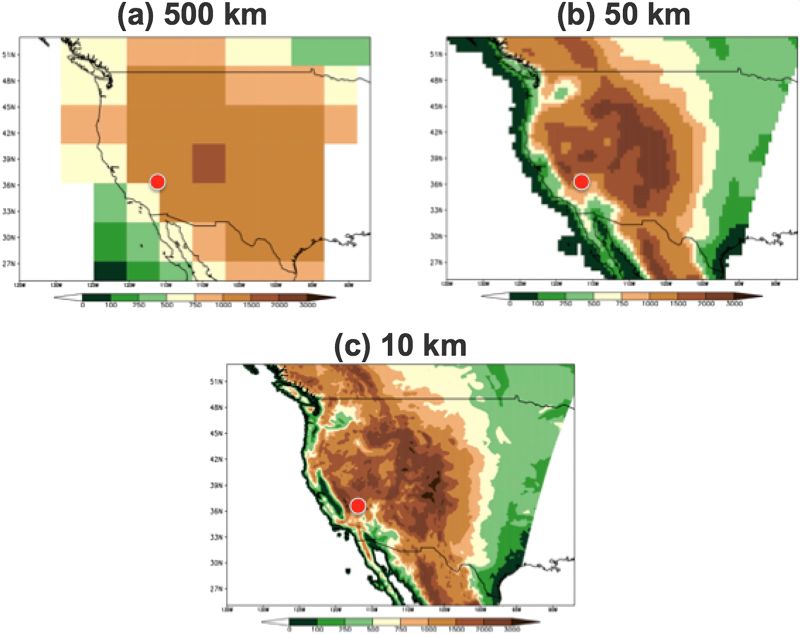
| 16:40, 8. Mär. 2022 | RegModel W-US topography.jpg (Datei) |  |
55 KB | Darstellung der Topographie in den westlichen USA bei unterschiedlicher Modellauflösung ==Lizenzhinweis== {| style="border:1px solid #8888aa; background-color:#f7f8ff;padding:5px;font-size:95%;" | Quelle: Giorgi, F. (2019): Thirty years of regional climate modeling: where are we and where are we going next? Journal of Geophysical Research: Atmospheres, 2018JD030094. https://doi.org/10.1029/2018JD030094<br> Lizenz: AGU grants permission for individuals to use figures, tables, and short quotes fr… | 1 |
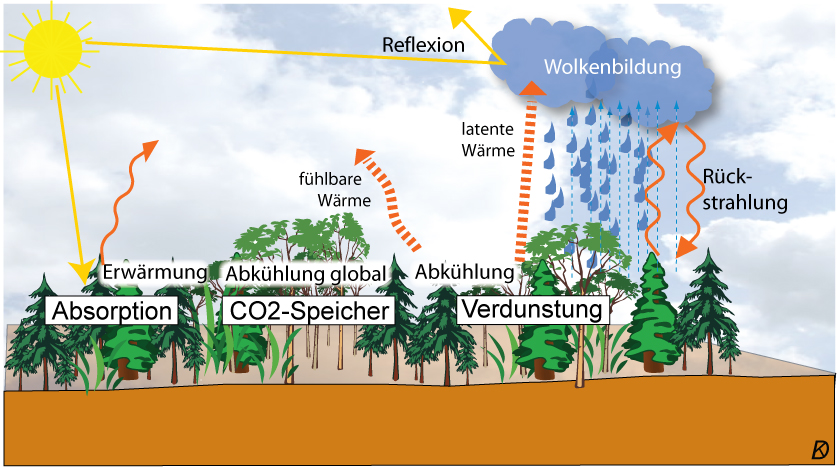
| 13:13, 5. Mär. 2022 | Waldbedeckung.jpg (Datei) |  |
277 KB | Wichtige Beziehungen zwischen Wald und Klima ==Lizenzhinweis== {{Bild-Lizenz}} | 2 |
| 09:54, 28. Feb. 2022 | USA heat cold days.jpg (Datei) |  |
47 KB | Verhältnis von Hitze-Rekord-Tagen zu Kälte-Rekord-Tagen. Die roten Säulen zeigen Jahre mit mehr heißen Rekord-Tagen als kalten Rekord-Tagen, die blauen Jahre mit mehr kalten Rekord-Tagen. Die Höhe der Säulen gibt das am linken Rand genannte Verhältnis von heißen (kalten) zu kalten (heißen) Rekord-Tagen an. 4:1 bedeutet, es gab in dem Jahr (1998) vier Mal so viele heiße als kalte Rekord-Tage. ==Lizenzhinweis== {| style="border:1px solid #8888aa; background-color:#f7f8ff;padding:5px;font-size:95… | 1 |
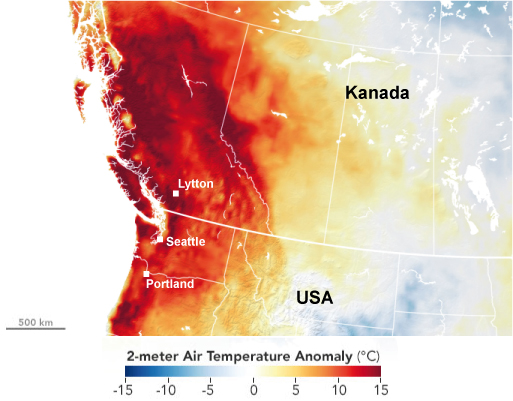
| 09:47, 28. Feb. 2022 | N-America heat June2021.jpg (Datei) |  |
132 KB | Temperaturabweichungen am 27. Juni 2021 vom Mittel 2014-2020 am selben Tag ==Lizenzhinweis== {| style="border:1px solid #8888aa; background-color:#f7f8ff;padding:5px;font-size:95%;" | Quelle: NASA Earth Observational (2021): Exceptional Heat Hits Pacific Northwest https://earthobservatory.nasa.gov/images/148506/exceptional-heat-hits-pacific-northwest<br /> Lizenz: public domain |} | 1 |
| 16:03, 27. Feb. 2022 | Agroforestry Burkina Faso.jpg (Datei) |  |
262 KB | == Beschreibung == Agroforstwirtschaft im südwestlichen Burkina Faso == Lizenzhinweis == {| style="border:1px solid #8888aa; background-color:#f7f8ff;padding:5px;font-size:95%;" | Quelle: Nyamekye, C., M. Thiel, S. Schönbrodt-Stitt, B. J.-B. Zoungrana, and L.K. Amekudzi (2018): [https://doi.org/10.3390/su10093182 Soil and Water Conservation in Burkina Faso, West Africa], Sustainability 10, no. 9: 3182.<br> Lizenz: [http://creativecommons.org/licenses/by/4.0/ CC BY] |} | 1 |
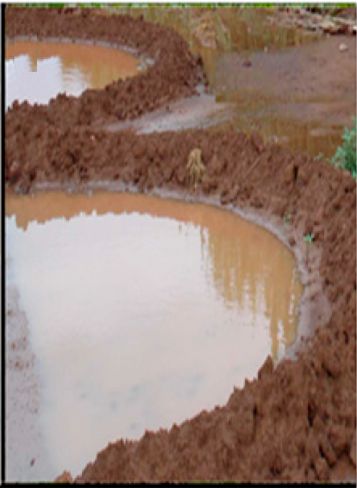
| 16:01, 27. Feb. 2022 | Half-moons Burkina Faso.jpg (Datei) |  |
23 KB | == Beschreibung == Halbmondförmige Vertiefungen mit Erdwall zum Auffangen von Wasser == Lizenzhinweis == {| style="border:1px solid #8888aa; background-color:#f7f8ff;padding:5px;font-size:95%;" | Quelle: Nyamekye, C., M. Thiel, S. Schönbrodt-Stitt, B. J.-B. Zoungrana, and L.K. Amekudzi (2018): [https://doi.org/10.3390/su10093182 Soil and Water Conservation in Burkina Faso, West Africa], Sustainability 10, no. 9: 3182.<br> Lizenz: [http://creativecommons.org/licenses/by/4.0/ CC BY] |} | 1 |
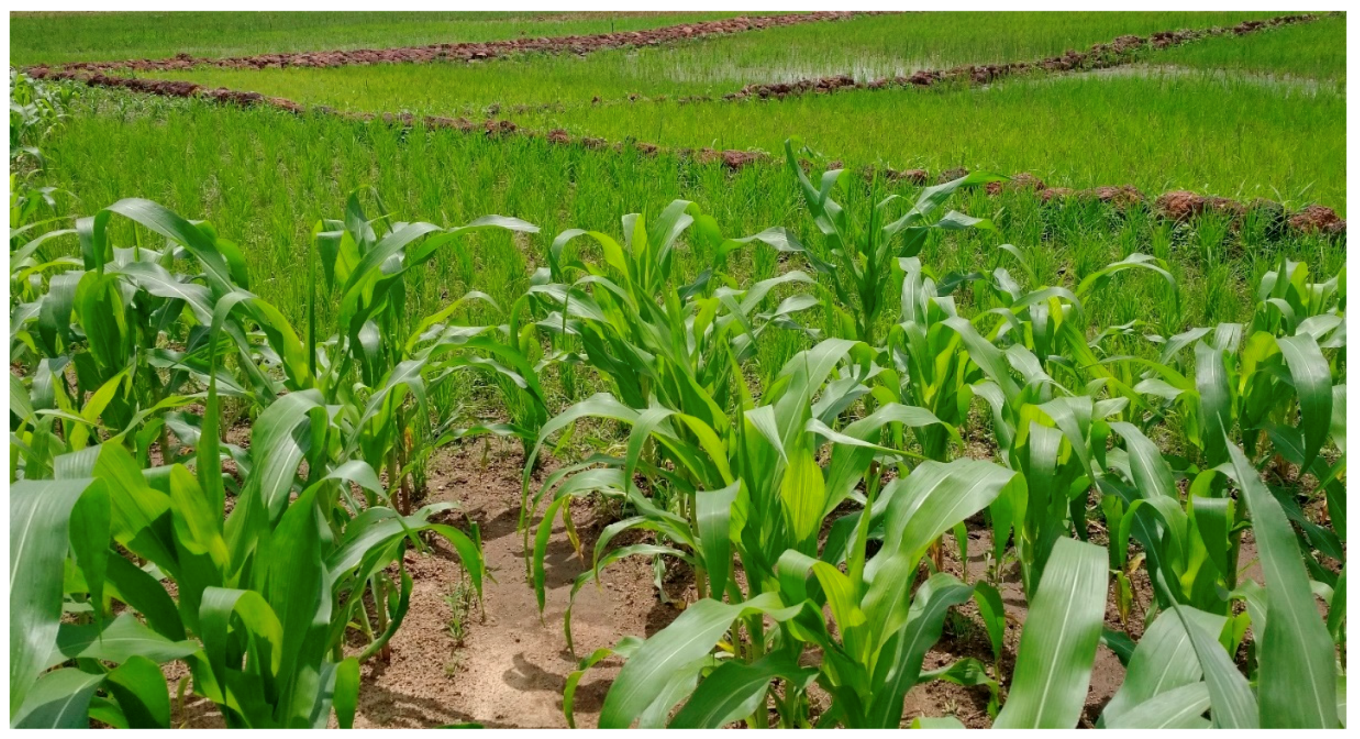
| 15:58, 27. Feb. 2022 | Stone bund maize rice.png (Datei) |  |
1,67 MB | == Beschreibung == Reis- und Maisfelder nach der Errichtung von Steinwällen im südwestlichen Burkina Faso == Lizenzhinweis == {| style="border:1px solid #8888aa; background-color:#f7f8ff;padding:5px;font-size:95%;" | Quelle: Nyamekye, C., M. Thiel, S. Schönbrodt-Stitt, B. J.-B. Zoungrana, and L.K. Amekudzi (2018): Soil and Water Conservation in Burkina Faso, West Africa, Sustainability 10, no. 9: 3182. https://doi.org/10.3390/su10093182<br> Lizenz: [http://creativecommons.org/licenses/by/4.0/… | 1 |
| 21:12, 26. Feb. 2022 | Senegal millet field bushes.JPG (Datei) |  |
209 KB | Hirsefeld in der Trockenzeit mit Büschen im Niger ==Lizenzhinweis== {| style="border:1px solid #8888aa; background-color:#f7f8ff;padding:5px;font-size:95%;" | Quelle: Wikimedia Commons (2013): Boscia senegalensis, Author: Paul von Dam https://commons.wikimedia.org/wiki/File:Boscia_senegalensis_-_Occurrence_in_field.JPG <br> Lizenz: CC BY-SA https://creativecommons.org/licenses/by-sa/3.0/deed.en |} | 1 |
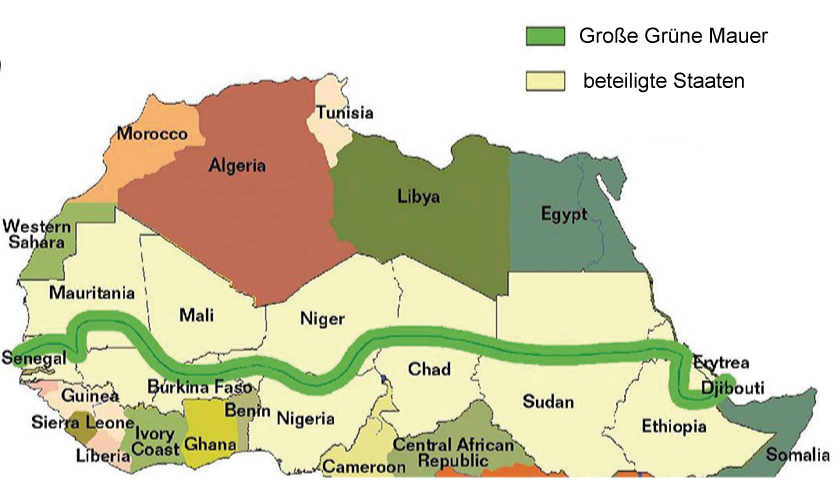
| 17:17, 26. Feb. 2022 | Große-Grüne-Mauer.jpg (Datei) |  |
186 KB | == Beschreibung == Grüne Mauer im Sahel und beteiligte Staaten (gelb) == Lizenzhinweis == {| style="border:1px solid #8888aa; background-color:#f7f8ff;padding:5px;font-size:95%;" | Quelle: Saley, I.A., S. Salack, I.S. Sanda et al. (2019): The possible role of the Sahel Greenbelt on the occurrence of climate extremes over the West African Sahel. Atmos Sci Lett. 20; e927. https://doi.org/10.1002/asl.927<br> Lizenz: [http://creativecommons.org/licenses/by/4.0/ CC BY] |} | 1 |
| 17:07, 26. Feb. 2022 | Niamey-rotes-schwarzes-Hochwasser.jpg (Datei) |  |
156 KB | Rotes (Sommer-) und schwarzes (Winter-)Hochwasser an der Station in Niamey 1929-2020 als Standardabweichung == Lizenzhinweis == {| style="border:1px solid #8888aa; background-color:#f7f8ff;padding:5px;font-size:95%;" | Quelle: Massazza, G., M. Bacci, L. Descroix et al. (2021): Recent Changes in Hydroclimatic Patterns over Medium Niger River Basins at the Origin of the 2020 Flood in Niamey (Niger), Water 13, 1659, https://doi.org/10.3390/w13121659<br> Lizenz: [http://creativecommons.org/licen… | 1 |
| 16:58, 26. Feb. 2022 | Abflusskoeffizient-Sahel.jpg (Datei) |  |
98 KB | == Beschreibung == Abflusskoeffizient (Anteil des Abflusses am Niederschlag in %) bei Nebenflüssen des Volta (Nakambé) und des mittleren Niger (alle übrigen). == Lizenzhinweis == {| style="border:1px solid #8888aa; background-color:#f7f8ff;padding:5px;font-size:95%;" | Quelle: Descroix, L., F. Guichard, M. Grippa (2018): Evolution of surface hydrology in the sahelo-sudanian strip: an updated review. Water 10, 748. https://doi.org/10.3390/w10060748<br> Lizenz: [http://creativecommons.org/licen… | 1 |
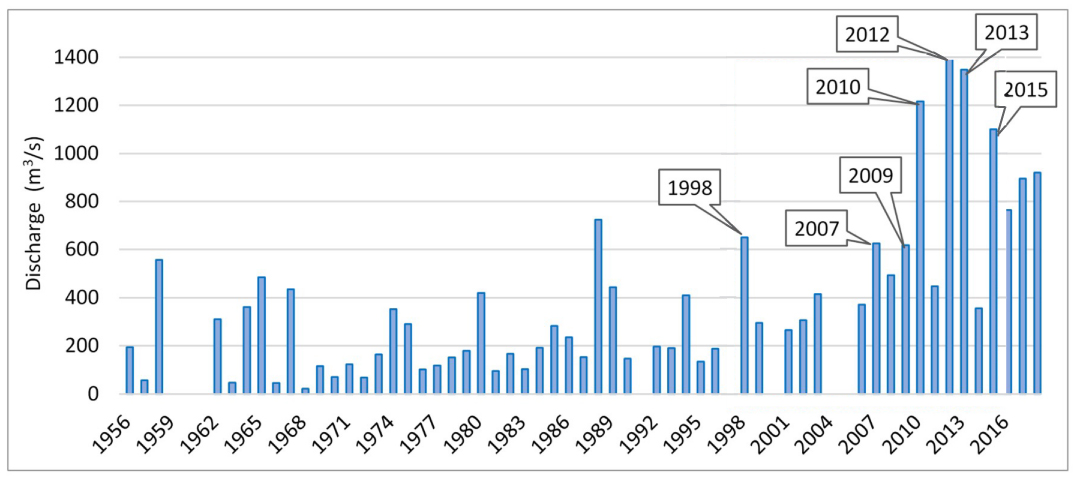
| 12:17, 26. Feb. 2022 | Runoff-Sirba-river1956-2018b.jpg (Datei) |  |
149 KB | == Beschreibung == Jahresmaxima des Sirba-Abflusses (Nebenfluss des Niger) == Lizenzhinweis == {| style="border:1px solid #8888aa; background-color:#f7f8ff;padding:5px;font-size:95%;" | Quelle: Massazza, G., P. Tamagnone, C. Wilcox, E. Belcore et al. (2019): Flood Hazard Scenarios of the Sirba River (Niger): Evaluation of the Hazard Thresholds and Flooding Areas. Water 2019, 11, 1018<br> Lizenz: [http://creativecommons.org/licenses/by/4.0/ CC BY] |} | 1 |
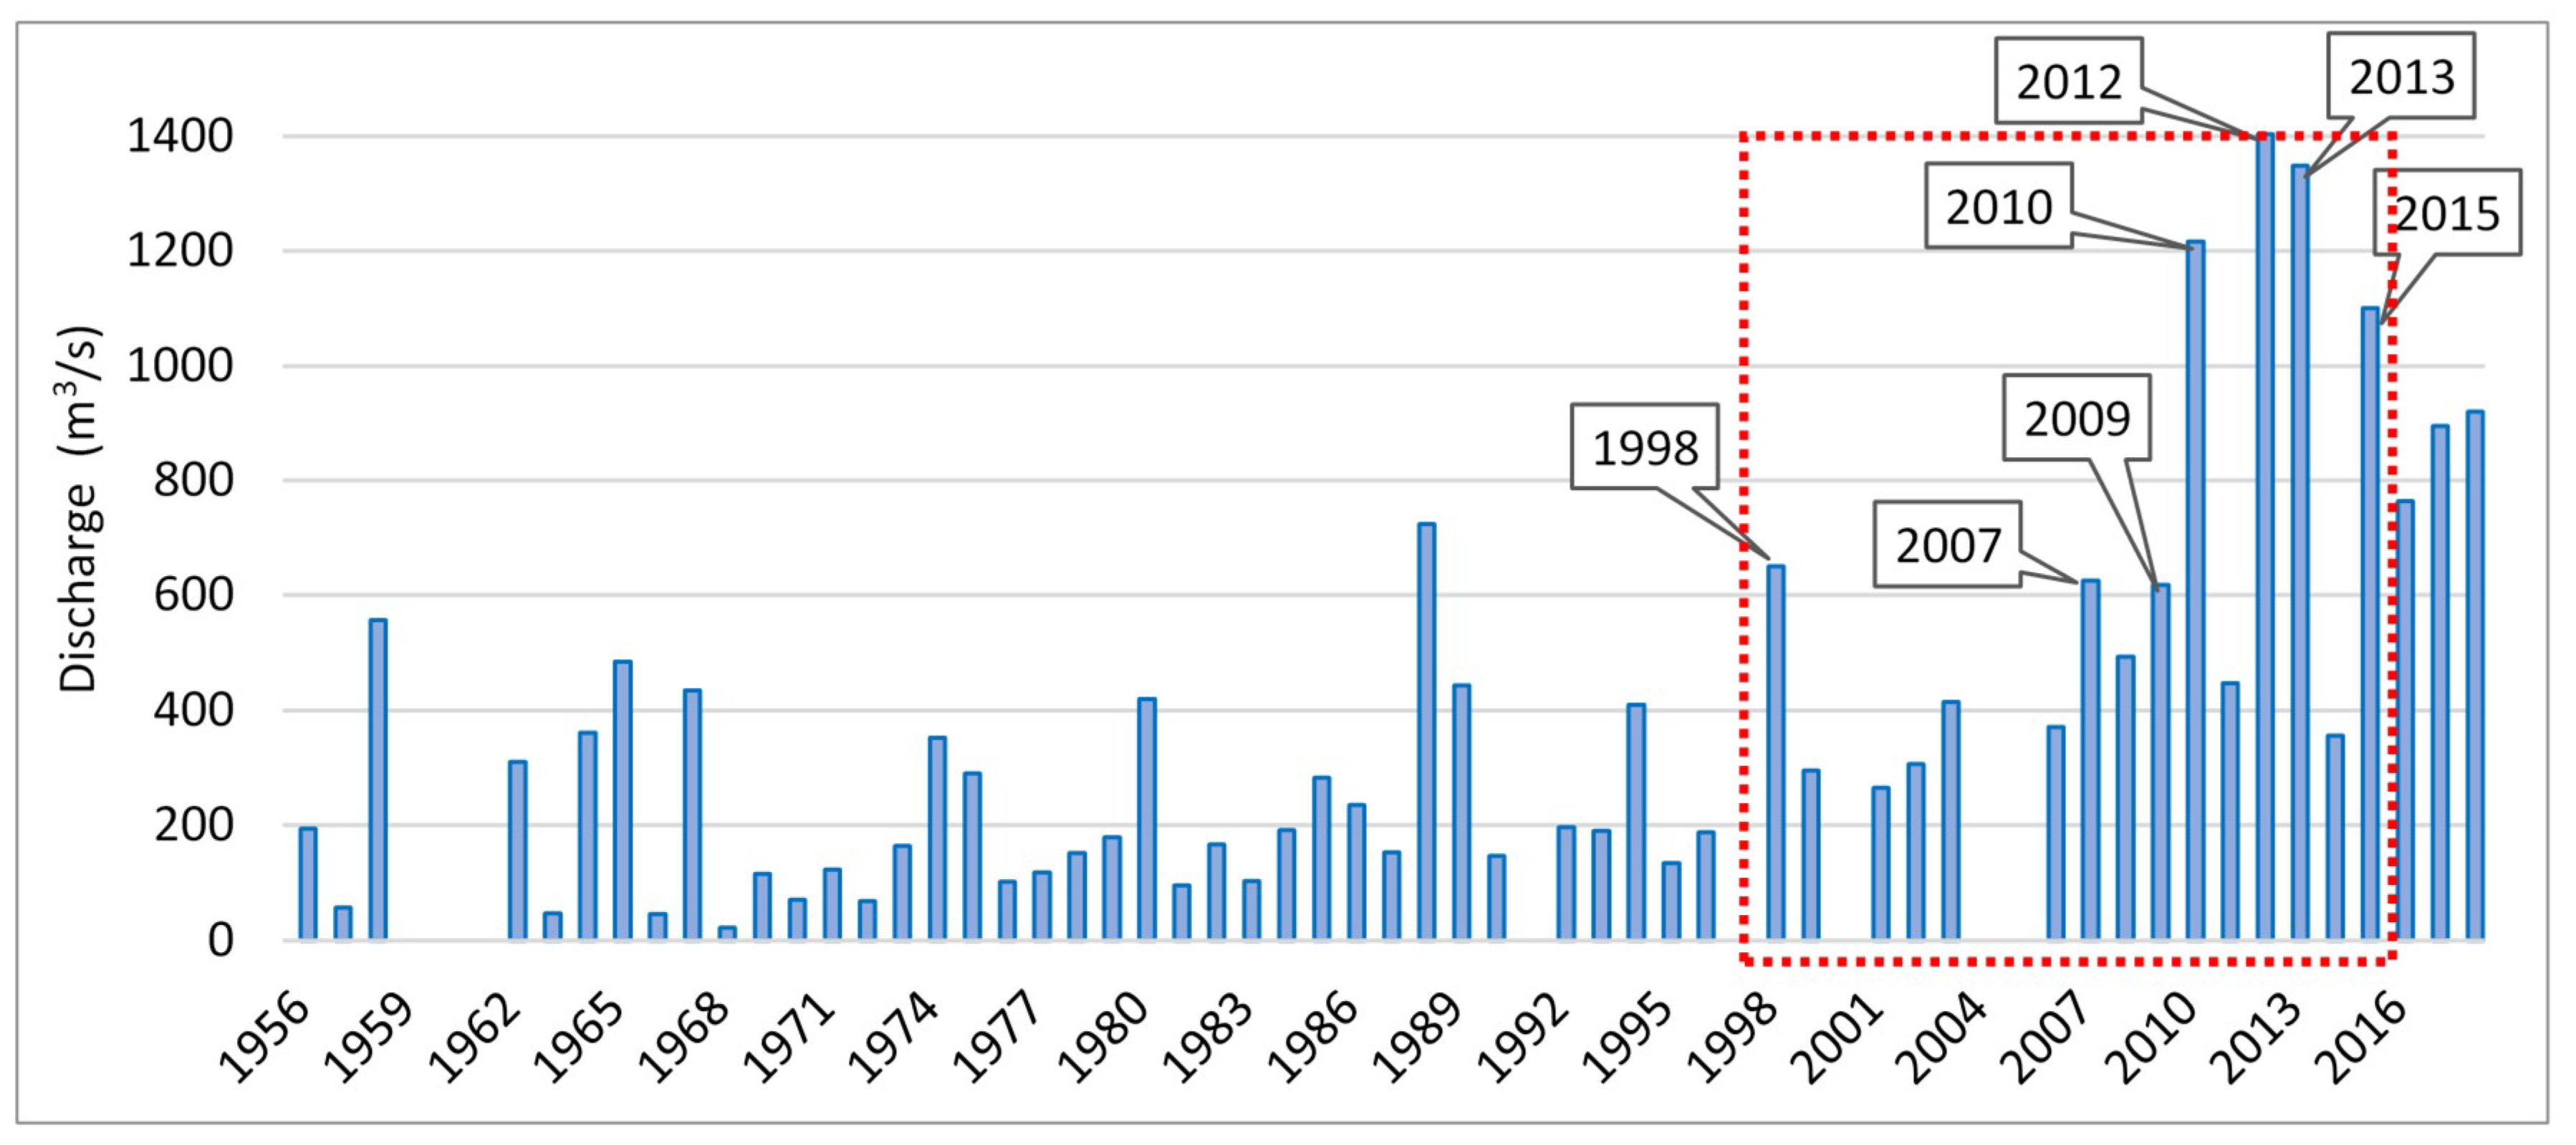
| 12:17, 26. Feb. 2022 | Runoff Sirba river1956-2018b.png (Datei) |  |
969 KB | == Beschreibung == Jahresmaxima des Sirba-Abflusses (Nebenfluss des Niger) == Lizenzhinweis == {| style="border:1px solid #8888aa; background-color:#f7f8ff;padding:5px;font-size:95%;" | Quelle: Massazza, G., P. Tamagnone, C. Wilcox, E. Belcore et al. (2019): Flood Hazard Scenarios of the Sirba River (Niger): Evaluation of the Hazard Thresholds and Flooding Areas. Water 2019, 11, 1018<br> Lizenz: [http://creativecommons.org/licenses/by/4.0/ CC BY] |} | 1 |
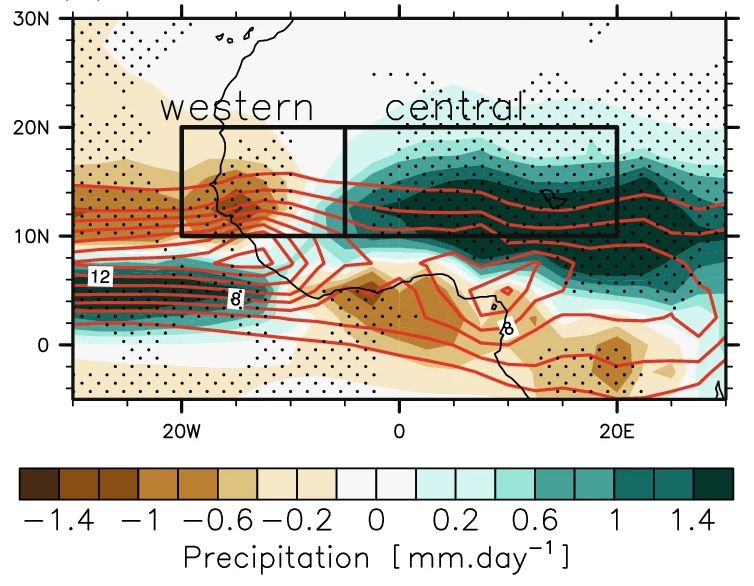
| 12:03, 26. Feb. 2022 | Sahel prec West-Central 2100.jpg (Datei) |  |
87 KB | == Beschreibung == Änderung der Niederschläge in Westafrika im Sommer zwischen 1960-1999 und 2060-2099 nach dem RCP8.5 Szenario in mm/Tag nach CMIP6-Modell-Simulationen. Die roten Konturen zeigen die historischen Niederschläge in mm/Tag. ==Lizenzhinweis== {| style="border:1px solid #8888aa; background-color:#f7f8ff;padding:5px;font-size:95%;" | Quelle: Monerie, PA., Wainwright, C.M., Sidibe, M. et al. (2020b): Model uncertainties in climate change impacts on Sahel precipitation in ensembles of… | 1 |
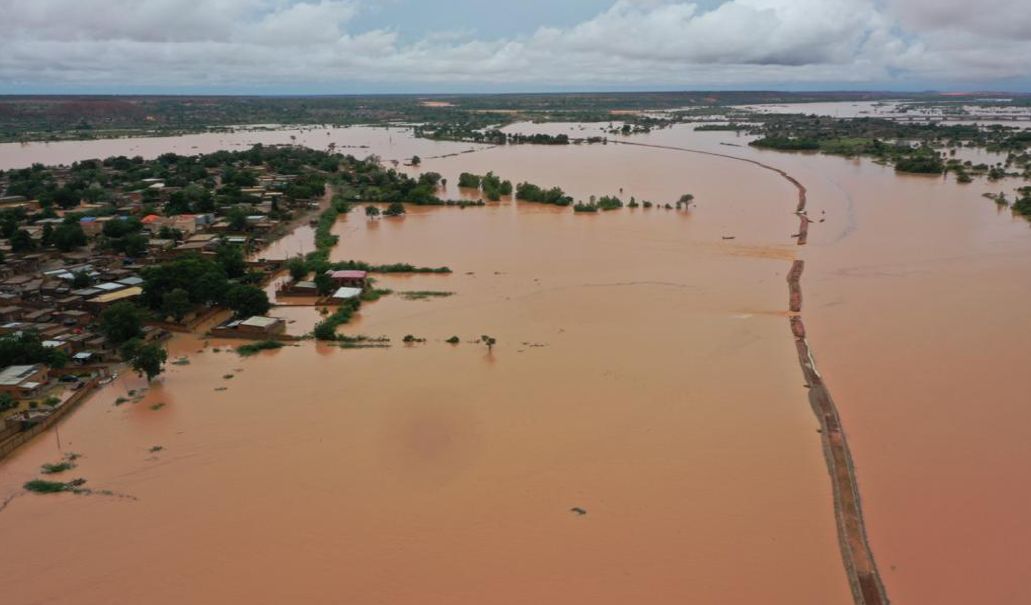
| 11:58, 26. Feb. 2022 | Niamey flood 2020b.jpg (Datei) |  |
58 KB | == Beschreibung == Hochwasser am Niger in Niamey am 7. September 2020 ==Lizenzhinweis== {| style="border:1px solid #8888aa; background-color:#f7f8ff;padding:5px;font-size:95%;" | Quelle: Massazza, G., M. Bacci, L. Descroix et al. (2021): Recent Changes in Hydroclimatic Patterns over Medium Niger River Basins at the Origin of the 2020 Flood in Niamey (Niger), Water 13, 1659, https://doi.org/10.3390/w13121659<br> Lizenz: [http://creativecommons.org/licenses/by/4.0/ CC BY 4.0] |} | 1 |
| 15:33, 25. Feb. 2022 | Sahel Wind Winter Sommer-c.jpg (Datei) |  |
186 KB | == Beschreibung == Oberflächenwinde in Westafrika: Oberflächenwinde (Pfeile) und Luftdruck (in mb) über Westafrika im Winter und während des Höhepunkts des Sommermonsuns. ==Lizenzhinweis== {| style="border:1px solid #8888aa; background-color:#f7f8ff;padding:5px;font-size:95%;" | Quelle: Nicholson, S. E. (2013): The West African Sahel: A Review of Recent Studies on the Rainfall Regime and Its Interannual Variability. ISRN Meteorology, 1–32 Lizenz: CC BY https://creativecommons.org/licenses/by/3… | 1 |
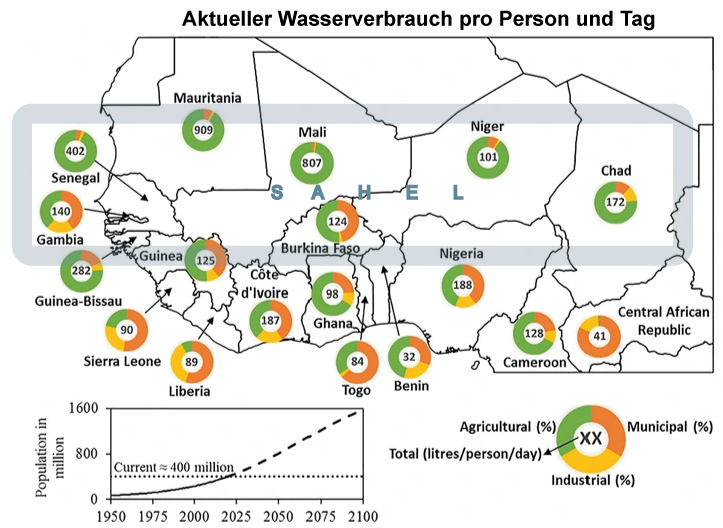
| 15:17, 25. Feb. 2022 | Wateruse-Sahel.jpg (Datei) |  |
174 KB | Aktueller Wasserverbrauch in Liter pro Person und Tag in Westafrika (Sahel hervorgehoben) und Bevölkerungsentwicklung bis 2100 ==Lizenzhinweis== {| style="border:1px solid #8888aa; background-color:#f7f8ff;padding:5px;font-size:95%;" | Quelle: Rameshwaran, P., Bell, V.A., H.N. Davies et al. (2021): How might climate change affect river flows across West Africa? Climatic Change 169, 21 (2021). https://doi.org/10.1007/s10584-021-03256-0 Lizenz: CC BY http://creativecommons.org/licenses/by/4.0/… | 1 |
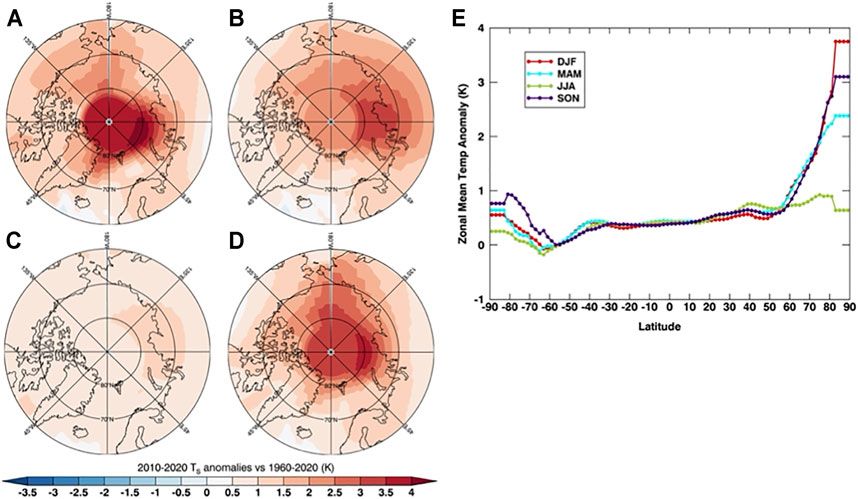
| 18:53, 20. Feb. 2022 | Arctic Warming seasons.jpg (Datei) |  |
70 KB | == Beschreibung == Arktische Erwärmung nach Jahreszeiten 2010-2020 im Vergleich zu 1960-2020: A: Winter, B: Frühjahr, C: Sommer, D: Herbst. Sowie globale Erwärmung nach Jahreszeiten und Breitengraden ==Lizenzhinweis== {| style="border:1px solid #8888aa; background-color:#f7f8ff;padding:5px;font-size:95%;" | Quelle: Taylor, P.C., R.C. Boeke, L.N. Boisvert et al.(2022): Process Drivers, Inter-Model Spread, and the Path Forward: A Review of Amplified Arctic Warming. Front. Earth Sci. 9:758361. do… | 1 |
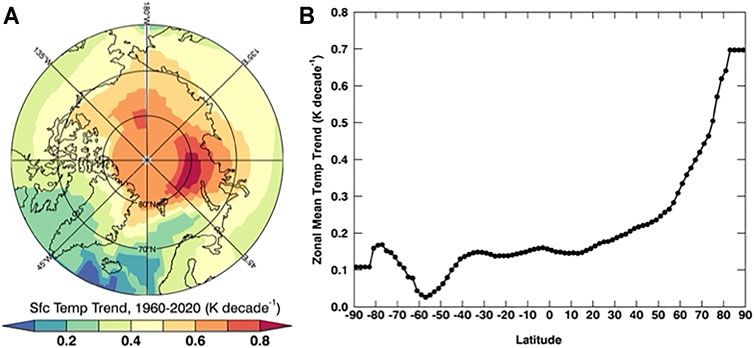
| 17:41, 20. Feb. 2022 | Warming latitudes 1960-2020.jpg (Datei) |  |
41 KB | == Beschreibung == Arktische Erwärmung geographisch und die globale Erwärmung nach Breitengrad, 1960-2020 ==Lizenzhinweis== {| style="border:1px solid #8888aa; background-color:#f7f8ff;padding:5px;font-size:95%;" | Quelle: Taylor, P.C., R.C. Boeke, L.N. Boisvert et al.(2022): Process Drivers, Inter-Model Spread, and the Path Forward: A Review of Amplified Arctic Warming. Front. Earth Sci. 9:758361. doi: 10.3389/feart.2021.758361<br> Lizenz: [http://creativecommons.org/licenses/by/4.0/ CC BY]… | 1 |
| 17:34, 20. Feb. 2022 | Arcti global warming.jpg (Datei) |  |
158 KB | == Beschreibung == Die "Arktische Verstärkung“ ==Lizenzhinweis== {| style="border:1px solid #8888aa; background-color:#f7f8ff;padding:5px;font-size:95%;" | Quelle: Henry, M., CarbonBrief (2022): [https://www.carbonbrief.org/guest-post-why-does-the-arctic-warm-faster-than-the-rest-of-the-planet Why does the Arctic warm faster than the rest of the planet?]<br> Lizenz: [https://creativecommons.org/licenses/by-nc-nd/4.0/legalcode CC BY-NC-ND] |} | 1 |
| 17:31, 20. Feb. 2022 | Cold hot air Arctic tropical.jpg (Datei) |  |
36 KB | == Beschreibung == Warme Luft am Äquator transportiert die zusätzliche Erwärmung in höher Schichten, kalte Luft am Pol hält sie am Boden. ==Lizenzhinweis== {| style="border:1px solid #8888aa; background-color:#f7f8ff;padding:5px;font-size:95%;" | Quelle: Henry, M., CarbonBrief (2022): [https://www.carbonbrief.org/guest-post-why-does-the-arctic-warm-faster-than-the-rest-of-the-planet Why does the Arctic warm faster than the rest of the planet?]<br> Lizenz: [https://creativecommons.org/licenses/… | 1 |
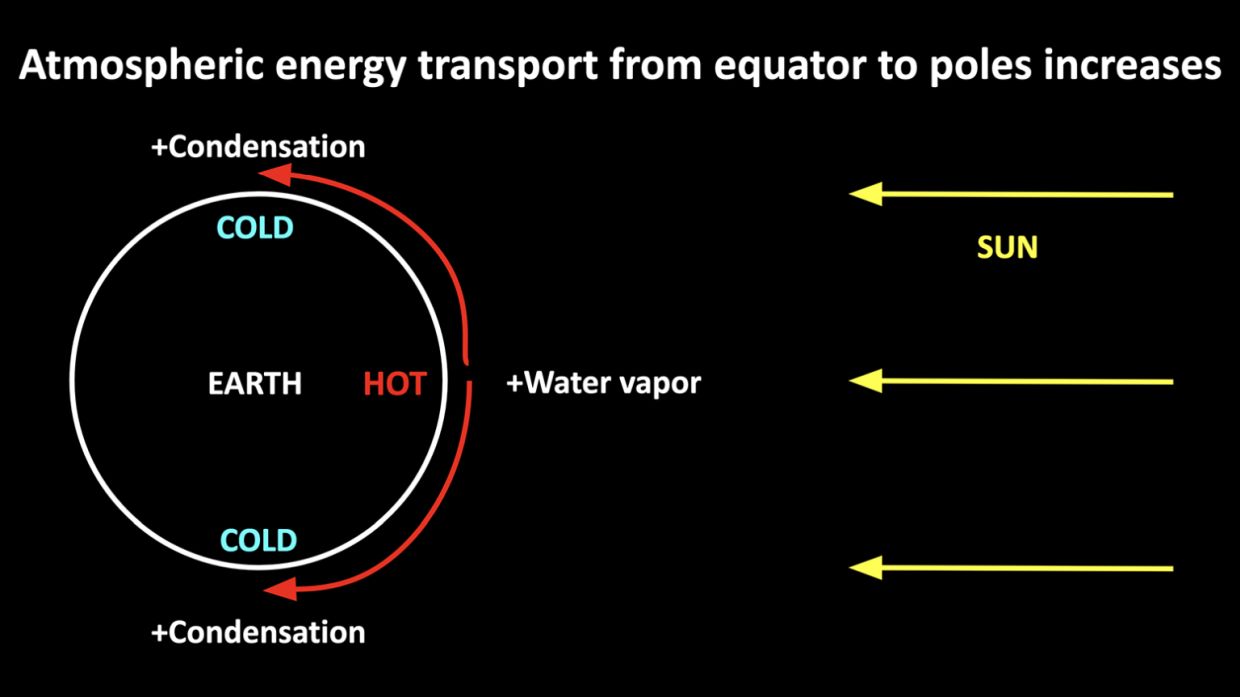
| 17:27, 20. Feb. 2022 | Water vapour condensation.jpg (Datei) |  |
45 KB | == Beschreibung == Wasserdampf wird von den niederen Breiten Richtung Arktis transportiert, kondensiert dort und setzt Wärme frei. ==Lizenzhinweis== {| style="border:1px solid #8888aa; background-color:#f7f8ff;padding:5px;font-size:95%;" | Quelle: Henry, M., CarbonBrief (2022): Why does the Arctic warm faster than the rest of the planet?, https://www.carbonbrief.org/guest-post-why-does-the-arctic-warm-faster-than-the-rest-of-the-planet<br> Lizenz: CC BY-NC-ND https://creativecommons.org/licens… | 1 |
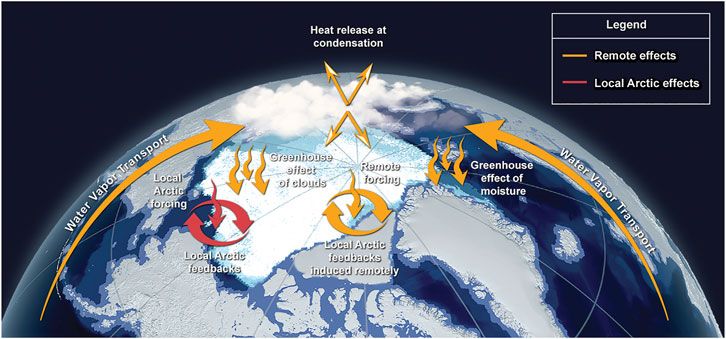
| 17:20, 20. Feb. 2022 | Arctic warming water vapour.jpg (Datei) |  |
57 KB | Einfluss des Wasserdampftransports in die Arktis und lokale Effekte ==Lizenzhinweis== {| style="border:1px solid #8888aa; background-color:#f7f8ff;padding:5px;font-size:95%;" | Quelle: Taylor PC, Boeke RC, Boisvert LN, Feldl N, Henry M, Huang Y, Langen PL, Liu W, Pithan F, Sejas SA and Tan I (2022) Process Drivers, Inter-Model Spread, and the Path Forward: A Review of Amplified Arctic Warming. Front. Earth Sci. 9:758361. doi: 10.3389/feart.2021.758361<br> Lizenz: CC BY http://creativecommons.o… | 1 |
| 10:48, 27. Jan. 2022 | Heat mortality Paris London.jpg (Datei) |  |
92 KB | == Beschreibung == Hitze bedingte Sterbefälle pro 100.000 Einwohner in London und Paris im Sommer 2003 (dicke Linie) und für jedes Jahr 1993-2003 (dünne Linien). == Lizenzhinweis == {| style="border:1px solid #8888aa; background-color:#f7f8ff;padding:5px;font-size:95%;" | Quelle: Mitchell, D., C. Heaviside, S. Vardoulakis et al. (2016): Attributing human mortality during extreme heatwaves to anthropogenic climate change, Environmental Research Letters, doi:10.1088/1748-9326/11/7/074006<br> Li… | 1 |
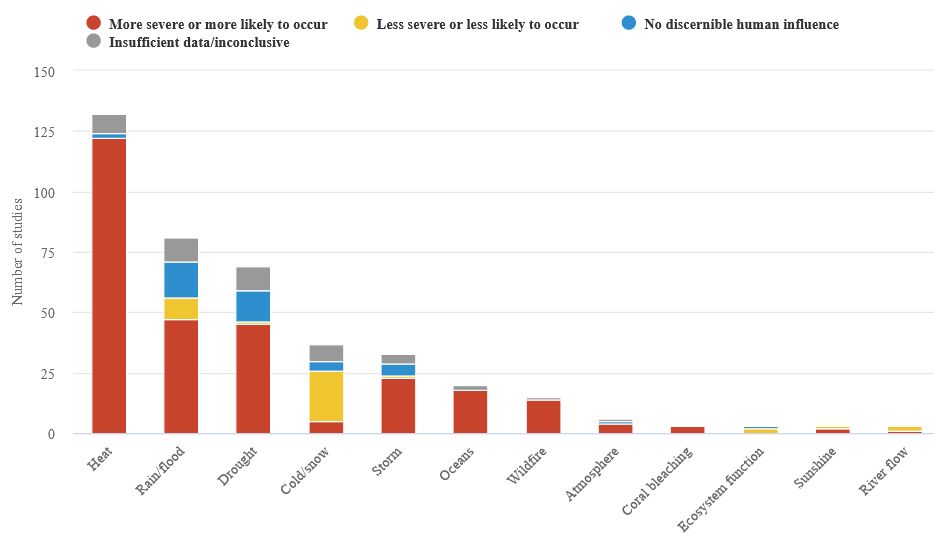
| 10:42, 27. Jan. 2022 | Extremes attribution cc.jpg (Datei) |  |
32 KB | Der menschliche Einfluss durch den Klimawandel auf unterschiedliche Extremwetterereignisse. Rot zeigt, dass das untersuchte Extremereignis durch den Klimawandel stärker ausgefallen ist oder sich mit höherer Wahrscheinlich ereignet hat, gelb zeigt einen weniger starken Effekt bzw. selteneres Vorkommen, blau keinen erkennbaren Einfluss und grau eine ungenügende Datenlage. == Lizenzhinweis == {| style="border:1px solid #8888aa; background-color:#f7f8ff;padding:5px;font-size:95%;" | Quelle: Carbo… | 1 |
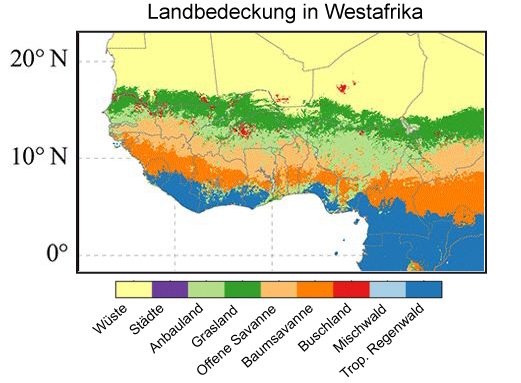
| 10:46, 19. Jan. 2022 | W-Afrika-Landbedeckung.jpg (Datei) |  |
122 KB | == Beschreibung == Landbedeckung in W-Afrika, verändert und übersetzt == Lizenzhinweis == {| style="border:1px solid #8888aa; background-color:#f7f8ff;padding:5px;font-size:95%;" | Quelle: van Wees, D., und G.R. van der Werf (2019): [https://doi.org/10.5194/gmd-12-4681-2019 Modelling biomass burning emissions and the effect of spatial resolution: a case study for Africa based on the Global Fire Emissions Database (GFED)], Geosci. Model Dev., 12, 4681–4703<br> Lizenz: [http://creativecommons.org… | 2 |
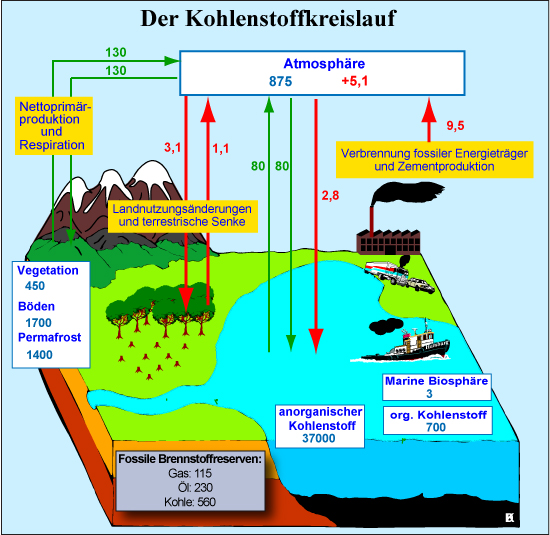
| 12:15, 16. Jan. 2022 | CO2-kreislauf.jpg (Datei) |  |
211 KB | Die Abb. zeigt den Kohlenstoffaustausch zwischen Atmosphäre, Landvegetation und Ozean in GtC pro Jahr sowie die Reservoire in GtC (Gigatonnen = Milliarden t; 1 t C entspricht 3,67 t CO<sub>2</sub>). Die grünen Pfeile und Werte zeigen die natürlichen Austausche und die blauen Werte (in den weißen Kästchen) die natürlichen Reservoire vor 1750. Die roten Pfeile und Werte zeigen die jährlichen anthropogenen Flüsse und der rote Wert in dem Reservoir Atmosphäre die jährliche Kohlentoffzunahme in den… | 4 |
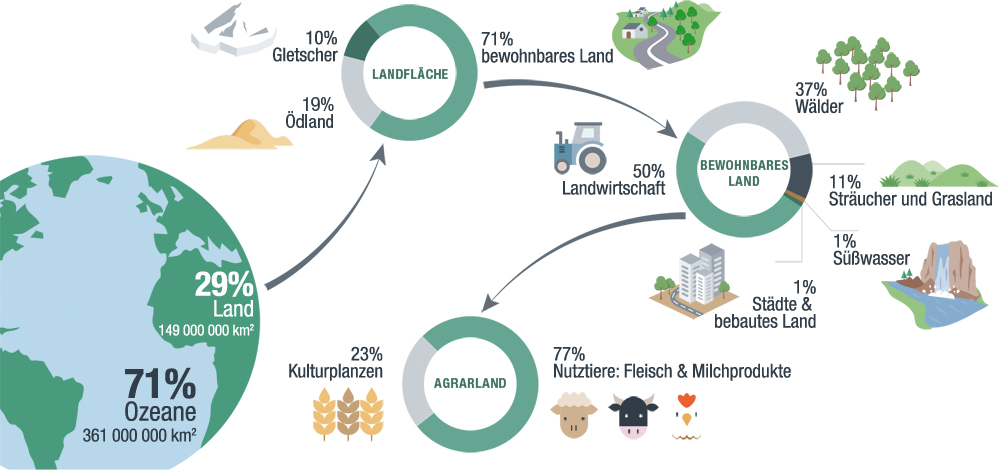
| 21:06, 13. Jan. 2022 | Landnutzung-2015.jpg (Datei) |  |
241 KB | == Beschreibung == Landnutzungsformen und ihre Flächenanteile 2015 ==Lizenzhinweis== {| style="border:1px solid #8888aa; background-color:#f7f8ff;padding:5px;font-size:95%;" | Quelle: Office for Climate Education (2021): IPCC-Sonderbericht „Klimawandel und Landsysteme“ – Zusammenfassung für Lehrende, https://www.sonnentaler.net/dokumentation/ipcc-berichte/sr-klimawandel-landnutzung/ <br> Lizenz: CC BY-NC-SA |} | 1 |
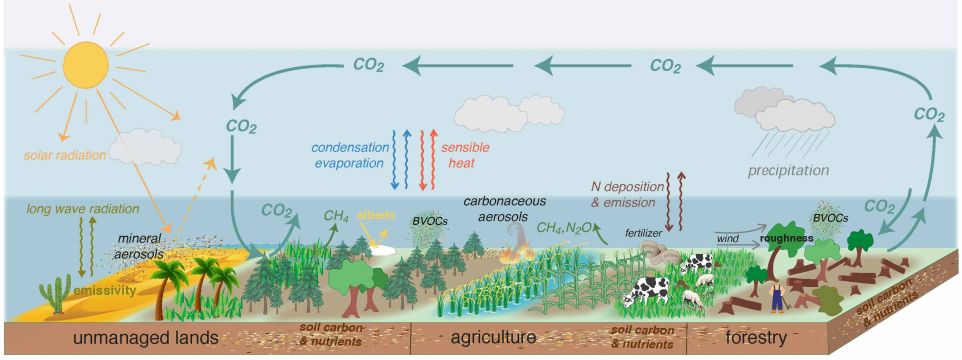
| 20:19, 13. Jan. 2022 | Landcover atmosphere interaction sm.jpg (Datei) |  |
55 KB | Wechselwirkungen zwischen Landbedeckungen und Atmosphäre ==Lizenzhinweis== {| style="border:1px solid #8888aa; background-color:#f7f8ff;padding:5px;font-size:95%;" | Quelle: IPCC (2019): Land-climate interactions. In: Climate Change and Land, Box 2.1, Figure 1, https://www.ipcc.ch/srccl/<br> Lizenz: [https://www.ipcc.ch/copyright IPCC-Copyright]: Reproduction of limited number of figures or short excerpts of IPCC material is authorized free of charge and without formal written permission pro… | 1 |
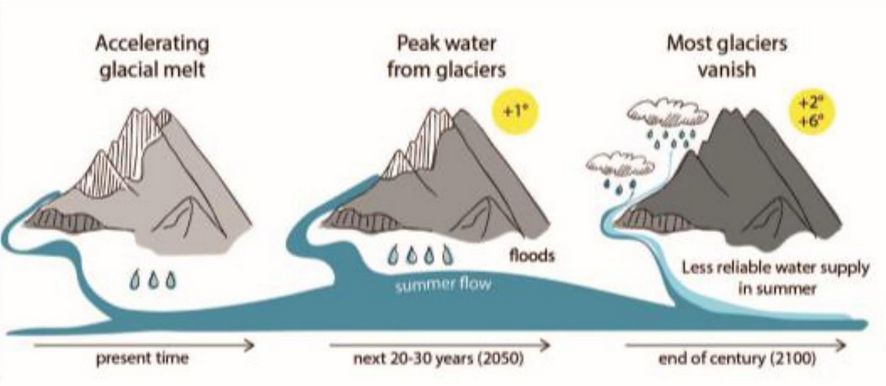
| 20:48, 9. Jan. 2022 | Glacier melt runoff.jpg (Datei) |  |
36 KB | == Beschreibung == Gletscherschmelze und Abfluss in Mittelasien ==Lizenzhinweis== {| style="border:1px solid #8888aa; background-color:#f7f8ff;padding:5px;font-size:95%;" | Quelle: M. Barandun, J. Fiddes, M. Scherler, T. Mathys, T. Saks, D. Petrakov, M. Hoelzle (2020): The state and future of the cryosphere in Central Asia, Water Secur., 11 (2020), Article 100072, 10.1016/j.wasec.2020.100072<br> Lizenz: [https://creativecommons.org/licenses/ CC-BY-NC-ND] |} | 1 |
| 20:43, 9. Jan. 2022 | Central Asia mountains.ai.jpg (Datei) |  |
84 KB | Gebirgsregionen in Mittelasien ==Lizenzhinweis== {| style="border:1px solid #8888aa; background-color:#f7f8ff;padding:5px;font-size:95%;" | Quelle: M. Barandun, J. Fiddes, M. Scherler, T. Mathys, T. Saks, D. Petrakov, M. Hoelzle (2020): The state and future of the cryosphere in Central Asia, Water Secur., 11 (2020), Article 100072, 10.1016/j.wasec.2020.100072<br> Lizenz: Creative Commons CC-BY-NC-ND https://creativecommons.org/licenses/ |} | 1 |
| 20:28, 9. Jan. 2022 | Tien Shan Pamir glaciers MB.jpg (Datei) |  |
66 KB | == Beschreibung == Zeitserien der kumulativen Änderung der Massenbilanz von einzelnen Gletschern in Mittelasien in m Wasseräquivalent (Abramov: Pamir; alle anderen Gletscher: Tien Shan) ==Lizenzhinweis== {| style="border:1px solid #8888aa; background-color:#f7f8ff;padding:5px;font-size:95%;" | Quelle: Barandun, M., J. Fiddes, M. Scherler, T. Mathys, T. Saks, D. Petrakov, M. Hoelzle (2020): The state and future of the cryosphere in Central Asia, Water Secur., 11, Article 100072, 10.1016/j.wasec.… | 1 |
| 20:25, 9. Jan. 2022 | CentralAsia snowmelt 1980-2100.jpg (Datei) |  |
28 KB | == Beschreibung == Abnahme der Schneedicke im westlichen Tien Shan 1981-2100 nach Modellberechnungen mit dem hohen Szenario RCP8.5. ==Lizenzhinweis== {| style="border:1px solid #8888aa; background-color:#f7f8ff;padding:5px;font-size:95%;" | Quelle: Didovets, I., A. Lobanova, V. Krysanova et al. (2021): Central Asian rivers under climate change: Impacts assessment in eight representative catchments, Journal of Hydrology: Regional Studies 34, https://doi.org/10.1016/j.ejrh.2021.100779 <br> Lize… | 1 |
| 20:18, 9. Jan. 2022 | Tien-Shan-Wasserspeicher-2003-2013.jpg (Datei) |  |
233 KB | == Beschreibung == Änderung des vor allem in Eis und Schnee gespeicherten Wassers im Tien Shan zwischen 2003 bis 2014 in mm/Jahr. ==Lizenzhinweis== {| style="border:1px solid #8888aa; background-color:#f7f8ff;padding:5px;font-size:95%;" | Quelle: Chen, Y., L. Weihong, H. Deng et al. (2016): Changes in Central Asia’s Water Tower: Past, Present and Future. Scientific Reports 6, 35458; doi: 10.1038/srep35458<br> Lizenz: CC BY http://creativecommons.org/licenses/by/4.0/ |} | 1 |
