Von Dieter Kasang hochgeladene Dateien
Aus Klimawandel
Diese Spezialseite listet alle hochgeladenen Dateien auf.
| Datum | Name | Vorschaubild | Größe | Beschreibung | Versionen |
|---|---|---|---|---|---|
| 12:17, 26. Feb. 2022 | Runoff-Sirba-river1956-2018b.jpg (Datei) |  |
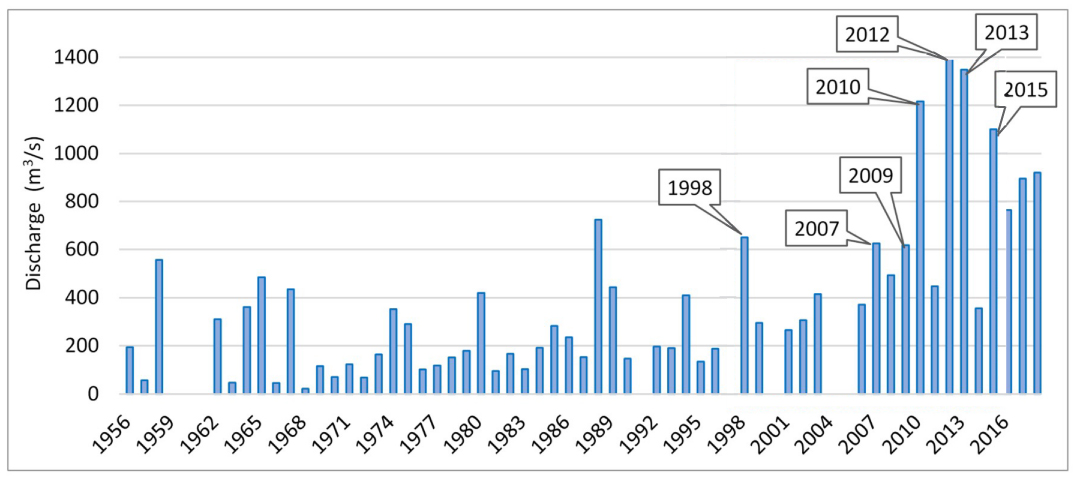
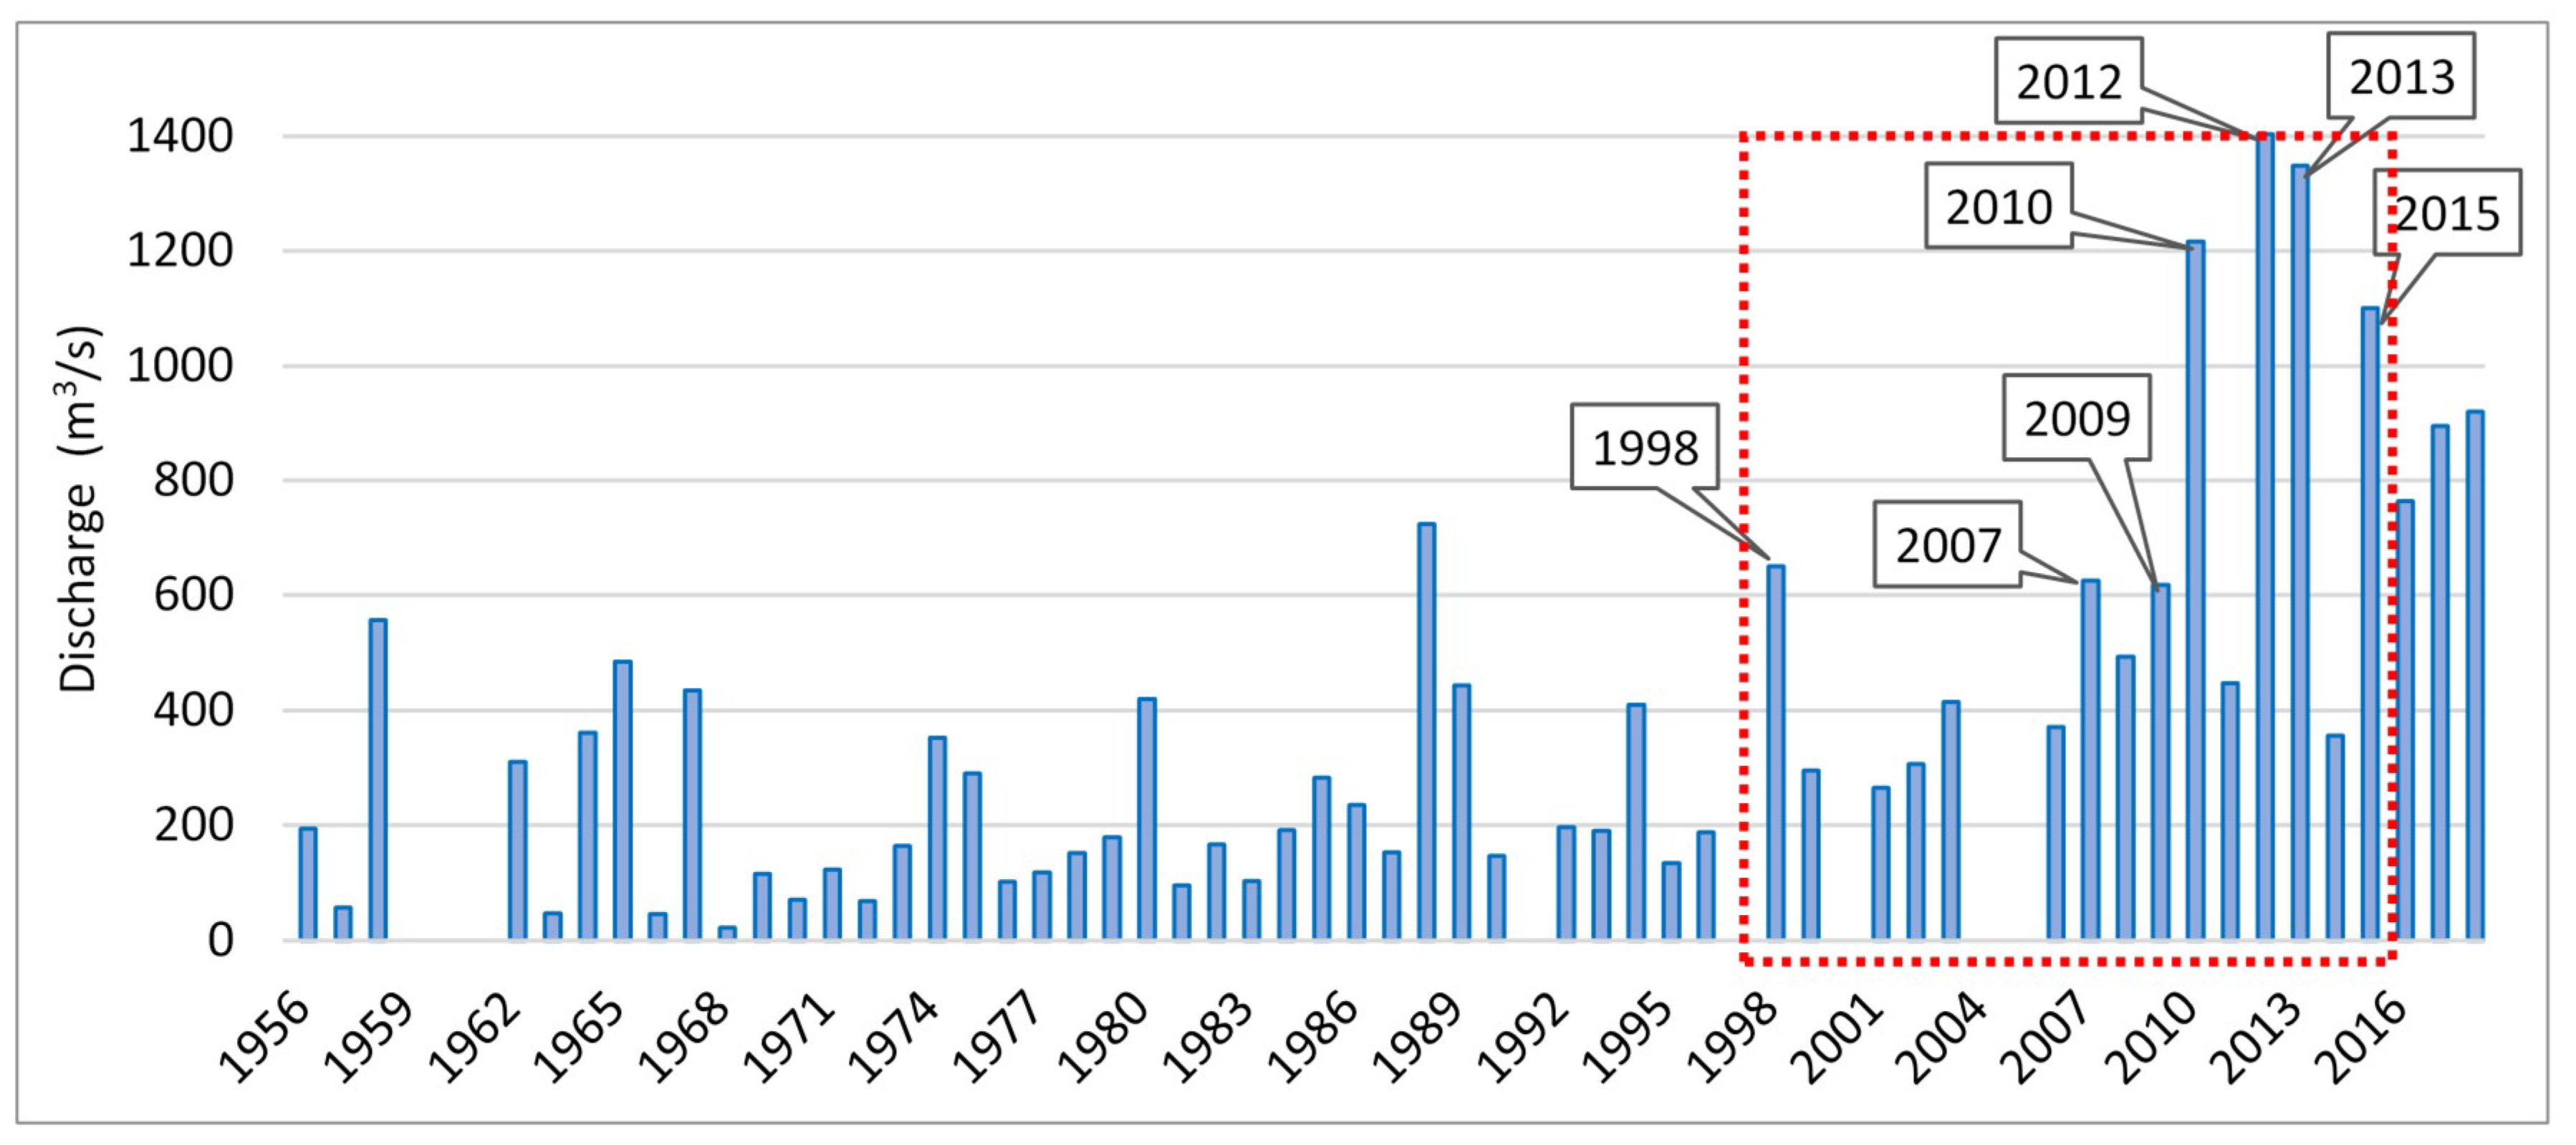
149 KB | == Beschreibung == Jahresmaxima des Sirba-Abflusses (Nebenfluss des Niger) == Lizenzhinweis == {| style="border:1px solid #8888aa; background-color:#f7f8ff;padding:5px;font-size:95%;" | Quelle: Massazza, G., P. Tamagnone, C. Wilcox, E. Belcore et al. (2019): Flood Hazard Scenarios of the Sirba River (Niger): Evaluation of the Hazard Thresholds and Flooding Areas. Water 2019, 11, 1018<br> Lizenz: [http://creativecommons.org/licenses/by/4.0/ CC BY] |} | 1 |
| 12:17, 26. Feb. 2022 | Runoff Sirba river1956-2018b.png (Datei) |  |
969 KB | == Beschreibung == Jahresmaxima des Sirba-Abflusses (Nebenfluss des Niger) == Lizenzhinweis == {| style="border:1px solid #8888aa; background-color:#f7f8ff;padding:5px;font-size:95%;" | Quelle: Massazza, G., P. Tamagnone, C. Wilcox, E. Belcore et al. (2019): Flood Hazard Scenarios of the Sirba River (Niger): Evaluation of the Hazard Thresholds and Flooding Areas. Water 2019, 11, 1018<br> Lizenz: [http://creativecommons.org/licenses/by/4.0/ CC BY] |} | 1 |
| 12:03, 26. Feb. 2022 | Sahel prec West-Central 2100.jpg (Datei) |  |
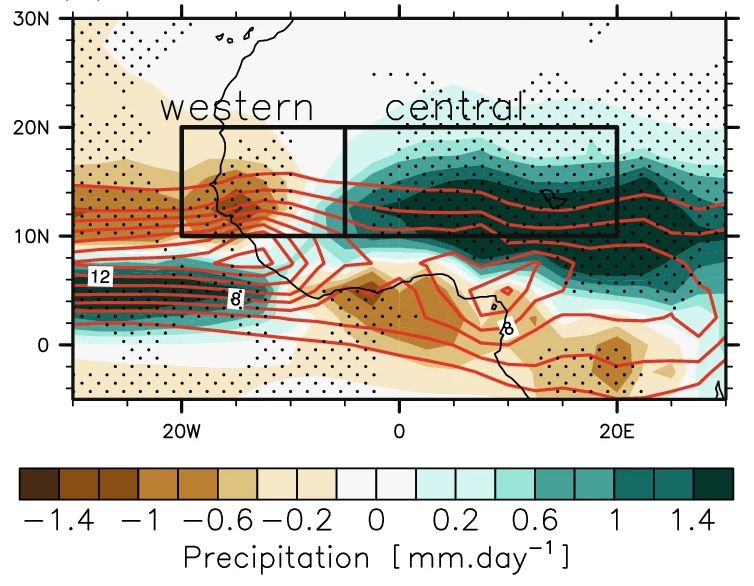
87 KB | == Beschreibung == Änderung der Niederschläge in Westafrika im Sommer zwischen 1960-1999 und 2060-2099 nach dem RCP8.5 Szenario in mm/Tag nach CMIP6-Modell-Simulationen. Die roten Konturen zeigen die historischen Niederschläge in mm/Tag. ==Lizenzhinweis== {| style="border:1px solid #8888aa; background-color:#f7f8ff;padding:5px;font-size:95%;" | Quelle: Monerie, PA., Wainwright, C.M., Sidibe, M. et al. (2020b): Model uncertainties in climate change impacts on Sahel precipitation in ensembles of… | 1 |
| 11:58, 26. Feb. 2022 | Niamey flood 2020b.jpg (Datei) |  |
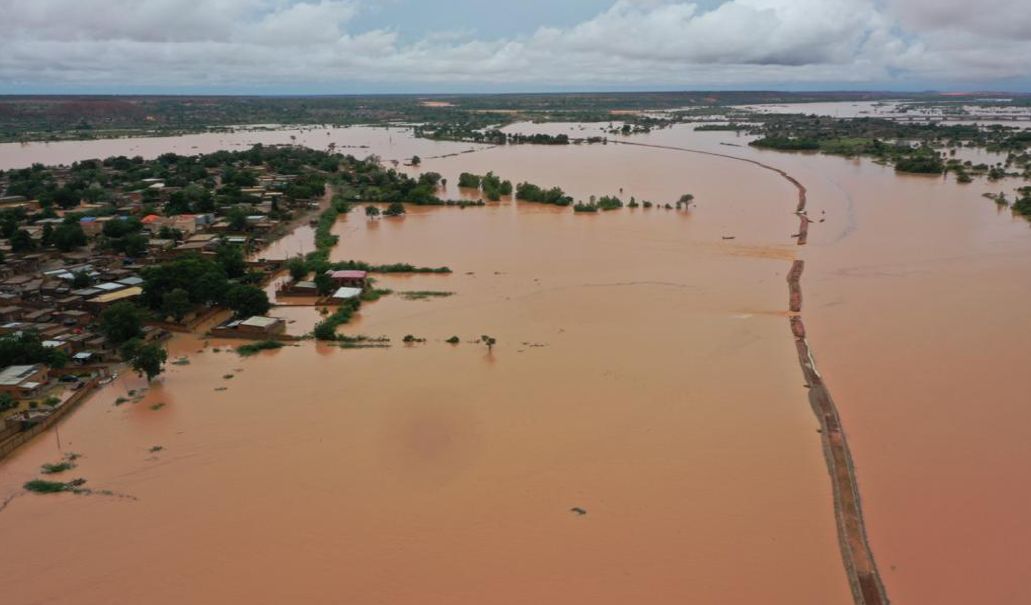
58 KB | == Beschreibung == Hochwasser am Niger in Niamey am 7. September 2020 ==Lizenzhinweis== {| style="border:1px solid #8888aa; background-color:#f7f8ff;padding:5px;font-size:95%;" | Quelle: Massazza, G., M. Bacci, L. Descroix et al. (2021): Recent Changes in Hydroclimatic Patterns over Medium Niger River Basins at the Origin of the 2020 Flood in Niamey (Niger), Water 13, 1659, https://doi.org/10.3390/w13121659<br> Lizenz: [http://creativecommons.org/licenses/by/4.0/ CC BY 4.0] |} | 1 |
| 15:33, 25. Feb. 2022 | Sahel Wind Winter Sommer-c.jpg (Datei) |  |
186 KB | == Beschreibung == Oberflächenwinde in Westafrika: Oberflächenwinde (Pfeile) und Luftdruck (in mb) über Westafrika im Winter und während des Höhepunkts des Sommermonsuns. ==Lizenzhinweis== {| style="border:1px solid #8888aa; background-color:#f7f8ff;padding:5px;font-size:95%;" | Quelle: Nicholson, S. E. (2013): The West African Sahel: A Review of Recent Studies on the Rainfall Regime and Its Interannual Variability. ISRN Meteorology, 1–32 Lizenz: CC BY https://creativecommons.org/licenses/by/3… | 1 |
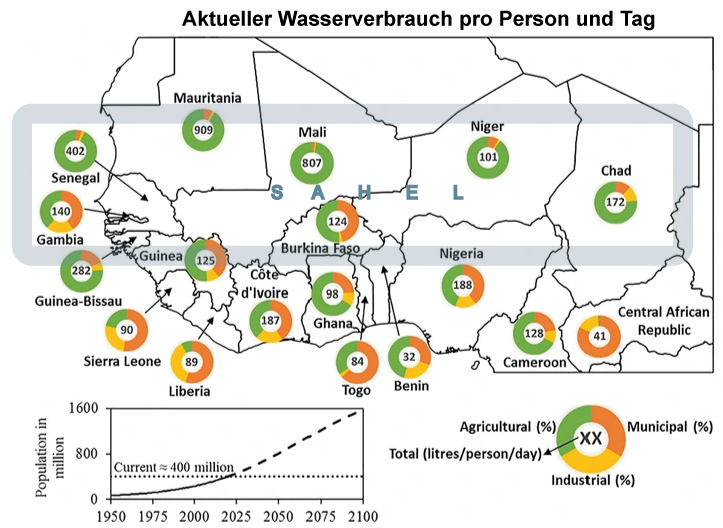
| 15:17, 25. Feb. 2022 | Wateruse-Sahel.jpg (Datei) |  |
174 KB | Aktueller Wasserverbrauch in Liter pro Person und Tag in Westafrika (Sahel hervorgehoben) und Bevölkerungsentwicklung bis 2100 ==Lizenzhinweis== {| style="border:1px solid #8888aa; background-color:#f7f8ff;padding:5px;font-size:95%;" | Quelle: Rameshwaran, P., Bell, V.A., H.N. Davies et al. (2021): How might climate change affect river flows across West Africa? Climatic Change 169, 21 (2021). https://doi.org/10.1007/s10584-021-03256-0 Lizenz: CC BY http://creativecommons.org/licenses/by/4.0/… | 1 |
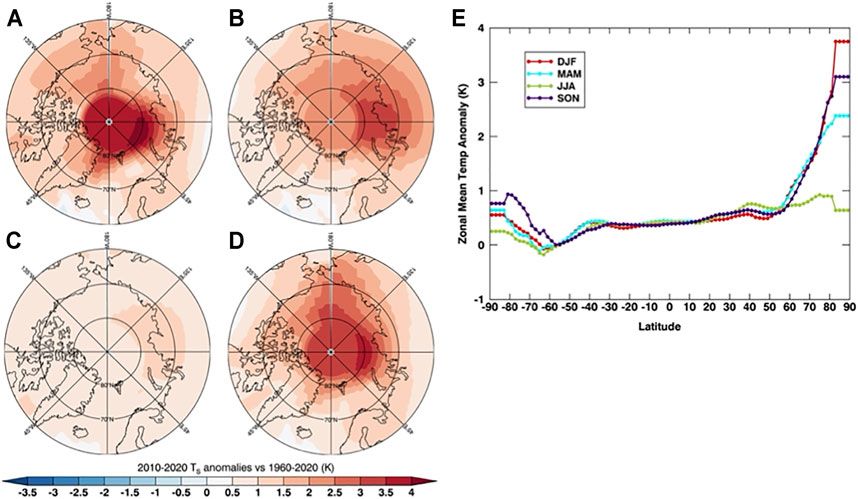
| 18:53, 20. Feb. 2022 | Arctic Warming seasons.jpg (Datei) |  |
70 KB | == Beschreibung == Arktische Erwärmung nach Jahreszeiten 2010-2020 im Vergleich zu 1960-2020: A: Winter, B: Frühjahr, C: Sommer, D: Herbst. Sowie globale Erwärmung nach Jahreszeiten und Breitengraden ==Lizenzhinweis== {| style="border:1px solid #8888aa; background-color:#f7f8ff;padding:5px;font-size:95%;" | Quelle: Taylor, P.C., R.C. Boeke, L.N. Boisvert et al.(2022): Process Drivers, Inter-Model Spread, and the Path Forward: A Review of Amplified Arctic Warming. Front. Earth Sci. 9:758361. do… | 1 |
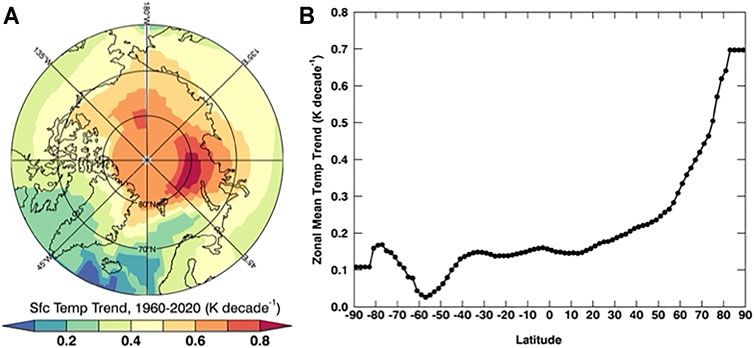
| 17:41, 20. Feb. 2022 | Warming latitudes 1960-2020.jpg (Datei) |  |
41 KB | == Beschreibung == Arktische Erwärmung geographisch und die globale Erwärmung nach Breitengrad, 1960-2020 ==Lizenzhinweis== {| style="border:1px solid #8888aa; background-color:#f7f8ff;padding:5px;font-size:95%;" | Quelle: Taylor, P.C., R.C. Boeke, L.N. Boisvert et al.(2022): Process Drivers, Inter-Model Spread, and the Path Forward: A Review of Amplified Arctic Warming. Front. Earth Sci. 9:758361. doi: 10.3389/feart.2021.758361<br> Lizenz: [http://creativecommons.org/licenses/by/4.0/ CC BY]… | 1 |
| 17:34, 20. Feb. 2022 | Arcti global warming.jpg (Datei) |  |
158 KB | == Beschreibung == Die "Arktische Verstärkung“ ==Lizenzhinweis== {| style="border:1px solid #8888aa; background-color:#f7f8ff;padding:5px;font-size:95%;" | Quelle: Henry, M., CarbonBrief (2022): [https://www.carbonbrief.org/guest-post-why-does-the-arctic-warm-faster-than-the-rest-of-the-planet Why does the Arctic warm faster than the rest of the planet?]<br> Lizenz: [https://creativecommons.org/licenses/by-nc-nd/4.0/legalcode CC BY-NC-ND] |} | 1 |
| 17:31, 20. Feb. 2022 | Cold hot air Arctic tropical.jpg (Datei) |  |
36 KB | == Beschreibung == Warme Luft am Äquator transportiert die zusätzliche Erwärmung in höher Schichten, kalte Luft am Pol hält sie am Boden. ==Lizenzhinweis== {| style="border:1px solid #8888aa; background-color:#f7f8ff;padding:5px;font-size:95%;" | Quelle: Henry, M., CarbonBrief (2022): [https://www.carbonbrief.org/guest-post-why-does-the-arctic-warm-faster-than-the-rest-of-the-planet Why does the Arctic warm faster than the rest of the planet?]<br> Lizenz: [https://creativecommons.org/licenses/… | 1 |
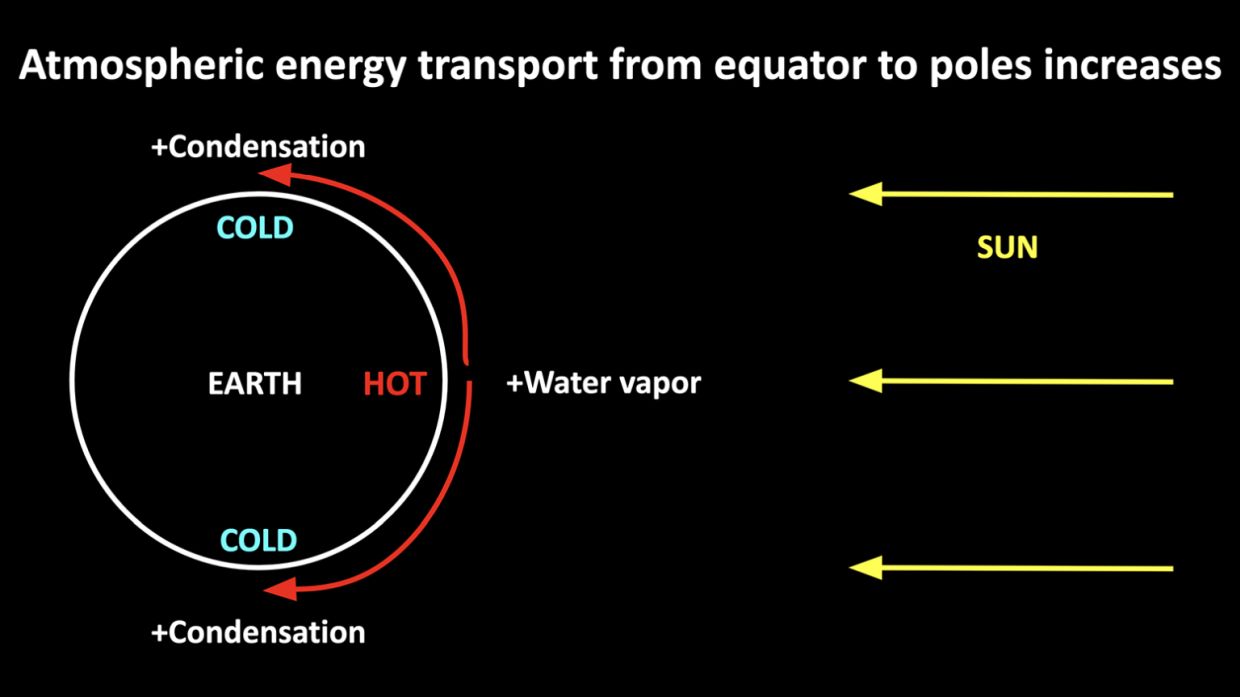
| 17:27, 20. Feb. 2022 | Water vapour condensation.jpg (Datei) |  |
45 KB | == Beschreibung == Wasserdampf wird von den niederen Breiten Richtung Arktis transportiert, kondensiert dort und setzt Wärme frei. ==Lizenzhinweis== {| style="border:1px solid #8888aa; background-color:#f7f8ff;padding:5px;font-size:95%;" | Quelle: Henry, M., CarbonBrief (2022): Why does the Arctic warm faster than the rest of the planet?, https://www.carbonbrief.org/guest-post-why-does-the-arctic-warm-faster-than-the-rest-of-the-planet<br> Lizenz: CC BY-NC-ND https://creativecommons.org/licens… | 1 |
| 17:20, 20. Feb. 2022 | Arctic warming water vapour.jpg (Datei) |  |
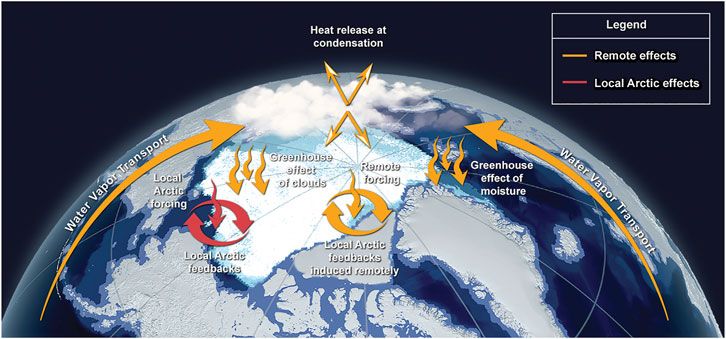
57 KB | Einfluss des Wasserdampftransports in die Arktis und lokale Effekte ==Lizenzhinweis== {| style="border:1px solid #8888aa; background-color:#f7f8ff;padding:5px;font-size:95%;" | Quelle: Taylor PC, Boeke RC, Boisvert LN, Feldl N, Henry M, Huang Y, Langen PL, Liu W, Pithan F, Sejas SA and Tan I (2022) Process Drivers, Inter-Model Spread, and the Path Forward: A Review of Amplified Arctic Warming. Front. Earth Sci. 9:758361. doi: 10.3389/feart.2021.758361<br> Lizenz: CC BY http://creativecommons.o… | 1 |
| 10:48, 27. Jan. 2022 | Heat mortality Paris London.jpg (Datei) |  |
92 KB | == Beschreibung == Hitze bedingte Sterbefälle pro 100.000 Einwohner in London und Paris im Sommer 2003 (dicke Linie) und für jedes Jahr 1993-2003 (dünne Linien). == Lizenzhinweis == {| style="border:1px solid #8888aa; background-color:#f7f8ff;padding:5px;font-size:95%;" | Quelle: Mitchell, D., C. Heaviside, S. Vardoulakis et al. (2016): Attributing human mortality during extreme heatwaves to anthropogenic climate change, Environmental Research Letters, doi:10.1088/1748-9326/11/7/074006<br> Li… | 1 |
| 10:42, 27. Jan. 2022 | Extremes attribution cc.jpg (Datei) |  |
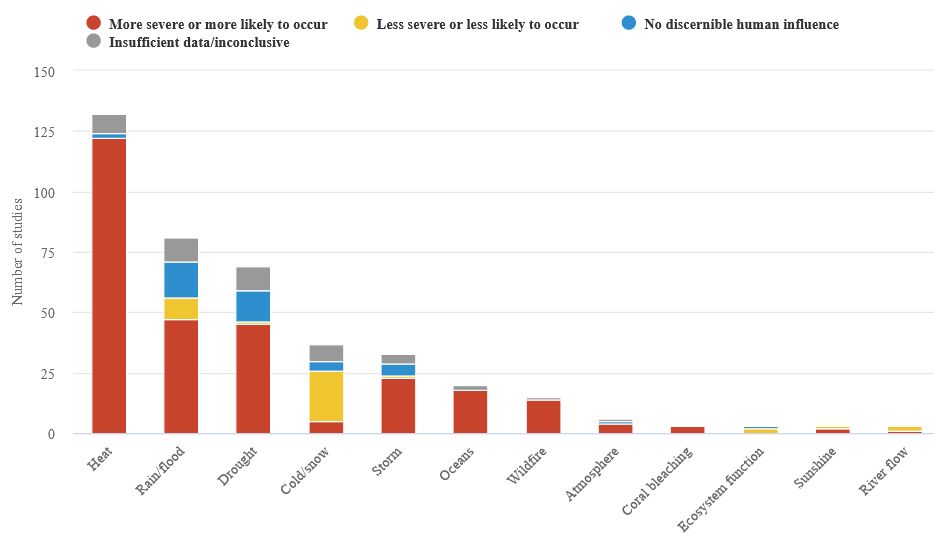
32 KB | Der menschliche Einfluss durch den Klimawandel auf unterschiedliche Extremwetterereignisse. Rot zeigt, dass das untersuchte Extremereignis durch den Klimawandel stärker ausgefallen ist oder sich mit höherer Wahrscheinlich ereignet hat, gelb zeigt einen weniger starken Effekt bzw. selteneres Vorkommen, blau keinen erkennbaren Einfluss und grau eine ungenügende Datenlage. == Lizenzhinweis == {| style="border:1px solid #8888aa; background-color:#f7f8ff;padding:5px;font-size:95%;" | Quelle: Carbo… | 1 |
| 10:46, 19. Jan. 2022 | W-Afrika-Landbedeckung.jpg (Datei) |  |
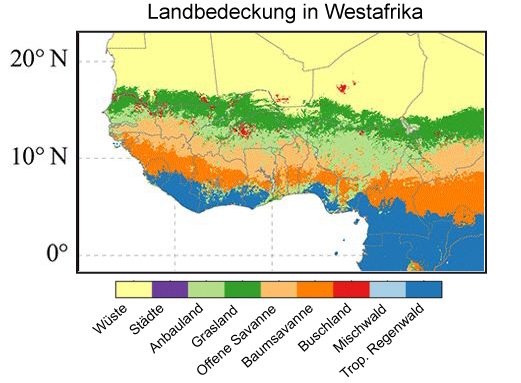
122 KB | == Beschreibung == Landbedeckung in W-Afrika, verändert und übersetzt == Lizenzhinweis == {| style="border:1px solid #8888aa; background-color:#f7f8ff;padding:5px;font-size:95%;" | Quelle: van Wees, D., und G.R. van der Werf (2019): [https://doi.org/10.5194/gmd-12-4681-2019 Modelling biomass burning emissions and the effect of spatial resolution: a case study for Africa based on the Global Fire Emissions Database (GFED)], Geosci. Model Dev., 12, 4681–4703<br> Lizenz: [http://creativecommons.org… | 2 |
| 12:15, 16. Jan. 2022 | CO2-kreislauf.jpg (Datei) |  |
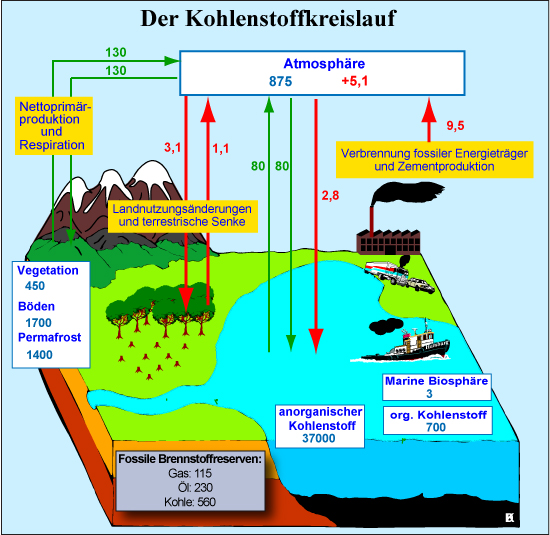
211 KB | Die Abb. zeigt den Kohlenstoffaustausch zwischen Atmosphäre, Landvegetation und Ozean in GtC pro Jahr sowie die Reservoire in GtC (Gigatonnen = Milliarden t; 1 t C entspricht 3,67 t CO<sub>2</sub>). Die grünen Pfeile und Werte zeigen die natürlichen Austausche und die blauen Werte (in den weißen Kästchen) die natürlichen Reservoire vor 1750. Die roten Pfeile und Werte zeigen die jährlichen anthropogenen Flüsse und der rote Wert in dem Reservoir Atmosphäre die jährliche Kohlentoffzunahme in den… | 4 |
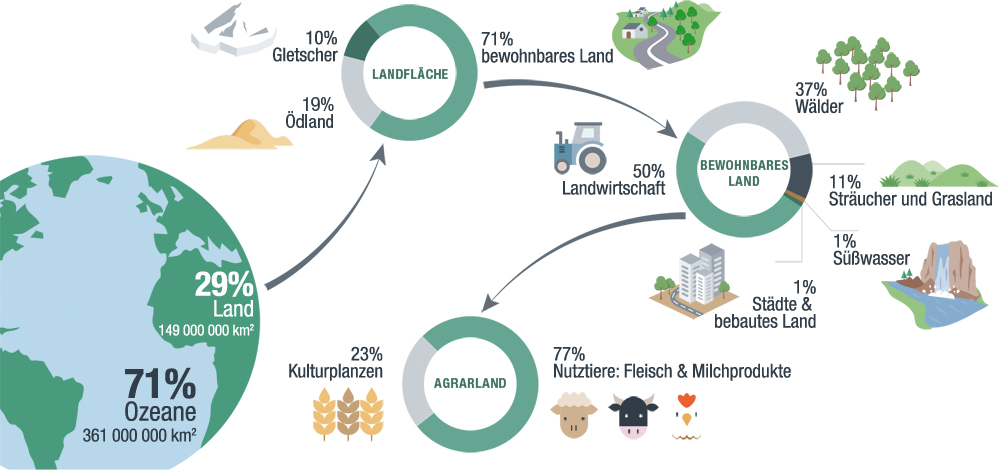
| 21:06, 13. Jan. 2022 | Landnutzung-2015.jpg (Datei) |  |
241 KB | == Beschreibung == Landnutzungsformen und ihre Flächenanteile 2015 ==Lizenzhinweis== {| style="border:1px solid #8888aa; background-color:#f7f8ff;padding:5px;font-size:95%;" | Quelle: Office for Climate Education (2021): IPCC-Sonderbericht „Klimawandel und Landsysteme“ – Zusammenfassung für Lehrende, https://www.sonnentaler.net/dokumentation/ipcc-berichte/sr-klimawandel-landnutzung/ <br> Lizenz: CC BY-NC-SA |} | 1 |
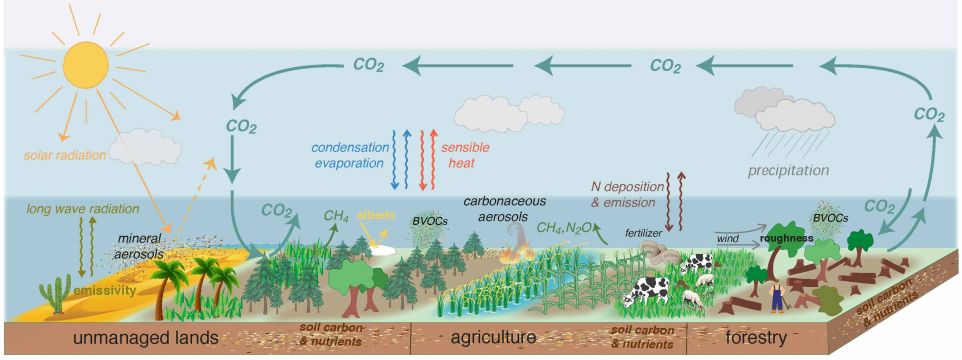
| 20:19, 13. Jan. 2022 | Landcover atmosphere interaction sm.jpg (Datei) |  |
55 KB | Wechselwirkungen zwischen Landbedeckungen und Atmosphäre ==Lizenzhinweis== {| style="border:1px solid #8888aa; background-color:#f7f8ff;padding:5px;font-size:95%;" | Quelle: IPCC (2019): Land-climate interactions. In: Climate Change and Land, Box 2.1, Figure 1, https://www.ipcc.ch/srccl/<br> Lizenz: [https://www.ipcc.ch/copyright IPCC-Copyright]: Reproduction of limited number of figures or short excerpts of IPCC material is authorized free of charge and without formal written permission pro… | 1 |
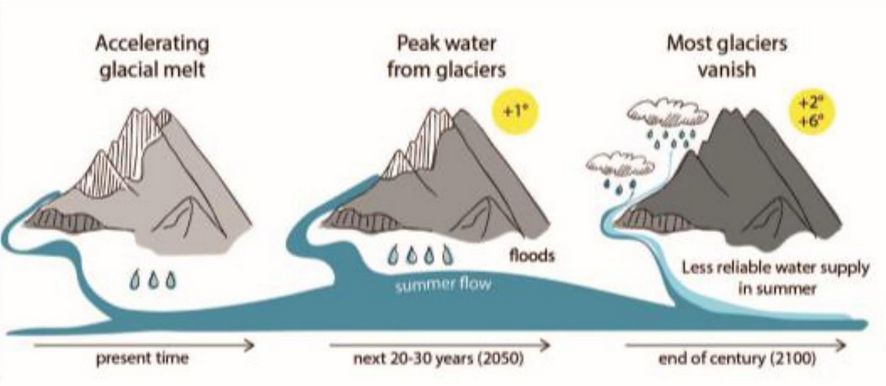
| 20:48, 9. Jan. 2022 | Glacier melt runoff.jpg (Datei) |  |
36 KB | == Beschreibung == Gletscherschmelze und Abfluss in Mittelasien ==Lizenzhinweis== {| style="border:1px solid #8888aa; background-color:#f7f8ff;padding:5px;font-size:95%;" | Quelle: M. Barandun, J. Fiddes, M. Scherler, T. Mathys, T. Saks, D. Petrakov, M. Hoelzle (2020): The state and future of the cryosphere in Central Asia, Water Secur., 11 (2020), Article 100072, 10.1016/j.wasec.2020.100072<br> Lizenz: [https://creativecommons.org/licenses/ CC-BY-NC-ND] |} | 1 |
| 20:43, 9. Jan. 2022 | Central Asia mountains.ai.jpg (Datei) |  |
84 KB | Gebirgsregionen in Mittelasien ==Lizenzhinweis== {| style="border:1px solid #8888aa; background-color:#f7f8ff;padding:5px;font-size:95%;" | Quelle: M. Barandun, J. Fiddes, M. Scherler, T. Mathys, T. Saks, D. Petrakov, M. Hoelzle (2020): The state and future of the cryosphere in Central Asia, Water Secur., 11 (2020), Article 100072, 10.1016/j.wasec.2020.100072<br> Lizenz: Creative Commons CC-BY-NC-ND https://creativecommons.org/licenses/ |} | 1 |
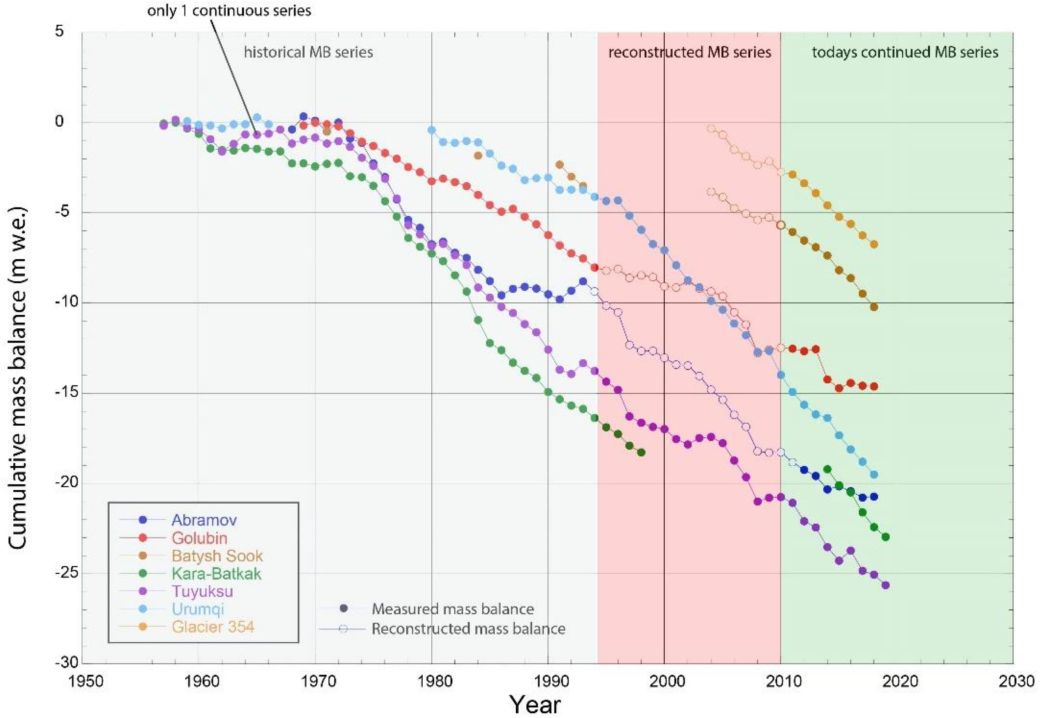
| 20:28, 9. Jan. 2022 | Tien Shan Pamir glaciers MB.jpg (Datei) |  |
66 KB | == Beschreibung == Zeitserien der kumulativen Änderung der Massenbilanz von einzelnen Gletschern in Mittelasien in m Wasseräquivalent (Abramov: Pamir; alle anderen Gletscher: Tien Shan) ==Lizenzhinweis== {| style="border:1px solid #8888aa; background-color:#f7f8ff;padding:5px;font-size:95%;" | Quelle: Barandun, M., J. Fiddes, M. Scherler, T. Mathys, T. Saks, D. Petrakov, M. Hoelzle (2020): The state and future of the cryosphere in Central Asia, Water Secur., 11, Article 100072, 10.1016/j.wasec.… | 1 |
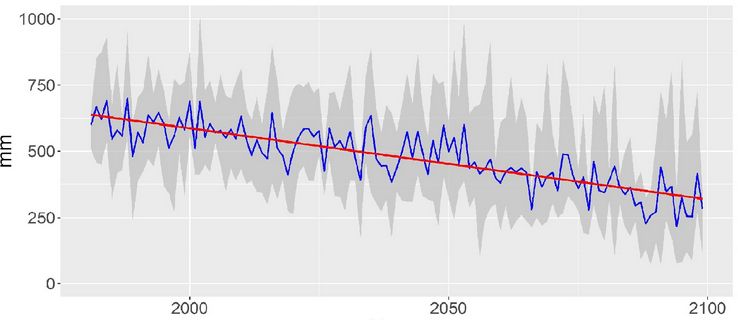
| 20:25, 9. Jan. 2022 | CentralAsia snowmelt 1980-2100.jpg (Datei) |  |
28 KB | == Beschreibung == Abnahme der Schneedicke im westlichen Tien Shan 1981-2100 nach Modellberechnungen mit dem hohen Szenario RCP8.5. ==Lizenzhinweis== {| style="border:1px solid #8888aa; background-color:#f7f8ff;padding:5px;font-size:95%;" | Quelle: Didovets, I., A. Lobanova, V. Krysanova et al. (2021): Central Asian rivers under climate change: Impacts assessment in eight representative catchments, Journal of Hydrology: Regional Studies 34, https://doi.org/10.1016/j.ejrh.2021.100779 <br> Lize… | 1 |
| 20:18, 9. Jan. 2022 | Tien-Shan-Wasserspeicher-2003-2013.jpg (Datei) |  |
233 KB | == Beschreibung == Änderung des vor allem in Eis und Schnee gespeicherten Wassers im Tien Shan zwischen 2003 bis 2014 in mm/Jahr. ==Lizenzhinweis== {| style="border:1px solid #8888aa; background-color:#f7f8ff;padding:5px;font-size:95%;" | Quelle: Chen, Y., L. Weihong, H. Deng et al. (2016): Changes in Central Asia’s Water Tower: Past, Present and Future. Scientific Reports 6, 35458; doi: 10.1038/srep35458<br> Lizenz: CC BY http://creativecommons.org/licenses/by/4.0/ |} | 1 |
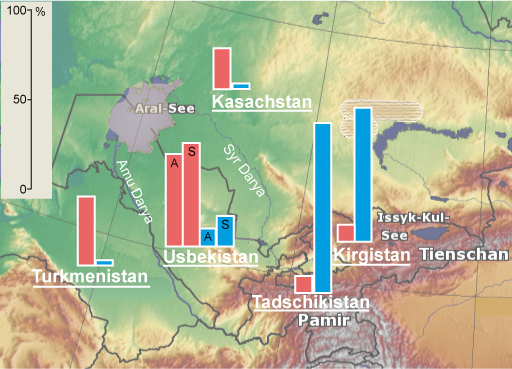
| 20:13, 9. Jan. 2022 | CA-wasserprod.-verbrauch.jpg (Datei) |  |
168 KB | Das Missverhältnis zwischen Produktion und Verbrauch von Wasser zwischen den Staaten Mittelasiens. Dargestellt sind die Anteile am Wasser der Flusseinzugsgebiete des Amu Darya (Turkmenistan, Usbekistan, Tadschikistan) und Syr Darya (Kasachstan, Usbekistan, Kirgistan) in %. Beim Aralsee sind die restlichen Wasserflächen nach einer NASA-Aufnahme vom August 2021 sowie die frühere Ausdehnung gezeigt. ==Lizenzhinweis== {| style="border:1px solid #8888aa; background-color:#f7f8ff;padding:5px;font-si… | 1 |
| 19:43, 5. Jan. 2022 | Eu soil moisture summer-2019.jpg (Datei) |  |
37 KB | == Beschreibung == Bodenfeuchte in den oberen 7 cm im August 2019 == Lizenzhinweis == {| style="border:1px solid #8888aa; background-color:#f7f8ff;padding:5px;font-size:95%;" |Quelle: Copernicus Climate Change (2020): Precipitation, relative humidity and soil moisture for August 2019, https://climate.copernicus.eu/precipitation-relative-humidity-and-soil-moisture-august-2019<br> Lizenz: Reproduction of the publically available content of this website is authorised, provided the source is acknow… | 1 |
| 17:00, 3. Jan. 2022 | Central EU drought area 1850-2100.jpg (Datei) |  |
85 KB | == Beschreibung == : Änderung der Dürrefläche 1850 bis 2100 in Mitteleuropa. HistNat: historische durch natürliche Ursachen bedingt; Hist: historisch alle Ursachen; RCP2.6, 4.5, 8.5: Projektionen nach einem unteren, mittleren und hohen Szenario. Eingefügt: Anzahl von Zweijahres-Dürren in verschiedenen Zeitabschnitten. == Lizenzhinweis == {| style="border:1px solid #8888aa; background-color:#f7f8ff;padding:5px;font-size:95%;" |Quelle: Hari, V., O. Rakovec, Y. Markonis et al. (2020): Increased fu… | 1 |
| 16:46, 3. Jan. 2022 | Carbon storage vegetation 2018.jpg (Datei) |  |
85 KB | == Beschreibung == Auswirkungen klimatischer Verhältnisse im Frühjahr 2018 auf die Kohlenstoffaufnahme durch die Vegetation im Sommer in gr. Kohlenstoff pro m<sup>2</sup> und Monat (gC/m<sup>2</sup>/Monat). == Lizenzhinweis == {| style="border:1px solid #8888aa; background-color:#f7f8ff;padding:5px;font-size:95%;" |Quelle: Bastos, A., P. Ciais, P. Friedlingstein, S. Sitch, J. Pongratz, L. Fan et al. (2020): [https://doi.org/10.1126/sciadv.aba2724 Direct and seasonal legacy effects of the 2018… | 2 |
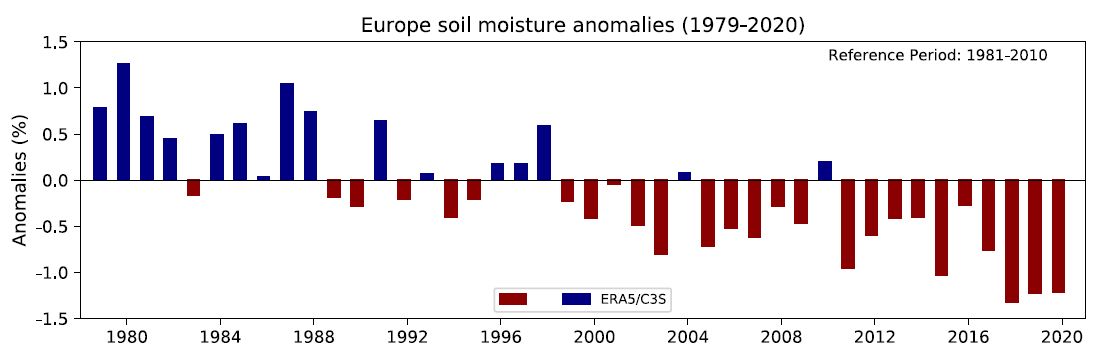
| 16:25, 3. Jan. 2022 | Eu soil moisture 1979-2020.jpg (Datei) |  |
38 KB | == Beschreibung == Jährliche Abweichung der Bodenfeuchte in Europa vom Mittel 1981-2010 in %. == Lizenzhinweis == {| style="border:1px solid #8888aa; background-color:#f7f8ff;padding:5px;font-size:95%;" |Quelle: Copernicus Climate Change (2021): European state of the climate 2020, Soil Moisture, https://climate.copernicus.eu/esotc/2020/soil-moisture<br> Lizenz: [https://climate.copernicus.eu/disclaimer-and-privacy Reproduction of the publically available content of this website is authorised, p… | 1 |
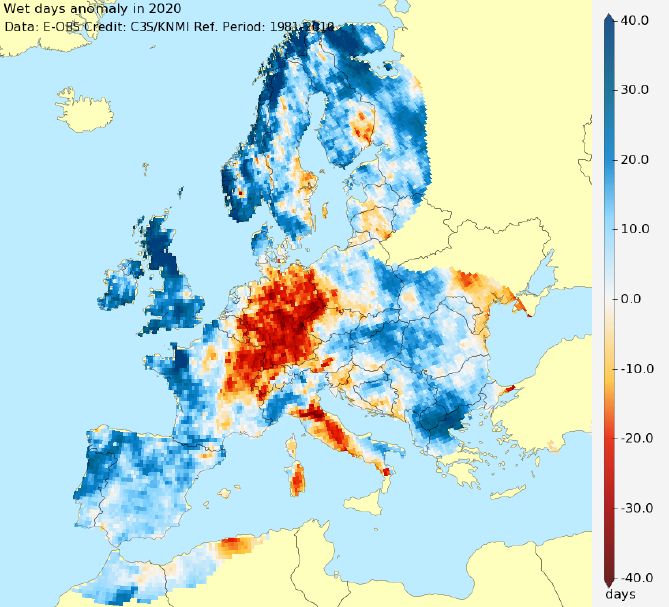
| 16:18, 3. Jan. 2022 | Eu wet days 2020.jpg (Datei) |  |
74 KB | == Beschreibung == Anzahl der feuchten Tage (ab 1mm Niederschlag/Tag) 2020 im Vergleich zum Mittel 1981-2010 == Lizenzhinweis == {| style="border:1px solid #8888aa; background-color:#f7f8ff;padding:5px;font-size:95%;" |Quelle: Copernicus Climate Change (2021): European state of the climate 2020, Precipitation, https://climate.copernicus.eu/esotc/2020/precipitations <br> Lizenz: Reproduction of the publically available content of this website is authorised, provided the source is acknowledged, s… | 1 |
| 14:55, 3. Jan. 2022 | Deutschland Dürre Aug.2018-2019.jpg (Datei) |  |
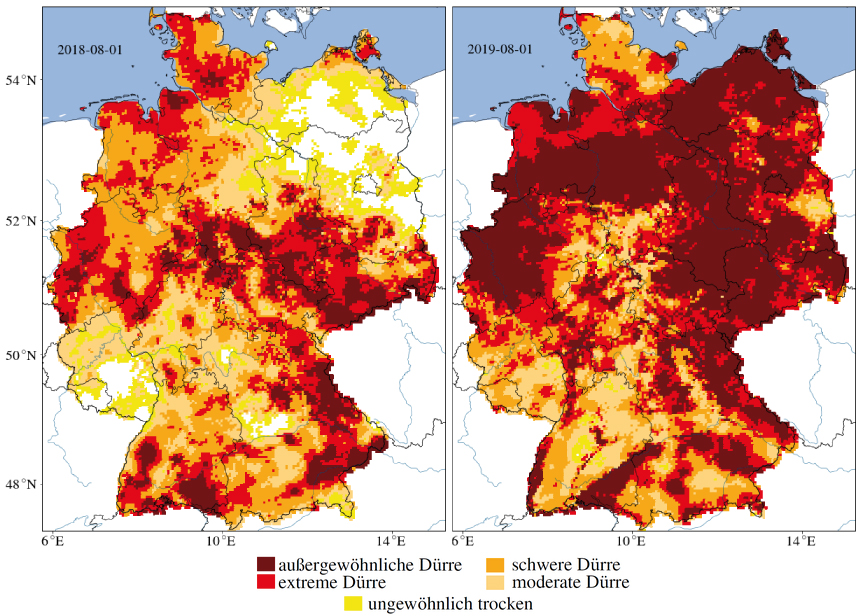
543 KB | Trockenheit des Gesamtbodens (bis 1,8 m Tiefe) im August 2018 (links) und August 2019 (rechts) in Deutschland. == Lizenzhinweis == {| style="border:1px solid #8888aa; background-color:#f7f8ff;padding:5px;font-size:95%;" |Quelle: UFZ Helmholtz Zentrum für Umweltforschung: Dürremonitor Deutschland https://www.ufz.de/index.php?de=37937<br> Lizenz: „Die Grafiken können im Rahmen von Wissenschaft und Forschung sowie für redaktionelle Zwecke unter Angabe des folgenden Vermerks unentgeltlich genutzt w… | 1 |
| 17:42, 28. Dez. 2021 | Soil salinization Afghanistan.jpg (Datei) |  |
227 KB | == Beschreibung == Bodenversalzung durch Salzausblühungen auf einem bewässerten Feld in Afghanistan. == Lizenzhinweis == {| style="border:1px solid #8888aa; background-color:#f7f8ff;padding:5px;font-size:95%;" | Quelle: FAO (2020): State of knowledge of soil biodiversity – Status, challenges and potentialities, http://www.fao.org/3/cb1928en/CB1928EN.pdf https://doi.org/10.4060/cb1928en <br> Lizenz: [https://creativecommons.org/licenses/by-nc-sa CC BY-NC-SA] |} | 1 |
| 12:38, 28. Dez. 2021 | Düngung-N-P.jpg (Datei) |  |
173 KB | == Beschreibung == Düngung durch Stickstoff (N) und Phosphate (P) == Lizenzhinweis == {| style="border:1px solid #8888aa; background-color:#f7f8ff;padding:5px;font-size:95%;" | Quelle: Cavicchioli R., Ripple W. J., Timmis K. N., Azam F., Bakken L. R., Baylis M., et al. (2019). Scientists’ warning to humanity: microorganisms and climate change. Nat. Rev. Microbiol. 17 569–586. 10.1038/s41579-019-0222-5 <br> Lizenz: [http://creativecommons.org/licenses/by/4.0/ CC BY] |} | 1 |
| 11:58, 28. Dez. 2021 | Humans effect miroorganisms.jpg (Datei) |  |
190 KB | == Beschreibung == Menschliche Aktivitäten beeinflussen Mikroorganismen == Lizenzhinweis == {| style="border:1px solid #8888aa; background-color:#f7f8ff;padding:5px;font-size:95%;" | Quelle: Cavicchioli R., Ripple W. J., Timmis K. N., Azam F., Bakken L. R., Baylis M., et al. (2019). Scientists’ warning to humanity: microorganisms and climate change. Nat. Rev. Microbiol. 17 569–586. 10.1038/s41579-019-0222-5 <br> Lizenz: CC BY http://creativecommons.org/licenses/by/4.0/ |} | 1 |
| 11:53, 28. Dez. 2021 | Drivers-soil-alteration.jpg (Datei) |  |
333 KB | == Beschreibung == Ursachen von Boden-Degradation == Lizenzhinweis == {| style="border:1px solid #8888aa; background-color:#f7f8ff;padding:5px;font-size:95%;" | Quelle: FAO (2020): [https://doi.org/10.4060/cb1928en State of knowledge of soil biodiversity - Status, challenges and potentialities], Figure 3.4.4.1 <br> Lizenz: [https://creativecommons.org/licenses/by-nc-sa/3.0/igo/legalcode CC BY-NC-SA] |} | 1 |
| 10:25, 28. Dez. 2021 | Soil-CO2.jpg (Datei) |  |
168 KB | == Beschreibung == Boden und Kohlendioxid == Lizenzhinweis == {| style="border:1px solid #8888aa; background-color:#f7f8ff;padding:5px;font-size:95%;" | Quelle: FAO (2015): Status of the World’s Soil Resources <br> Lizenz: 2material may be copied, downloaded and printed for private study, research and teaching purposes, or for use in non-commercial products or services, provided that appropriate acknowledgement of FAO as the source and copyright holder is given" |} | 1 |
| 17:45, 26. Dez. 2021 | Aboveground soils gases.jpg (Datei) |  |
135 KB | == Beschreibung == Bodenfunktionen, übersetzt == Lizenzhinweis == {| style="border:1px solid #8888aa; background-color:#f7f8ff;padding:5px;font-size:95%;" | Quelle: FAO (2015): [https://www.fao.org/resources/infographics/infographics-details/en/c/284478/ Soil funtions]<br> Lizenz: material may be copied, downloaded and printed for private study, research and teaching purposes, or for use in non-commercial products or services, provided that appropriate acknowledgement of FAO as the source and c… | 1 |
| 16:36, 26. Dez. 2021 | Bodenfunktionen FAO-dt.jpg (Datei) |  |
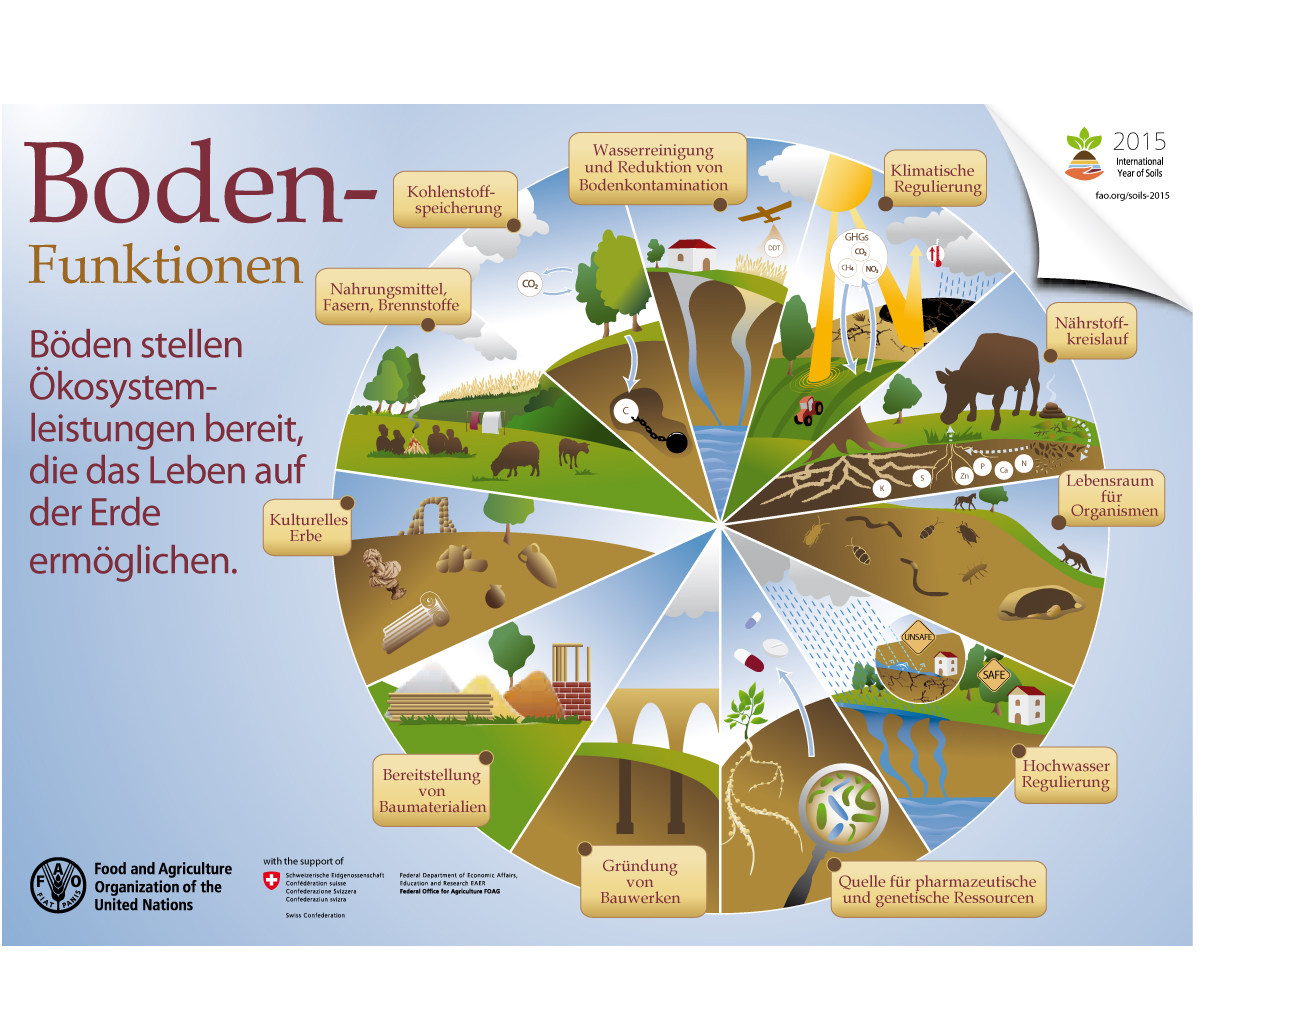
653 KB | Bodenfunktionen, übersetzt == Lizenzhinweis == {| style="border:1px solid #8888aa; background-color:#f7f8ff;padding:5px;font-size:95%;" | Quelle: FAO (2015): Soil funtions, https://www.fao.org/resources/infographics/infographics-details/en/c/284478/<br> Lizenz: material may be copied, downloaded and printed for private study, research and teaching purposes, or for use in non-commercial products or services, provided that appropriate acknowledgement of FAO as the source and copyright holder is g… | 1 |
| 14:39, 26. Dez. 2021 | Tundra-Verbuschung-2100.jpg (Datei) |  |
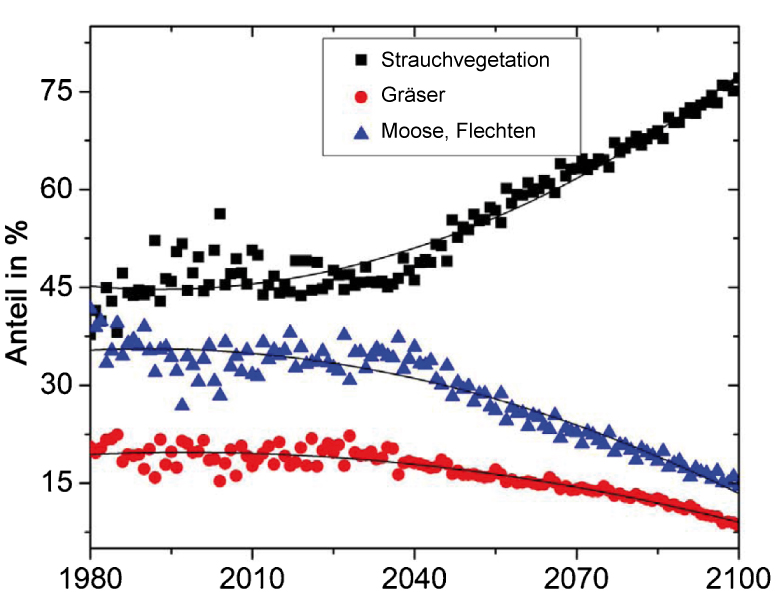
148 KB | == Beschreibung == Langfristige Veränderung des Anteils an der Netto-Primärproduktion von Strauchvegetation (sgrubs)und nicht verholzenden Pflanzen (grasartige Vegetation (Graminoids) und nicht vaskuläre Pflanzen (non-vascular)) ==Lizenzhinweis== {| style="border:1px solid #8888aa; background-color:#f7f8ff;padding:5px;font-size:95%;" | Quelle: Mekonnen, Z.A., W.J. Riley and R.F. Grant(2018): 21st century tundra shrubification could enhance net carbon uptake of North America Arctic tundra under… | 1 |
| 14:33, 26. Dez. 2021 | Hardangervidda 1986.jpg (Datei) |  |
148 KB | == Beschreibung == Hardangervidda (Norwegen) im August. Tundra im Vordergrund, im Hintergrund ein Gletscher ==Lizenzhinweis== {| style="border:1px solid #8888aa; background-color:#f7f8ff;padding:5px;font-size:95%;" | Quelle: Wikimedia Commons (1986): Wikimedia Commons (1986): Hardangervidda, Autor: https://en.wikipedia.org/wiki/de:User:Axel_Hindemith<br /> Lizenz: Gemeinfrei |} | 1 |
| 14:24, 26. Dez. 2021 | Soil–plant–atmosphere-interactions.jpg (Datei) |  |
249 KB | == Beschreibung == Ausbreitung von Buschvegetation in der arktischen Tundra und die damit verbundenen Prozesse: Klimawandel (Temperatur, Niederschlag, CO2-Zunahme), Bodenfeuchtigkeit und Schneedynamik, Auftauen von Permafrost, Nährstoffe, Zerstörung (z.B. Feuer), Pflanzenfresser. +/- = Zunahme/Abnahme. ==Lizenzhinweis== {| style="border:1px solid #8888aa; background-color:#f7f8ff;padding:5px;font-size:95%;" | Quelle: Mekonnen, Z.A., W.J. Riley, L.T. Berner et al. (2021): Arctic tundra shrubific… | 1 |
| 16:56, 15. Dez. 2021 | Eu-precipitation-anomalies2018-19.jpg (Datei) |  |
334 KB | == Beschreibung == Abweichungen der sommerlichen Niederschläge in % vom Mittel 1980-2010 in den Jahren 2018 (links) und 2019 (rechts) == Lizenzhinweis == {| style="border:1px solid #8888aa; background-color:#f7f8ff;padding:5px;font-size:95%;" |Quelle: Hari, V., O. Rakovec, Y. Markonis et al. (2020): Increased future occurrences of the exceptional 2018–2019 Central European drought under global warming. Sci Rep 10, 12207 https://doi.org/10.1038/s41598-020-68872-9<br> Lizenz: CC BY http://creati… | 1 |
| 16:50, 15. Dez. 2021 | Drought summer 2018.jpg (Datei) |  |
83 KB | Räumliche Verteilung der Bodenfeuchte im Sommer 2018. Blau = hohe, rot = niedrige Bodenfeuchte, ausgedrückt durch einen Indexwert: unter -2,0 = extreme Dürre, -2,0 bis 1,5 = starke Dürre. == Lizenzhinweis == {| style="border:1px solid #8888aa; background-color:#f7f8ff;padding:5px;font-size:95%;" |Quelle: : Bastos, A., Ciais, P., Friedlingstein, P., Sitch, S., Pongratz, J., Fan, L., et al. (2020): Direct and seasonal legacy effects of the 2018 heat wave and drought on European ecosystem producti… | 1 |
| 16:49, 7. Dez. 2021 | Global-temp-decades.jpg (Datei) |  |
45 KB | == Beschreibung == Änderung der globalen Mitteltemperatur 1850-2020: Jahresmittel, gleitende 10-Jahresmittel und Dekaden-Mittel. ==Lizenzhinweis== {| style="border:1px solid #8888aa; background-color:#f7f8ff;padding:5px;font-size:95%;" | Quelle: Climatic Research Unit (University of East Anglia) and Met Office: Temperature https://crudata.uea.ac.uk/cru/data/temperature/ <br> Lizenz: Open Government Licence http://www.nationalarchives.gov.uk/doc/open-government-licence/version/3/ |} | 1 |
| 20:22, 30. Nov. 2021 | Stratospere temp1979-2018.jpg (Datei) | 84 KB | Temperaturveränderung in der Stratosphäre in 20-40 km Höhe 1979-2018 im Verhältnis zur Periode 1980-2018. Die gepunkteten Linien und die eingefügte Box oben rechts geben die Trends für die gesamte Periode und für die Zeiträume 1979–97 and 1998–2018 (von links nach rechts in der Box) in K/Jahrzehnt an. ==Lizenzhinweis== {| style="border:1px solid #8888aa; background-color:#f7f8ff;padding:5px;font-size:95%;" | Quelle: Steiner, A. K., and Coauthors, 2020: Observed Temperature Changes in the Tropos… | 1 | |
| 11:51, 30. Nov. 2021 | Stratospheric temp 1970-2020.jpg (Datei) |  |
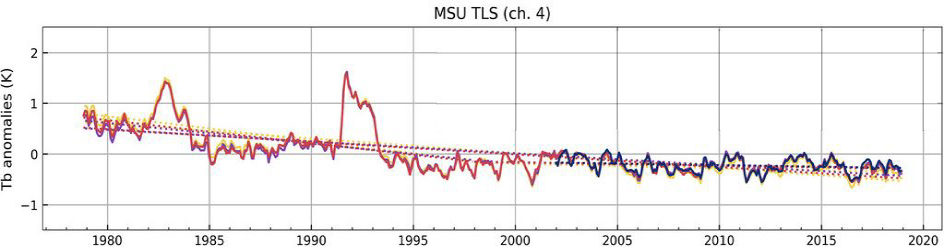
47 KB | Änderung der Jahresmitteltemperatur 1979-2020 in der unteren Stratosphäre nach drei Datensätzen ==Lizenzhinweis== {| style="border:1px solid #8888aa; background-color:#f7f8ff;padding:5px;font-size:95%;" | Quelle: NOAA National Centers for Environmental Information: [https://www.ncdc.noaa.gov/temp-and-precip/msu/time-series/global/ls/ann/12 Microwave Sounding Unit Temperature Anomalies], geplottet <br> Lizenz: public domain |} | 1 |
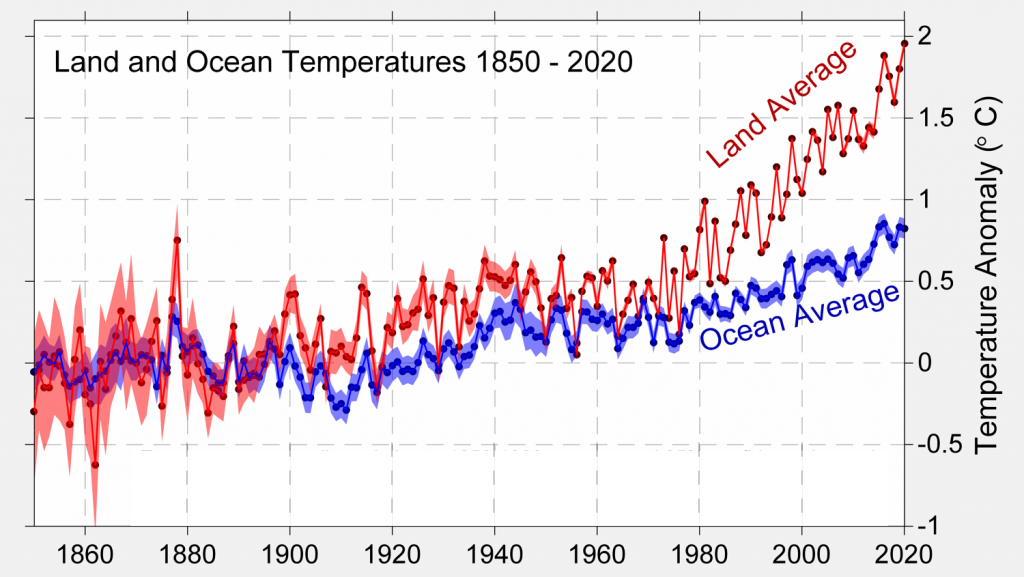
| 20:29, 29. Nov. 2021 | Land Ocean temp1850-2020.jpg (Datei) |  |
275 KB | Globale Jahresmitteltemperaturen 1850-2020 über dem Land und über dem Ozean, relativ zum Mittel 1850-1900 ==Lizenzhinweis== {| style="border:1px solid #8888aa; background-color:#f7f8ff;padding:5px;font-size:95%;" | Quelle: Berkeley Earth (2021): [http://berkeleyearth.org/global-temperature-report-for-2020/ Global Temperature for 2020]<br> Lizenz: [https://creativecommons.org/licenses/by/4.0/ CC BY] |} | 1 |
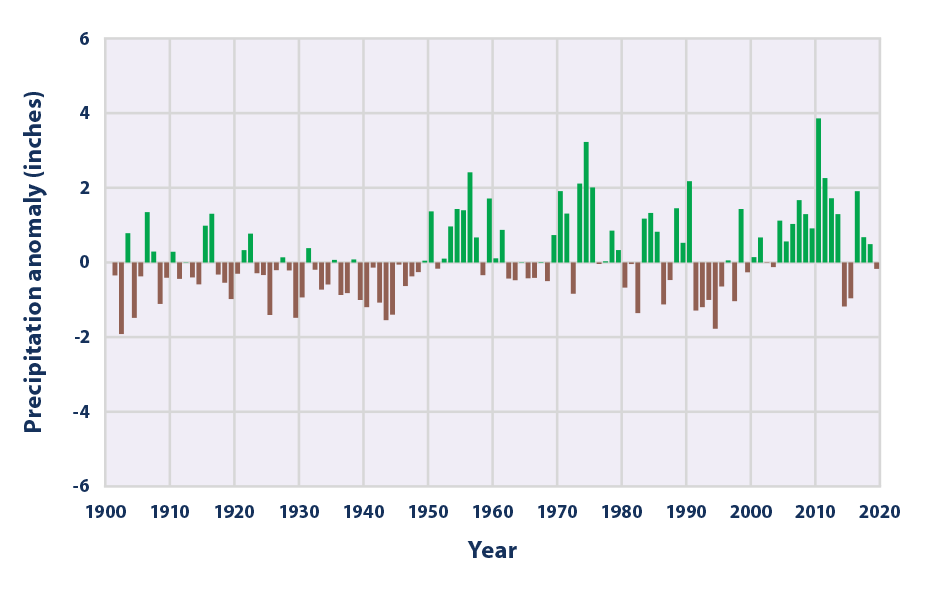
| 17:06, 28. Nov. 2021 | Precipitation global1900-2020.png (Datei) |  |
22 KB | Änderung der globalen jährlichen Niederschläge 1900 bis 2019 im Vergleich zum Mittel 1901-2000. ==Lizenzhinweis== {| style="border:1px solid #8888aa; background-color:#f7f8ff;padding:5px;font-size:95%;" | Quelle: EPA (United States Environmental Protection Agency): [https://www.epa.gov/climate-indicators/climate-change-indicators-us-and-global-precipitation#ref2 Climate Change Indicators: U.S. and Global Precipitation]<br> Lizenz: public domain |} | 1 |
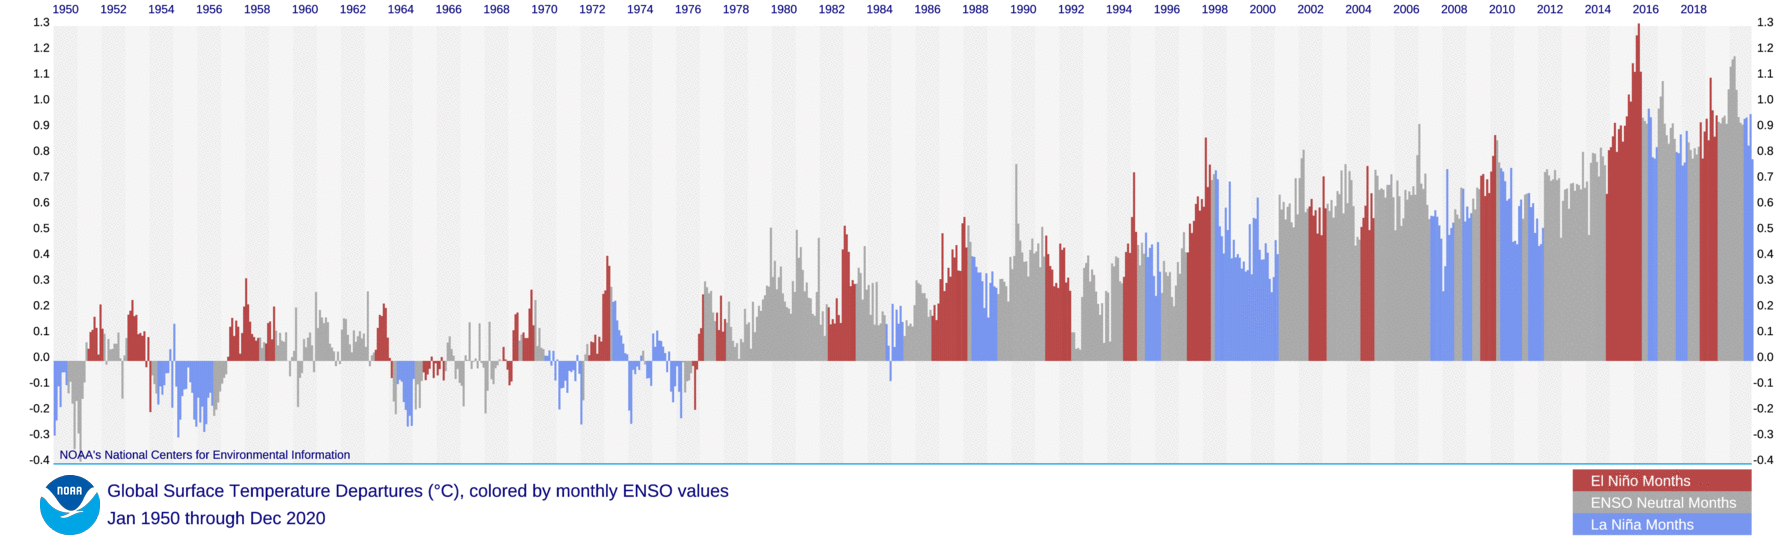
| 10:04, 28. Nov. 2021 | ENSO global temp 2020.png (Datei) |  |
511 KB | Globale Temperaturen und ENSO. Globale Monatsmitteltemperaturen und El-Niño- und La-Niña-Jahre 1980-2018 ==Lizenzhinweis== {| style="border:1px solid #8888aa; background-color:#f7f8ff;padding:5px;font-size:95%;" | Quelle: NOAA National Centers for Environmental Information, State of the Climate: Global Climate Report - Annual 2020 (2021): Monthly temperature anomalies versus El Niño, https://www.ncdc.noaa.gov/sotc/global/202013/supplemental/page-2<br> Lizenz: public domain |} | 1 |
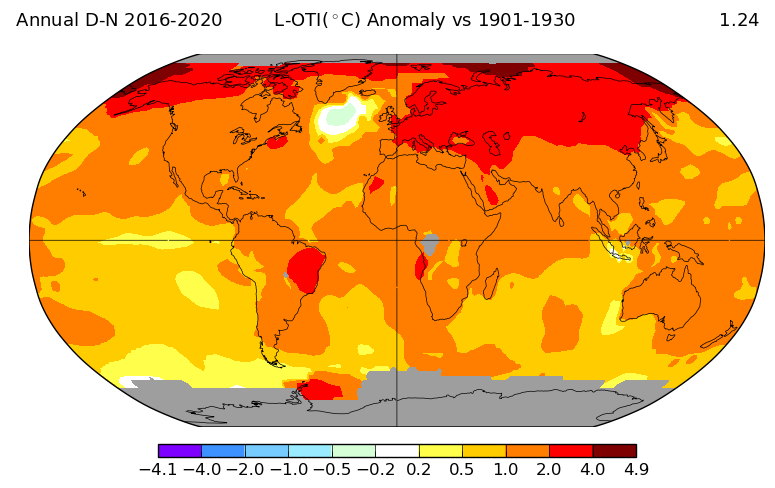
| 15:05, 27. Nov. 2021 | 2016-2020 global temp diff.png (Datei) |  |
82 KB | Temperaturdifferenz 2016-2020 im Vergleich zum Beginn des 20. Jahrhunderts (1901-1930) ==Lizenzhinweis== {| style="border:1px solid #8888aa; background-color:#f7f8ff;padding:5px;font-size:95%;" | Quelle: NASA (2021): GISS Surface Temperature Analysis (v4), https://data.giss.nasa.gov/gistemp/maps/ Lizenz: public domain |} | 1 |
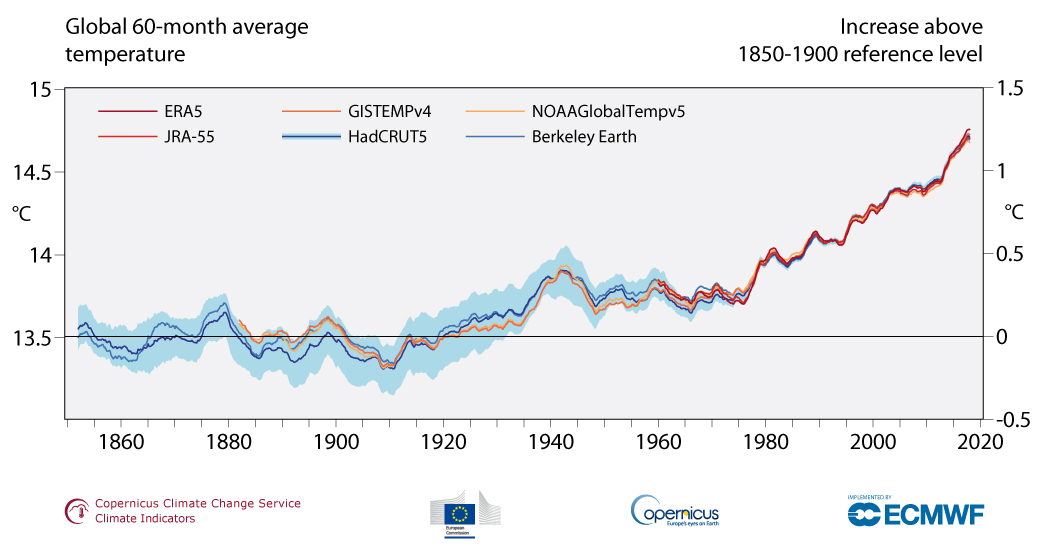
| 13:45, 27. Nov. 2021 | CCC global temp1850-2020.jpg (Datei) |  |
151 KB | == Beschreibung == Änderung der globalen 5-Jahresmitteltemperatur 1850-2020 absolut und im Vergleich zu 1850-1900 nach 6 Datensätzen. ==Lizenzhinweis== {| style="border:1px solid #8888aa; background-color:#f7f8ff;padding:5px;font-size:95%;" | Quelle: Copernicus Climate Change(2021): Globe in 2020, https://climate.copernicus.eu/climate-indicators/temperature<br> Lizenz: [https://climate.copernicus.eu/data-protection-and-privacy-statement Reproduction of the publicly available content of this… | 1 |
