Von Dieter Kasang hochgeladene Dateien
Aus Klimawandel
Diese Spezialseite listet alle hochgeladenen Dateien auf.
| Datum | Name | Vorschaubild | Größe | Beschreibung | Versionen |
|---|---|---|---|---|---|
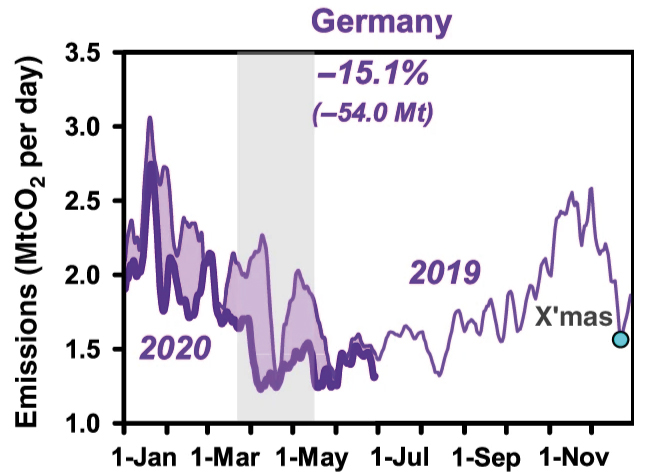
| 11:12, 17. Okt. 2020 | GermanyCO2 emissions2019 June2020.jpg (Datei) |  |
106 KB | CO<sub>2</sub>-Emissionen 2019 und Januar bis Juni 2020 in Deutschland ==Lizenzhinweis== {| style="border:1px solid #8888aa; background-color:#f7f8ff;padding:5px;font-size:95%;" | Quelle: Liu, Z., Ciais, P., Deng, Z. et al. (2020): [https://doi.org/10.… | 1 |
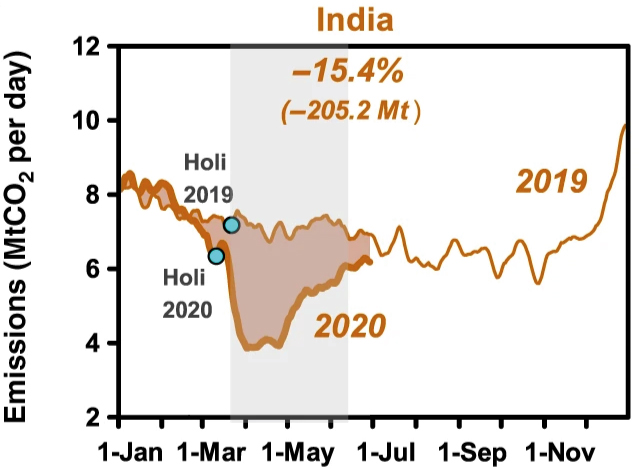
| 11:10, 17. Okt. 2020 | IndiaCO2 emissions2019 June2020.jpg (Datei) |  |
90 KB | CO<sub>2</sub>-Emissionen 2019 und Januar bis Juni 2020 in Indien ==Lizenzhinweis== {| style="border:1px solid #8888aa; background-color:#f7f8ff;padding:5px;font-size:95%;" | Quelle: Liu, Z., Ciais, P., Deng, Z. et al. (2020): [https://doi.org/10.1038/… | 1 |
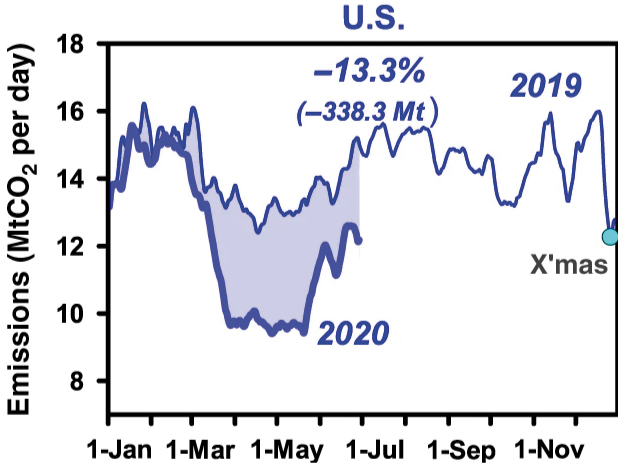
| 11:08, 17. Okt. 2020 | USA CO2 emissions2019 June2020.jpg (Datei) |  |
100 KB | CO<sub>2</sub>-Emissionen 2019 und Januar bis Juni 2020 in den USA ==Lizenzhinweis== {| style="border:1px solid #8888aa; background-color:#f7f8ff;padding:5px;font-size:95%;" | Quelle: Liu, Z., Ciais, P., Deng, Z. et al. (2020): [https://doi.org/10.1038… | 1 |
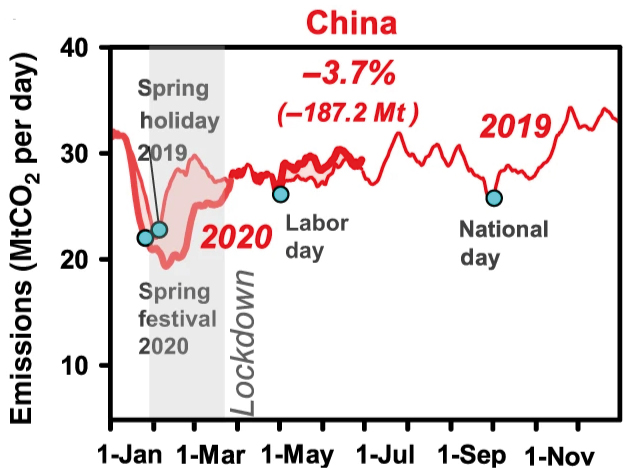
| 11:05, 17. Okt. 2020 | ChinaCO2 emissions2019 June2020.jpg (Datei) |  |
104 KB | CO2-Emissionen Januar bis Juni 2020 in China ==Lizenzhinweis== {| style="border:1px solid #8888aa; background-color:#f7f8ff;padding:5px;font-size:95%;" | Quelle: Liu, Z., Ciais, P., Deng, Z. et al. (2020): [https://doi.org/10.1038/s41467-020-18922-7 Ne… | 1 |
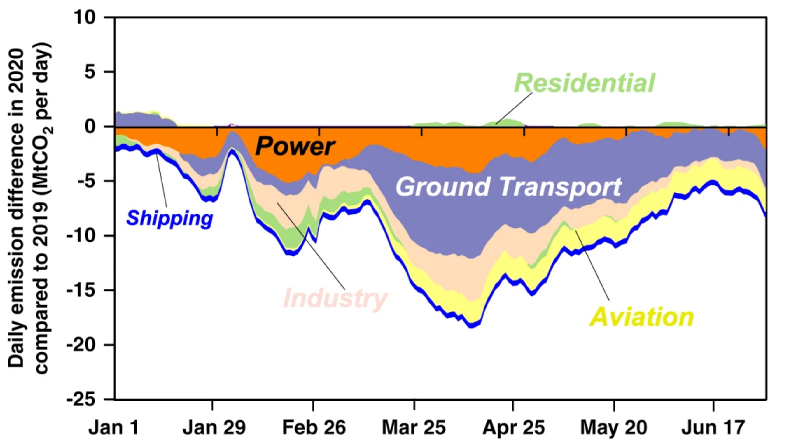
| 10:59, 17. Okt. 2020 | GlobalCO2 emissions sectors June2020.jpg (Datei) |  |
122 KB | Globale CO2-Emissionen Januar bis Juni 2020 nach Wirtschaftssektoren ==Lizenzhinweis== {| style="border:1px solid #8888aa; background-color:#f7f8ff;padding:5px;font-size:95%;" | Quelle: Liu, Z., Ciais, P., Deng, Z. et al. (2020): [https://doi.org/10.10… | 1 |
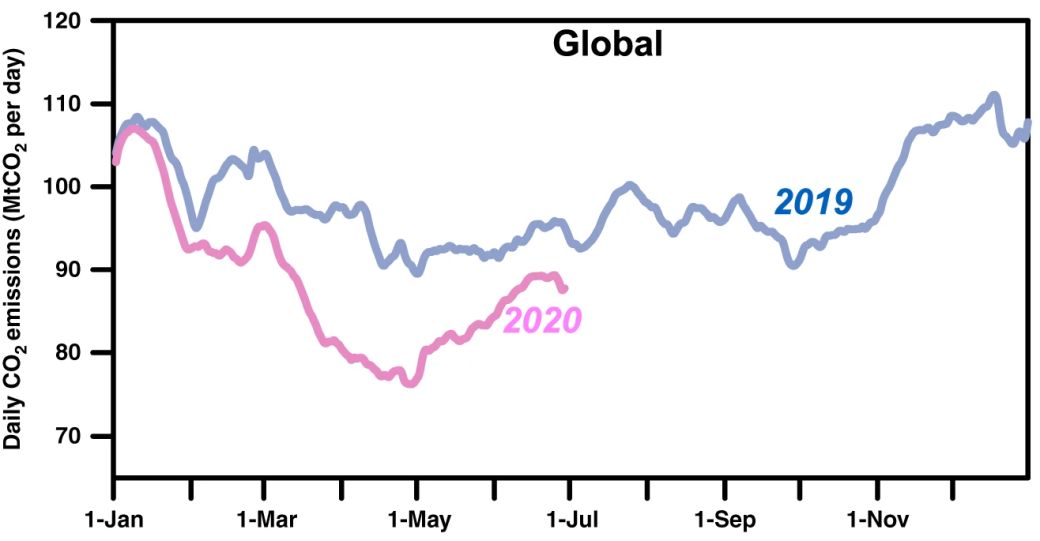
| 10:58, 17. Okt. 2020 | GlobalCO2 emissions2019 June2020a.jpg (Datei) |  |
66 KB | Globale CO<sub>2</sub>-Emissionen 2019 bis Juni 2020 ==Lizenzhinweis== {| style="border:1px solid #8888aa; background-color:#f7f8ff;padding:5px;font-size:95%;" | Quelle: Liu, Z., Ciais, P., Deng, Z. et al. (2020): [https://doi.org/10.1038/s41467-020-18… | 1 |
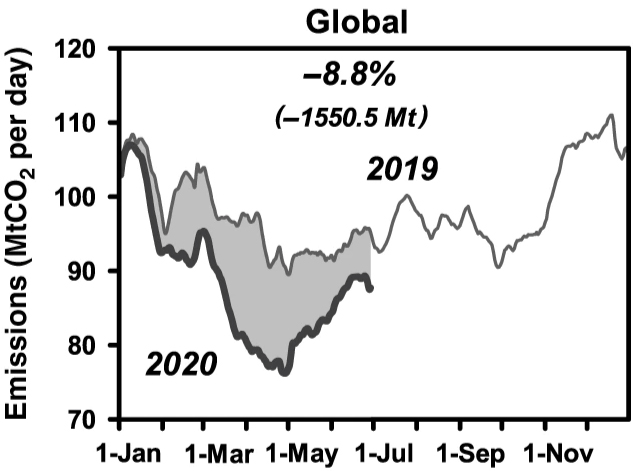
| 10:56, 17. Okt. 2020 | GlobalCO2 emissions2019 June2020.jpg (Datei) |  |
38 KB | Globale CO2-Emissionen 2019 bis Juni 2020 ==Lizenzhinweis== {| style="border:1px solid #8888aa; background-color:#f7f8ff;padding:5px;font-size:95%;" | Quelle: Liu, Z., Ciais, P., Deng, Z. et al. (2020): [https://doi.org/10.1038/s41467-020-18922-7 Near-… | 1 |
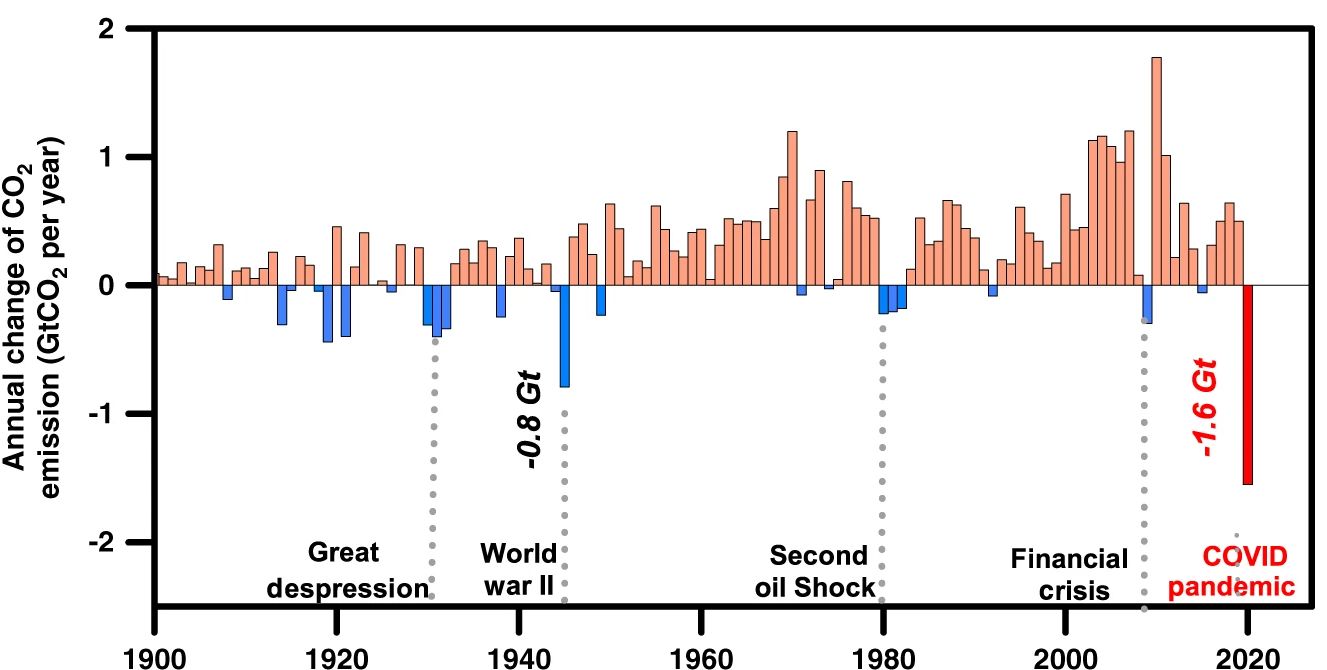
| 10:48, 17. Okt. 2020 | CO2 emissions1900-2020.jpg (Datei) |  |
75 KB | Globale CO2-Emissionen 1900 bis Juni 2020 ==Lizenzhinweis== {| style="border:1px solid #8888aa; background-color:#f7f8ff;padding:5px;font-size:95%;" | Quelle: Liu, Z., Ciais, P., Deng, Z. et al. (2020): Near-real-time monitoring of global CO2 emissions… | 1 |
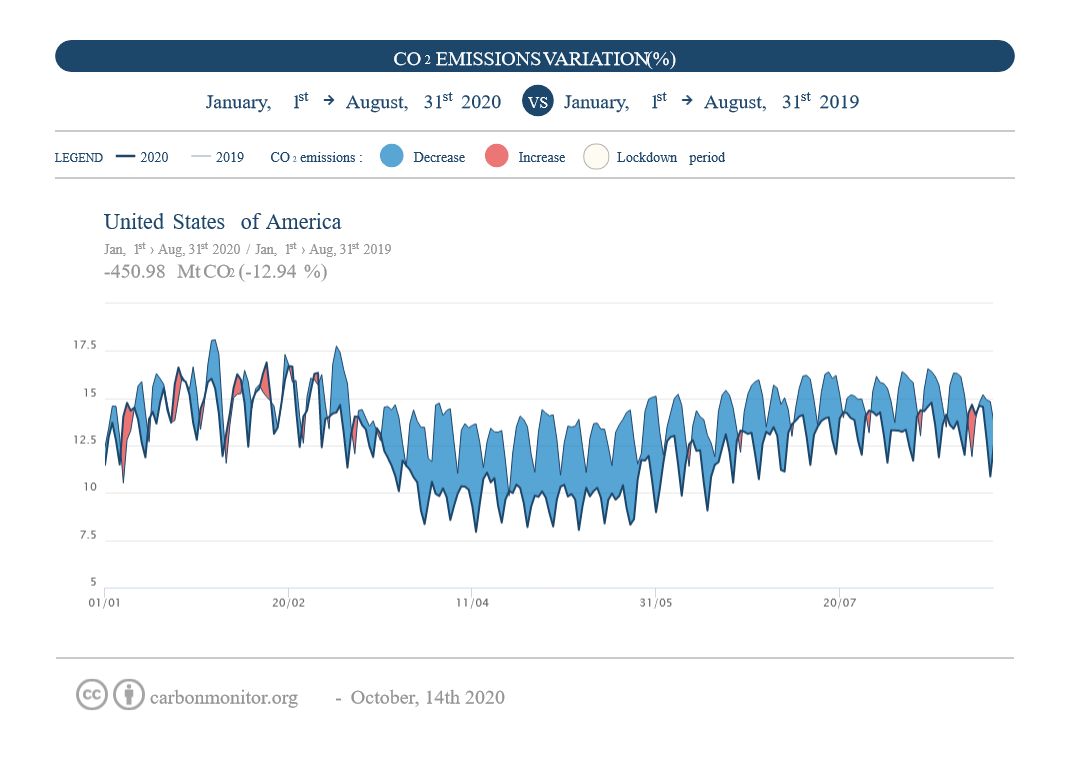
| 10:45, 17. Okt. 2020 | USACO2 emissions Jan-Aug 2020.jpg (Datei) |  |
64 KB | CO<sub>2</sub>-Emissionen in den USA 2019 bis August 2020. Hellbrauner Balken: Lockdown-Phase ==Lizenzhinweis== {| style="border:1px solid #8888aa; background-color:#f7f8ff;padding:5px;font-size:95%;" | Quelle: [https://carbonmonitor.org/ Carbon Monito… | 1 |
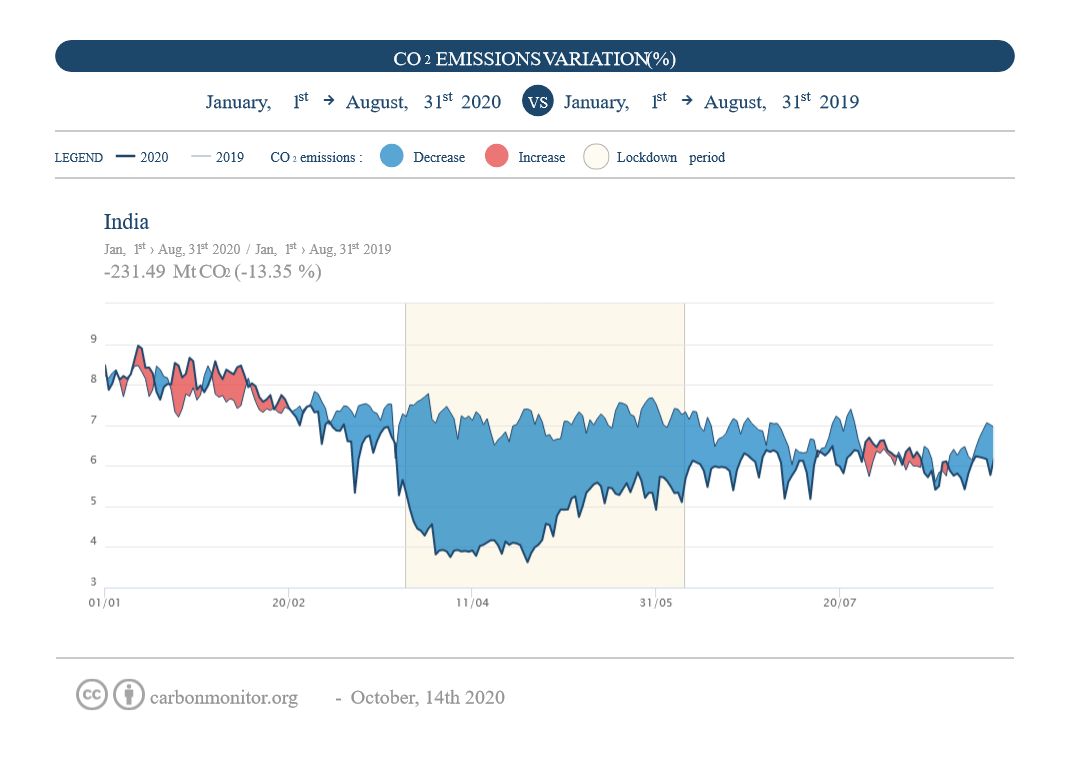
| 10:43, 17. Okt. 2020 | IndiaCO2 emissions Jan-Aug 2020.jpg (Datei) |  |
54 KB | CO<sub>2</sub>-Emissionen in Indien 2019 bis August 2020. Hellbrauner Balken: Lockdown-Phase ==Lizenzhinweis== {| style="border:1px solid #8888aa; background-color:#f7f8ff;padding:5px;font-size:95%;" | Quelle: [https://carbonmonitor.org/ Carbon Monitor… | 1 |
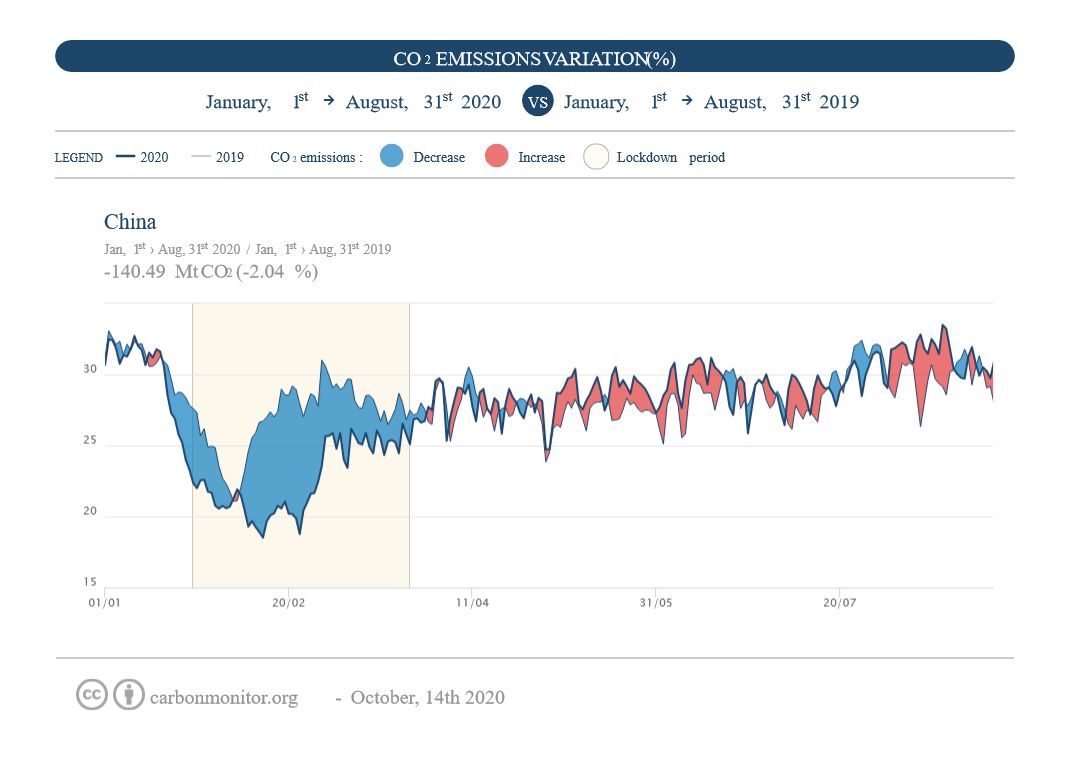
| 10:40, 17. Okt. 2020 | ChinaCO2 emissions Jan-Aug 2020.jpg (Datei) |  |
56 KB | CO<sub>2</sub>-Emissionen in China 2019 bis August 2020 ==Lizenzhinweis== {| style="border:1px solid #8888aa; background-color:#f7f8ff;padding:5px;font-size:95%;" | Quelle: [https://carbonmonitor.org/ Carbon Monitor]<br> Lizenz: CC BY |} | 1 |
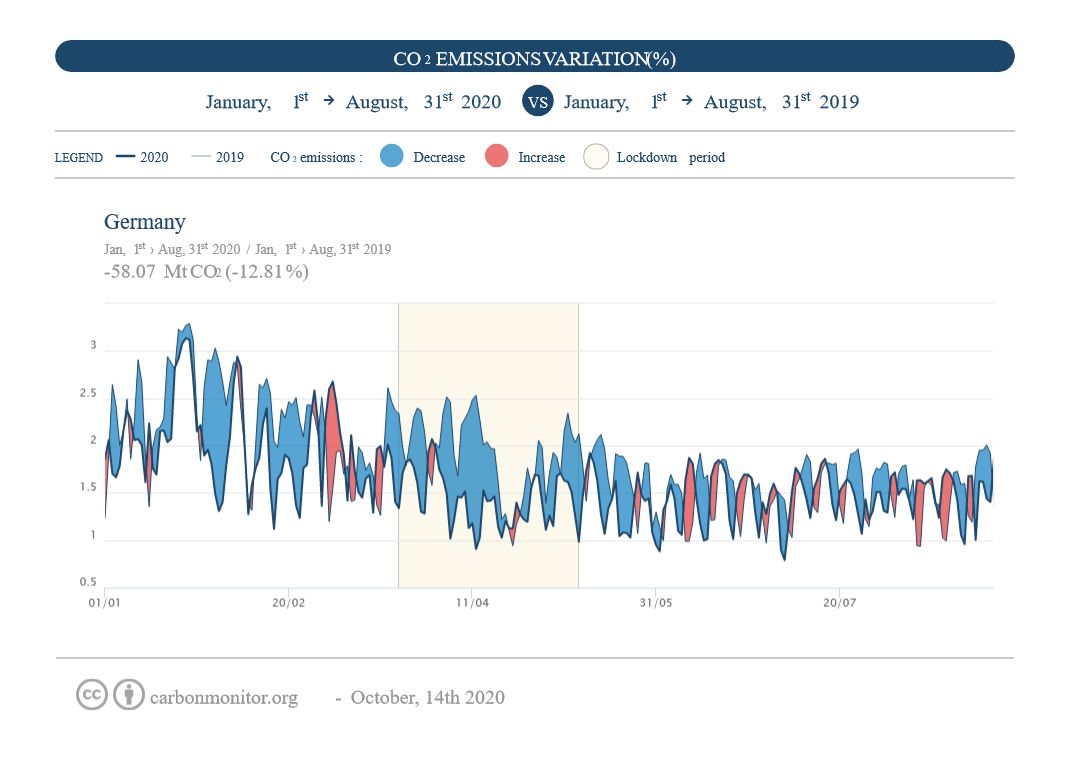
| 10:38, 17. Okt. 2020 | GermanyCO2 emissions Jan-Aug 2020.jpg (Datei) |  |
65 KB | CO2-Emissionen in Deutschland 2019 bis August 2020 ==Lizenzhinweis== {| style="border:1px solid #8888aa; background-color:#f7f8ff;padding:5px;font-size:95%;" | Quelle: [https://carbonmonitor.org/ Carbon Monitor]<br> Lizenz: CC BY |} | 1 |
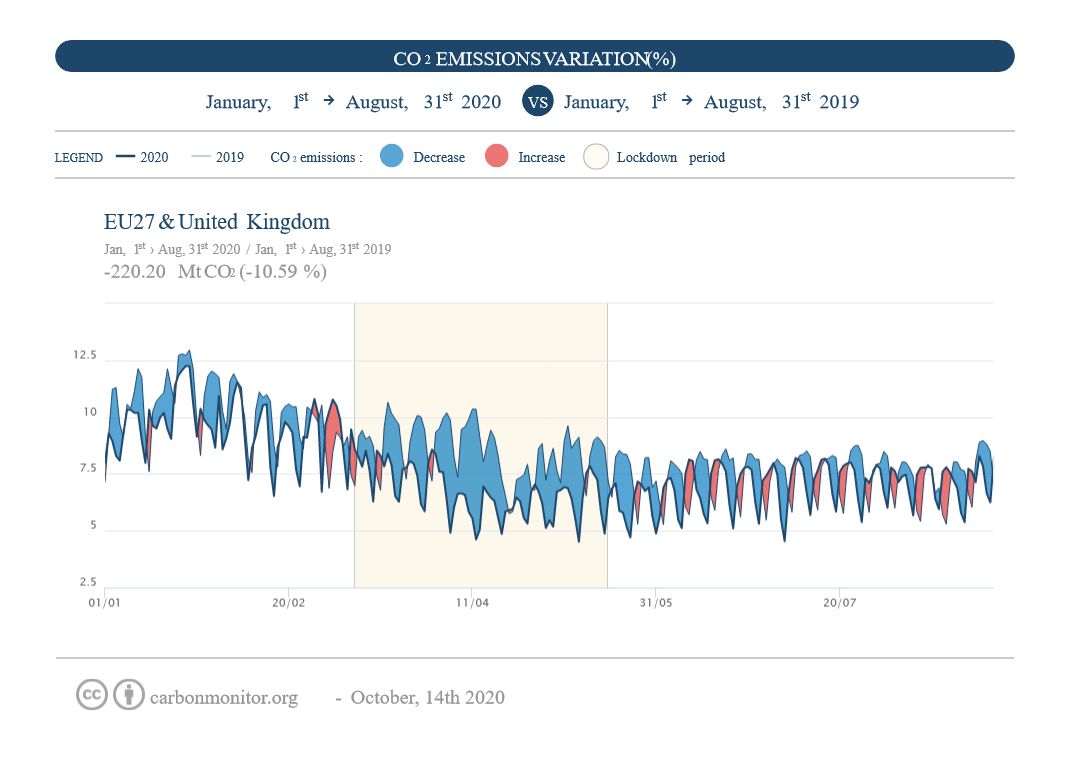
| 10:36, 17. Okt. 2020 | EU UK CO2 emissions Jan-Aug 2020.jpg (Datei) |  |
63 KB | CO2-Emissionen in der EU und Großbritannien 2019 bis August 2020 ==Lizenzhinweis== {| style="border:1px solid #8888aa; background-color:#f7f8ff;padding:5px;font-size:95%;" | Quelle: [https://carbonmonitor.org/ Carbon Monitor]<br> Lizenz: CC BY |} | 1 |
| 10:35, 17. Okt. 2020 | GlobalCO2 emissions Jan-Aug 2020.jpg (Datei) |  |
67 KB | Globale CO2-Emissionen 2019 bis August 2020 ==Lizenzhinweis== {| style="border:1px solid #8888aa; background-color:#f7f8ff;padding:5px;font-size:95%;" | Quelle: [https://carbonmonitor.org/ Carbon Monitor]<br> Lizenz: CC BY |} | 1 |
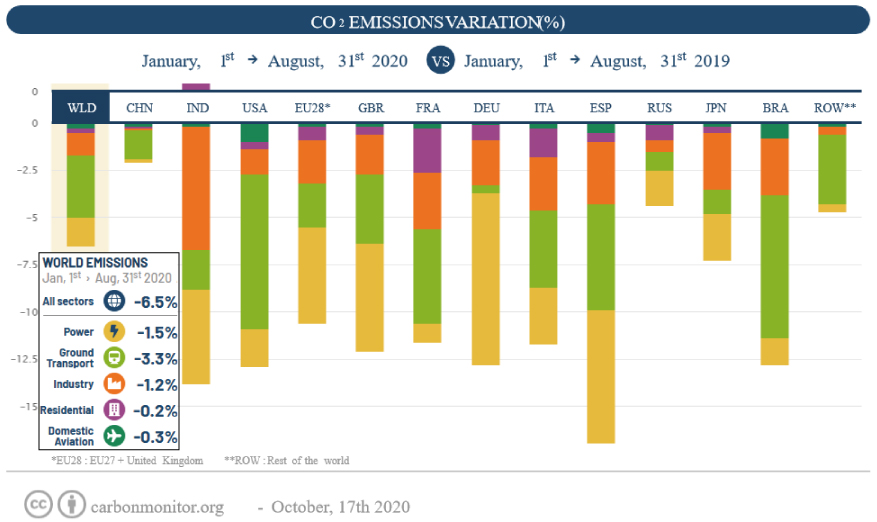
| 10:14, 17. Okt. 2020 | CO2 emissions world countries.jpg (Datei) |  |
151 KB | Globale CO<sub>2</sub>-Emissionen 2019 bis August 2020 ==Lizenzhinweis== {| style="border:1px solid #8888aa; background-color:#f7f8ff;padding:5px;font-size:95%;" | Quelle: [https://carbonmonitor.org/ Carbon Monitor]<br> Lizenz: CC BY |} | 2 |
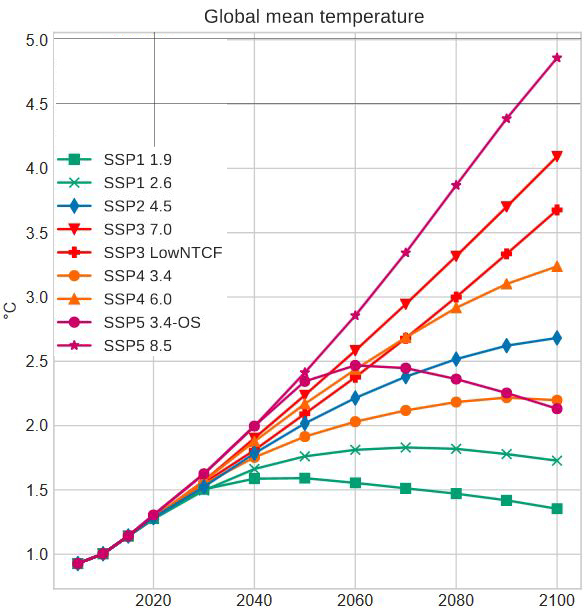
| 18:47, 12. Okt. 2020 | SSP Temperatur2000-2100.jpg (Datei) |  |
151 KB | Globale Mitteltemperatur nach SSP-Szenarien == Lizenzhinweis == {| style="border:1px solid #8888aa; background-color:#f7f8ff;padding:5px;font-size:95%;" | Quelle: Gidden, M. J., K. Riahi, S.J. Smith, et al. (2019): Global emissions pathways under diffe… | 2 |
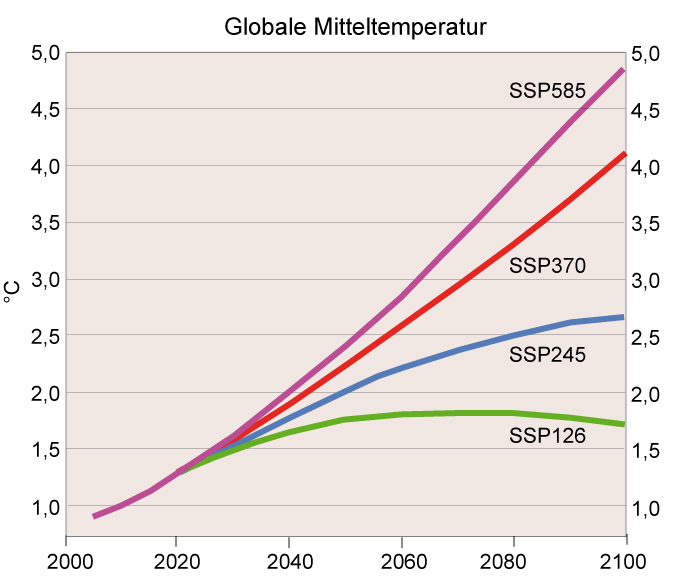
| 18:33, 12. Okt. 2020 | SSP Temperatur2100.jpg (Datei) |  |
107 KB | Temperaturänderung bis 2100 im Vergleich zu vorindustriellen Werten nach vier SSP-Szenarien == Lizenzhinweis == {| style="border:1px solid #8888aa; background-color:#f7f8ff;padding:5px;font-size:95%;" | Quelle: Eigene Darstellung (D.K.) nach Gidden, M… | 1 |
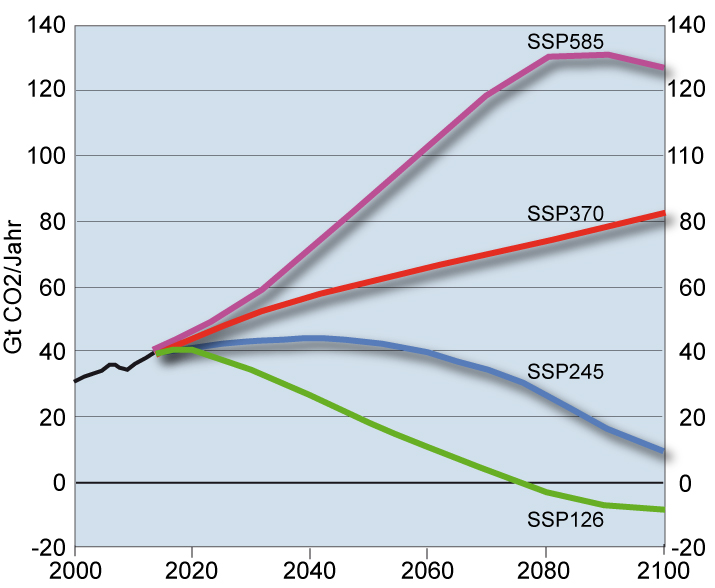
| 18:29, 12. Okt. 2020 | SSP CO2 emission 1.jpg (Datei) |  |
117 KB | CO2-Emissionen pro Jahr bis 2100 nach vier SSP-Szenarien == Lizenzhinweis == {| style="border:1px solid #8888aa; background-color:#f7f8ff;padding:5px;font-size:95%;" | Quelle: Eigene Darstellung (D.K.) nach Gidden, M. J., K. Riahi, S.J. Smith, et al. (… | 1 |
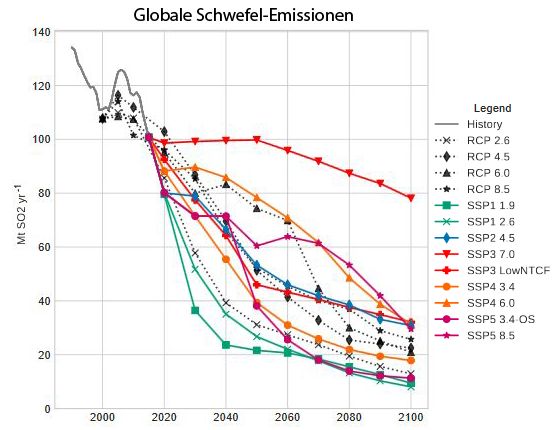
| 18:26, 12. Okt. 2020 | SSP Schwefel-Emissionen2000-2100.jpg (Datei) |  |
40 KB | Globale Schwefel-Emissionen nach SSP- (farbige Linien) und RCP-Szenarien (gestrichelte Linien) zum Vergleich == Lizenzhinweis == {| style="border:1px solid #8888aa; background-color:#f7f8ff;padding:5px;font-size:95%;" | Quelle: Gidden, M. J., K. Riahi,… | 1 |
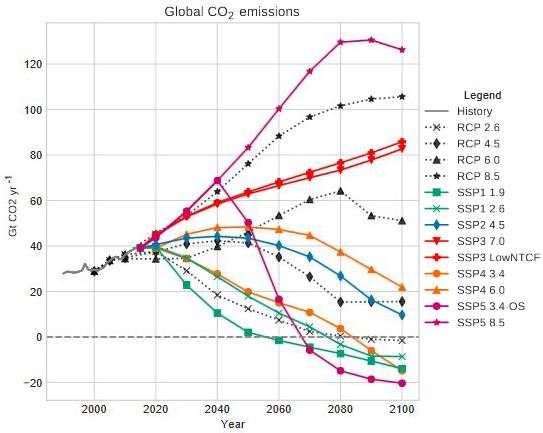
| 18:23, 12. Okt. 2020 | SSP CO2-Emissionen2000-2100.jpg (Datei) |  |
39 KB | CO2-Emissionen nach SSP- (farbige Linien) und RCP-Szenarien (gestrichelte Linien) zum Vergleich == Lizenzhinweis == {| style="border:1px solid #8888aa; background-color:#f7f8ff;padding:5px;font-size:95%;" | Quelle: Gidden, M. J., K. Riahi, S.J. Smith,… | 1 |
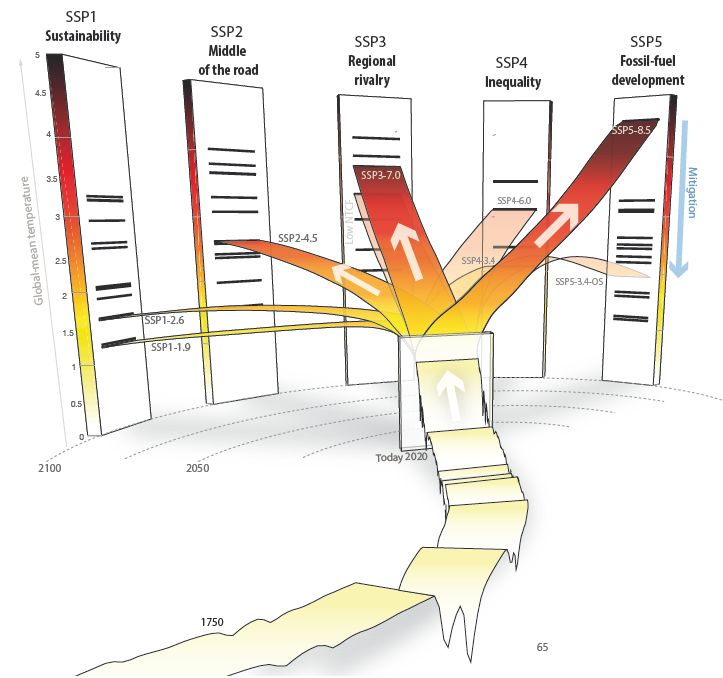
| 16:52, 12. Okt. 2020 | SSP1-5 pathways.jpg (Datei) |  |
60 KB | Entwicklungspfade der fünf SSP-Szenarien: Vorne wird die Temperaturentwicklung von vorindustriell bis 2020, dahinter die Verzweigung der Szenarien während des 21. Jahrhunderts dargestellt. Die Blöcke im Hintergrund zeigen die Temperaturwerte, auf d… | 1 |
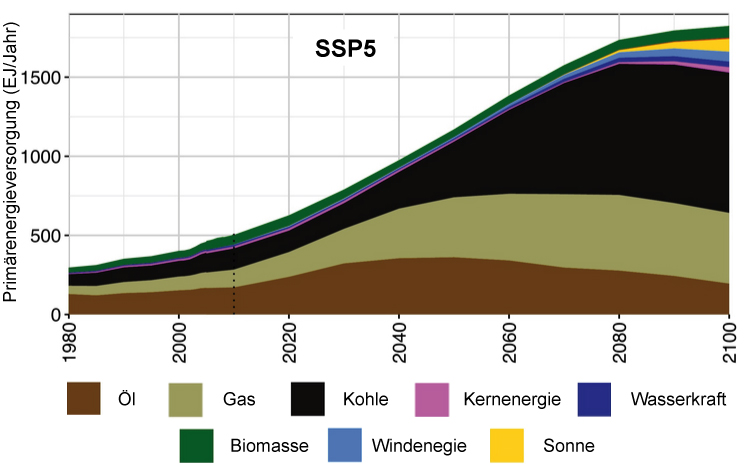
| 16:40, 12. Okt. 2020 | PrimärenergieSSP5.jpg (Datei) |  |
92 KB | Veränderung der Primärenergieversorgung nach den Basisszenarien SSP5 bis 2100. == Lizenzhinweis == {| style="border:1px solid #8888aa; background-color:#f7f8ff;padding:5px;font-size:95%;" | Quelle: Kriegler, E., N. Bauer, A. Popp, et al. (2017): Foss… | 1 |
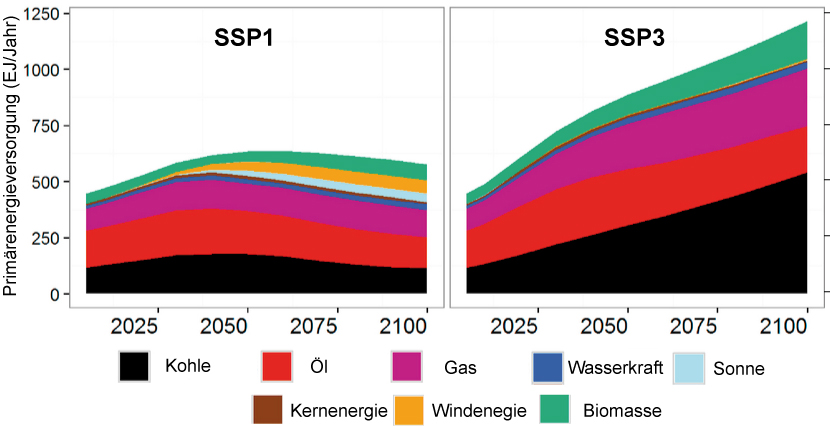
| 16:36, 12. Okt. 2020 | PrimärenergieSSP1 3.jpg (Datei) |  |
125 KB | Veränderung der Primärenergieversorgung nach den Basisszenarien SSP1 und SSP3 bis 2100. == Lizenzhinweis == {| style="border:1px solid #8888aa; background-color:#f7f8ff;padding:5px;font-size:95%;" | Quelle: Fujimori, S., T. Hasegawa, T. Masui, (2017)… | 1 |
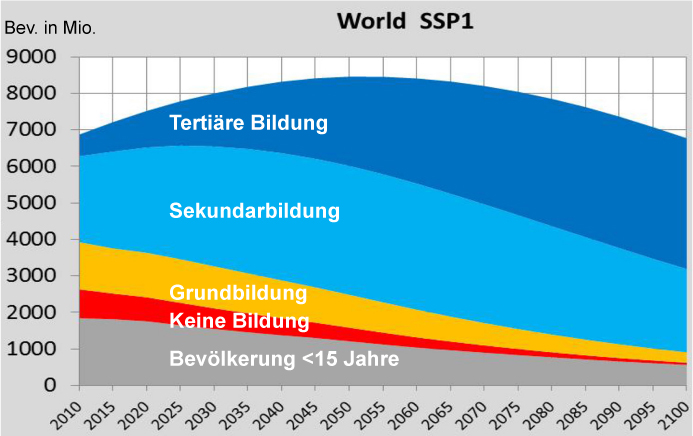
| 16:31, 12. Okt. 2020 | SSP1 world population2010-2100.jpg (Datei) |  |
127 KB | SSP1: Entwicklung der Weltbevölkerung bis 2100 nach Bildungsgrad == Lizenzhinweis == {| style="border:1px solid #8888aa; background-color:#f7f8ff;padding:5px;font-size:95%;" | Quelle: KC, S., W. Lutz (2017): The human core of the shared socioeconomic… | 2 |
| 16:20, 12. Okt. 2020 | Global-N2O-budget2007-16.jpg (Datei) |  |
154 KB | Distickstoff-Oxid-Budget 2007-2016 ==Lizenzhinweis== {| style="border:1px solid #8888aa; background-color:#f7f8ff;padding:5px;font-size:95%;" | Quelle: Dunne, D., CarbonBrief (2020): Nitrogen fertiliser use could ‘threaten global climate goals’, h… | 1 |
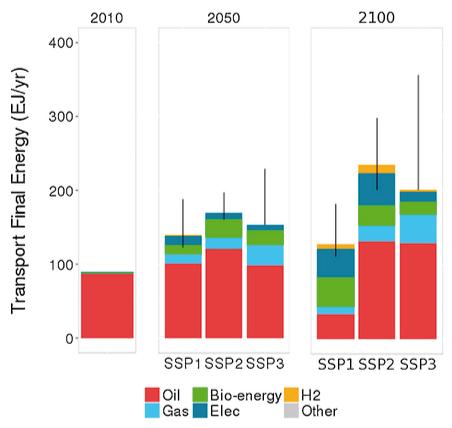
| 19:32, 1. Okt. 2020 | SSP1-3 transport energy.jpg (Datei) | 50 KB | Energieverbrauch im Transportsektor nach SSP1, 2 und 3 == Lizenzhinweis == {| style="border:1px solid #8888aa; background-color:#f7f8ff;padding:5px;font-size:95%;" | Quelle: van Vuuren, D. P., E. Stehfest, D.E. Gernaat, et al. (2017): Energy, land-use… | 1 | |
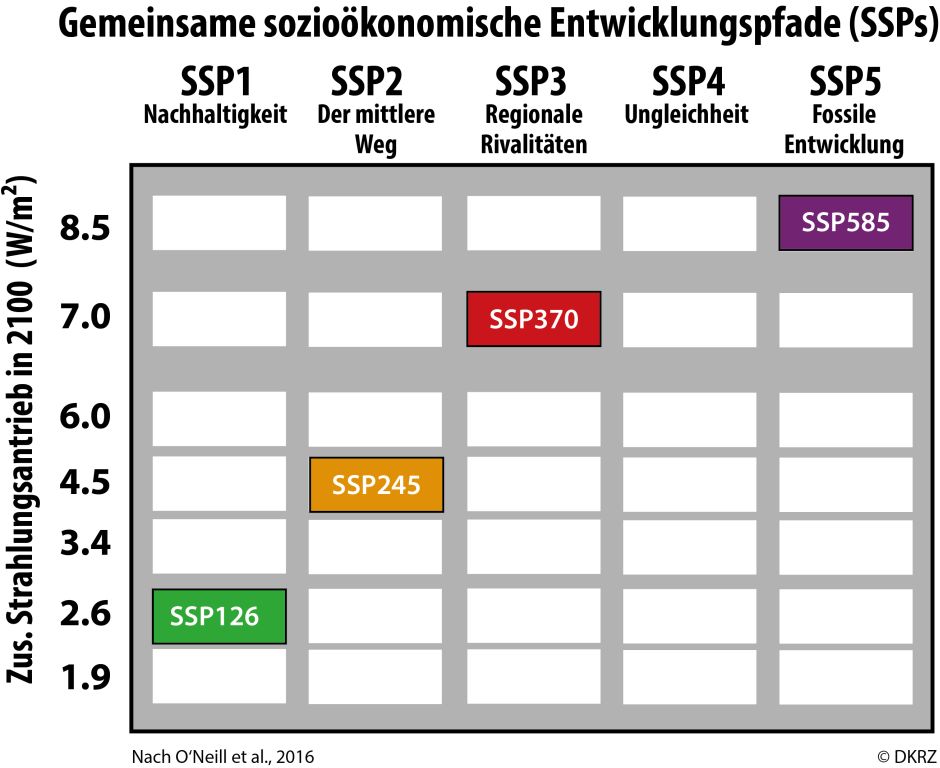
| 19:09, 1. Okt. 2020 | SSPs Matrix.jpg (Datei) |  |
75 KB | Sozioökonimische Entwicklungspfade (SSPs) nach Strahlungsantrieb == Lizenzhinweis == {| style="border:1px solid #8888aa; background-color:#f7f8ff;padding:5px;font-size:95%;" | Quelle: Michael Böttinger, DKRZ, nach: O’Neill et al. 2016: The Scenario… | 1 |
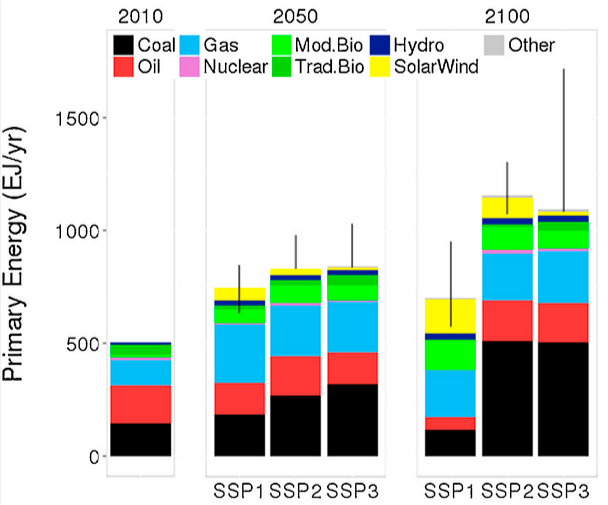
| 18:59, 1. Okt. 2020 | Primary energy SSP1-2-3.jpg (Datei) |  |
79 KB | Primärenergieverbrauch 2010, 2050 und 2100 nach SSP1, SSP2 und SSP3 == Lizenzhinweis == {| style="border:1px solid #8888aa; background-color:#f7f8ff;padding:5px;font-size:95%;" | Quelle: van Vuuren, D. P., E. Stehfest, D.E. Gernaat, et al. (2017): Ene… | 1 |
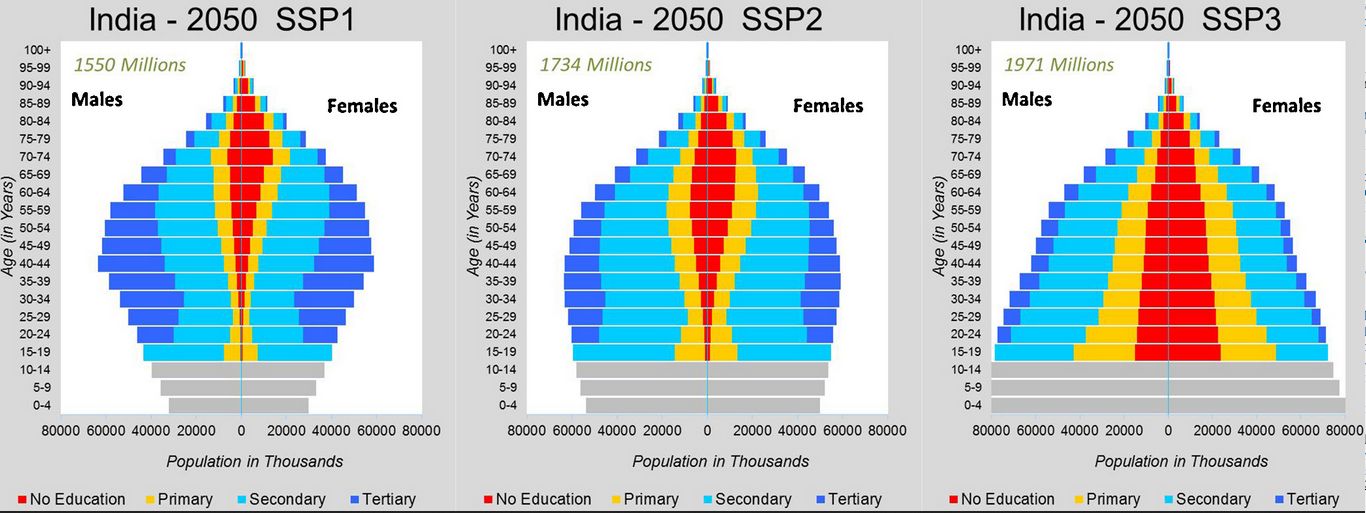
| 18:22, 1. Okt. 2020 | SSP1-2-3 India population-pyramid.jpg (Datei) |  |
120 KB | Bevölkerung Indiens nach Alter, Geschlecht und Bildung 2010 und 2050 nach SSP1 und SSP3 == Lizenzhinweis == {| style="border:1px solid #8888aa; background-color:#f7f8ff;padding:5px;font-size:95%;" | Quelle: KC, S., W. Lutz (2017): The human core of th… | 1 |
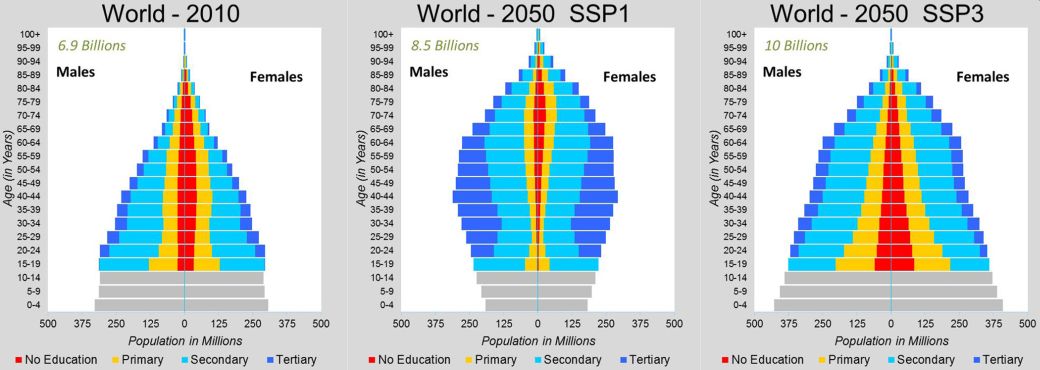
| 18:18, 1. Okt. 2020 | SSP1-3 world population-pyramid.jpg (Datei) |  |
67 KB | Weltbevölkerung nach Alter, Geschlecht und Bildung 2010 und 2050 nach SSP1 und SSP3 == Lizenzhinweis == {| style="border:1px solid #8888aa; background-color:#f7f8ff;padding:5px;font-size:95%;" | Quelle: KC, S., W. Lutz (2017): The human core of the sh… | 1 |
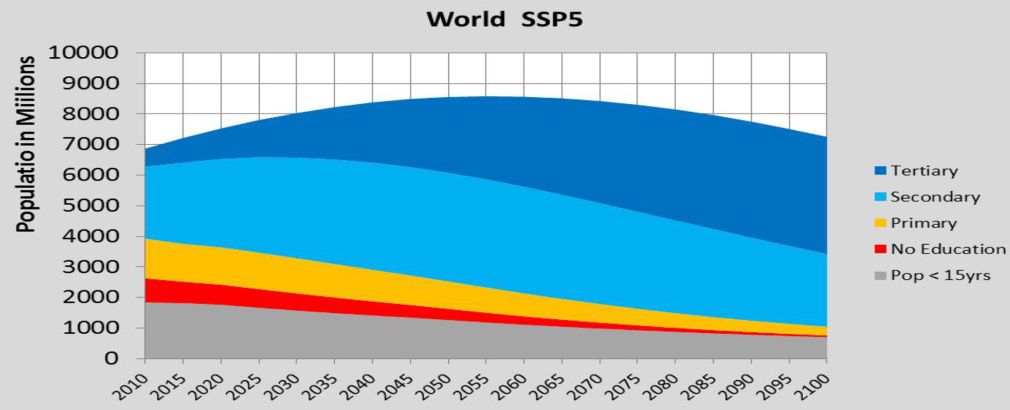
| 18:13, 1. Okt. 2020 | SSP5 world population2010-2100.jpg (Datei) |  |
38 KB | SSP5: Entwicklung der Weltbevölkerung bis 2100 nach Bildungsgrad == Lizenzhinweis == {| style="border:1px solid #8888aa; background-color:#f7f8ff;padding:5px;font-size:95%;" | Quelle: KC, S., W. Lutz (2017): The human core of the shared socioeconomic… | 1 |
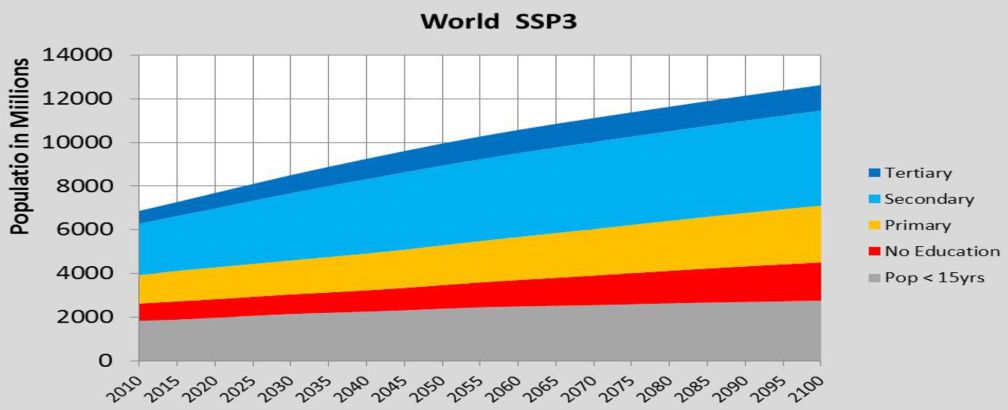
| 18:11, 1. Okt. 2020 | SSP3 world population2010-2100.jpg (Datei) |  |
37 KB | SSP3: Entwicklung der Weltbevölkerung bis 2100 nach Bildungsgrad == Lizenzhinweis == {| style="border:1px solid #8888aa; background-color:#f7f8ff;padding:5px;font-size:95%;" | Quelle: KC, S., W. Lutz (2017): The human core of the shared socioeconomic… | 1 |
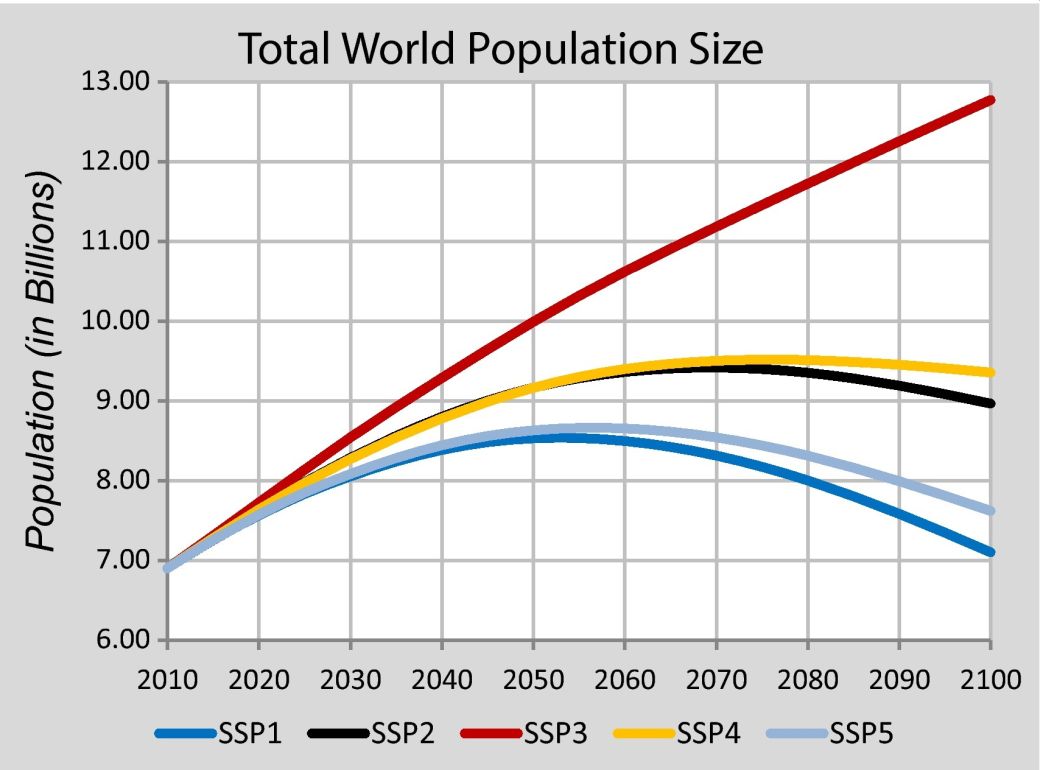
| 18:02, 1. Okt. 2020 | SSP world population.jpg (Datei) |  |
82 KB | Entwicklung der Weltbevölkerung bis 2100 nach SSP-Szenarien == Lizenzhinweis == {| style="border:1px solid #8888aa; background-color:#f7f8ff;padding:5px;font-size:95%;" | Quelle: KC, S., W. Lutz (2017): The human core of the shared socioeconomic pathw… | 1 |
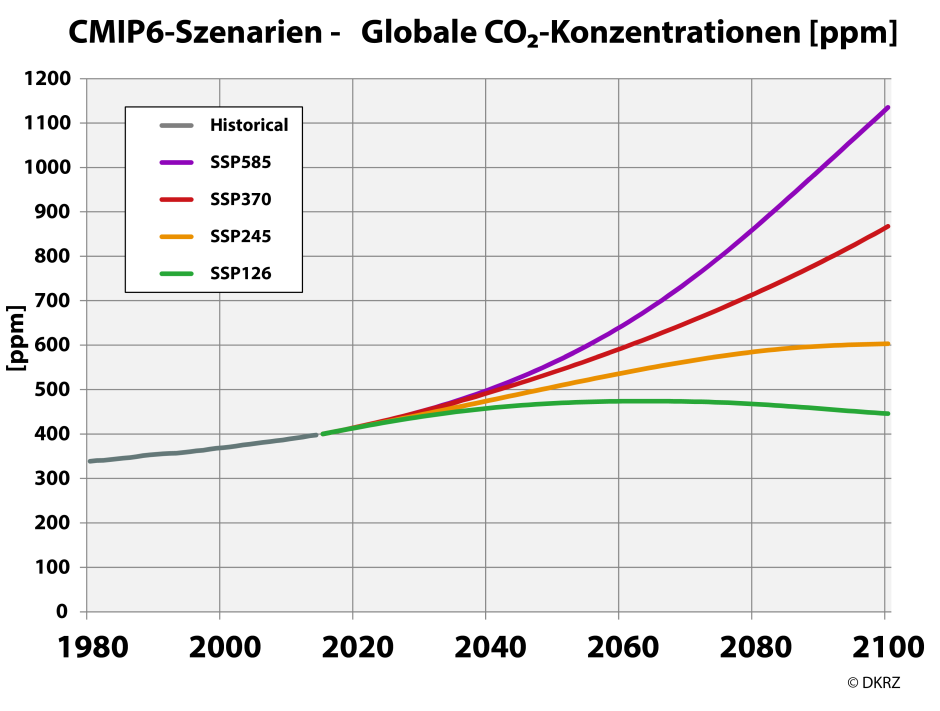
| 16:33, 1. Okt. 2020 | CO2-Concentrations SSPs 1980-2100 DE.png (Datei) |  |
83 KB | Globale CO2-Konzentrationen bei wichtigen SSP-Szenarien in Gt CO2/Jahr == Lizenzhinweis == {| style="border:1px solid #8888aa; background-color:#f7f8ff;padding:5px;font-size:95%;" | Quelle: Michael Böttinger, DKRZ, nach: O’Neill et al. 2016: The Sce… | 1 |
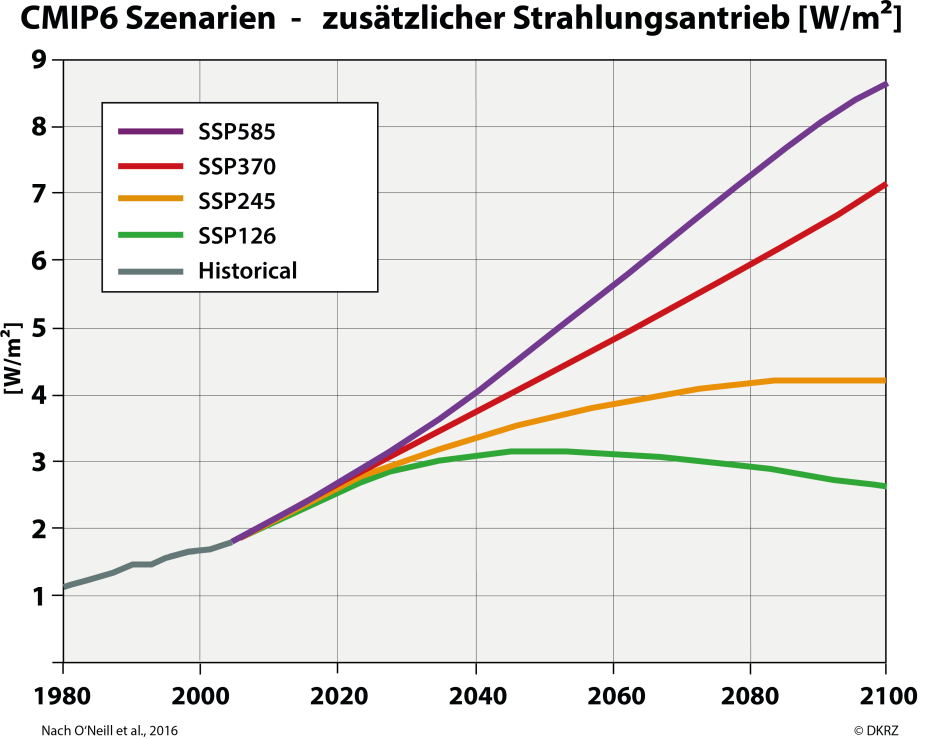
| 16:27, 1. Okt. 2020 | CMIP6-Strahlungsantrieb DE.png (Datei) |  |
88 KB | Zusätzlicher Strahlungsantrieb bei wichtigen SSP-Szenarien in W/m2 == Lizenzhinweis == {| style="border:1px solid #8888aa; background-color:#f7f8ff;padding:5px;font-size:95%;" | Quelle: Michael Böttinger, DKRZ, nach: O’Neill et al. 2016: The Scenar… | 1 |
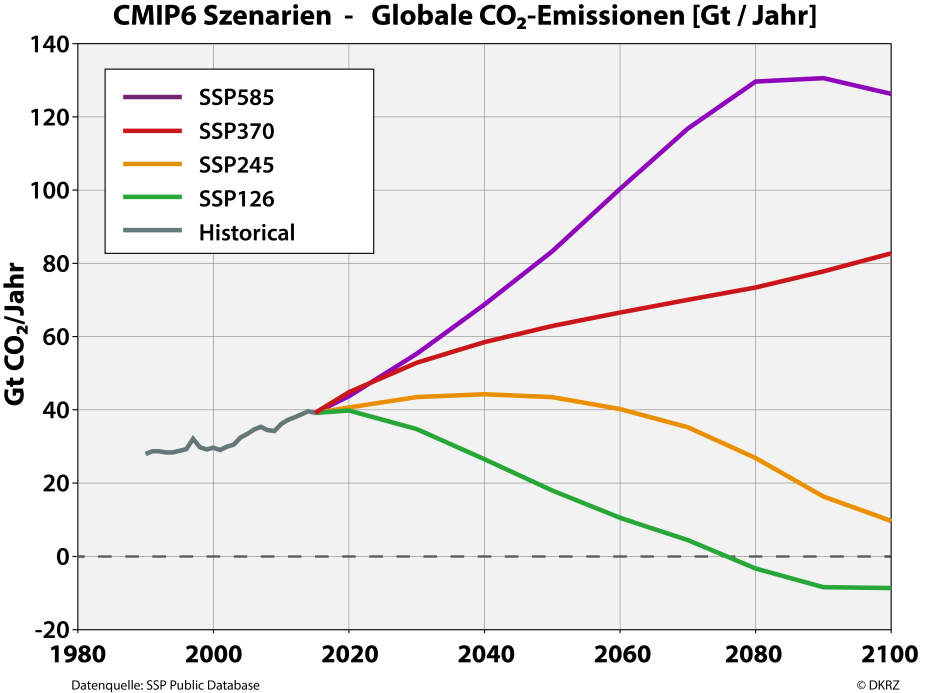
| 16:24, 1. Okt. 2020 | SSP scenarios Emissions DE.png (Datei) |  |
88 KB | Globale CO2-Emissionen bei wichtigen SSP-Szenarien in Gt CO2/Jahr == Lizenzhinweis == {| style="border:1px solid #8888aa; background-color:#f7f8ff;padding:5px;font-size:95%;" | Quelle: Michael Böttinger, DKRZ, nach: O’Neill et al. 2016: The Scenario… | 1 |
| 13:02, 22. Sep. 2020 | Arctic sea-ice-volume1984-2018.png (Datei) |  |
90 KB | Änderung des Meereisvolumens in der Arktis 1984 bis 2018 nach verschiedenen Messungen ==Lizenzhinweis== {| style="border:1px solid #8888aa; background-color:#f7f8ff;padding:5px;font-size:95%;" | Quelle: Liu, Y., Key, J. R., Wang, X., and Tschudi, M. (… | 1 |
| 16:16, 21. Sep. 2020 | Arctic sea-ice thickness 2000-2012.jpg (Datei) |  |
49 KB | Mittel der Meereisdicke über die Monate Oktober-November 2000-2012 in m nach Modellsimulationen ==Lizenzhinweis== {| style="border:1px solid #8888aa; background-color:#f7f8ff;padding:5px;font-size:95%;" | Quelle: Liu, Y., Key, J. R., Wang, X., and Tsc… | 1 |
| 16:11, 21. Sep. 2020 | Arctic sea-ice-thickness1984-2018.png (Datei) |  |
224 KB | Änderung der Meereisdicke in der Arktis 1984 bis 2018 im Frühjahr (oben) und Herbst (unten) nach verschiedenen Messungen ==Lizenzhinweis== {| style="border:1px solid #8888aa; background-color:#f7f8ff;padding:5px;font-size:95%;" | Quelle: Liu, Y., Key… | 1 |
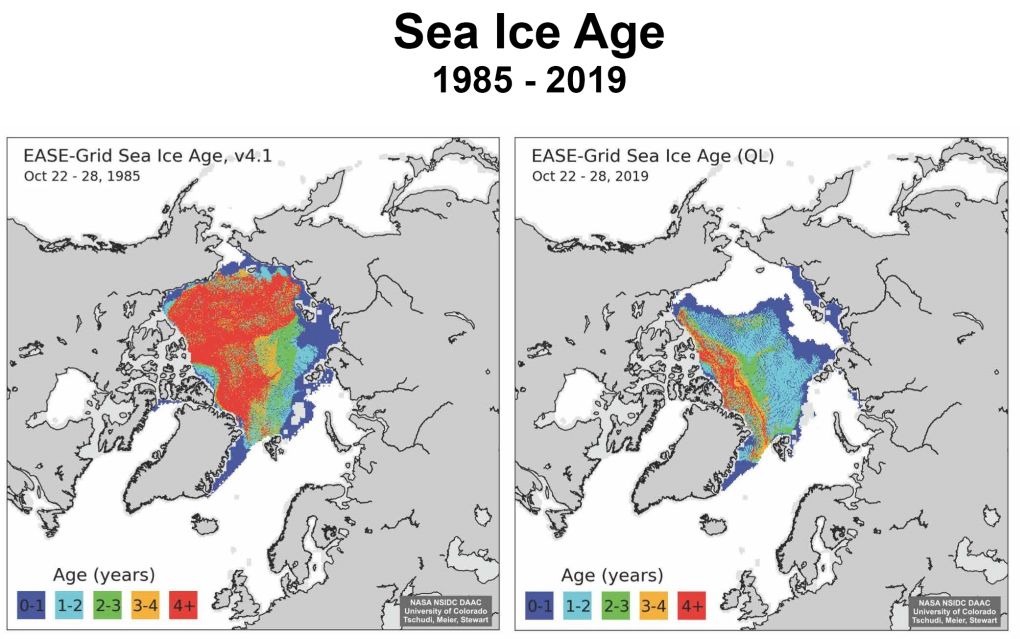
| 15:44, 21. Sep. 2020 | Arctic ice-age 1985 2019.ai.jpg (Datei) |  |
108 KB | Alter des arktischen Meereises im Oktober 1985 und 2019 ==Lizenzhinweis== {| style="border:1px solid #8888aa; background-color:#f7f8ff;padding:5px;font-size:95%;" | Quelle: National Snow & Ice Data Center (2019): Wild ride in October, https://nsidc.org… | 1 |
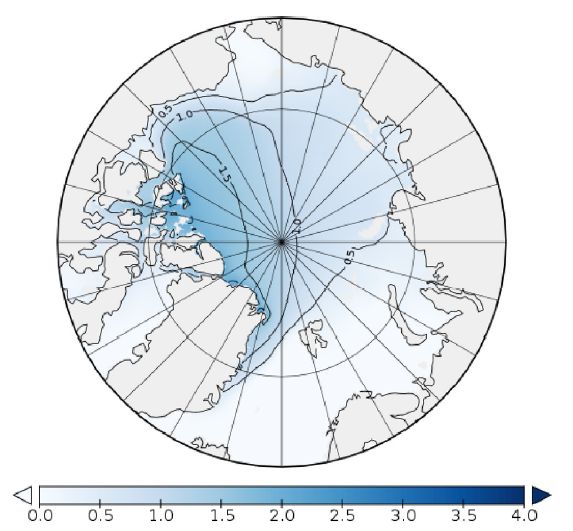
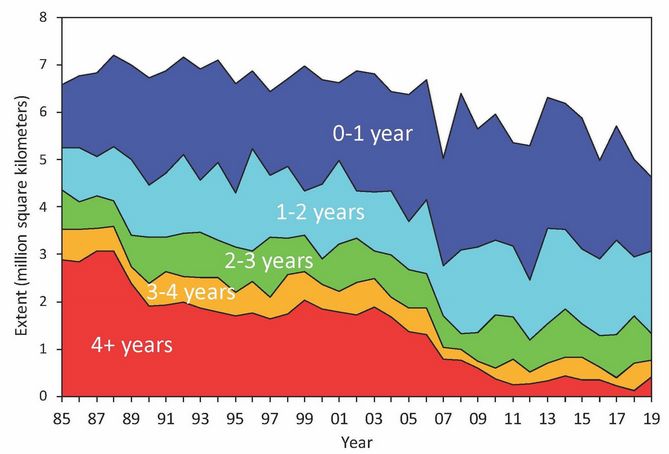
| 15:39, 21. Sep. 2020 | Arctic ice-age 1985-2019.jpg (Datei) |  |
39 KB | Änderung des arktischen Meereisalters in der Woche 22.-28. Oktober 1985 bis 2019 ==Lizenzhinweis== {| style="border:1px solid #8888aa; background-color:#f7f8ff;padding:5px;font-size:95%;" | Quelle: Stroeve, J., and D. Notz (2018): Changing state of Ar… | 1 |
| 14:02, 21. Sep. 2020 | Arctic sea-ice mass1960-2100.jpg (Datei) |  |
96 KB | Änderung der Masse des arktisches Meereises 1960 bis 2100 nach verschiedenen CMIP6-Modellsimulationen in 1000 Gt ==Lizenzhinweis== {| style="border:1px solid #8888aa; background-color:#f7f8ff;padding:5px;font-size:95%;" | Quelle: Keen, A., Blockley, E… | 1 |
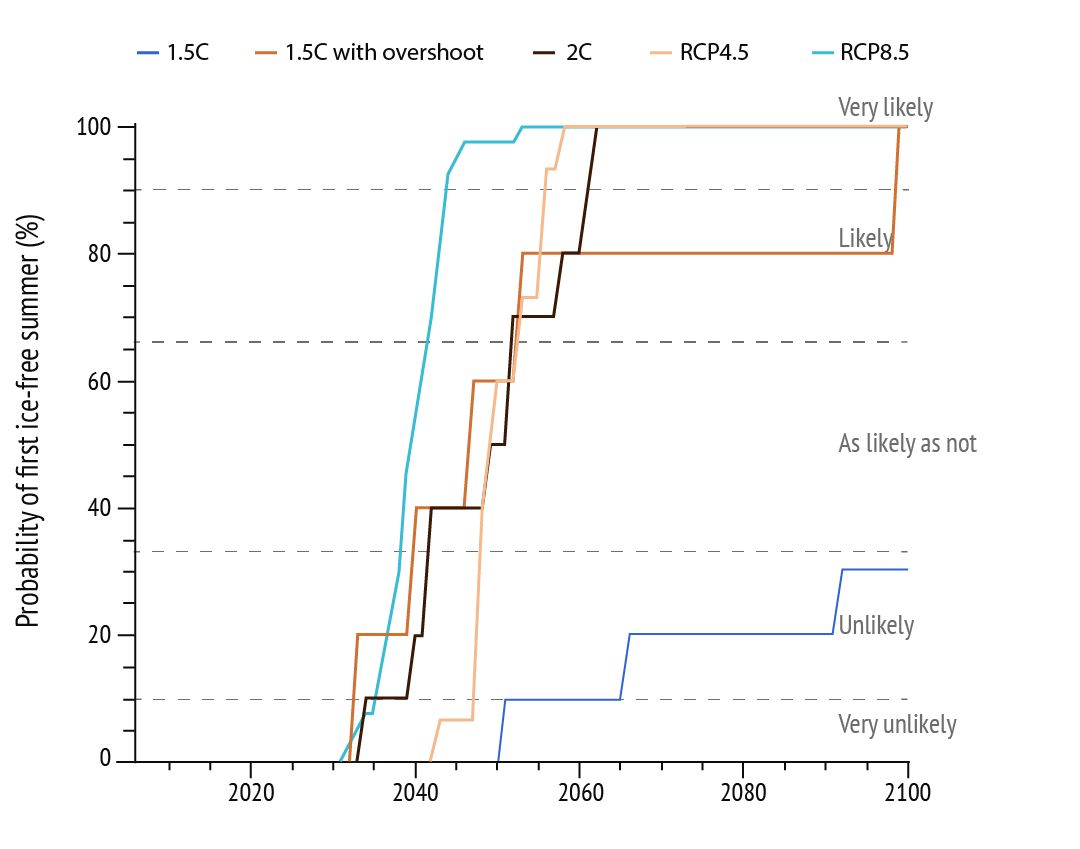
| 13:53, 21. Sep. 2020 | Arctic ice-free.jpg (Datei) |  |
54 KB | Die Wahrscheinlichkeit einer eisfreien Arktis im Sommer bei verschiedenen Szenarien. ==Lizenzhinweis== {| style="border:1px solid #8888aa; background-color:#f7f8ff;padding:5px;font-size:95%;" | Quelle: Dunne, D., CarbonBrief : Interactive: When will th… | 1 |
| 13:36, 21. Sep. 2020 | Sea-ice-extent sept.2020.jpg (Datei) |  |
56 KB | Meereisausdehnung am 1. (weiß) und 15.9.2020 (blau) ==Lizenzhinweis== {| style="border:1px solid #8888aa; background-color:#f7f8ff;padding:5px;font-size:95%;" | Quelle: NASA National Snow & Ice Data Center (2020): Arctic Sea Ice News & Analysis, http… | 1 |
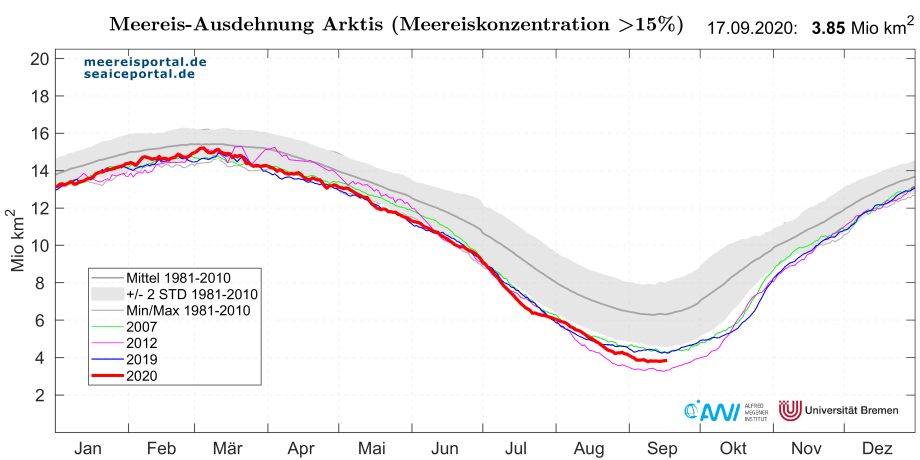
| 13:27, 21. Sep. 2020 | Arktis meereis Vergleich 9-2020.png (Datei) |  |
105 KB | Meereisausdehnung im Sept. 2020 im Vergleich weiteren Jahren in Mio. km2 ==Lizenzhinweis== {| style="border:1px solid #8888aa; background-color:#f7f8ff;padding:5px;font-size:95%;" | Quelle: meereisportal.de (2020): Übersicht der aktuellen Meereiskon… | 2 |
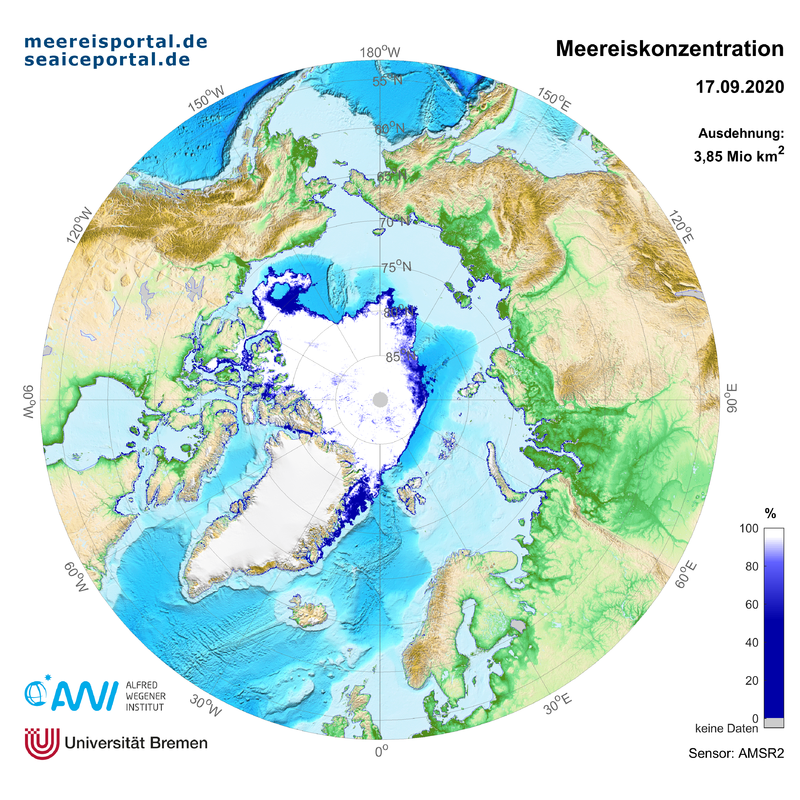
| 11:27, 18. Sep. 2020 | Arktis meereis 9-2020.png (Datei) |  |
949 KB | Meereisausdehnung und -konzentration am 17.9.2020 in % ==Lizenzhinweis== {| style="border:1px solid #8888aa; background-color:#f7f8ff;padding:5px;font-size:95%;" | Quelle: meereisportal.de (2020): Übersicht der aktuellen Meereiskonzentration und -au… | 1 |
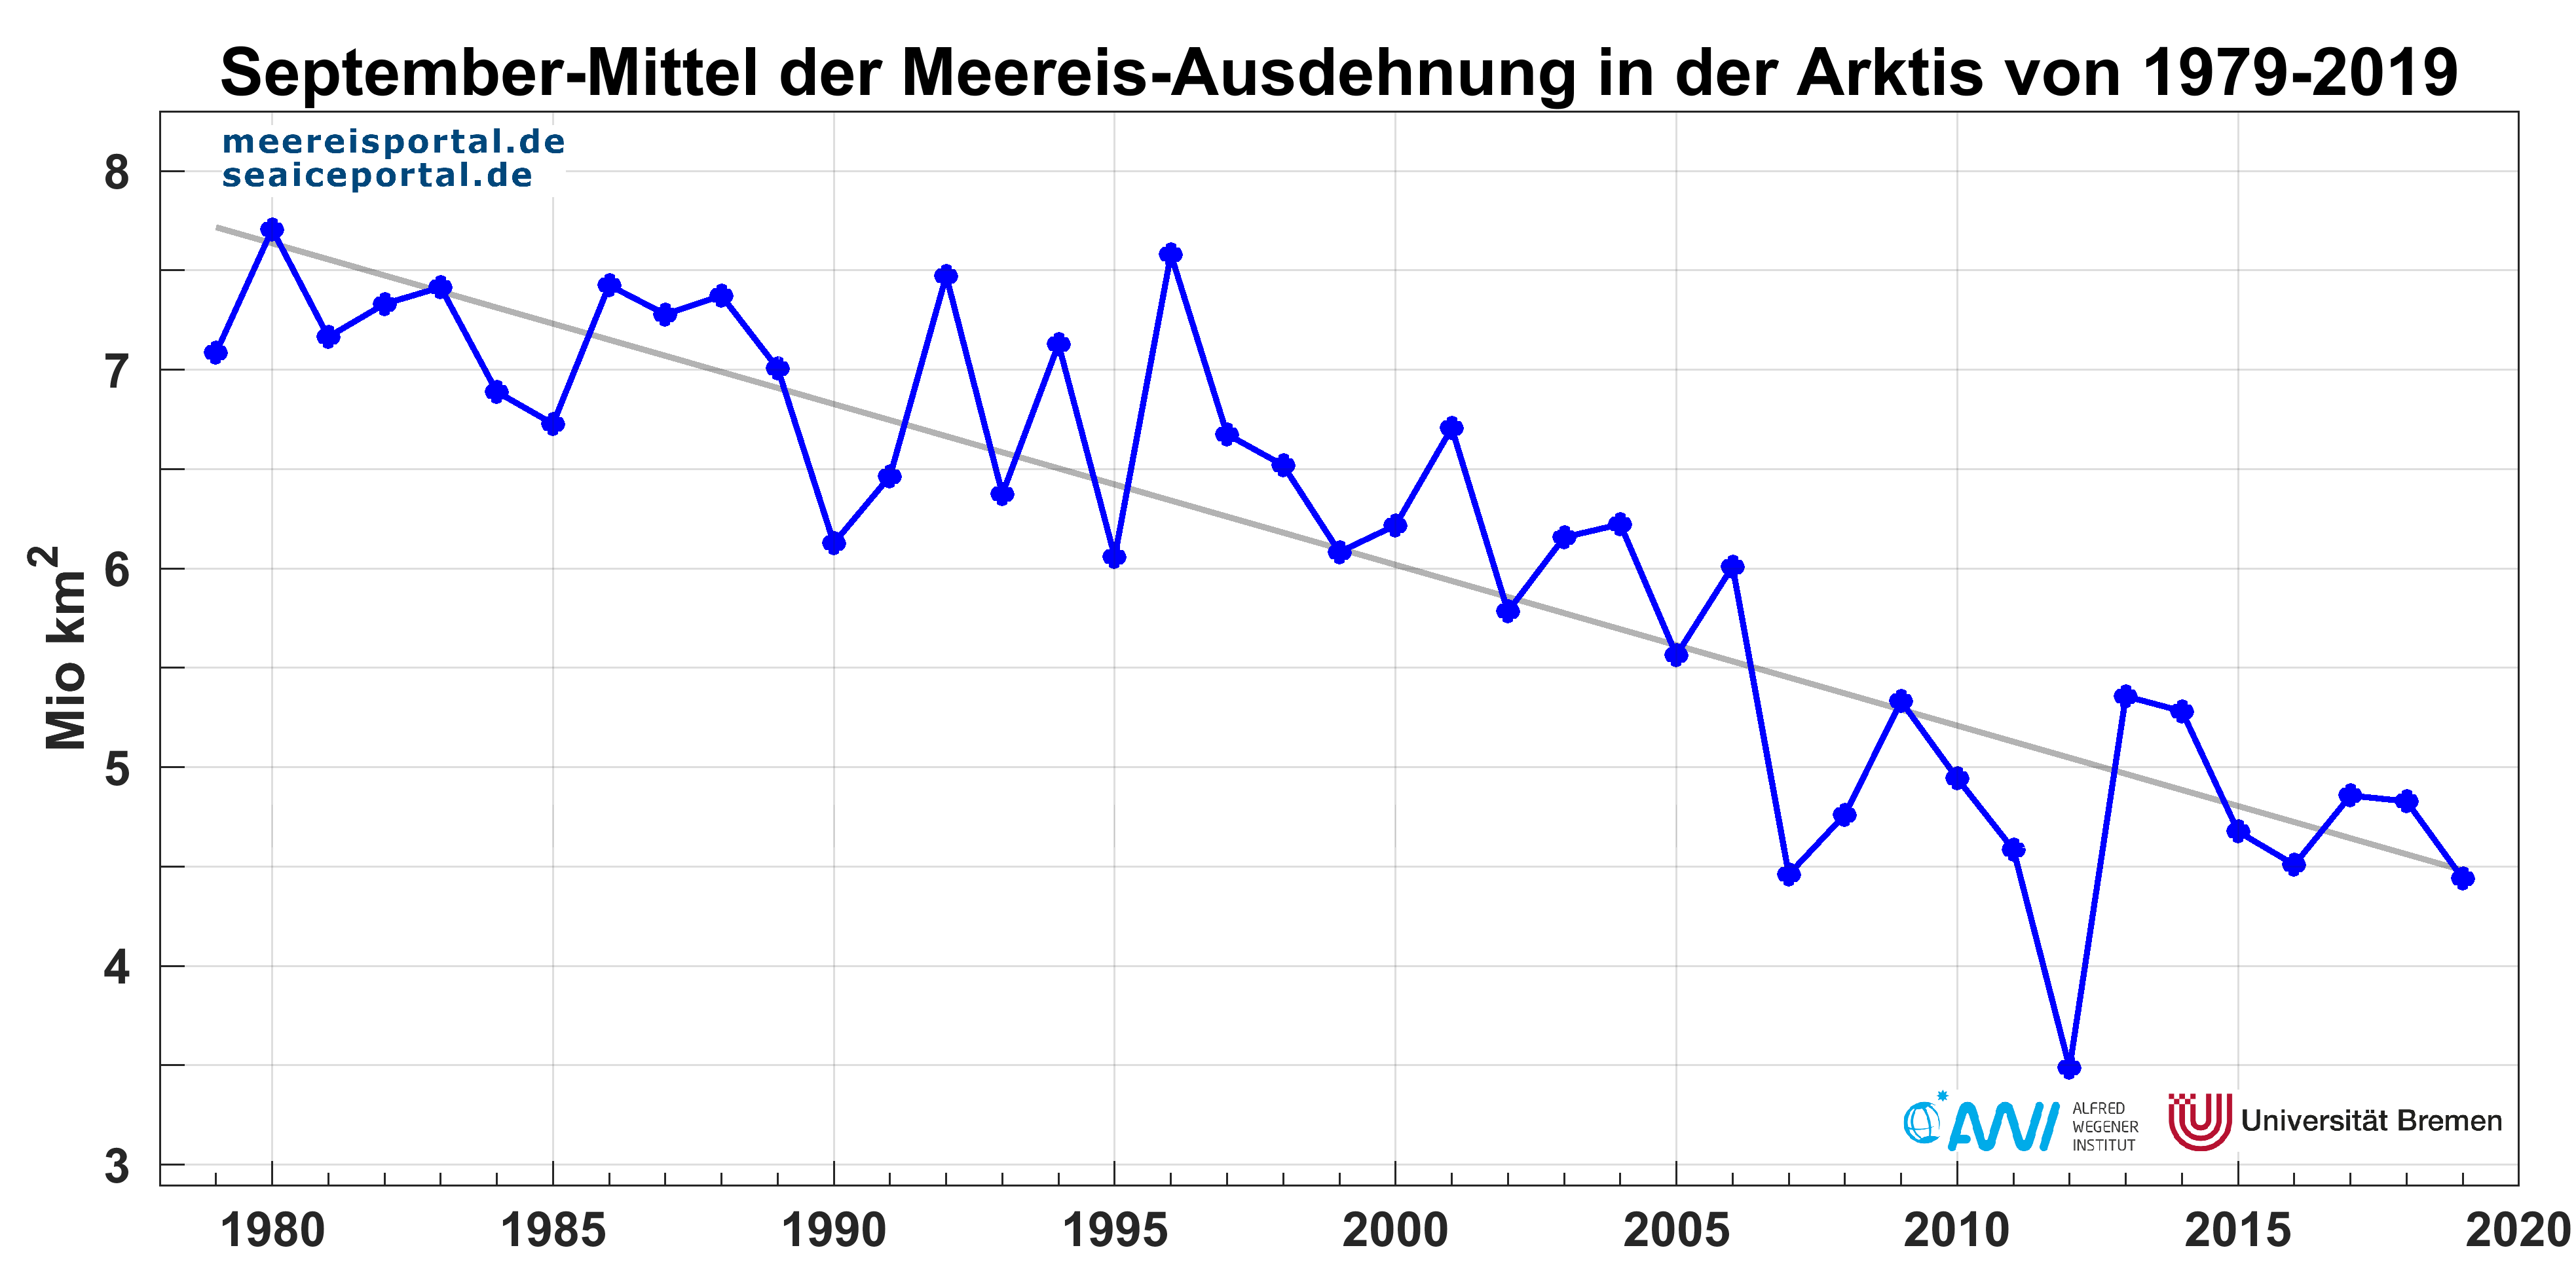
| 10:34, 18. Sep. 2020 | Arctic ice-extent Sept.1979-2019.png (Datei) |  |
161 KB | Septembermittel der Meereisausdehnung in der Arktis 1979-2019. Meereisausdehnung: Fläche mit über 15 % Meereisbedeckung. ==Lizenzhinweis== {| style="border:1px solid #8888aa; background-color:#f7f8ff;padding:5px;font-size:95%;" | Quelle: Meereisporta… | 1 |
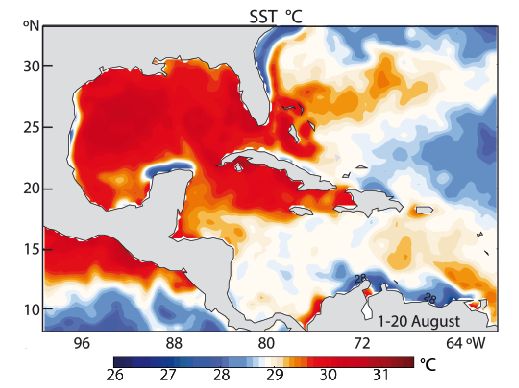
| 18:51, 6. Sep. 2020 | Harvey SST Aug.jpg (Datei) |  |
36 KB | Meeresoberflächentemperaturen während Hurrikan Harvey im August 2017 in °C. ==Lizenzhinweis== {| style="border:1px solid #8888aa; background-color:#f7f8ff;padding:5px;font-size:95%;" | Quelle: Trenberth, K. E., Cheng, L., Jacobs, P., Zhang, Y. & Fas… | 1 |
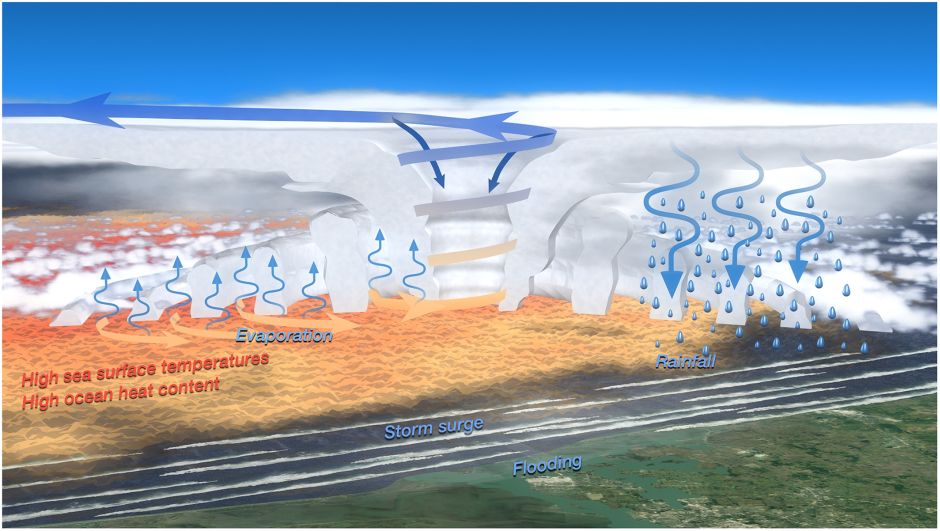
| 18:39, 6. Sep. 2020 | TC structure.jpg (Datei) |  |
87 KB | Struktur eines Tropischen Wirbelsturms. Das warme Meerwasser führt zu starker Verdunstung (dünne blaue Pfeile links). Die aufsteigende Feuchtigkeit kondensiert und verursacht heftige Niederschläge (blaue dicke Pfeile und Tropfen rechts). Sturmfluten… | 1 |
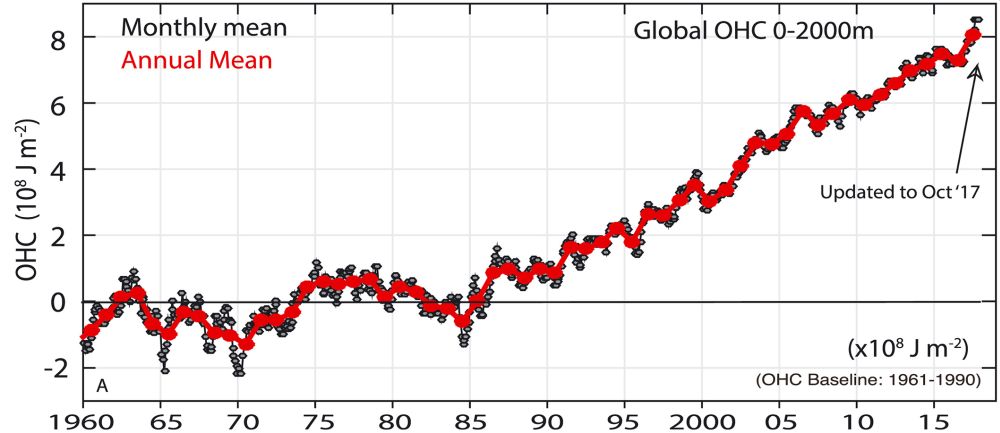
| 18:25, 6. Sep. 2020 | OHC 1950-2017.jpg (Datei) |  |
57 KB | Änderung des Wärmegehalts des globalen Ozeans für die oberen 2000 m in 108 Joule/m2 im Vergleich zum Mittel 1961-1990 ==Lizenzhinweis== {| style="border:1px solid #8888aa; background-color:#f7f8ff;padding:5px;font-size:95%;" | Quelle: Trenberth, K.… | 1 |
