Von Dieter Kasang hochgeladene Dateien
Aus Klimawandel
Diese Spezialseite listet alle hochgeladenen Dateien auf.
| Datum | Name | Vorschaubild | Größe | Beschreibung | Versionen |
|---|---|---|---|---|---|
| 19:35, 6. Feb. 2020 | SLR 2100 SROCC.jpg (Datei) |  |
57 KB | Anstieg des globalen Meeresspiegels nach den Szenarien RCP2.6 und RCP8.5 bis 2100 == Lizenzhinweis == {| style="border:1px solid #8888aa; background-color:#f7f8ff;padding:5px;font-size:95%;" |Quelle: IPCC Special Report on the Ocean and Cryosphere in a… | 1 |
| 17:31, 28. Jan. 2020 | N-S-Wales wilfire2019-20 CO2emissions.jpg (Datei) |  |
22 KB | CO2-Emissionen durch die Buschbrände in New South Wales zwischen dem 1. September 2019 und dem 6. Januar 2020 ==Lizenzhinweis== {| style="border:1px solid #8888aa; background-color:#f7f8ff;padding:5px;font-size:95%;" | Quelle: Copernicus (2020): [ht… | 1 |
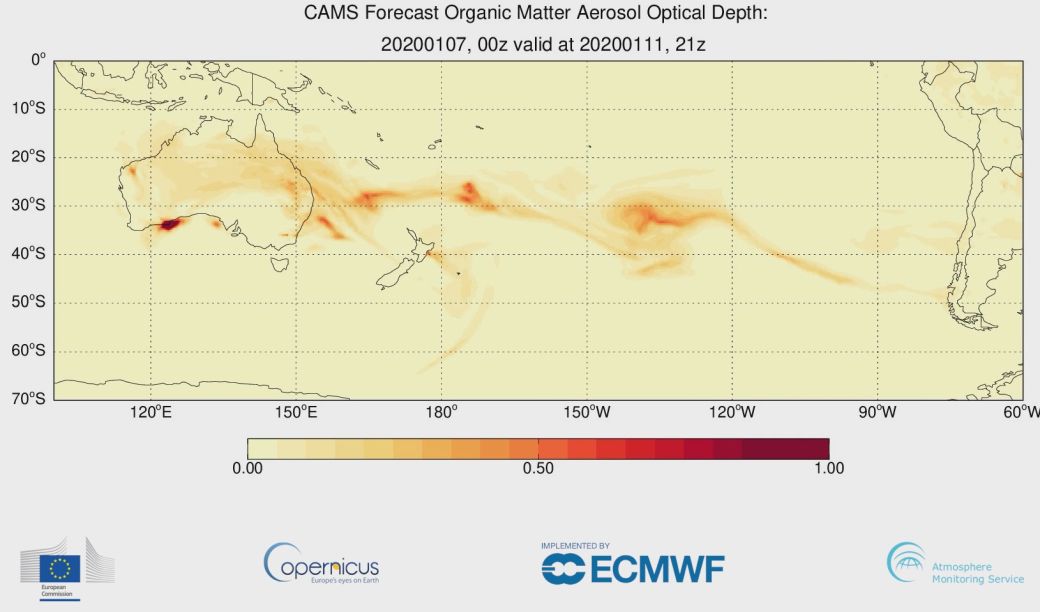
| 17:28, 28. Jan. 2020 | Australia wildfire aerosols.jpg (Datei) |  |
69 KB | Zugbahn der Rauchschwaden der Brände in Australien über den Südpazifik, gemessen in Aerosol Optische Dicke (Abschwächung der Sonnenstrahlung durch atmosphärische Trübung). ==Lizenzhinweis== {| style="border:1px solid #8888aa; background-color:… | 1 |
| 17:25, 28. Jan. 2020 | FFDI accumulated spring1950-2019.jpg (Datei) |  |
55 KB | Über die Tage im Frühjahr akkumulierter Feuer-Gefahren-Index (FFDI) in Australien 1950-2019. ==Lizenzhinweis== {| style="border:1px solid #8888aa; background-color:#f7f8ff;padding:5px;font-size:95%;" | Quelle: Australian Government. Bureau of Met… | 1 |
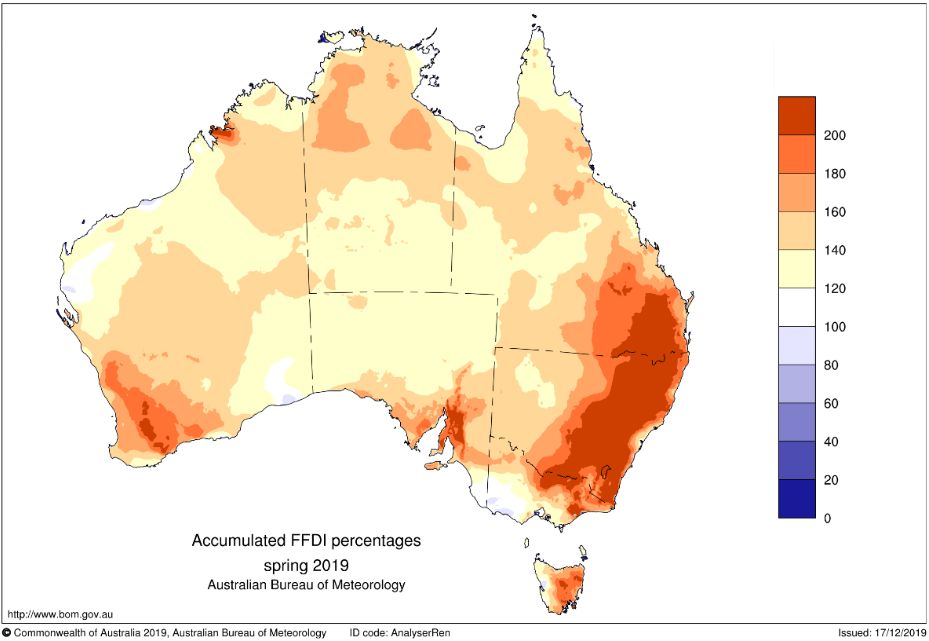
| 17:21, 28. Jan. 2020 | FFDI accumulated spring2019.jpg (Datei) |  |
58 KB | Über alle Tage im Frühjahr 2019 akkumulierter Feuer-Gefahren-Index (FFDI) in % zum langjährigen Mittel 1950-2018. ==Lizenzhinweis== {| style="border:1px solid #8888aa; background-color:#f7f8ff;padding:5px;font-size:95%;" | Quelle: Special Climate… | 1 |
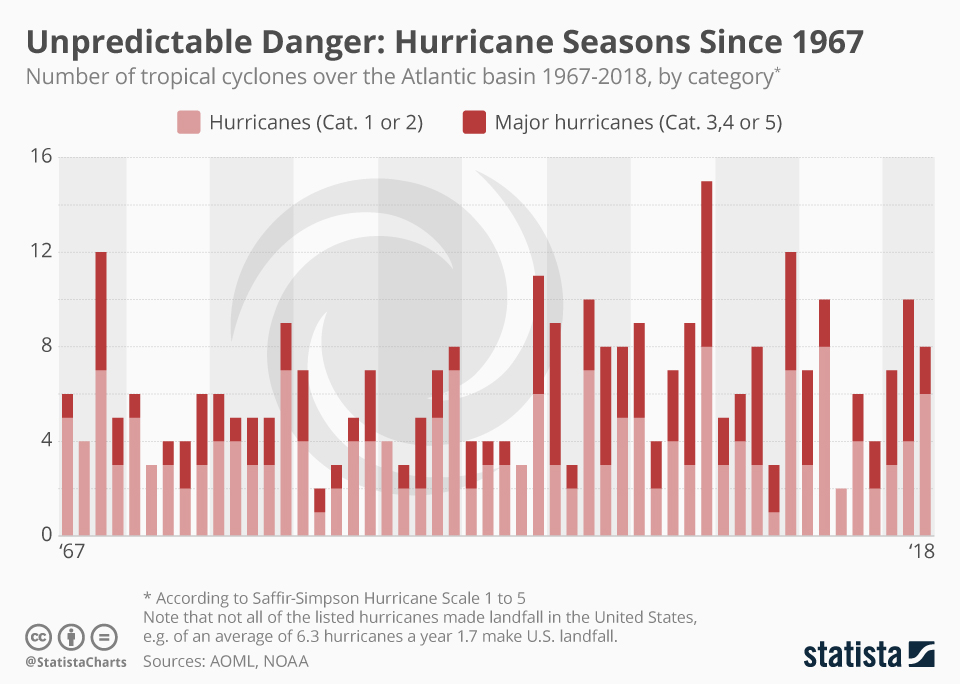
| 17:02, 24. Jan. 2020 | Hurricanes1967-2018.jpg (Datei) |  |
193 KB | Anzahl der Hurrikane im Atlantik 1967-2018 ==Lizenzhinweis== {| style="border:1px solid #8888aa; background-color:#f7f8ff;padding:5px;font-size:95%;" | Quelle: Buchholz, K. (2019): Unpredictable Danger: Hurricane Seasons Since 1967 https://www.statista… | 1 |
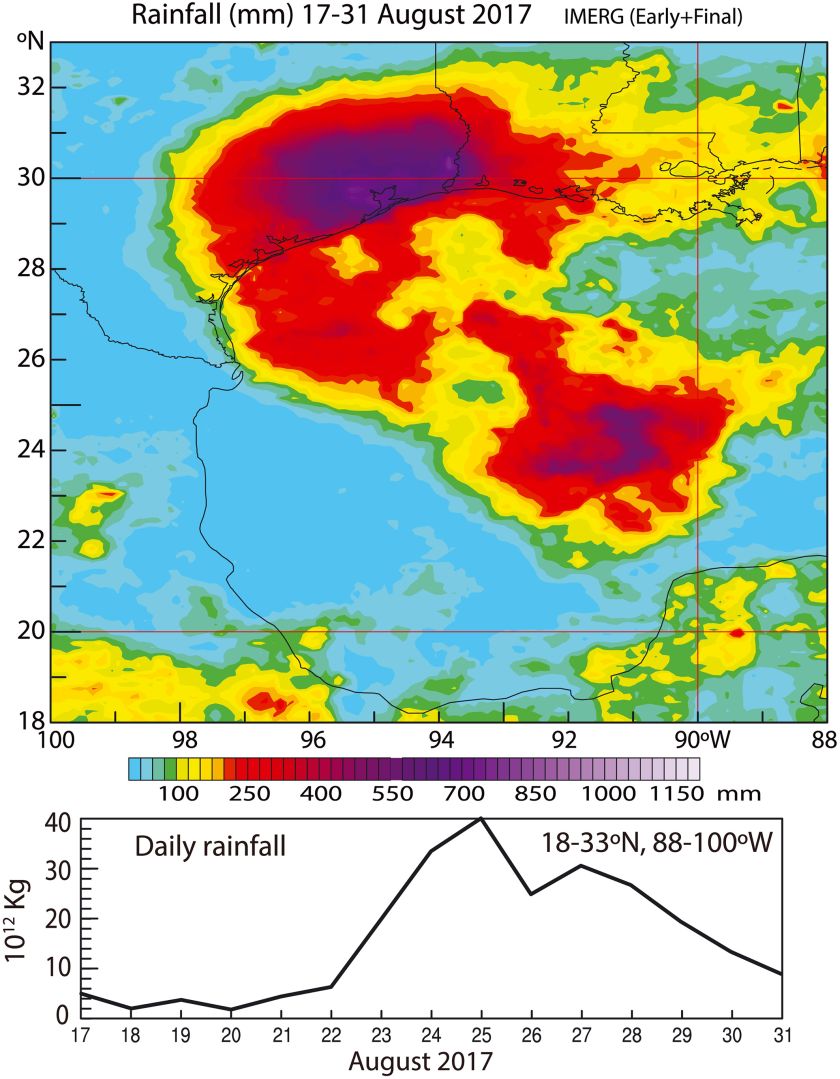
| 16:45, 24. Jan. 2020 | Harvey rain august2017sm.jpg (Datei) |  |
139 KB | Akkumulierter Niederschlag während des Hurrikans Harvey zwischen dem 17. Und 31. August 2017 (oben). Unten: Tagesniederschläge in 1012 kg; 10 Einheiten 0 7,55 mm. ==Lizenzhinweis== {| style="border:1px solid #8888aa; background-color:#f7f8ff;padding:… | 1 |
| 10:11, 24. Jan. 2020 | Tropical storm tracks N-Atlantic2017sm.jpg (Datei) |  |
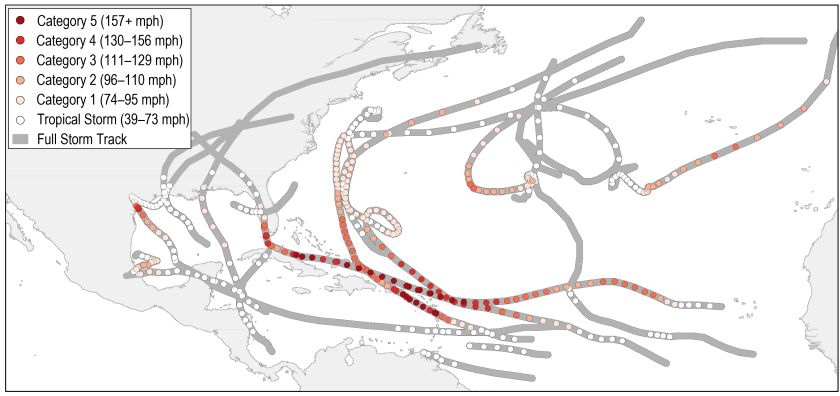
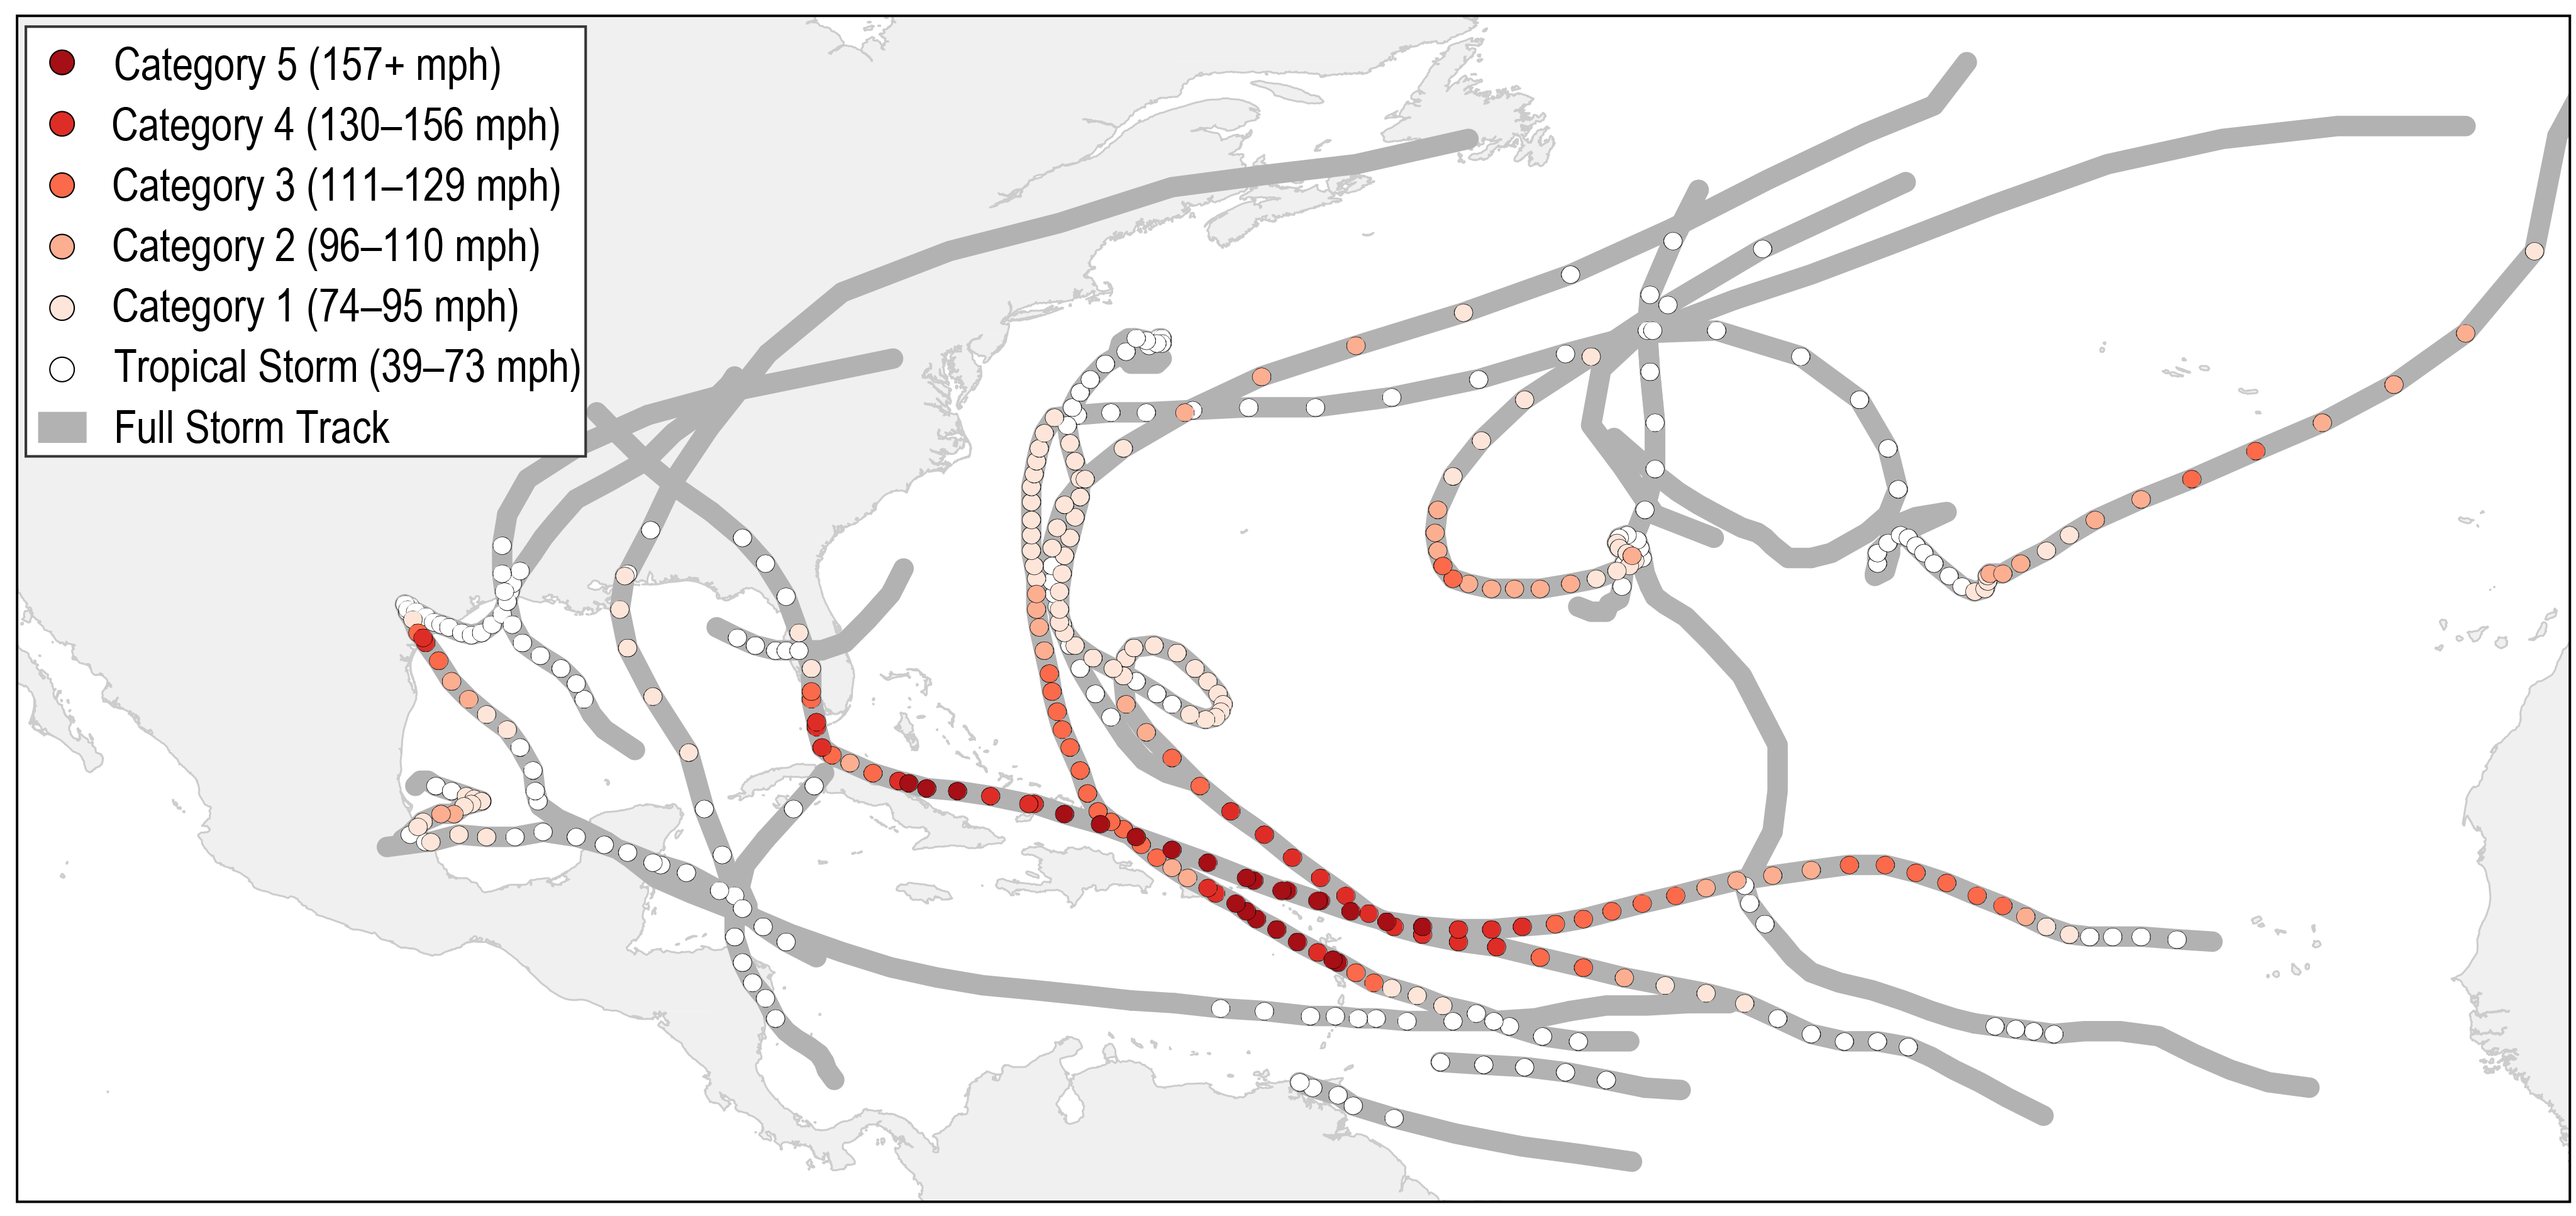
51 KB | Zugbahnen von Hurrikanen 2017 im Nordatlantik ==Lizenzhinweis== {| style="border:1px solid #8888aa; background-color:#f7f8ff;padding:5px;font-size:95%;" | Quelle: Hayhoe, K., D.J. Wuebbles, D.R. Easterling, D.W. Fahey, S. Doherty, J. Kossin, W. Sweet,… | 1 |
| 10:07, 24. Jan. 2020 | Tropical storm tracks N-Atlantic2017.png (Datei) |  |
875 KB | Zugbahnen von Hurrikanen 2017 im Nordatlantik ==Lizenzhinweis== {| style="border:1px solid #8888aa; background-color:#f7f8ff;padding:5px;font-size:95%;" | Quelle: Hayhoe, K., D.J. Wuebbles, D.R. Easterling, D.W. Fahey, S. Doherty, J. Kossin, W. Sweet,… | 1 |
| 19:26, 21. Jan. 2020 | Australia rainfall 2018-2019.gif (Datei) |  |
71 KB | Abweichung der Niederschläge 2018-2019 vom langjährigen Mittel. ==Lizenzhinweis== {| style="border:1px solid #8888aa; background-color:#f7f8ff;padding:5px;font-size:95%;" | Quelle: Australian Government. Bureau of Meteorology (2020): Australian Gover… | 1 |
| 16:39, 20. Jan. 2020 | Iceland Okjökull1986 2019.jpg (Datei) |  |
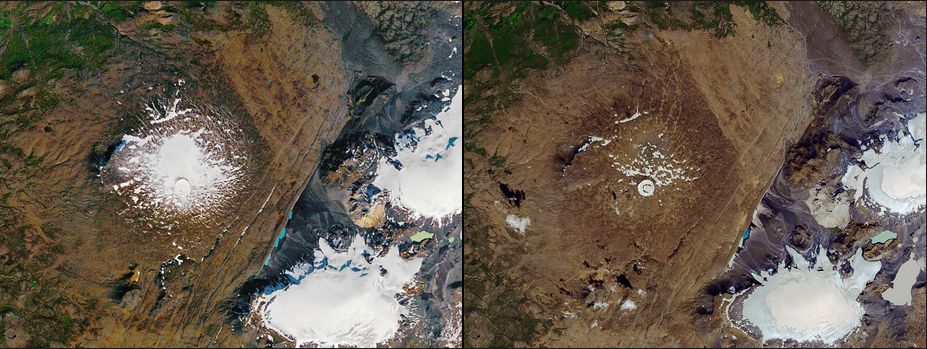
96 KB | Der Gletscher Okjökull auf dem Vulkan Ok 1986 und 2019: Tod eines Gletschers == Lizenzhinweis == {| style="border:1px solid #8888aa; background-color:#f7f8ff;padding:5px;font-size:95%;" | Quelle: NASA (2019): Images of change, https://climate.nasa.go… | 1 |
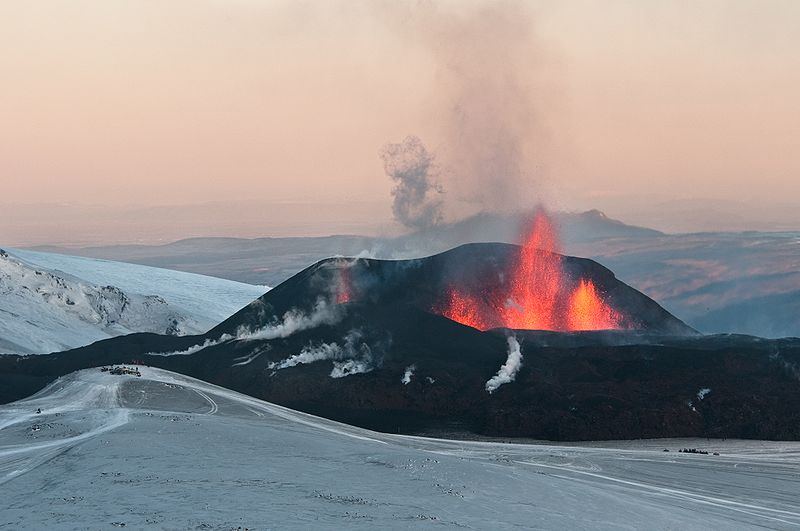
| 16:35, 20. Jan. 2020 | Eyjafjallajökull first crater.jpg (Datei) |  |
50 KB | Der erste Krater des Eyjafjallajökull am 29.3.2010 == Lizenzhinweis == {| style="border:1px solid #8888aa; background-color:#f7f8ff;padding:5px;font-size:95%;" | Quelle: Wikimedia Commons (2010): Eyjafjallajökull first crater, https://commons.wikime… | 1 |
| 16:28, 20. Jan. 2020 | Iceland Eyjafjallajökull glacier.jpg (Datei) |  |
86 KB | Der Eyjafjallajökull Gletscher. Schwarze Linie: Ausdehnung des Gletschers im August 2010, ca. 4 Monate nach dem Vulkanausbruch, der nach Norden einen Kanal von geschmolzenem Eis hinterließ. == Lizenzhinweis == {| style="border:1px solid #8888aa; bac… | 1 |
| 16:25, 20. Jan. 2020 | Iceland glacier magma.jpg (Datei) |  |
18 KB | Schematische Darstellung eines isländischen Gletschers über einer hochliegenden Magmakammer. Der geothermale Wärmefluss kann den Gletscher von unten schmelzen und zur Entstehung eines subglazialen Sees führen. An der Oberfläche des Gletschers ergi… | 1 |
| 16:22, 20. Jan. 2020 | Iceland volcanic zones.jpg (Datei) |  |
41 KB | Mittlere Jahresniederschläge auf Island 1971-2000Ungefähr 60 % der isländischen Gletscher liegen über aktiven Vulkanzonen == Lizenzhinweis == {| style="border:1px solid #8888aa; background-color:#f7f8ff;padding:5px;font-size:95%;" | Quelle: Björn… | 1 |
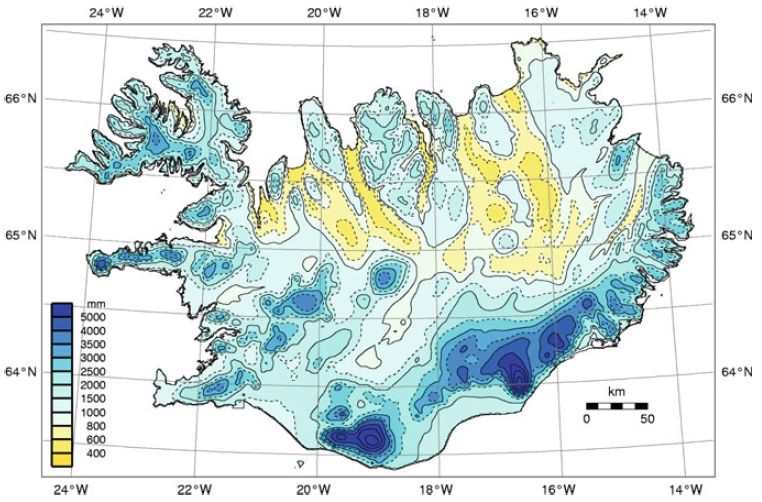
| 16:19, 20. Jan. 2020 | Iceland precipitation.jpg (Datei) |  |
85 KB | Mittlere Jahresniederschläge auf Island 1971-2000 == Lizenzhinweis == {| style="border:1px solid #8888aa; background-color:#f7f8ff;padding:5px;font-size:95%;" | Quelle: Björnsson (2017): The Glaciers of Iceland. A Historical, Cultural and Scientific… | 1 |
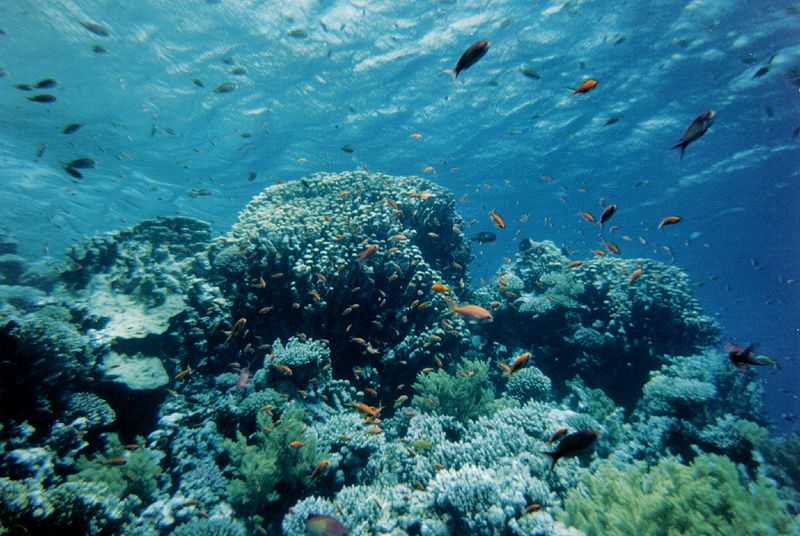
| 20:13, 15. Jan. 2020 | Korallen Ras Mohammed.jpg (Datei) |  |
102 KB | Fische im Korallenrifff in den Malediven ==Lizenzhinweis== {| style="border:1px solid #8888aa; background-color:#f7f8ff;padding:5px;font-size:95%;" | Wikimedia Commons: [https://commons.wikimedia.org/wiki/File:Riff95.jpg Riff rotes Meer].<br /> Datei:… | 1 |
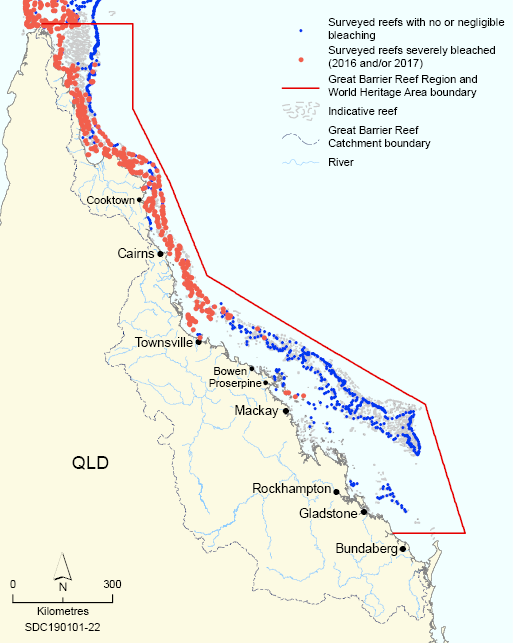
| 19:36, 15. Jan. 2020 | GreatBarrier bleaching 2017.png (Datei) |  |
119 KB | Starke Korallenbleiche im Great Barrier Reef 2016 bzw. 2017 ==Lizenzhinweis== {| style="border:1px solid #8888aa; background-color:#f7f8ff;padding:5px;font-size:95%;" | Quelle: Great Barrier Reef Outlook Report 2019, in Brief, http://www.gbrmpa.gov.au… | 1 |
| 19:19, 15. Jan. 2020 | Cyclone Zidr 2007.jpg (Datei) |  |
199 KB | Windgeschwindigkeiten und Zugbahn während des Kat. 4- Zyklons Sidr am 15 Nov. 2007 über dem Ganges-Brahmaputra-Delta ==Lizenzhinweis== {| style="border:1px solid #8888aa; background-color:#f7f8ff;padding:5px;font-size:95%;" | Quelle: Haque, A., S.… | 1 |
| 19:36, 14. Jan. 2020 | Australia rain1.7.-31.12.2019.gif (Datei) |  |
68 KB | Niederschläge in Australien 1.7.-31.12.2019 in mm ==Lizenzhinweis== {| style="border:1px solid #8888aa; background-color:#f7f8ff;padding:5px;font-size:95%;" | Quelle: Australian Government. Bureau of Meteorology (2020): Six-monthly rainfall totals for… | 1 |
| 19:29, 14. Jan. 2020 | Australia rainfall 2015-2018.gif (Datei) |  |
62 KB | Niederschläge in Australien vom 1. Januar 2015 bis 31. Dezember 2018 in mm ==Lizenzhinweis== {| style="border:1px solid #8888aa; background-color:#f7f8ff;padding:5px;font-size:95%;" | Quelle: Australian Government. Bureau of Meteorology (2020): Forty-… | 1 |
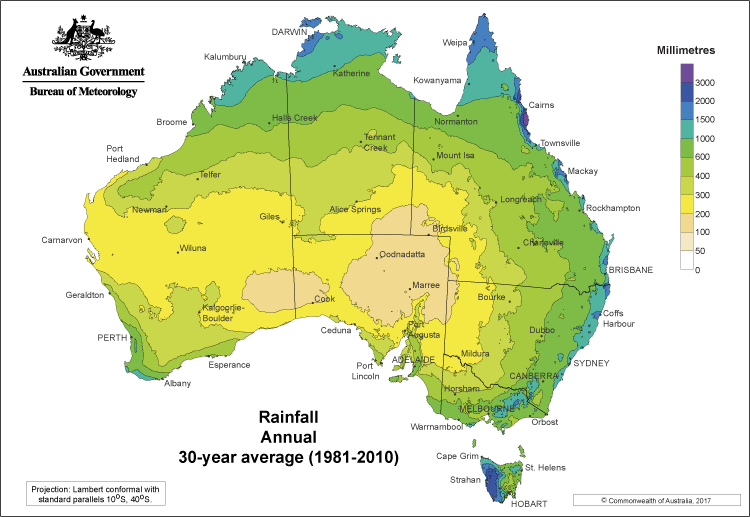
| 19:24, 14. Jan. 2020 | Australia rainfall 1981-2010.png (Datei) |  |
42 KB | Mittlere Jahres-Niederschläge in Australien vom 1981 bis 2010 in mm ==Lizenzhinweis== {| style="border:1px solid #8888aa; background-color:#f7f8ff;padding:5px;font-size:95%;" | Quelle: Australian Government. Bureau of Meteorology (2019): Average annua… | 1 |
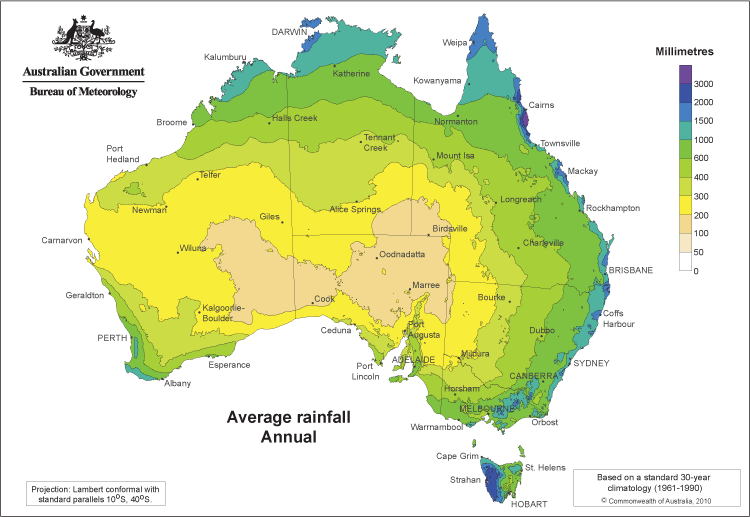
| 19:19, 14. Jan. 2020 | Australia rainfall 1961-1990.png (Datei) |  |
42 KB | Mittlere Jahres-Niederschläge in Australien vom 1961 bis 1990 in mm ==Lizenzhinweis== {| style="border:1px solid #8888aa; background-color:#f7f8ff;padding:5px;font-size:95%;" | Quelle: Australian Government. Bureau of Meteorology (2016): Average annua… | 1 |
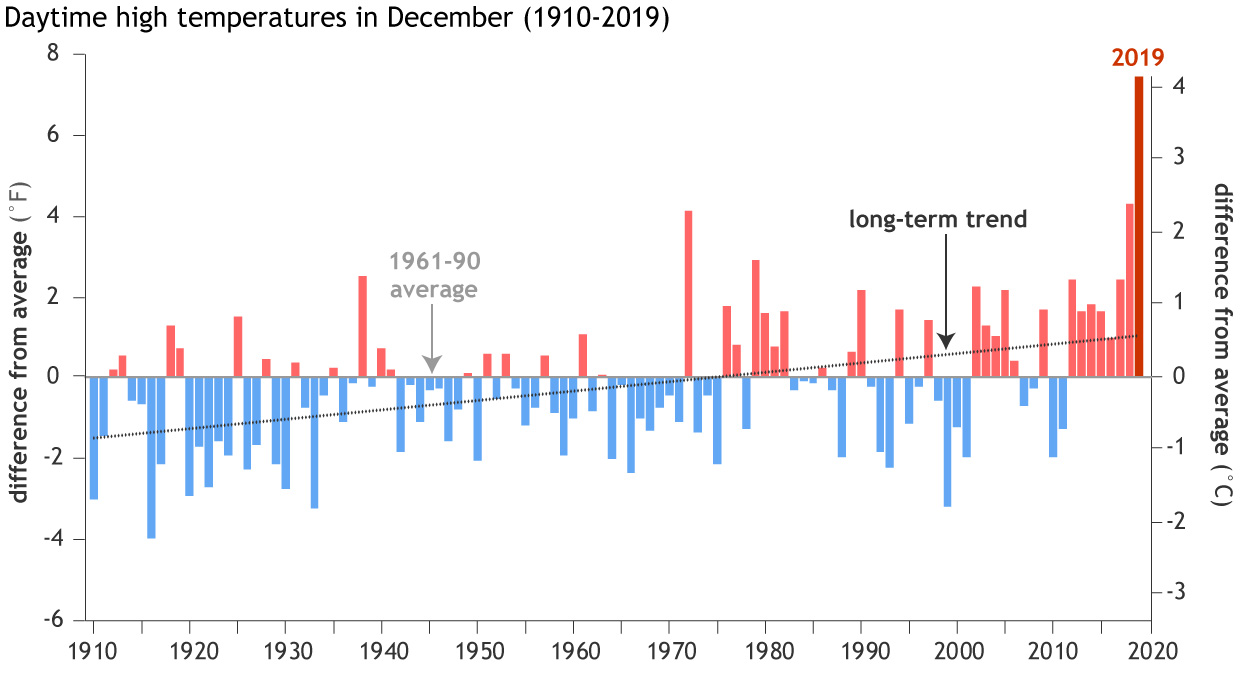
| 19:10, 14. Jan. 2020 | Australia maxtemp dec 1910-2019.jpg (Datei) |  |
114 KB | Monatsmittel der Tageshöchsttemperaturen in Australien im Dezember 1910 bis 2019 in °C ==Lizenzhinweis== {| style="border:1px solid #8888aa; background-color:#f7f8ff;padding:5px;font-size:95%;" | Quelle: NOAA Climate.gov, R. Lindsey (2020): Catastro… | 1 |
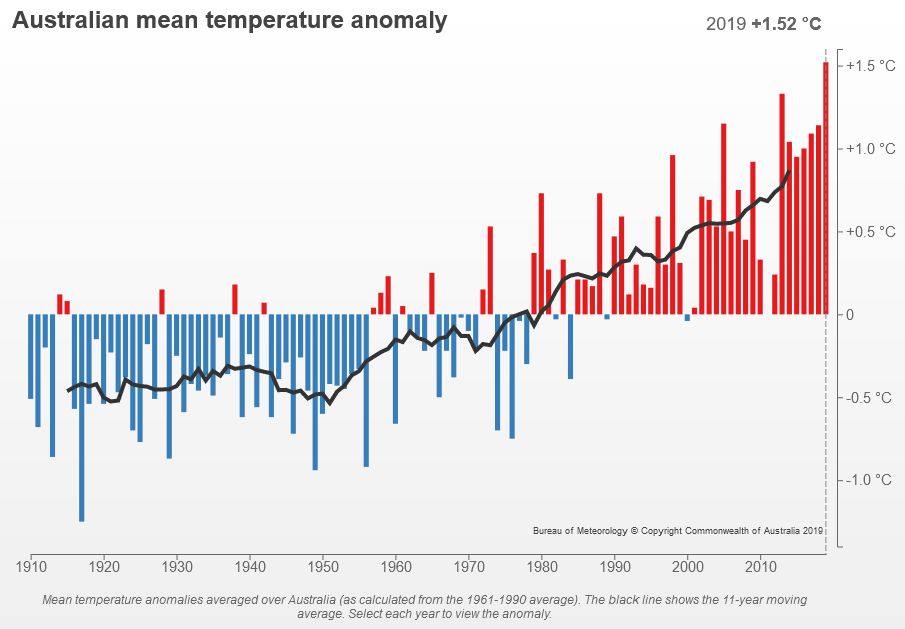
| 19:05, 14. Jan. 2020 | Australia temp 1910-2019.jpg (Datei) |  |
56 KB | Ändedrung der mittleren Jahrestemperatur für Australien 1910-2019 im Vergleich zum Mittel 1961-1990 ==Lizenzhinweis== {| style="border:1px solid #8888aa; background-color:#f7f8ff;padding:5px;font-size:95%;" | Quelle: Australian Government. Bureau of… | 1 |
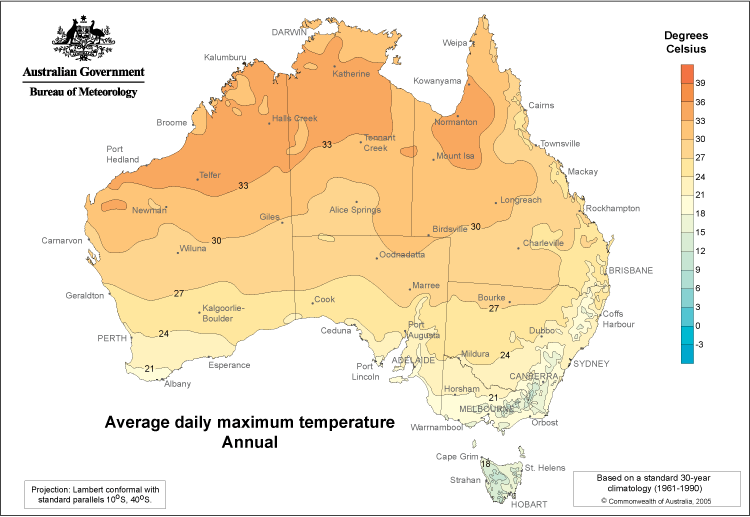
| 19:01, 14. Jan. 2020 | Australia maxtemp 1961-1990.png (Datei) |  |
41 KB | Mittlere Tagesmaximum-Temperaturen pro Jahr in Australien von 1961 bis 1990 in °C ==Lizenzhinweis== {| style="border:1px solid #8888aa; background-color:#f7f8ff;padding:5px;font-size:95%;" | Quelle: Australian Government. Bureau of Meteorology (2016)… | 1 |
| 17:40, 14. Jan. 2020 | Australia temp 1961-1990.png (Datei) |  |
65 KB | Mittlere Jahres-Temperatur in Australien vom 1961 bis 1990 in °C ==Lizenzhinweis== {| style="border:1px solid #8888aa; background-color:#f7f8ff;padding:5px;font-size:95%;" | Quelle: AAustralian Government. Bureau of Meteorology (2016): Average annual… | 1 |
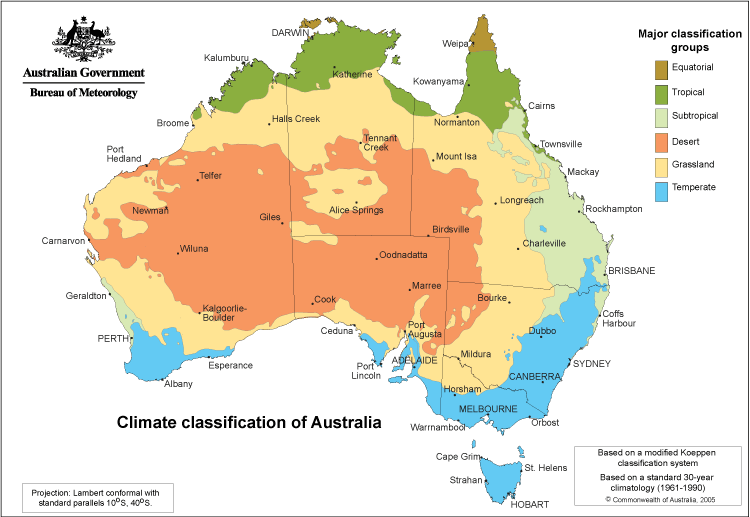
| 17:37, 14. Jan. 2020 | Climate zones Köppen.png (Datei) |  |
59 KB | Klimazonen Australiens, nach Köppen ==Lizenzhinweis== {| style="border:1px solid #8888aa; background-color:#f7f8ff;padding:5px;font-size:95%;" | Quelle: Australian Government. Bureau of Meteorology (2016): [http://www.bom.gov.au/jsp/ncc/climate_averag… | 1 |
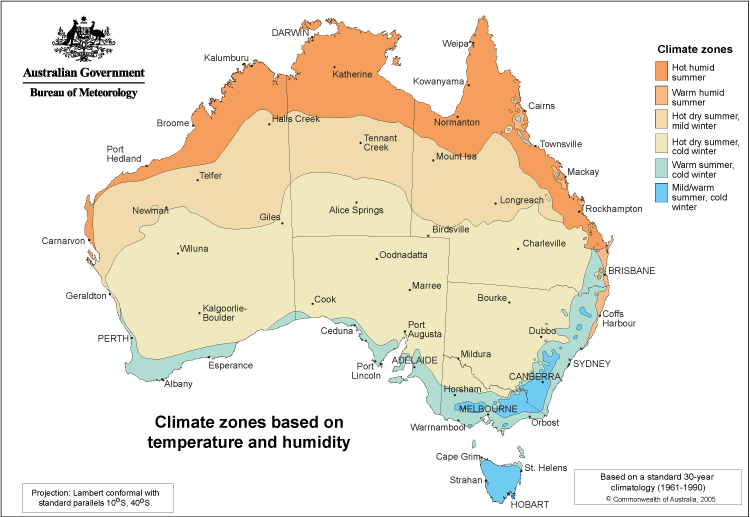
| 17:33, 14. Jan. 2020 | Climate zones.png (Datei) |  |
57 KB | Klimazonen Australiens, basierend auf Temperatur und Feuchte ==Lizenzhinweis== {| style="border:1px solid #8888aa; background-color:#f7f8ff;padding:5px;font-size:95%;" | Quelle: Australian Government. Bureau of Meteorology (2016): Climate classificatio… | 1 |
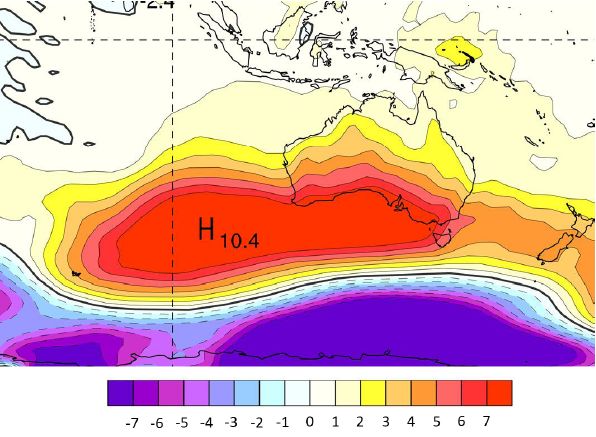
| 16:36, 11. Jan. 2020 | Australia high pressure June2017.jpg (Datei) |  |
58 KB | Luftdruck in Meereshöhe im Juni 2017 als Abweichung vom Mittel 1961-1990 in hPa. == Lizenzhinweis == {| style="border:1px solid #8888aa; background-color:#f7f8ff;padding:5px;font-size:95%;" | Quelle: Australian Government. Bureau of Meteorology (2019… | 1 |
| 16:31, 11. Jan. 2020 | Australia fire 2020 Jan.jpg (Datei) |  |
217 KB | Satellitenbild der Waldbrände in Südost-Australien am 4. Januar 2020 == Lizenzhinweis == {| style="border:1px solid #8888aa; background-color:#f7f8ff;padding:5px;font-size:95%;" | Quelle: NASA Earth Oberservatory (2020): Fires and Smoke Engulf Sout… | 1 |
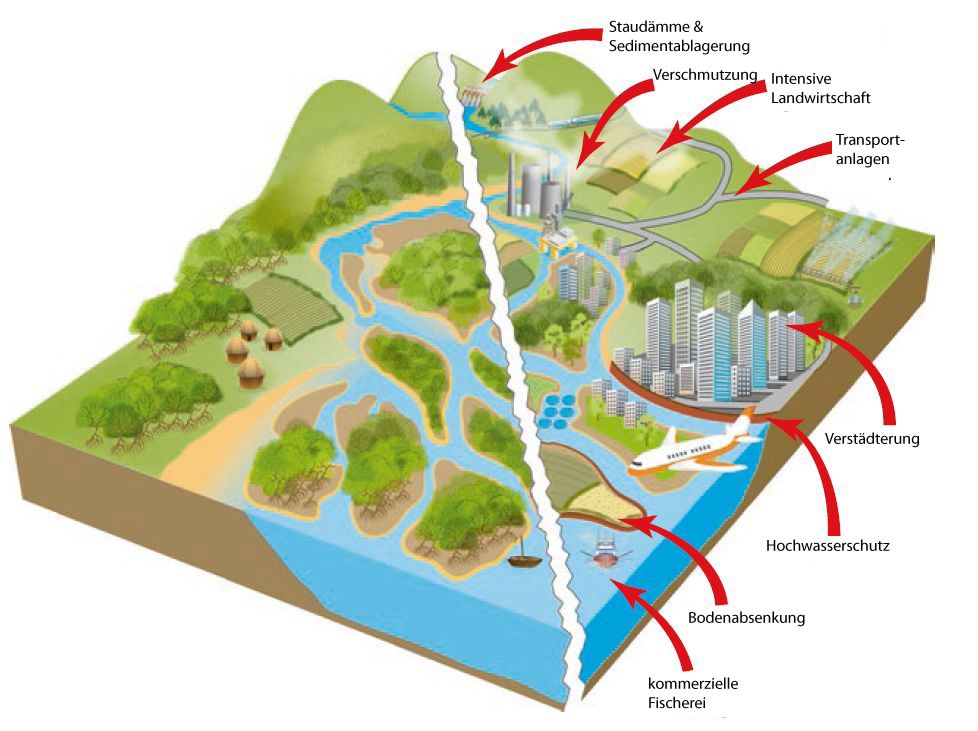
| 15:25, 30. Nov. 2019 | Delta natural anthropo.jpg (Datei) |  |
263 KB | Schematische Darstellung einer natürlichen (links) und einer durch den Menschen veränderten Delta-Landschaft ==Lizenzhinweis== {| style="border:1px solid #8888aa; background-color:#f7f8ff;padding:5px;font-size:95%;" | Quelle: Nicholls, R.J., et al.… | 2 |
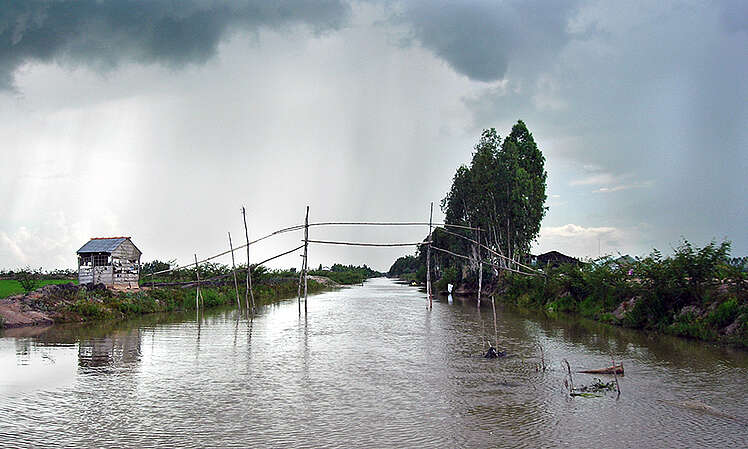
| 12:15, 30. Nov. 2019 | Mekong Delta Landschaft.jpg (Datei) |  |
53 KB | Landschaft im Mekong-Delta ==Lizenzhinweis== {| style="border:1px solid #8888aa; background-color:#f7f8ff;padding:5px;font-size:95%;" | Quelle: Earth System Knowledge Platform, HZG (o.J.): Das Mekong Delta – drastische Änderungen sind wahrscheinlich… | 1 |
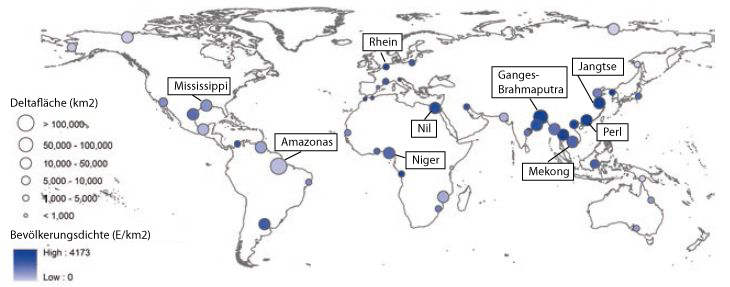
| 12:09, 30. Nov. 2019 | Global deltas population.jpg (Datei) |  |
73 KB | Flucht vor Hochwasser in Bangladesch ==Lizenzhinweis== {| style="border:1px solid #8888aa; background-color:#f7f8ff;padding:5px;font-size:95%;" | Quelle: Nicholls, R.J., et al. (2020): Sustainable Deltas in the Anthropocene, Fig. 11.2, in: Nicholls, R… | 1 |
| 12:51, 29. Nov. 2019 | CO2 consumption territorial.jpg (Datei) |  |
38 KB | CO2-Emissionen der wichtigsten Treibhausgasemittenten territorial und durch eigenen Konsum ==Lizenzhinweis== {| style="border:1px solid #8888aa; background-color:#f7f8ff;padding:5px;font-size:95%;" | Quelle: UN Environment Programme (2019): [https://… | 1 |
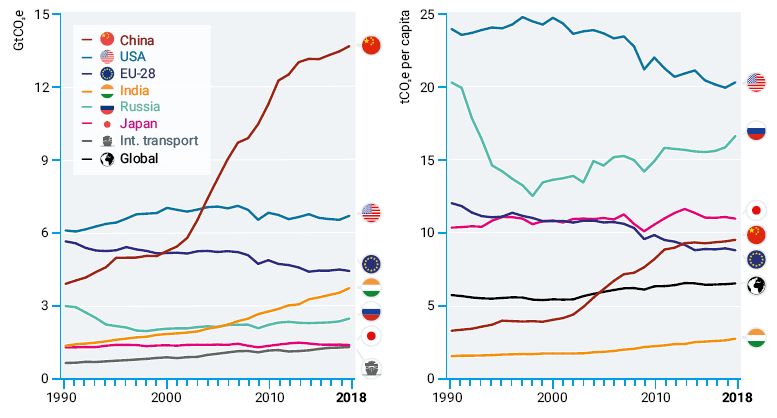
| 12:46, 29. Nov. 2019 | GTCO2e countries+cap1990-2018.jpg (Datei) |  |
45 KB | Absolute und pro-Kopf-Emissionen der wichtigsten Treibhausgasemittenten in GtCO2-Äquivalente (ohne Landnutzung) ==Lizenzhinweis== {| style="border:1px solid #8888aa; background-color:#f7f8ff;padding:5px;font-size:95%;" | Quelle: UN Environment Progra… | 1 |
| 11:31, 27. Nov. 2019 | SLR steric 1957-2017 2000m.png (Datei) |  |
17 KB | Sterischer Meeresspiegelanstieg 1955-2017: Komponenten des sterischen Meeresspiegelanstiegs ==Lizenzhinweis== {| style="border:1px solid #8888aa; background-color:#f7f8ff;padding:5px;font-size:95%;" | Quelle: NOAA (2019): Global Ocean Heat and Salt Co… | 1 |
| 11:18, 27. Nov. 2019 | SLR influences.jpg (Datei) |  |
33 KB | Prozesse, die Meerespiegeländerungen beeinflussen können ==Lizenzhinweis== {| style="border:1px solid #8888aa; background-color:#f7f8ff;padding:5px;font-size:95%;" | Quelle: IPCC (2013): Climate Change 2013, Working Group I: The Science of Climate C… | 1 |
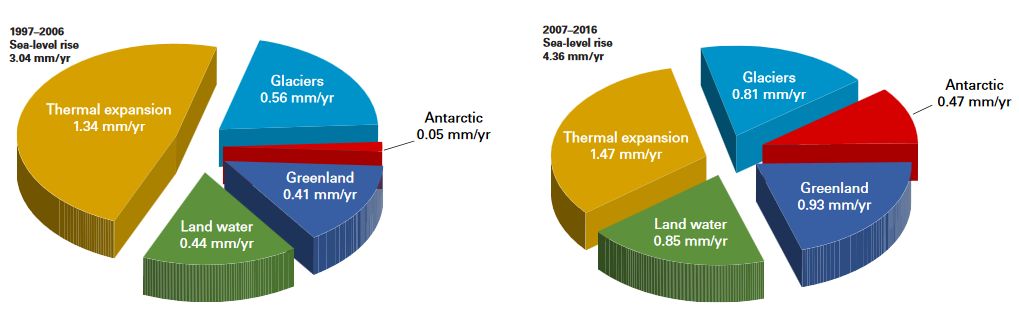
| 11:08, 27. Nov. 2019 | SLR causes1997-2006 2007-2016.jpg (Datei) |  |
40 KB | Anteil verschiedener Ursachen an der globalen Meeresspiegelanstiegsrate 1997-2006 und 2007-2016 ==Lizenzhinweis== {| style="border:1px solid #8888aa; background-color:#f7f8ff;padding:5px;font-size:95%;" | Quelle:WMO (2019): The Global Climate in 2015… | 1 |
| 11:02, 27. Nov. 2019 | Glaciers mass change1960-2019.jpg (Datei) |  |
34 KB | Jährlicher Massenverlust der Gletscher der Erde nach dem World Glacier Monitoring Service (WGMS) einschließlich 5-Jahres-Mittel (schwarze Balken) ==Lizenzhinweis== {| style="border:1px solid #8888aa; background-color:#f7f8ff;padding:5px;font-size:95%… | 1 |
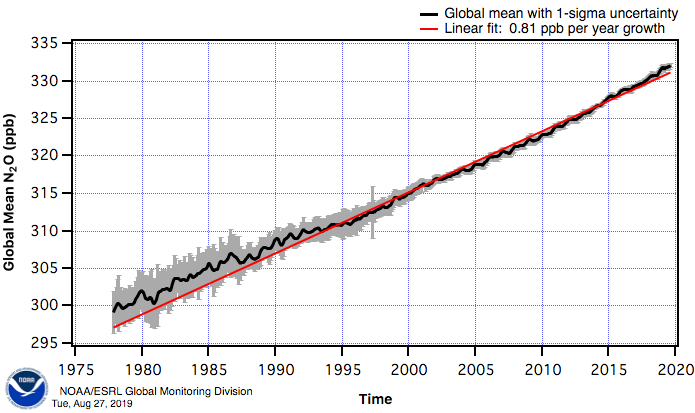
| 20:01, 21. Nov. 2019 | N2O global.png (Datei) |  |
46 KB | Atmosphärische globale Konzentration von Distickstoffoxid (N2O) 1977-2019 ==Lizenzhinweis== {| style="border:1px solid #8888aa; background-color:#f7f8ff;padding:5px;font-size:95%;" | NOAA Earth System Research Laboratory (2019): Nitrous Oxide (N2O)… | 1 |
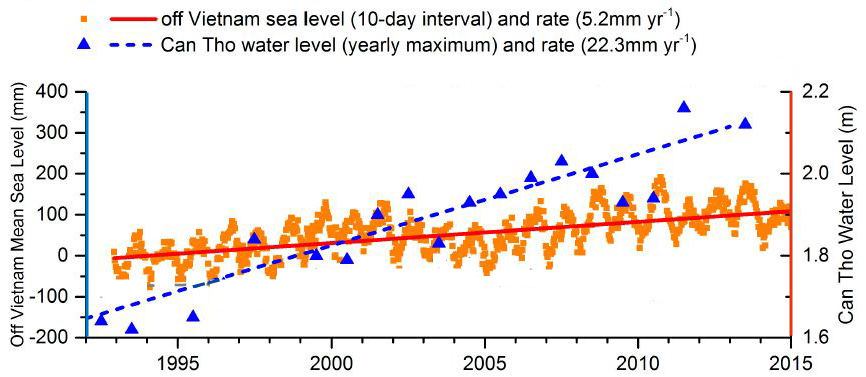
| 11:16, 20. Nov. 2019 | Mekong CanTho water-level rate.jpg (Datei) |  |
174 KB | Wasserniveau vor der Küste Vietnams (orange) und in Can Tho (blau) mit Angaben zur Anstiegsrate über den Zeitraum 1992-2015 ==Lizenzhinweis== {| style="border:1px solid #8888aa; background-color:#f7f8ff;padding:5px;font-size:95%;" | Quelle: Takagi,… | 1 |
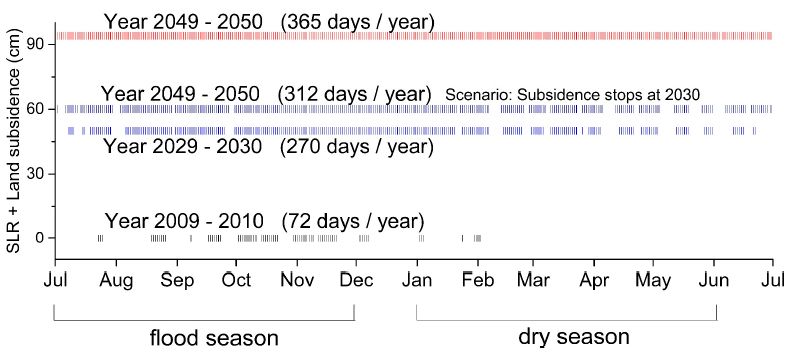
| 10:38, 20. Nov. 2019 | Mekong CanTho SLR subsidence.jpg (Datei) |  |
45 KB | Verteilung der Tage, an denen die Hauptstraße in Can Tho überflutet ist: gegenwärtig (2009/10) und zukünftig (2029/30; 2049/50 mit und ohne Maßnahmen zur Beendigung der Bodenabsenkung) ==Lizenzhinweis== {| style="border:1px solid #8888aa; backgro… | 1 |
| 10:23, 20. Nov. 2019 | Mekong-delta subsidence rate.jpg (Datei) |  |
40 KB | Bodenabsenkungsrate durch Grundwasserentnahme 2015 in cm/Jahr ==Lizenzhinweis== {| style="border:1px solid #8888aa; background-color:#f7f8ff;padding:5px;font-size:95%;" | Quelle: Minderhoud, P. S. J., Erkens, G., Pham, V. H., Bui, V. T., Erban, L., Ko… | 1 |
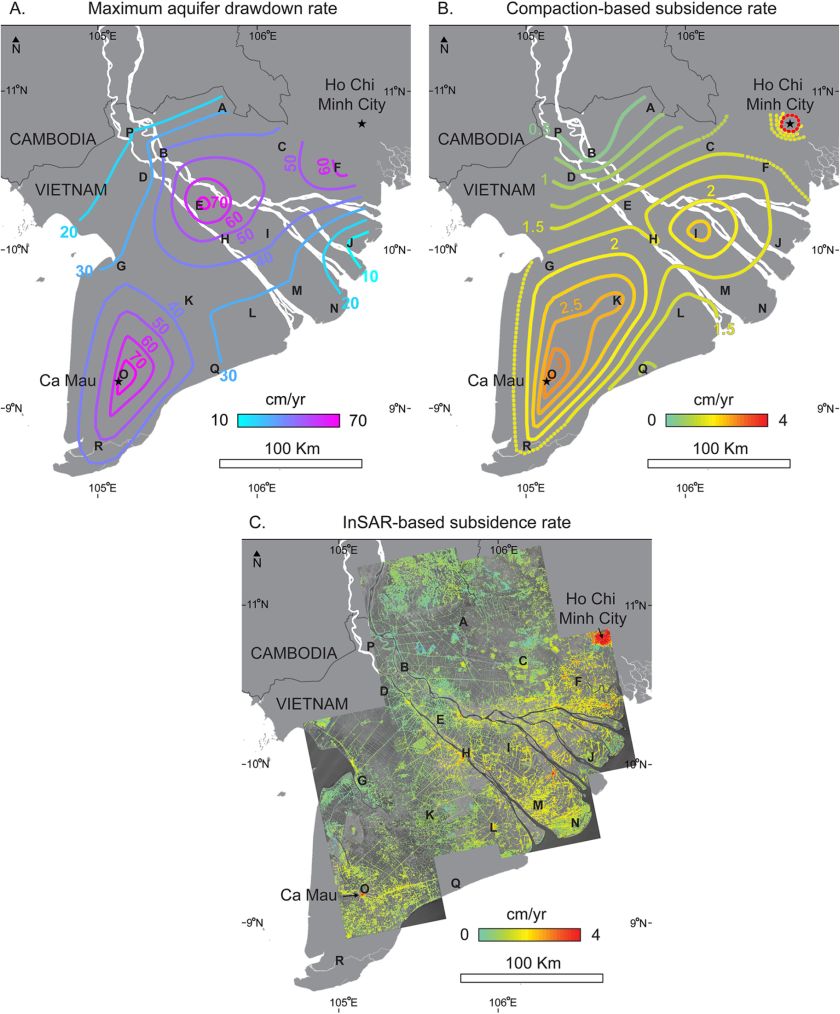
| 10:16, 20. Nov. 2019 | Mekong groundwater compaction subsidence.jpg (Datei) |  |
149 KB | Grundwasserabsenkung, Bodenverdichtung und Subsidenz im Mekong-Delta ==Lizenzhinweis== {| style="border:1px solid #8888aa; background-color:#f7f8ff;padding:5px;font-size:95%;" | Quelle: Erban, L. E., Gorelick, S. M., & Zebker, H. A. (2014). Groundwat… | 1 |
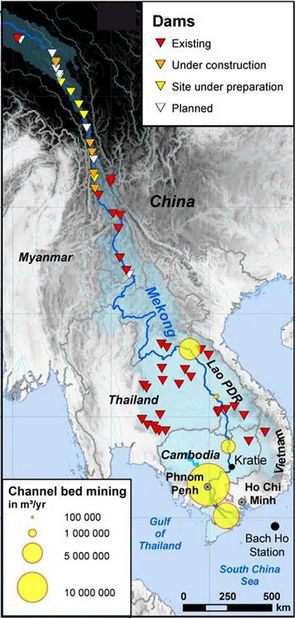
| 10:12, 20. Nov. 2019 | Mekong dams existing future.jpg (Datei) |  |
146 KB | Vorhandene und geplante Staudämme am Mekong und seinen Nebenflüssen ==Lizenzhinweis== {| style="border:1px solid #8888aa; background-color:#f7f8ff;padding:5px;font-size:95%;" | Quelle: Schmitt, R. J. P. , S. Bizzi, A. Castelletti, J. J. Opperman, G… | 2 |
| 09:54, 20. Nov. 2019 | Mekong belowSL 1mSLR.jpg (Datei) |  |
315 KB | Bei einem Meeresspiegelanstieg von 1 m werden 75 % des Deltagebietes unter dem Meeresspiegel liegen. ==Lizenzhinweis== {| style="border:1px solid #8888aa; background-color:#f7f8ff;padding:5px;font-size:95%;" | Quelle: Minderhoud, P.S.J., Coumou, L.,… | 3 |
| 20:53, 19. Nov. 2019 | Elevation S SE-Asia.jpg (Datei) |  |
93 KB | Durch den Meeresspiegelanstieg gefährdete Regionen in S- und SO-Asien mit einer geringen Erhebung über dem Meeresspiegel ==Lizenzhinweis== {| style="border:1px solid #8888aa; background-color:#f7f8ff;padding:5px;font-size:95%;" | Quelle: Di Libert… | 2 |
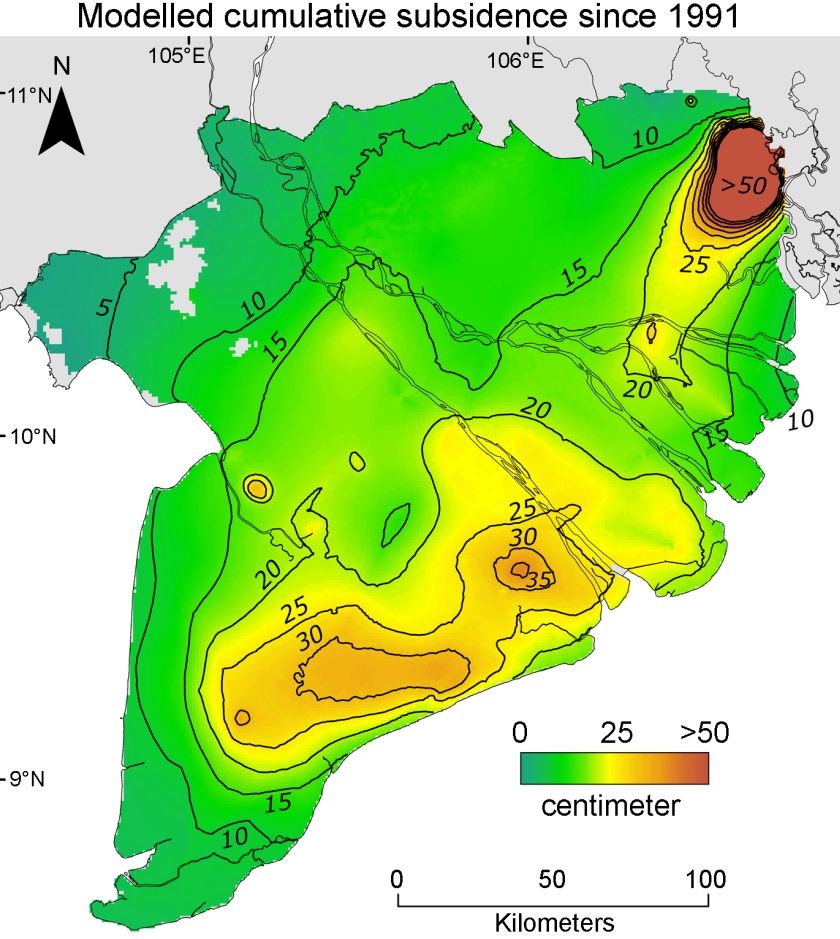
| 20:33, 19. Nov. 2019 | Mekong-delta subsidence groundw.jpg (Datei) |  |
125 KB | Höhenkarte des Mekong-DeltasSubsidenz durch Grundwasserentnahme 1991-2016 in cm ==Lizenzhinweis== {| style="border:1px solid #8888aa; background-color:#f7f8ff;padding:5px;font-size:95%;" | Quelle: Minderhoud, P. S. J., Erkens, G., Pham, V. H., Bui, V… | 1 |
| 20:21, 19. Nov. 2019 | Mekong dams.jpg (Datei) |  |
111 KB | Vorhandene und geplante Staudämme am Mekong ==Lizenzhinweis== {| style="border:1px solid #8888aa; background-color:#f7f8ff;padding:5px;font-size:95%;" | Quelle: Anthony, E.J, G. Brunier, M. Besset, M. Goichot, F. Dussouillez, and V.L. Nguyen (2015):… | 1 |
