Von Dieter Kasang hochgeladene Dateien
Aus Klimawandel
Diese Spezialseite listet alle hochgeladenen Dateien auf.
| Datum | Name | Vorschaubild | Größe | Beschreibung | Versionen |
|---|---|---|---|---|---|
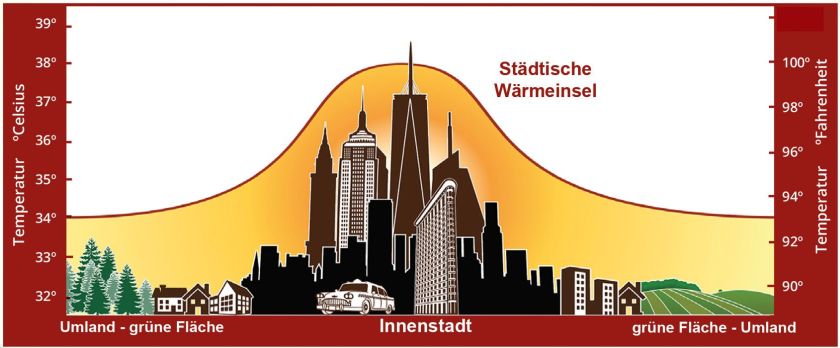
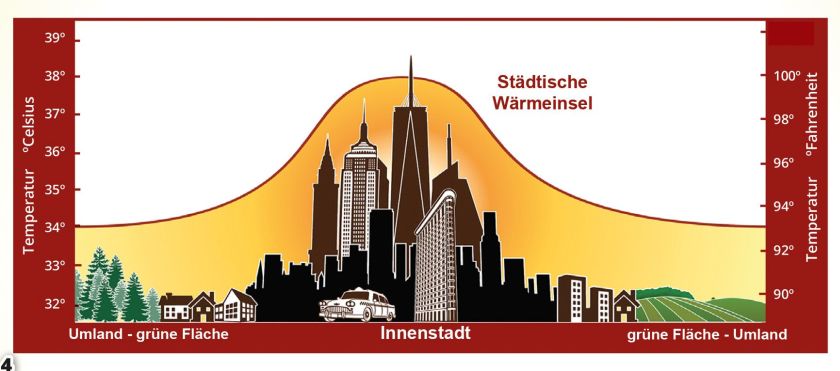
| 20:44, 30. Okt. 2019 | Urban Heat Island.jpg (Datei) |  |
47 KB | Städtische Wärmeinsel in New York City an einem heißen Sommertag. Der Temperaturunterschied zum Umland beträgt 4 °C. ==Lizenzhinweis== {| style="border:1px solid #8888aa; background-color:#f7f8ff;padding:5px;font-size:95%;" | Quelle: NASA, eoKids… | 1 |
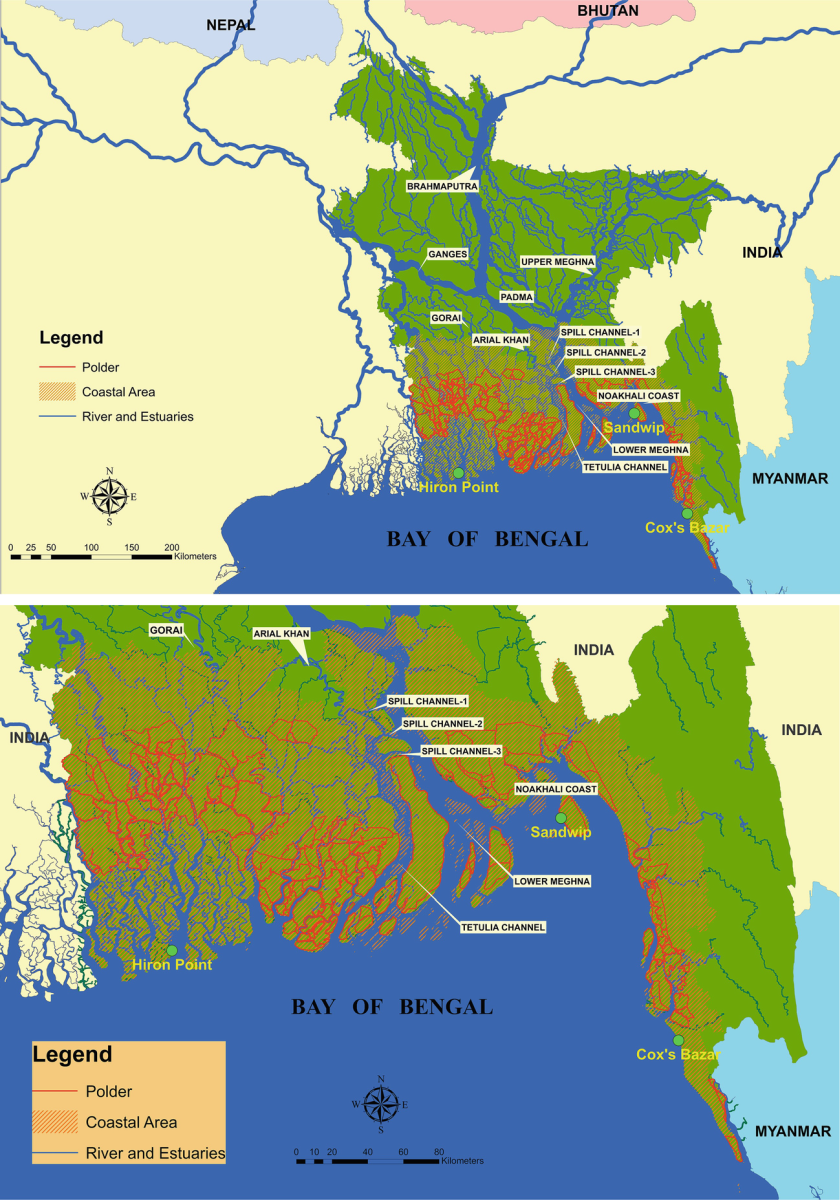
| 16:39, 28. Okt. 2019 | Floods GBM Ddelta.png (Datei) |  |
999 KB | Flusssystem (oben) und Küstenzone (unten) in Bangladesch. Grüne Punkte: Pegelmessstationen. ==Lizenzhinweis== {| style="border:1px solid #8888aa; background-color:#f7f8ff;padding:5px;font-size:95%;" | Quelle: Haque, A., & Nicholls, R. J. (2018): Fl… | 2 |
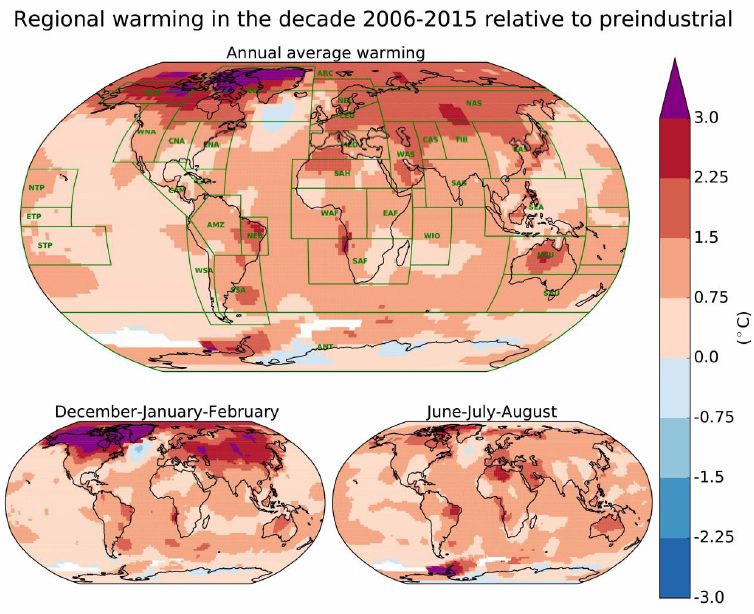
| 13:46, 24. Okt. 2019 | Regional warming2006-2015.jpg (Datei) |  |
96 KB | Regionale Erwärmung 2005-2016 im Vergleich zur vorindustriellen Zeit (1850-1900) im Jahresmittel, im Sommer und im Winter. Grün eingerahmt Großregionen der Erde. WAF=Westafrika usw. (NASA GISTEMP-Datensatz) ==Lizenzhinweis== {| style="border:1px s… | 1 |
| 19:20, 20. Okt. 2019 | Merdeglace 2018.jpg (Datei) |  |
129 KB | Mer de Glace ist der größte Gletscher Frankreichs. Die Seitenmoränen zeigen den Schwund des früheren Gletschers. Aufnahme: 15.9.2018. ==Lizenzhinweis== {| style="border:1px solid #8888aa; background-color:#f7f8ff;padding:5px;font-size:95%;" | Quell… | 1 |
| 19:02, 20. Okt. 2019 | Hochwasser China 2003.jpg (Datei) |  |
78 KB | Hochwasser in China 2003 ==Lizenzhinweis== {| style="border:1px solid #8888aa; background-color:#f7f8ff;padding:5px;font-size:95%;" | Quelle: Flickr (2015): Floods in China 2003, https://www.flickr.com/photos/worldmeteorologicalorganization/23081085519… | 1 |
| 16:55, 20. Okt. 2019 | Hochwasser Zyklon Idai2019.jpg (Datei) |  |
96 KB | Hochwasser während des Zyklons Idai in Mosambik 2019. Die Abb. zeigt mehrere Satellitenaufnahmen übereinander gelegt. Das Hochwassergebiet am 19.3. ist blau und rot eingefärbt. Rot markiert die Bereiche, die auch am 25.3. noch überschwemmt waren. =… | 1 |
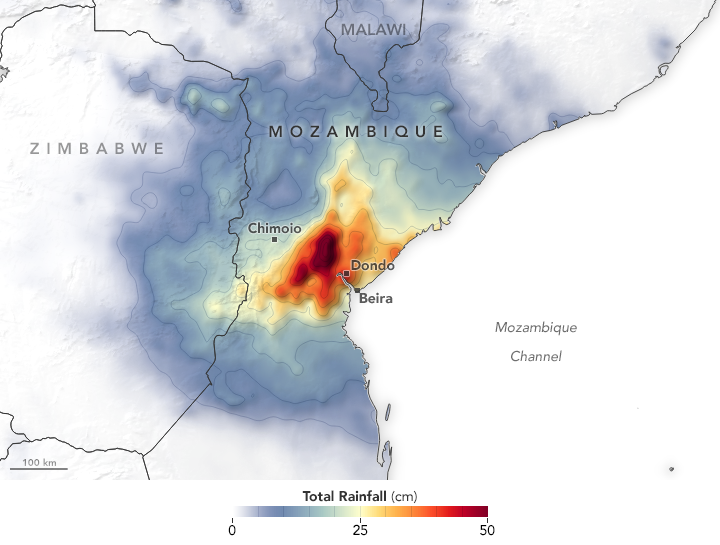
| 16:52, 20. Okt. 2019 | Zyklon Idai Mosambik2019.png (Datei) |  |
298 KB | Niederschlag vom 13. bis 20. März 2019 in cm durch den Zyklon Idai in Mosambik ==Lizenzhinweis== {| style="border:1px solid #8888aa; background-color:#f7f8ff;padding:5px;font-size:95%;" | Quelle: NASA Earth Observatory (2019): [https://earthobservator… | 1 |
| 16:48, 20. Okt. 2019 | Cyclone Idai 13.3.2019.jpg (Datei) |  |
75 KB | Der Zyklon Idai vor der Küste von Mosambik am 13. März 2019 ==Lizenzhinweis== {| style="border:1px solid #8888aa; background-color:#f7f8ff;padding:5px;font-size:95%;" | Quelle: NASA (2019): World View Earthdata, https://worldview.earthdata.nasa.gov/?… | 1 |
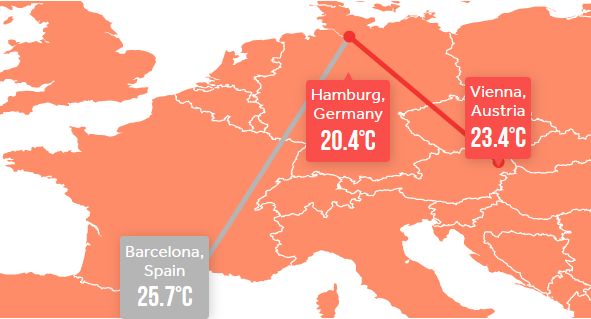
| 14:14, 12. Okt. 2019 | Hamburg-Wien Sommertemp.jpg (Datei) |  |
28 KB | Änderung der Sommertemperaturen in Hamburg bis 2100 bei moderater Emissionensminderung (RCP4.5) und unveränderter Emissionszunahme (RCP8.5). Die Quellenangabe (s.u.) verweist auf eine Seite mit einer interaktiven Karte, auf der die klimatischen Verä… | 1 |
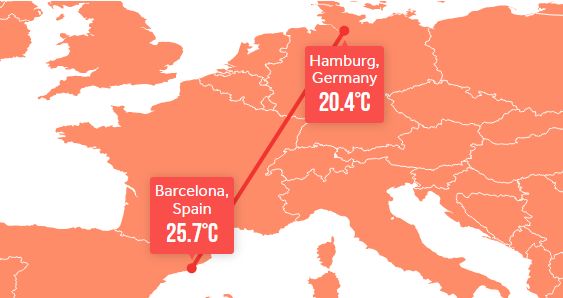
| 13:57, 12. Okt. 2019 | Hamburg-Barcelona.jpg (Datei) |  |
25 KB | Änderung der Sommertemperaturen in Hamburg bis 2100 bei unverminderten Emissionen (RCP8.5) ==Lizenzhinweis== {| style="border:1px solid #8888aa; background-color:#f7f8ff;padding:5px;font-size:95%;" | Quelle: Climate Central, Kahn, B. (2017): This Is H… | 1 |
| 13:29, 11. Okt. 2019 | Rockefeller Center rooftop.jpg (Datei) |  |
120 KB | Dachbegrünung auf dem Rockefeller Center ==Lizenzhinweis== {| style="border:1px solid #8888aa; background-color:#f7f8ff;padding:5px;font-size:95%;" | Quelle: Wikimedia Commons, Jwilly77 (2008): https://commons.wikimedia.org/wiki/File:30_Rockefeller_Ce… | 1 |
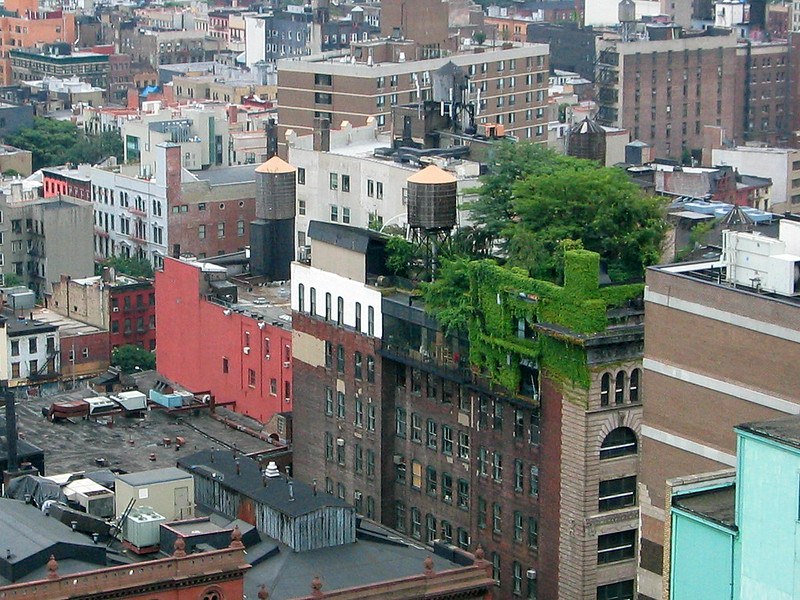
| 13:22, 11. Okt. 2019 | Green roof Manhattan.jpg (Datei) |  |
243 KB | Dachbegrünung in New Manhattan ==Lizenzhinweis== {| style="border:1px solid #8888aa; background-color:#f7f8ff;padding:5px;font-size:95%;" | Quelle: Flickr, A. Hurt (2003): Green City, https://www.flickr.com/photos/alykat/5850122/in/photostream/ <br… | 1 |
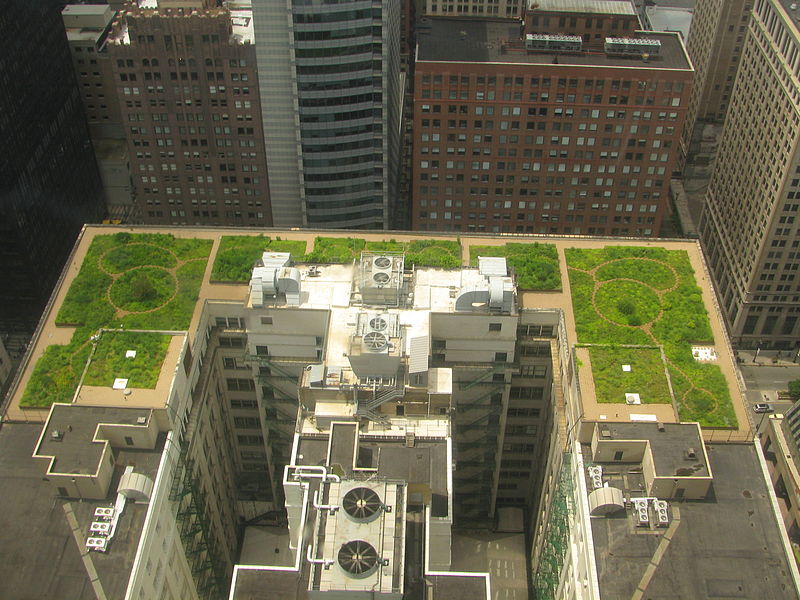
| 13:15, 11. Okt. 2019 | Chicago Green Roof.JPG (Datei) |  |
118 KB | Dachbegrünung in Chikago ==Lizenzhinweis== {| style="border:1px solid #8888aa; background-color:#f7f8ff;padding:5px;font-size:95%;" | Quelle: Wikimedia Commons, TonyTheTiger (2008): https://commons.wikimedia.org/wiki/File:20080708_Chicago_City_Hall_Gr… | 1 |
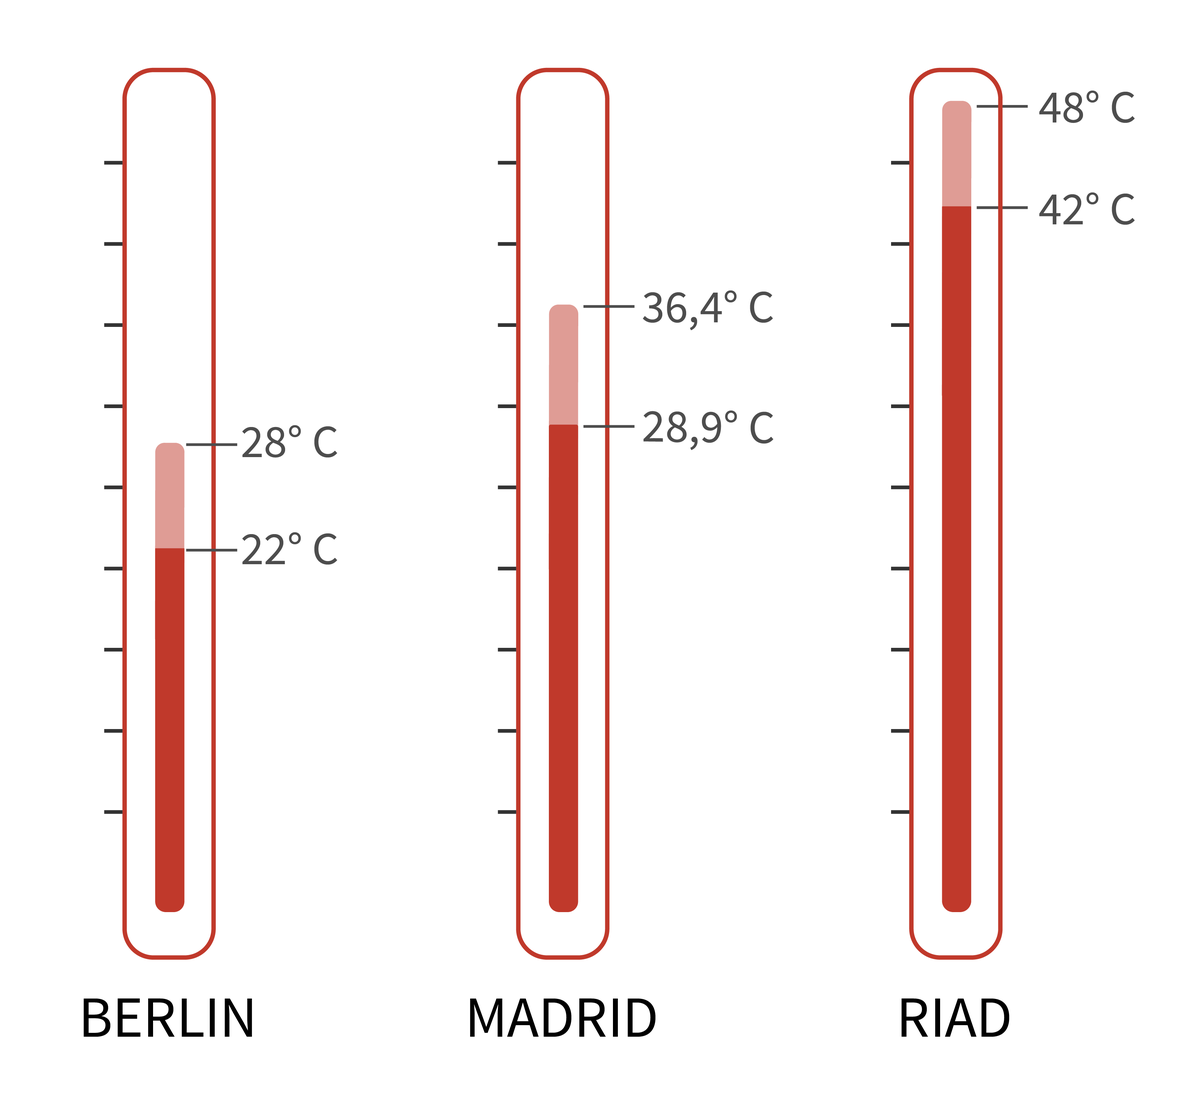
| 13:11, 11. Okt. 2019 | Städte-temperaturanstieg.png (Datei) |  |
72 KB | Anstieg der Temperatur in Berlin, Madrid und Riad durch den künftigen Klimawandel im Sommer ==Lizenzhinweis== {| style="border:1px solid #8888aa; background-color:#f7f8ff;padding:5px;font-size:95%;" | Quelle: Earth System Knowledge Plattform (2018): S… | 1 |
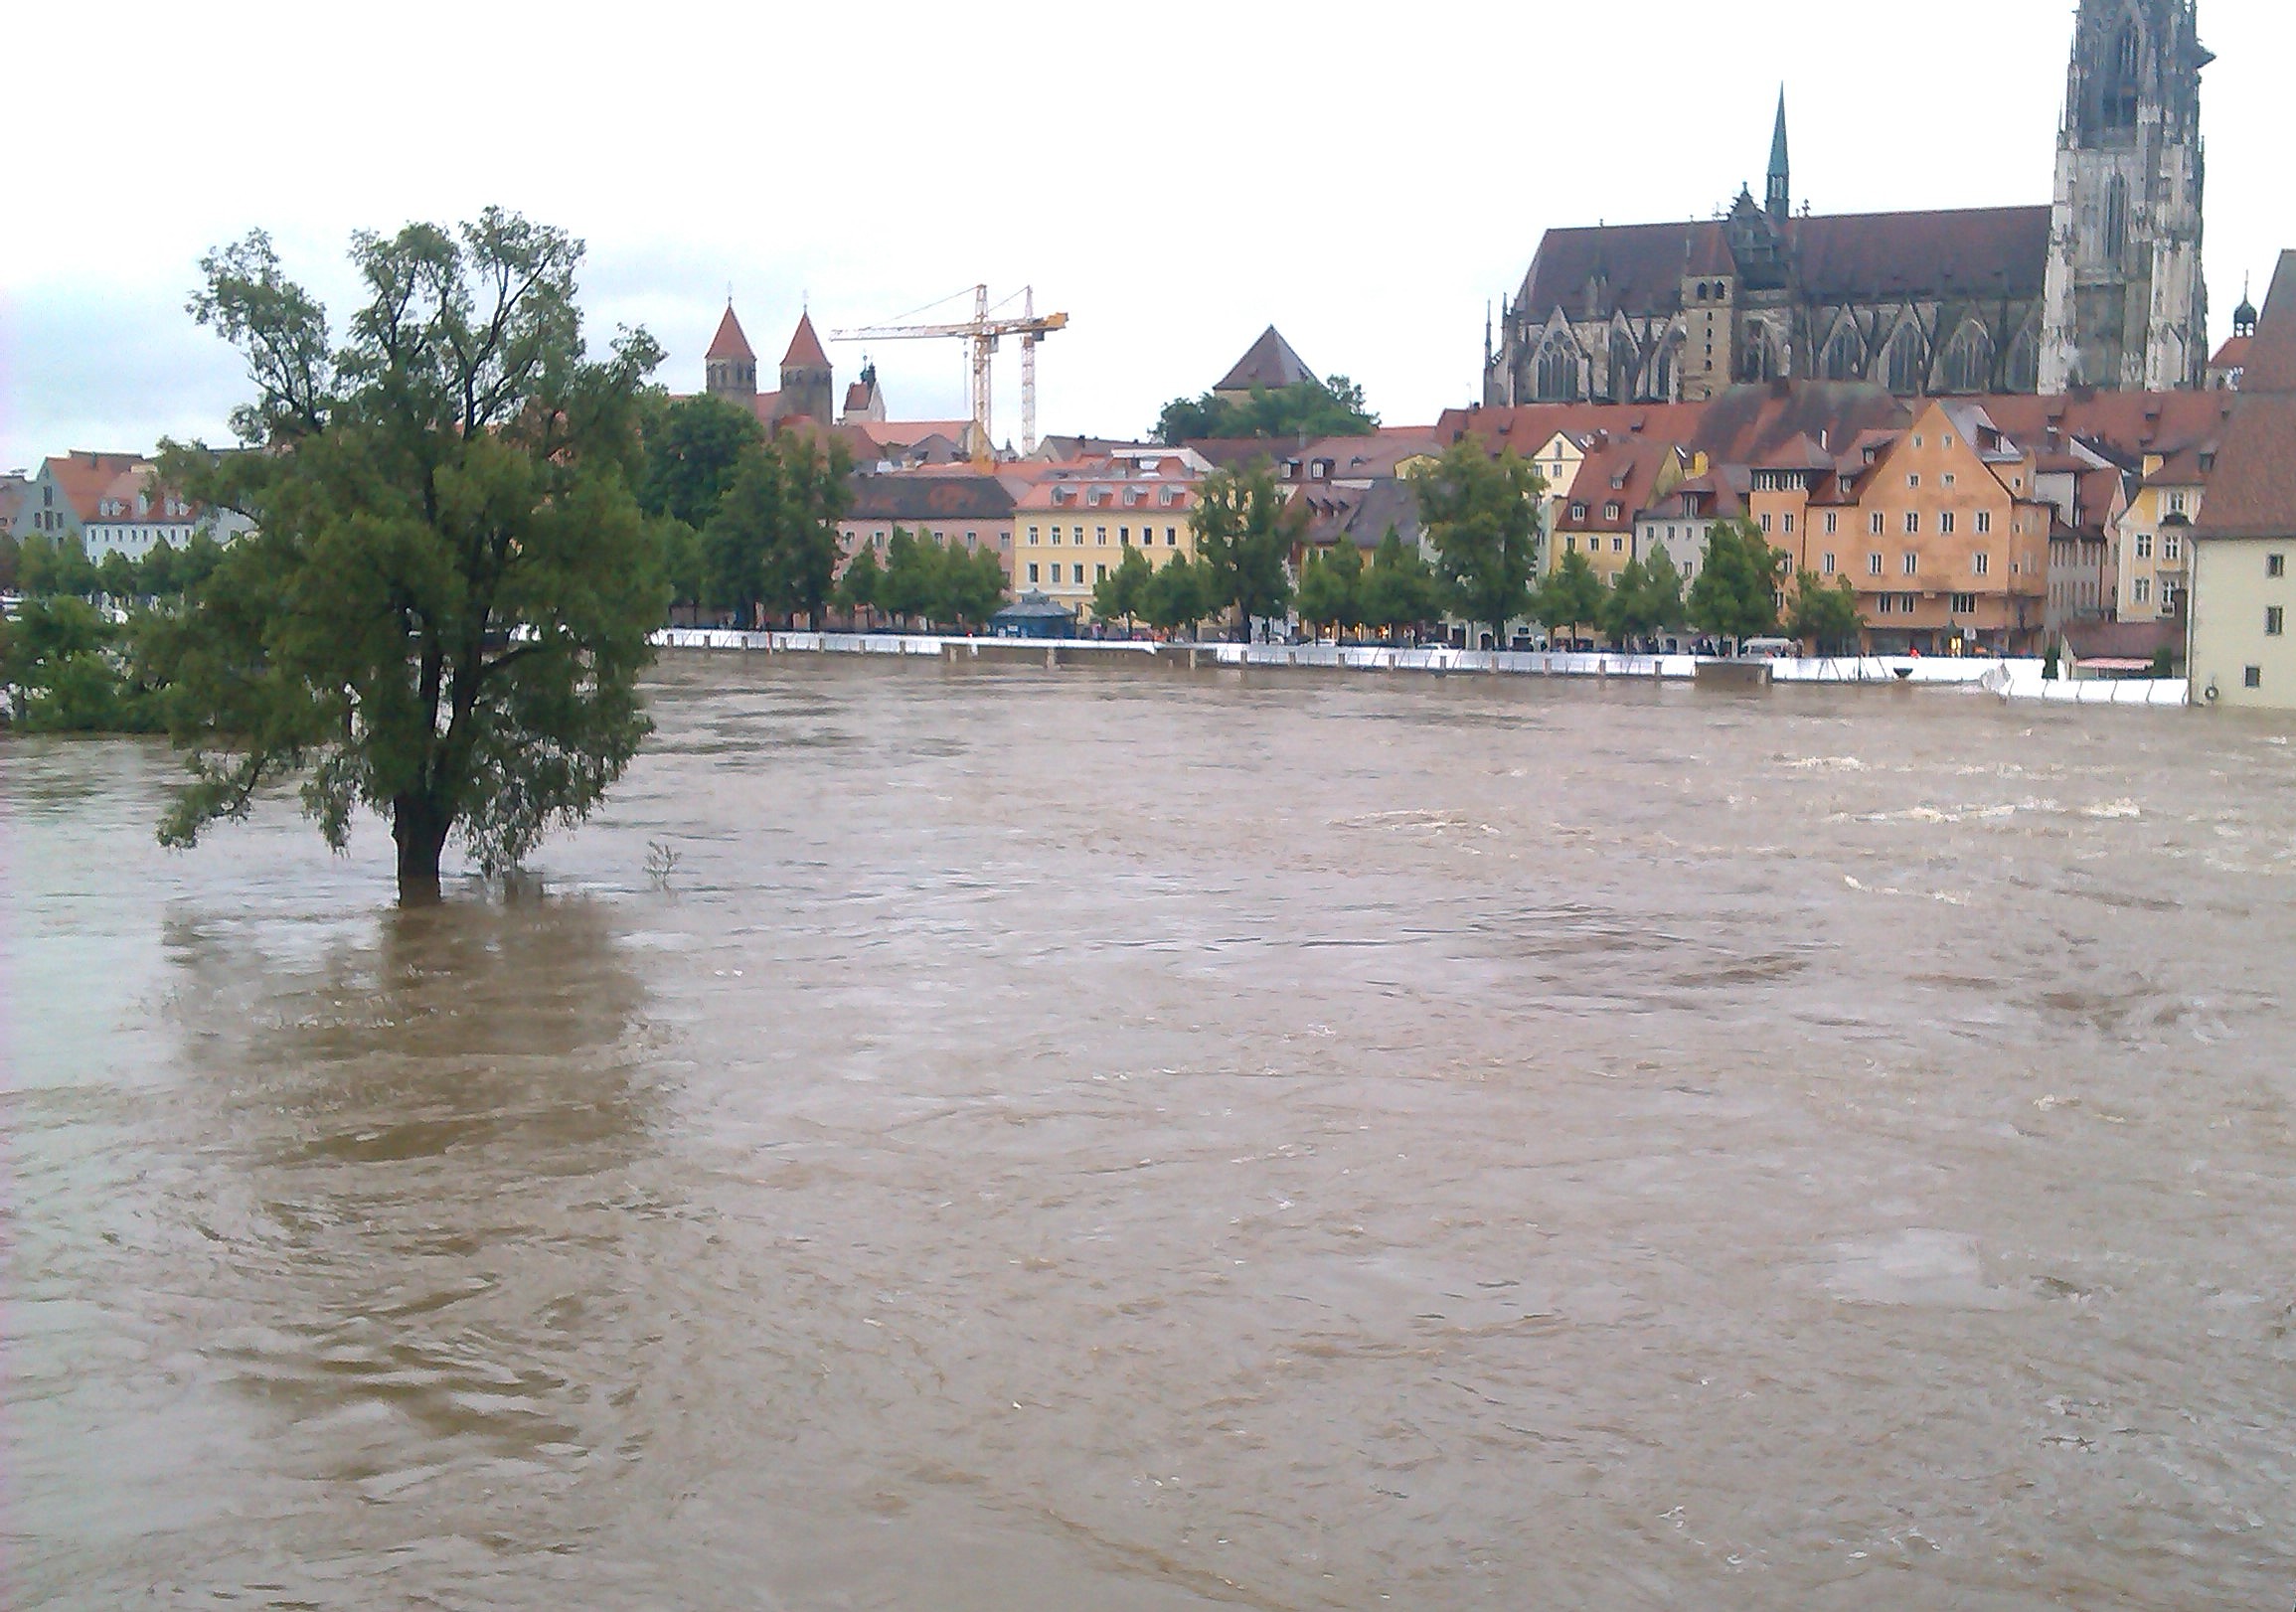
| 13:00, 11. Okt. 2019 | Regensburg flood 2013.jpg (Datei) |  |
625 KB | Hochwasser in Regensburg 2013 ==Lizenzhinweis== {| style="border:1px solid #8888aa; background-color:#f7f8ff;padding:5px;font-size:95%;" | Quelle: Wikimedia Commons, Happolati (2013): Hochwasser in Regensburg, 2013 https://commons.wikimedia.org/wiki/Fi… | 1 |
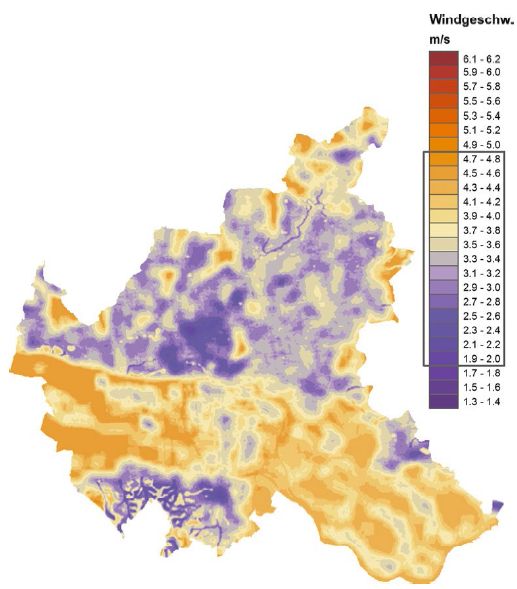
| 12:54, 11. Okt. 2019 | HH Wind Jahresmittel.jpg (Datei) |  |
42 KB | Mittleres Jahresmittel (1980–1989) der Windgeschwindigkeit in 10 m Höhe ==Lizenzhinweis== {| style="border:1px solid #8888aa; background-color:#f7f8ff;padding:5px;font-size:95%;" | Quelle: von Storch, H., I. Meinke, M. Claußen (2017): [https://link… | 1 |
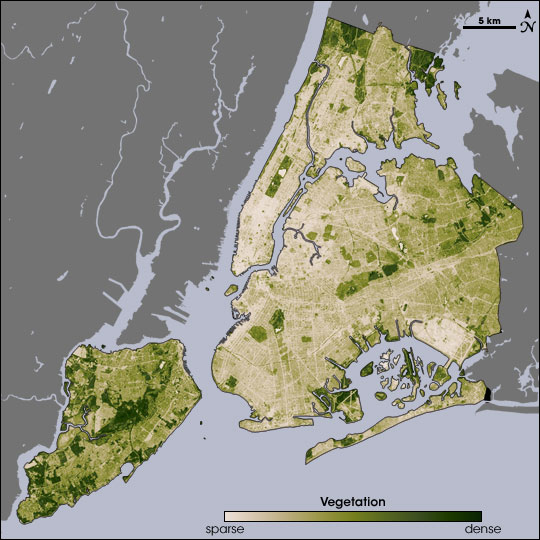
| 12:50, 11. Okt. 2019 | NYC vegetation.jpg (Datei) |  |
73 KB | Vegetationsdichte in NYC während der Hitzewelle am 14. August 2002, 10:30 Uhr ==Lizenzhinweis== {| style="border:1px solid #8888aa; background-color:#f7f8ff;padding:5px;font-size:95%;" | Quelle: NASA Earth Observatory (2006): [https://earthobservatory… | 1 |
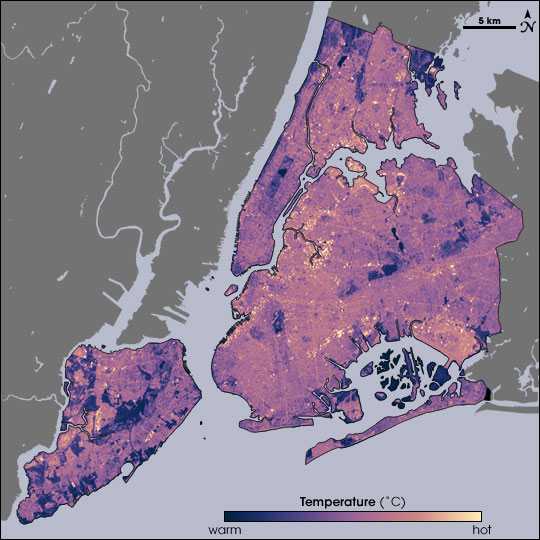
| 12:00, 11. Okt. 2019 | NYC temp.jpg (Datei) |  |
77 KB | Temperaturverteilung in NYC ==Lizenzhinweis== {| style="border:1px solid #8888aa; background-color:#f7f8ff;padding:5px;font-size:95%;" | Quelle: NASA Earth Observatory (2006): Beating the Heat, https://earthobservatory.nasa.gov/features/GreenRoof/green… | 1 |
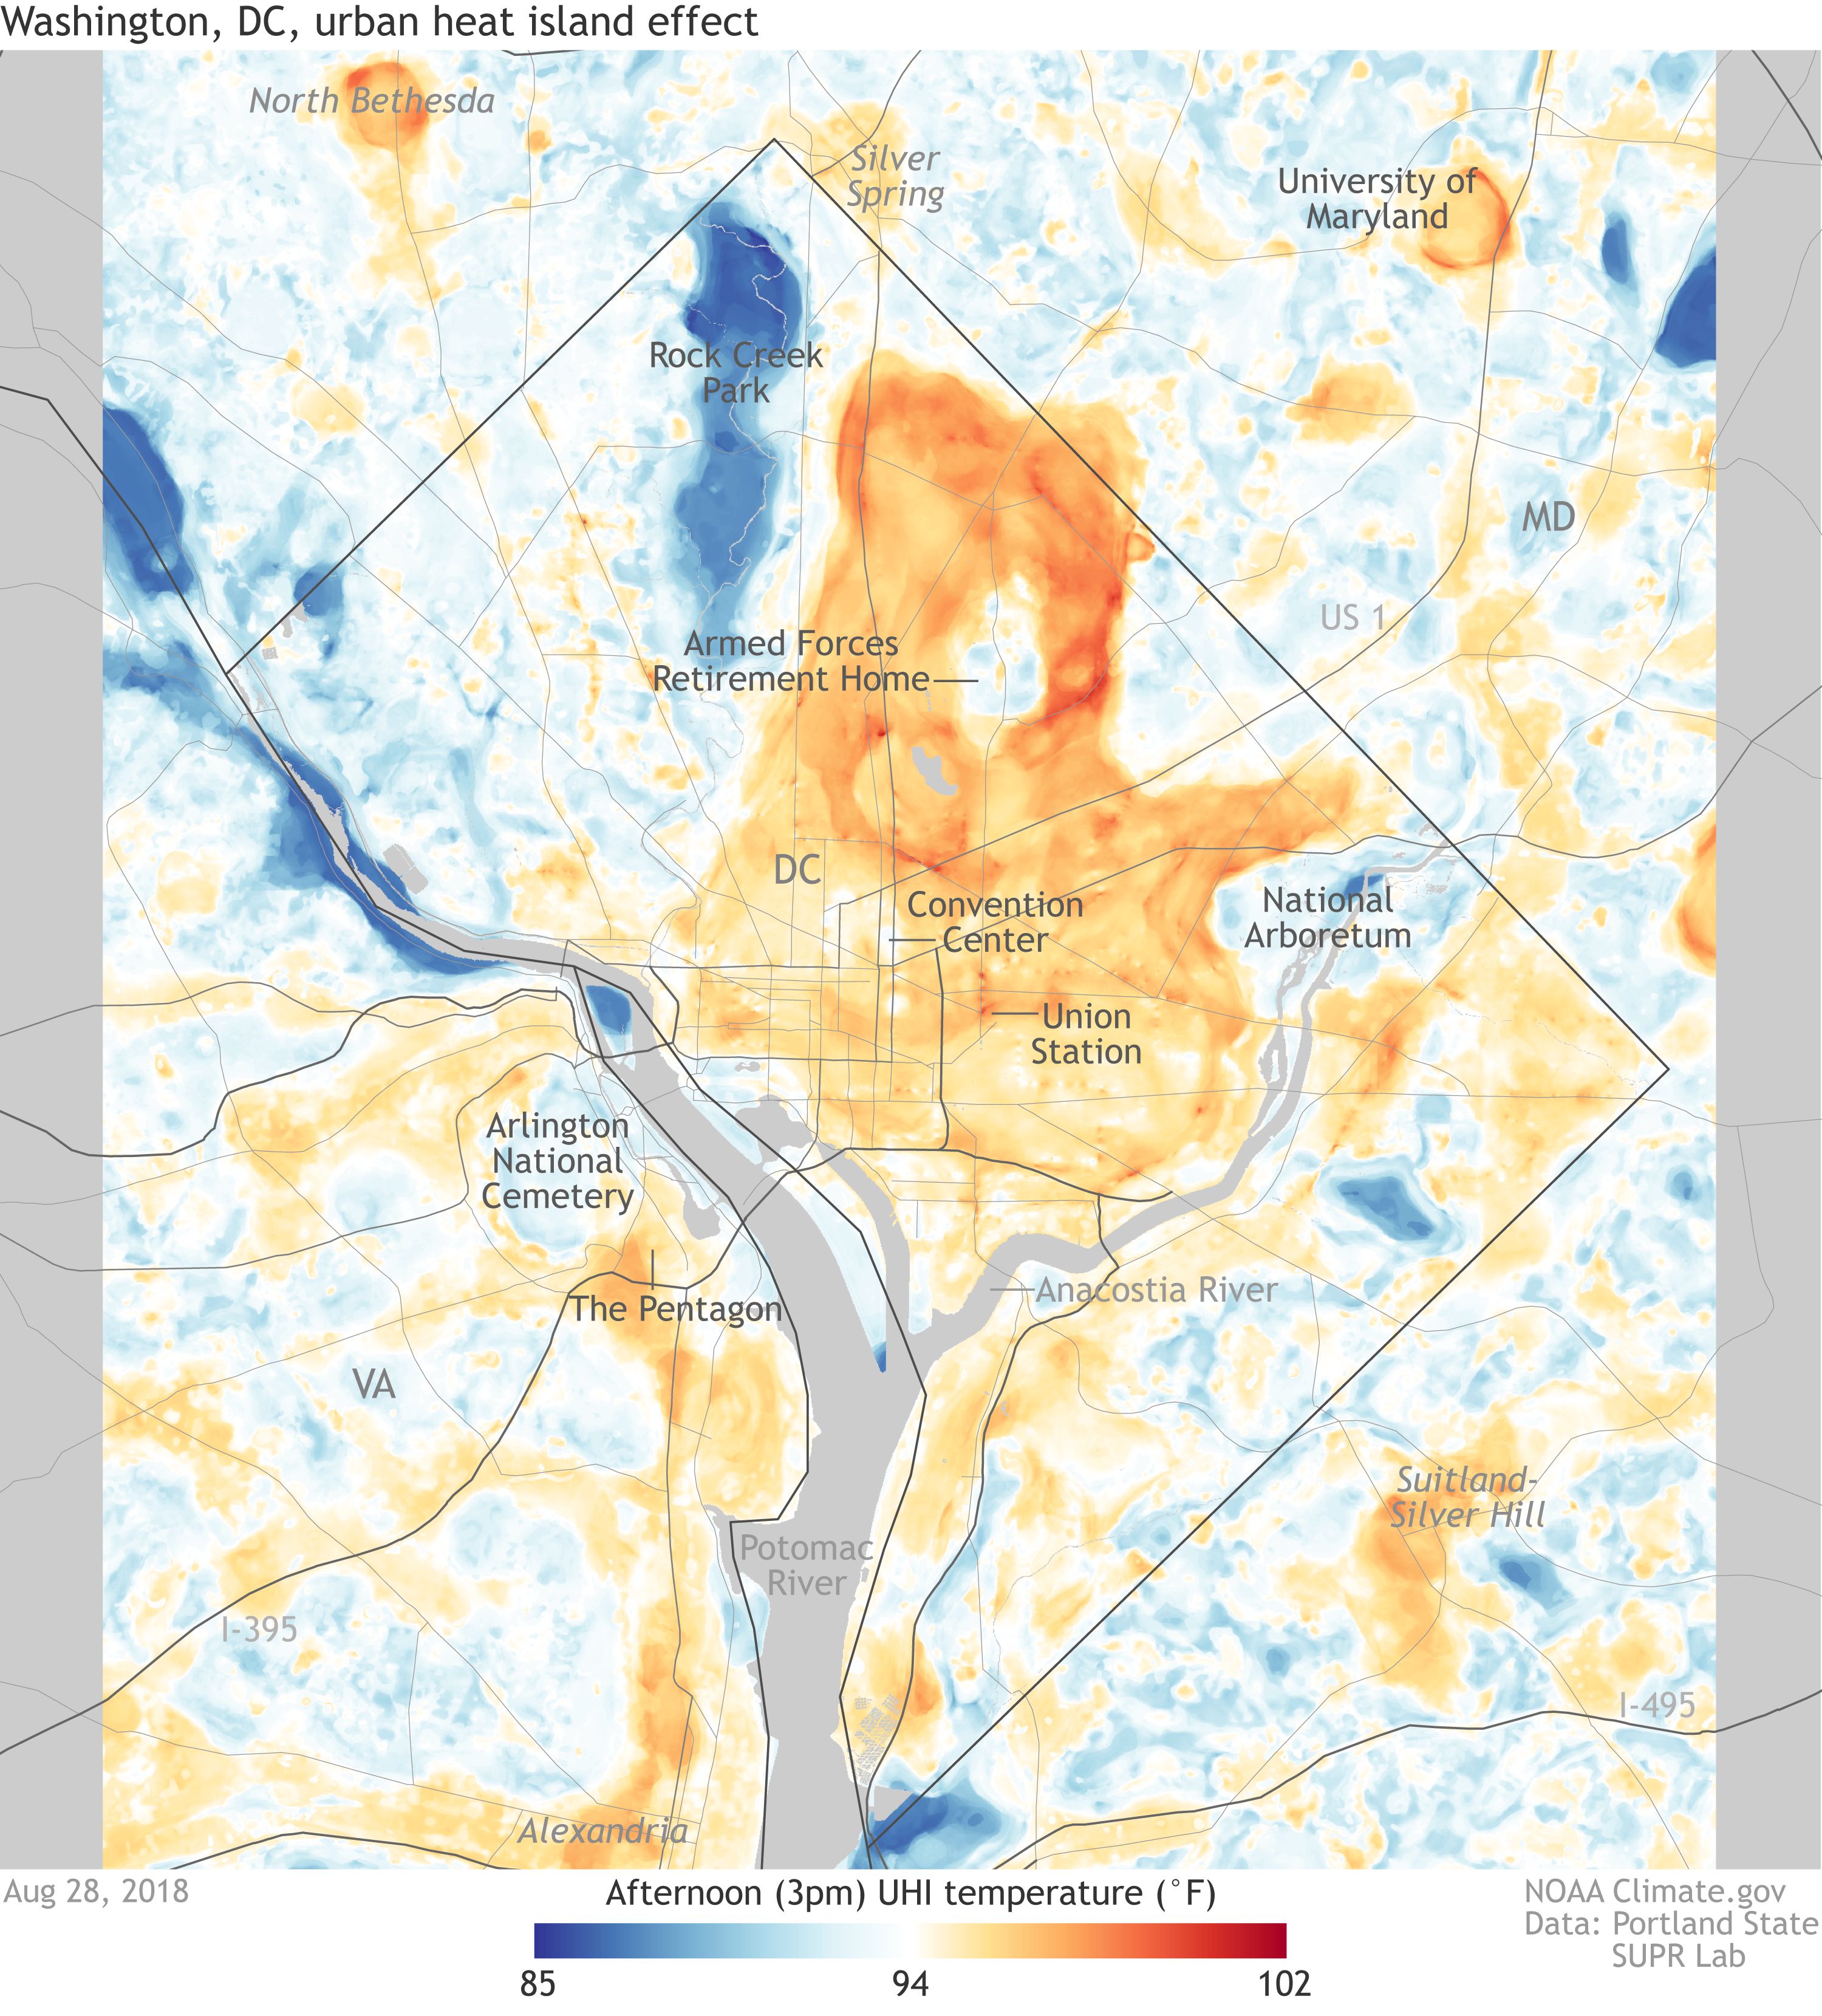
| 11:46, 11. Okt. 2019 | UHI Washington.jpg (Datei) |  |
999 KB | Städtischer Wärmeinseleffekt in Washington am 28. August 2018, 15:00 Uhr ==Lizenzhinweis== {| style="border:1px solid #8888aa; background-color:#f7f8ff;padding:5px;font-size:95%;" | Quelle: NOAA (2018): Hot days in the city? It’s all about location… | 1 |
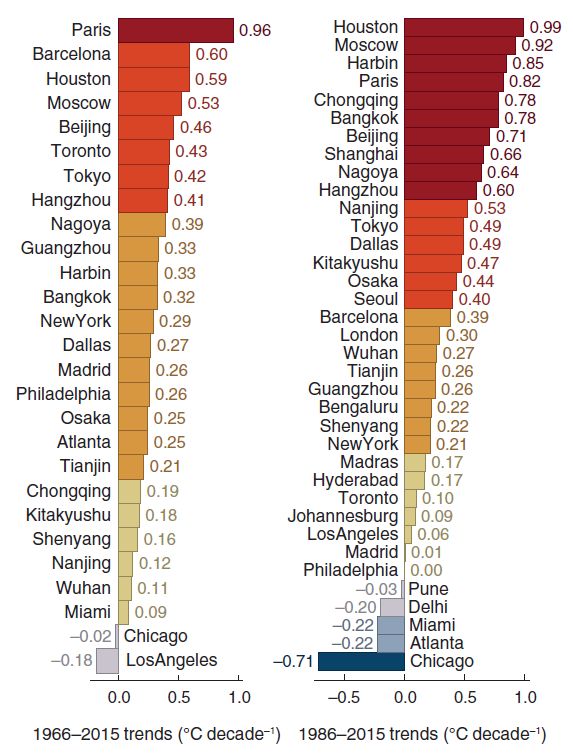
| 11:33, 11. Okt. 2019 | Urban heat island profile.png (Datei) |  |
123 KB | Trends der höchsten Jahrestemperatur in großen Städten ab 5 Mio. Einwohnern in °C pro Jahrzehnt für die beiden Perioden 1966-2015 (links) und 1986-2015 (rechts) ==Lizenzhinweis== {| style="border:1px solid #8888aa; background-color:#f7f8ff;padding… | 1 |
| 11:28, 11. Okt. 2019 | Cities HTY trend.jpg (Datei) |  |
86 KB | Trends der höchsten Jahrestemperatur in großen Städten ab 5 Mio. Einwohnern in °C pro Jahrzehnt für die beiden Perioden 1966-2015 und 1986-2015 ==Lizenzhinweis== {| style="border:1px solid #8888aa; background-color:#f7f8ff;padding:5px;font-size:95… | 1 |
| 11:19, 11. Okt. 2019 | NASA Wärmeinseleffekt sm.jpg (Datei) |  |
55 KB | Städtische Wärmeinsel am Beispiel New Yorks == Lizenzhinweis == {| style="border:1px solid #8888aa; background-color:#f7f8ff;padding:5px;font-size:95%;" | Quelle: NASA, eoKids (2017): Urban Heat Islands; credit: H. Smith; New York City heat and veget… | 1 |
| 11:13, 11. Okt. 2019 | Hong Kong living2.JPG (Datei) |  |
184 KB | Wohnen in Hong Kong I == Lizenzhinweis == {| style="border:1px solid #8888aa; background-color:#f7f8ff;padding:5px;font-size:95%;" | Quelle: Wikimedia Commons, [https://commons.wikimedia.org/wiki/User:%E3%81%95%E3%81%8B%E3%81%8A%E3%82%8A Sakaori] ([htt… | 1 |
| 11:01, 11. Okt. 2019 | Hong Kong living1.JPG (Datei) |  |
153 KB | Wohnen in Hong Kong I == Lizenzhinweis == {| style="border:1px solid #8888aa; background-color:#f7f8ff;padding:5px;font-size:95%;" | Quelle: Wikimedia Commons, Sakaori (talk) (2015): https://commons.wikimedia.org/wiki/File:Montane_Mansion_Quarry_Bay.B.… | 1 |
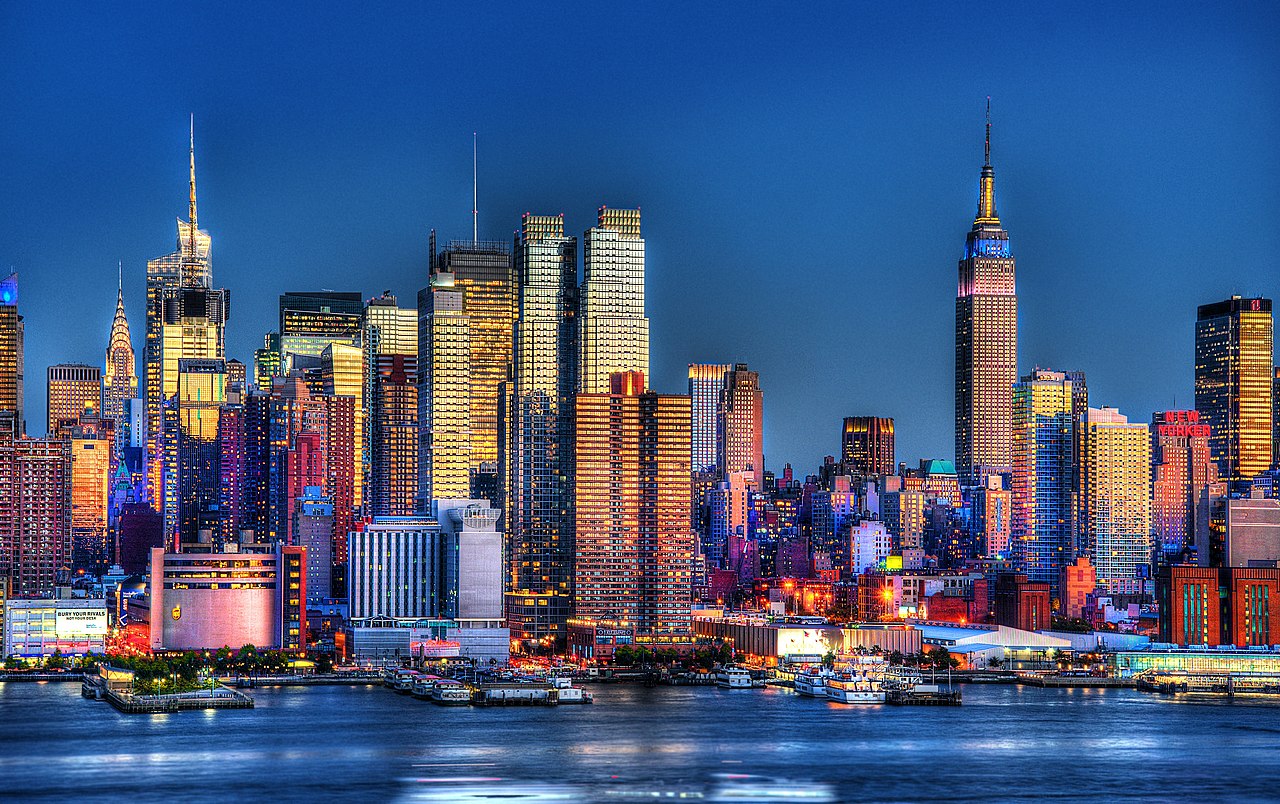
| 10:53, 11. Okt. 2019 | New York Skyline1.jpg (Datei) |  |
389 KB | Skyline von New York City == Lizenzhinweis == {| style="border:1px solid #8888aa; background-color:#f7f8ff;padding:5px;font-size:95%;" | Quelle: flickr, E Palen (2012): https://www.flickr.com/photos/cygbin/8111177937/<br /> Lizenz: CC BY 2.0 https://cr… | 1 |
| 15:04, 10. Okt. 2019 | Erdbahnparameter.jpg (Datei) |  |
172 KB | Die wichtigsten Erdbahnparameter und ihre Zyklen in den letzten 1000 Millionen Jahren ==Lizenzhinweis== {| style="border:1px solid #8888aa; background-color:#f7f8ff;padding:5px;font-size:95%;" | Bild neu gezeichnet nach Zachos, J., M. Pagani, L. Sloan,… | 2 |
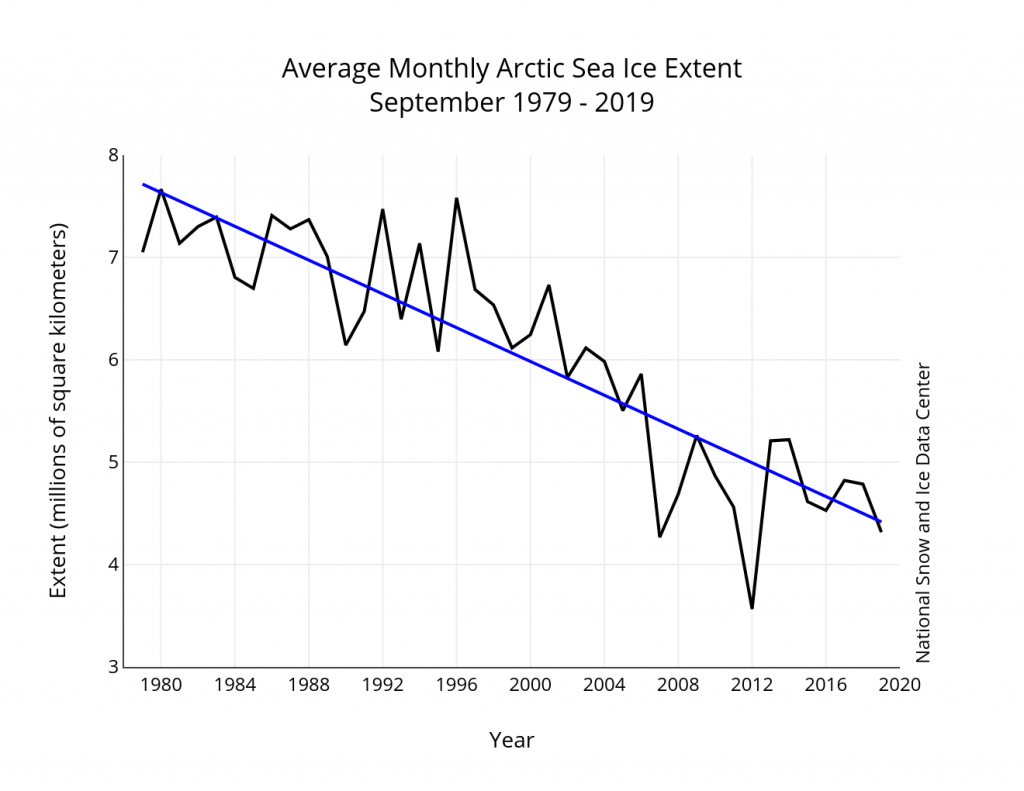
| 11:24, 9. Okt. 2019 | Arctic ice-extent Sept1979-2019.png (Datei) |  |
209 KB | Die Abnahme der Ausdehnung des arktischen Meereises zwischen 1978 und 2019 im September. Ausdehnung des arktischen Meereises im September 1979 bis 2019 ==Lizenzhinweis== {| style="border:1px solid #8888aa; background-color:#f7f8ff;padding:5px;font-size… | 1 |
| 13:52, 5. Okt. 2019 | Flooding Mumbai 2017.jpg (Datei) |  |
219 KB | Hochwasser in Mumbai 2017 ==Lizenzhinweis== {| style="border:1px solid #8888aa; background-color:#f7f8ff;padding:5px;font-size:95%;" | Quelle: Wikimedia Commons, Paasikivi https://commons.wikimedia.org/wiki/User:Paasikivi (2013): Hochwasser in Regensbu… | 1 |
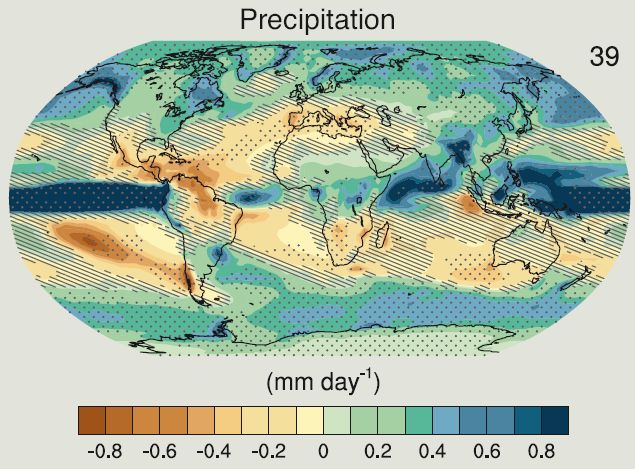
| 12:11, 13. Sep. 2019 | Prec RCP8.5 2081-2100.jpg (Datei) |  |
77 KB | Niederschlagsänderungen bis 2100: Änderungen der Jahresmittel der Niederschläge nach dem Szenario RCP8.5 bis 2081-2100 im Vergleich zu 1986-2005 in mm/Tag. Oben rechts die Anzahl der Klimamodelle, die die Projektionen berechnet haben. Gepunktet: gro… | 1 |
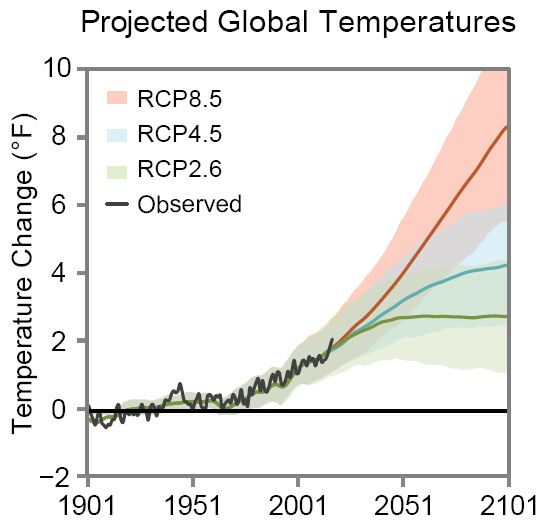
| 12:05, 13. Sep. 2019 | Global temp 2101.jpg (Datei) |  |
32 KB | Beobachtete und zukünftige globale Temperaturänderung nach verschiedenen Szenarien in °F (1 °F = 0,56 °C) ==Lizenzhinweis== {| style="border:1px solid #8888aa; background-color:#f7f8ff;padding:5px;font-size:95%;" | Quelle: USGCRP, 2017: Climate S… | 1 |
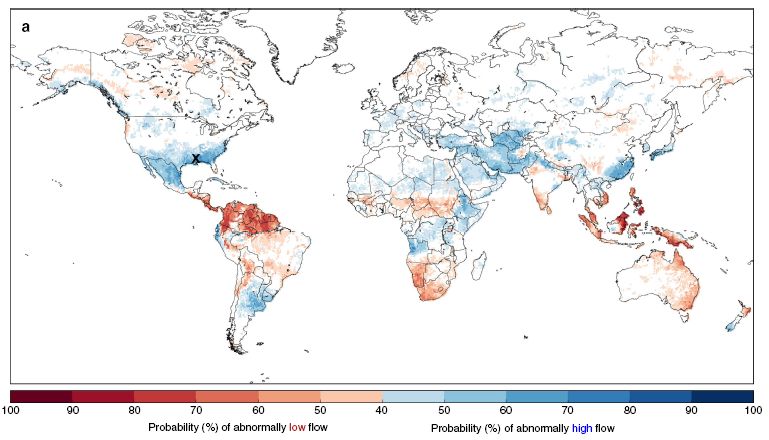
| 18:58, 12. Sep. 2019 | ElNino low-high flood.jpg (Datei) |  |
59 KB | Hoch- und Niedrigwasser während eines El Niño: historische Wahrscheinlichkeit im Februar nach einem El Nino im Dezember. == Lizenzhinweis == {| style="border:1px solid #8888aa; background-color:#f7f8ff;padding:5px;font-size:95%;" |Quelle: Emerton, R.… | 1 |
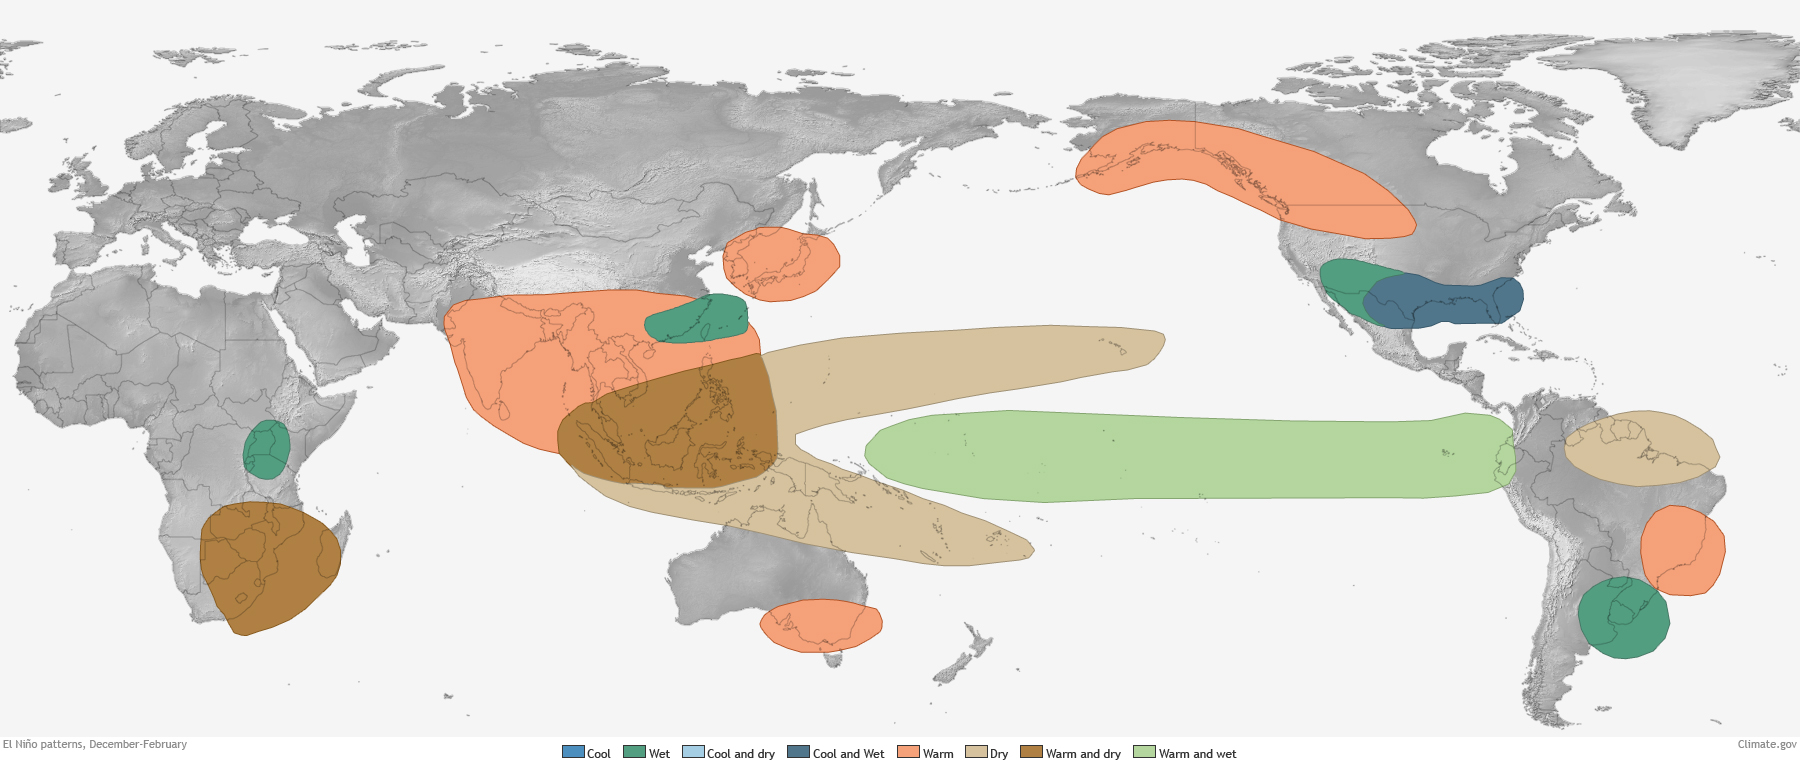
| 18:55, 12. Sep. 2019 | ElNino impacts winter.jpg (Datei) |  |
478 KB | El Niño Folgen im Winter == Lizenzhinweis == {| style="border:1px solid #8888aa; background-color:#f7f8ff;padding:5px;font-size:95%;" |Quelle: Lindsey, R. (NOAA Climate.gov, 2016): Global impacts of El Niño and La Niña, https://www.climate.gov/news-… | 1 |
| 18:45, 12. Sep. 2019 | El Nino2015 SST.jpg (Datei) |  |
49 KB | SST bei neutralen und El-Nino-Bedingungen == Lizenzhinweis == {| style="border:1px solid #8888aa; background-color:#f7f8ff;padding:5px;font-size:95%;" |Quelle: NASA's Jet Propulsion Laboratory: [https://svs.gsfc.nasa.gov/30645 ENSO Sea Surface Temperat… | 1 |
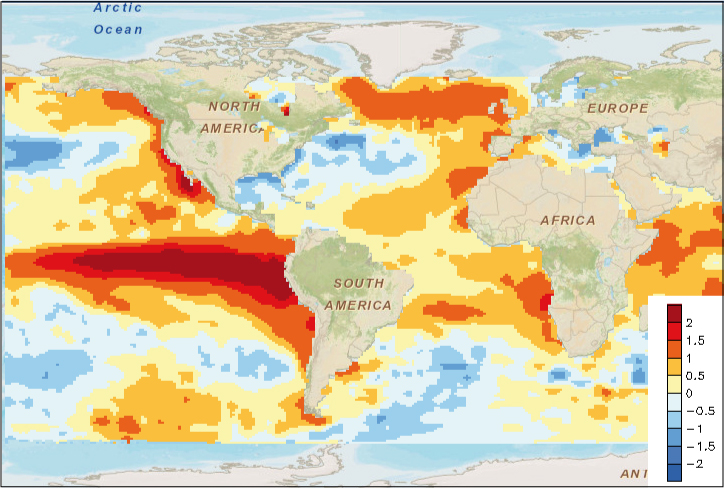
| 18:41, 12. Sep. 2019 | Enso Jan 2016.jpg (Datei) |  |
60 KB | El Niño Jan. 2016: Meeresoberflächentemperaturen als Abweichung vom Mittelwert == Lizenzhinweis == {| style="border:1px solid #8888aa; background-color:#f7f8ff;padding:5px;font-size:95%;" |Quelle: NASA's Jet Propulsion Laboratory: [https://svs.gsfc.n… | 1 |
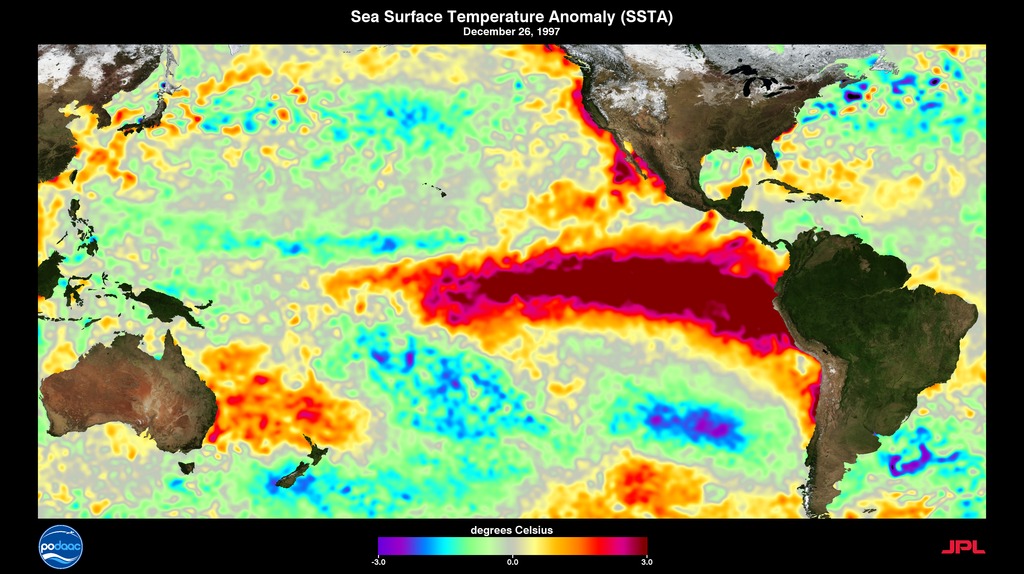
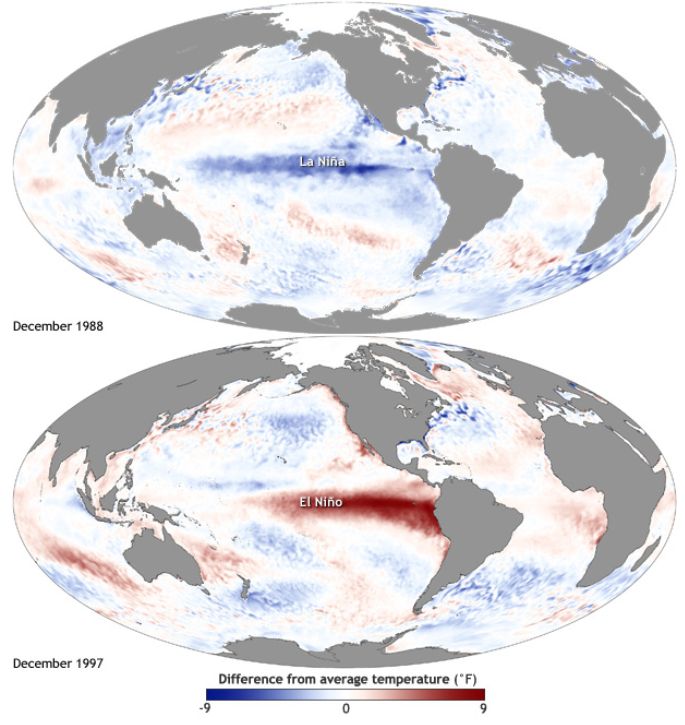
| 18:25, 12. Sep. 2019 | Enso Dec 1997.jpg (Datei) |  |
176 KB | El Niño Dez. 1997: Meeresoberflächentemperaturen als Abweichung vom Mittelwert == Lizenzhinweis == {| style="border:1px solid #8888aa; background-color:#f7f8ff;padding:5px;font-size:95%;" |Quelle: NASA's Jet Propulsion Laboratory: ENSO Sea Surface Te… | 1 |
| 18:11, 12. Sep. 2019 | El Nino 11 1997.jpg (Datei) |  |
319 KB | Meeresoberflächentemperaturen Nov. 1997 == Lizenzhinweis == {| style="border:1px solid #8888aa; background-color:#f7f8ff;padding:5px;font-size:95%;" |Quelle: NOAA National Weather Service, Climate Prediction Center GIS Portal, http://www.cpc.ncep.noaa… | 1 |
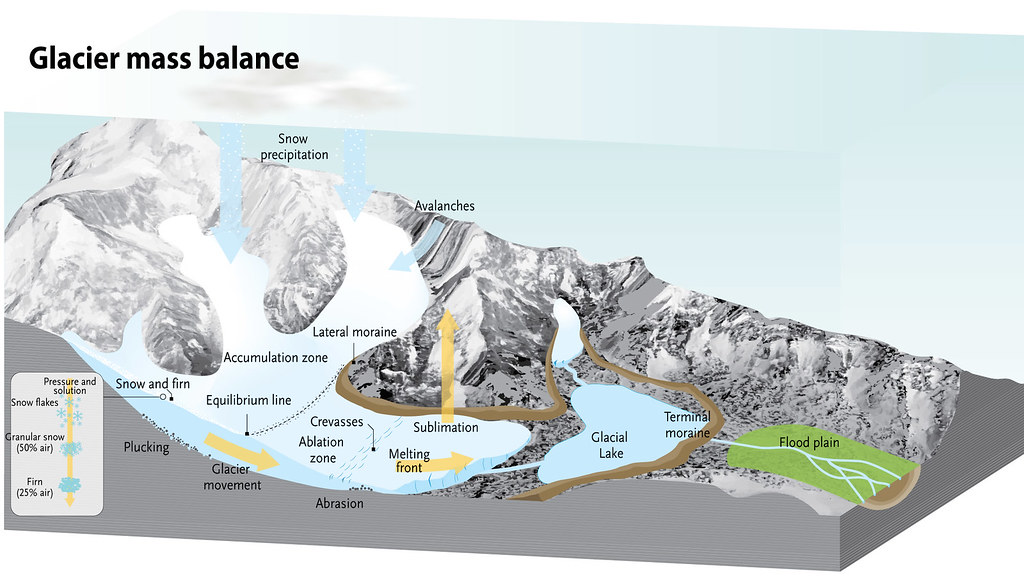
| 15:37, 10. Sep. 2019 | Andes glacier mass blance.jpg (Datei) |  |
129 KB | Prinzipielle Prozesse, die die Massenbilanz von Gletschern in den Anden bestimmen. ==Lizenzhinweis== {| style="border:1px solid #8888aa; background-color:#f7f8ff;padding:5px;font-size:95%;" | Quelle: Flickr (2019): [https://www.flickr.com/photos/gridar… | 1 |
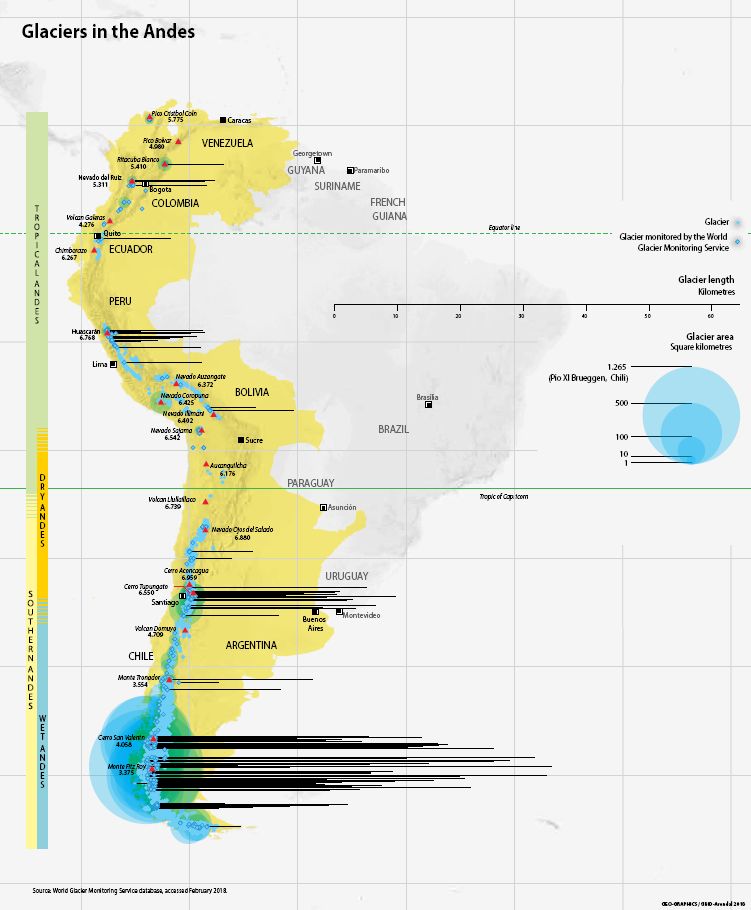
| 15:30, 10. Sep. 2019 | Gletscher Anden.jpg (Datei) |  |
74 KB | Gletscher in den Anden ==Lizenzhinweis== {| style="border:1px solid #8888aa; background-color:#f7f8ff;padding:5px;font-size:95%;" | Quelle: Flickr (2019): Glaciers in the Andes, https://www.flickr.com/photos/gridarendal/31758563787/in/album-72157675469… | 1 |
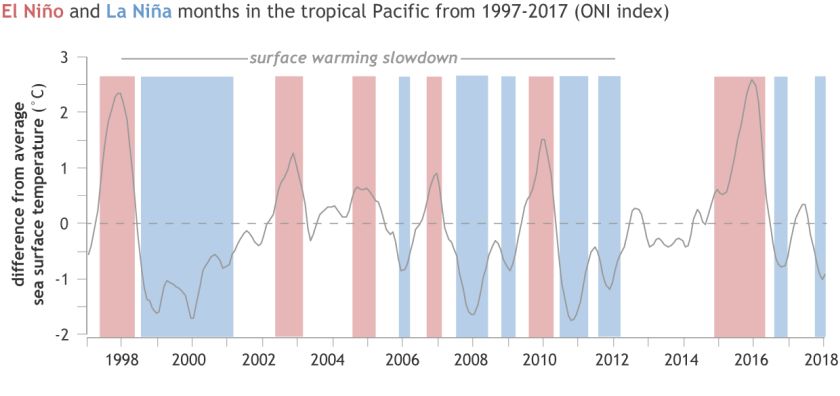
| 15:00, 10. Sep. 2019 | SST Nino Nina1997-2017.jpg (Datei) |  |
37 KB | Meeresoberflächentemperaturen in °C in El-Niño- und La-Niña-Monaten im tropischen Pazifik 1997-2017 {| style="border:1px solid #8888aa; background-color:#f7f8ff;padding:5px;font-size:95%;" | Quelle: Lindsey, R., NOAA Climate.gov (2018): Did global… | 1 |
| 14:51, 10. Sep. 2019 | ENSO 1950-2018.jpg (Datei) |  |
39 KB | ENSO 1950-2018 {| style="border:1px solid #8888aa; background-color:#f7f8ff;padding:5px;font-size:95%;" | Quelle: L'Heureux, M. , NOAA (2014): What is the El Niño–Southern Oscillation (ENSO) in a nutshell? https://www.climate.gov/news-features/blogs… | 1 |
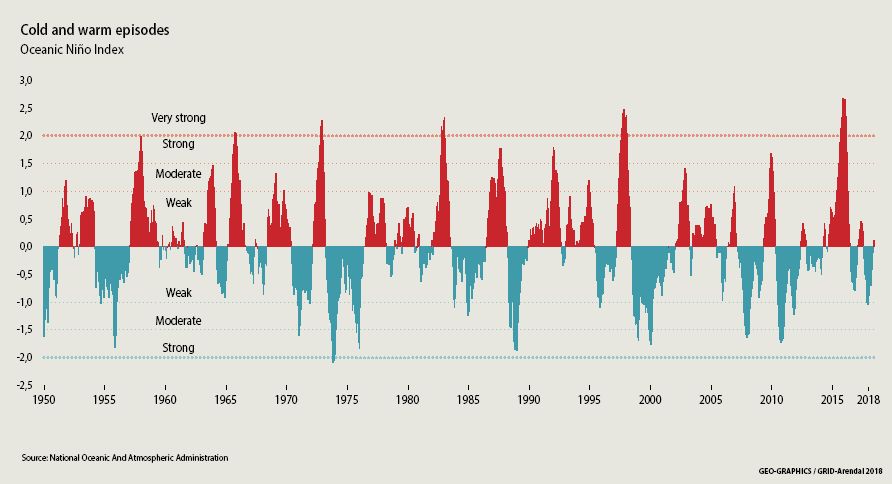
| 14:47, 10. Sep. 2019 | Nino-Index 1950-2018.jpg (Datei) |  |
51 KB | ENSO-Index 1950-2018 {| style="border:1px solid #8888aa; background-color:#f7f8ff;padding:5px;font-size:95%;" | Quelle: Flickr (2019): The effect of El Niño on weather in the Andes, https://www.flickr.com/photos/gridarendal/31758563837/ (ursprgl. GRI… | 1 |
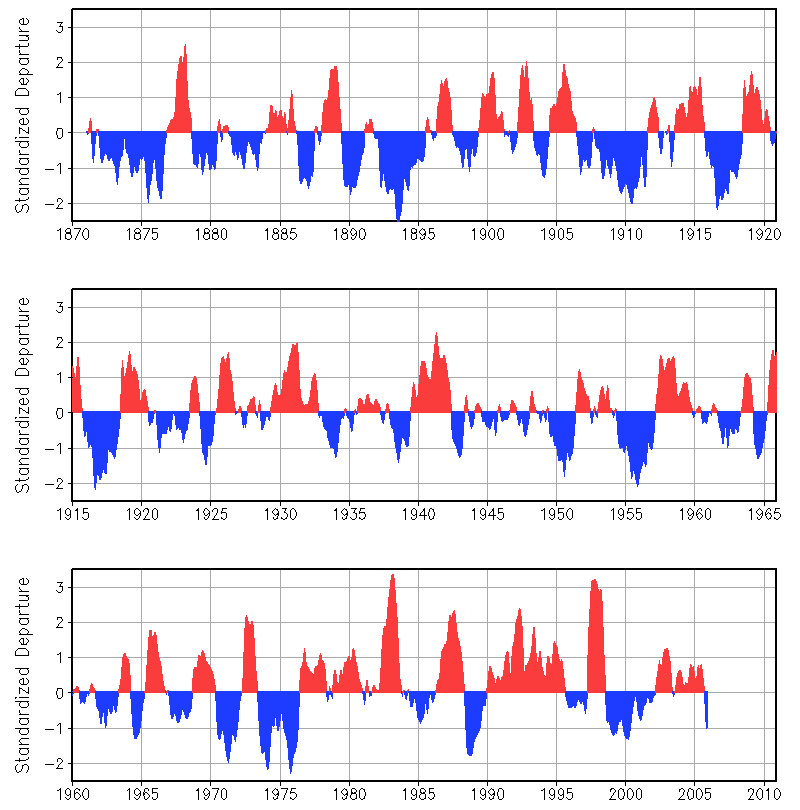
| 14:31, 10. Sep. 2019 | ENSO-Index 1872-2006.jpg (Datei) |  |
365 KB | ENSO-Index 1872 bis 2006 {| style="border:1px solid #8888aa; background-color:#f7f8ff;padding:5px;font-size:95%;" | Quelle: NOAA ESRL (2019): Extended Multivariate ENSO Index (MEI.ext), https://www.esrl.noaa.gov/psd/enso/mei.ext/<br> Lizenz: Public dom… | 1 |
| 14:10, 10. Sep. 2019 | ElNino-LaNina.png (Datei) |  |
339 KB | El Niño und La Niña: schematische Darstellung der physikalischen Mechanismen: Meeresoberflächentemperatur, Windströmungen und Luftdruck. {| style="border:1px solid #8888aa; background-color:#f7f8ff;padding:5px;font-size:95%;" | Quelle: NOAA ESRL (2… | 1 |
| 14:05, 10. Sep. 2019 | La Nina El Nino.jpg (Datei) |  |
69 KB | La Niña und El Niño {| style="border:1px solid #8888aa; background-color:#f7f8ff;padding:5px;font-size:95%;" | Quelle: L'Heureux, M., NOAA (2014): What is the El Niño–Southern Oscillation (ENSO) in a nutshell? https://www.climate.gov/news-features… | 1 |
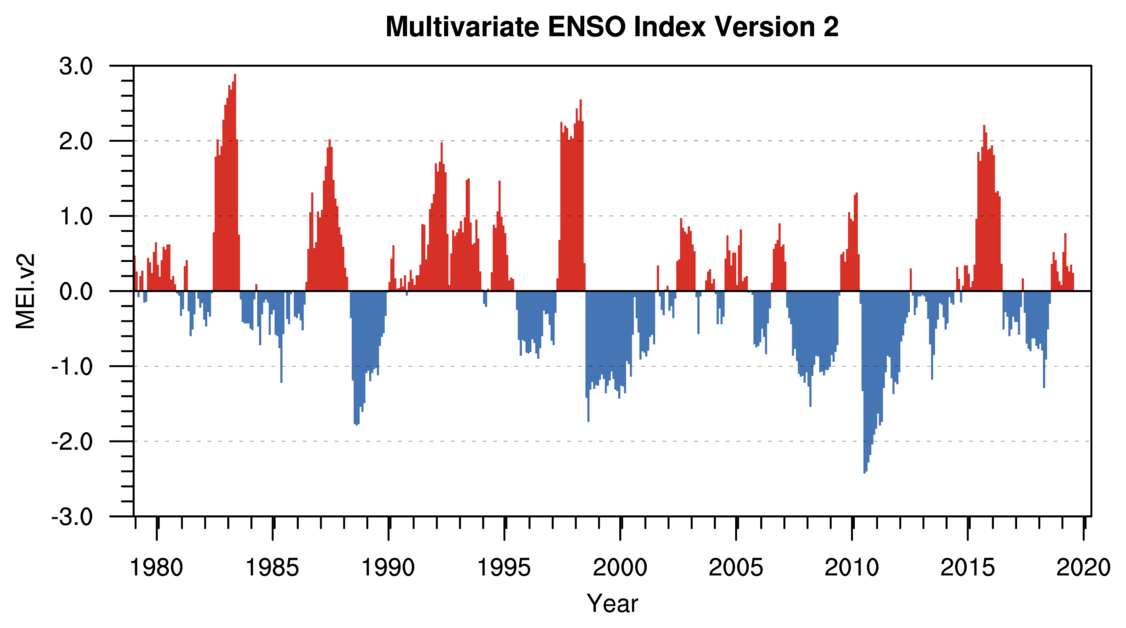
| 14:00, 10. Sep. 2019 | ENSO Zeitserie aktuell.png (Datei) |  |
222 KB | ENSO-Index 1959 bis 2019. Der ENSO-Index setzt sich aus sechs Variablen zusammen: Luftdruck, meridionale und zonale Windkomponenten, Meeresoberflächentemperatur, Lufttemperatur, Wolkenbedeckung. {| style="border:1px solid #8888aa; background-color:#f… | 1 |
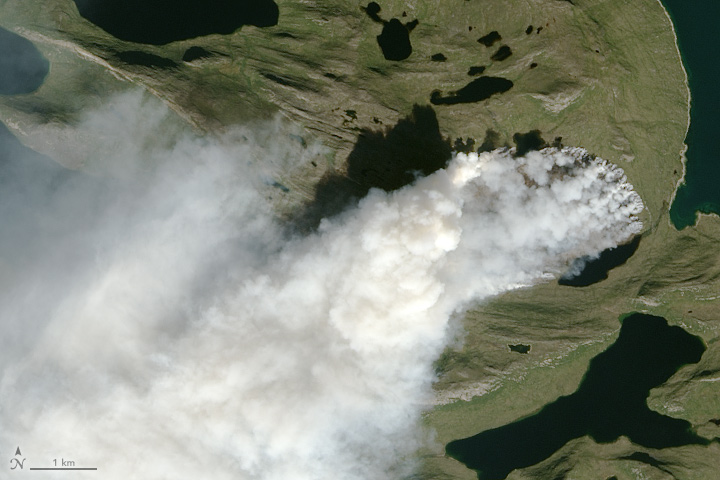
| 08:52, 5. Sep. 2019 | Greenland fire 3.8.2017.jpg (Datei) |  |
116 KB | Feuer auf Grönland am 3. August 2017 ==Lizenzhinweis== {| style="border:1px solid #8888aa; background-color:#f7f8ff;padding:5px;font-size:95%;" | Quelle: Di Liberto, T. (NOAA Climate.gov, 2017): Greenland: A land of ice and...other stuff, https://www.… | 1 |
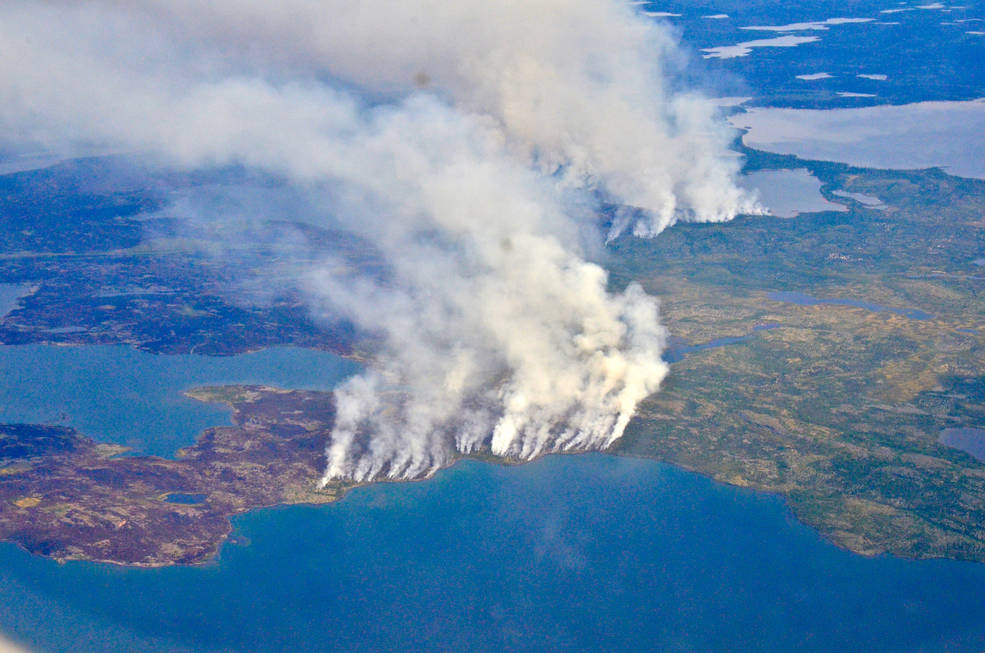
| 08:39, 5. Sep. 2019 | NW-Territories.jpg (Datei) |  |
106 KB | Waldbrände in den Nordwest-Territorien, Kanada, nördlich des Großen Sklavensees im Sommer 2014 ==Lizenzhinweis== {| style="border:1px solid #8888aa; background-color:#f7f8ff;padding:5px;font-size:95%;" | Quelle: R. Reiny NASA(2019): Through Smoke an… | 1 |
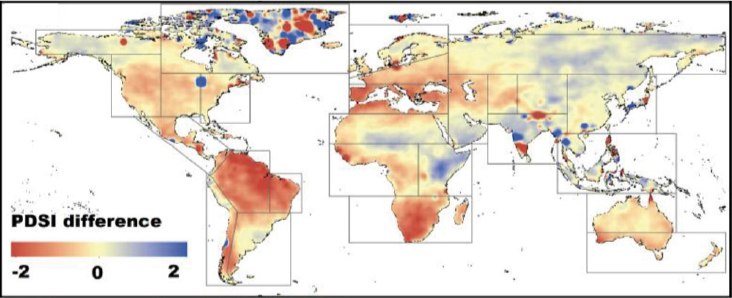
| 12:44, 30. Aug. 2019 | Drought 1.5-2.0°C.jpg (Datei) |  |
95 KB | Änderung PDSI bei 1,5 °C und 2 °C globaler Erwärmung (Einteilung der Erde nach Regionen in der Quelle) ==Lizenzhinweis== {| style="border:1px solid #8888aa; background-color:#f7f8ff;padding:5px;font-size:95%;" | Quelle: Liu, W., Sun, F., Lim, W. H.… | 1 |
| 12:39, 30. Aug. 2019 | PDSI 2°C world.jpg (Datei) |  |
131 KB | Änderung des PDSI bei 2 °C globaler Erwärmung bis 2100 ==Lizenzhinweis== {| style="border:1px solid #8888aa; background-color:#f7f8ff;padding:5px;font-size:95%;" | Quelle: Liu, W., Sun, F., Lim, W. H., Zhang, J., Wang, H., Shiogama, H., and Zhang, Y… | 1 |
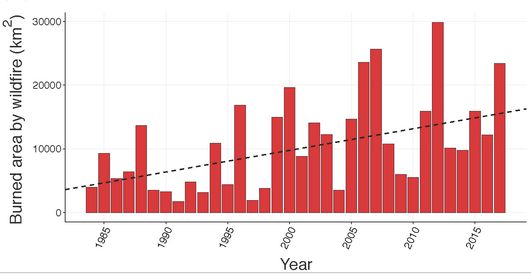
| 16:35, 29. Aug. 2019 | W-US burned area 1984-2017.jpg (Datei) |  |
20 KB | Jährliche Waldbrandgebiete von großen Feuern (>400 ha) 1984-2017 in den westlichen USA ==Lizenzhinweis== {| style="border:1px solid #8888aa; background-color:#f7f8ff;padding:5px;font-size:95%;" | Quelle: Balch, J.K., T. Schoennagel, A.P. Williams et… | 1 |
