Datei:Wasser industrie.jpg: Unterschied zwischen den Versionen
Aus Klimawandel
This graphic shows the relative percentages of water use by industrial sector in the countries of the world in 2000 |
Keine Bearbeitungszusammenfassung |
||
| Zeile 1: | Zeile 1: | ||
This graphic shows the relative percentages of water use by industrial sector in the countries of the world in 2000 | This graphic shows the relative percentages of water use by industrial sector in the countries of the world in 2000 | ||
==Lizenzhinweis== | |||
{| style="border:1px solid #8888aa; background-color:#f7f8ff;padding:5px;font-size:95%;" | |||
| | |||
Bild verändert nach [http://maps.grida.no/go/graphic/freshwater_withdrawal_in_agriculture_industry_and_domestic_use DUNEP/GRID-Arendal library of graphics resources: Freshwater] | |||
|} | |||
Version vom 12. Mai 2008, 15:42 Uhr
This graphic shows the relative percentages of water use by industrial sector in the countries of the world in 2000
Lizenzhinweis
|
Bild verändert nach DUNEP/GRID-Arendal library of graphics resources: Freshwater |
Dateiversionen
Klicke auf einen Zeitpunkt, um diese Version zu laden.
| Version vom | Vorschaubild | Maße | Benutzer | Kommentar | |
|---|---|---|---|---|---|
| aktuell | 15:42, 12. Mai 2008 | 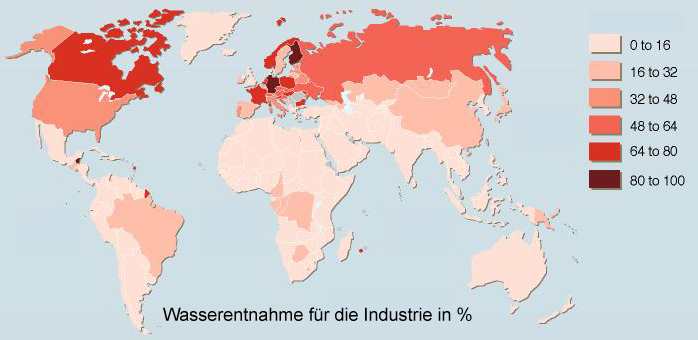 | 698 × 340 (123 KB) | Dieter Kasang (Diskussion | Beiträge) | This graphic shows the relative percentages of water use by industrial sector in the countries of the world in 2000 |
Du kannst diese Datei nicht überschreiben.
Dateiverwendung
Die folgenden 2 Seiten verwenden diese Datei: