Von Dieter Kasang hochgeladene Dateien
Aus Klimawandel
Diese Spezialseite listet alle hochgeladenen Dateien auf.
| Datum | Name | Vorschaubild | Größe | Beschreibung | Versionen |
|---|---|---|---|---|---|
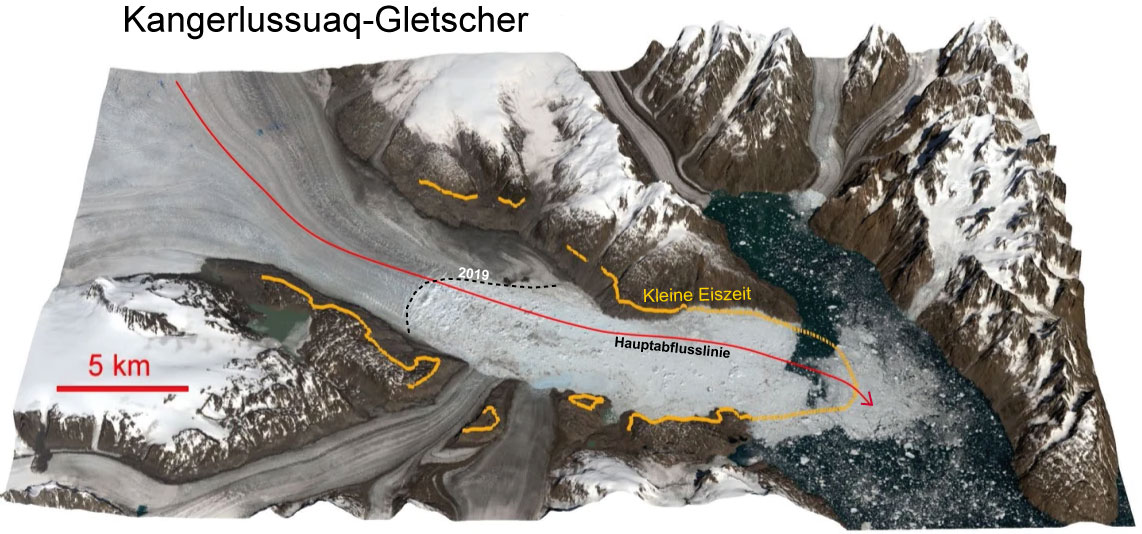
| 20:08, 27. Mai 2026 | Kangerlussuaq.jpg (Datei) |  |
146 KB | == Beschreibung == Veränderung des Auslassgletschers Kangerlussuaq Glacier zwischen der Kleinen Eiszeit (gelbe Linien) und 2019 (gestrichelte Linie). Die rote Linie zeigt die Hauptfließrichtung an. ==Lizenzhinweis== {| style="border:1px solid #8888aa; background-color:#f7f8ff;padding:5px;font-size:95%;" |Quelle: : Khan, S.A., Bjørk, A.A., Bamber, J.L. et al. Centennial response of Greenland’s three largest outlet glaciers. Nat Commun 11, 5718 (2020). https://doi.org/10.1038/s41467-020-19580-5<b… | 1 |
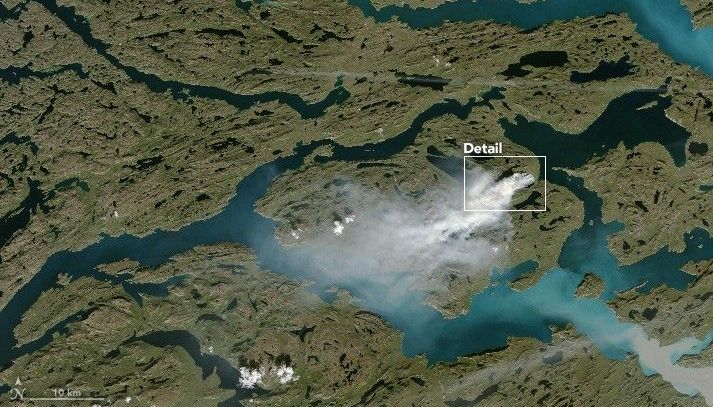
| 19:08, 27. Mai 2026 | W-Greenland fire 3.8.2017.jpg (Datei) |  |
98 KB | == Beschreibung == Feuer an der Westküste Grönlands am 3. August 2017 ==Lizenzhinweis== {| style="border:1px solid #8888aa; background-color:#f7f8ff;padding:5px;font-size:95%;" |Quelle: NASA Earth Observatory (2027): Fire and Ice in Greenland, https://science.nasa.gov/earth/earth-observatory/fire-and-ice-in-greenland-90709/<br> Lizenz: public domain |} | 1 |
| 19:04, 27. Mai 2026 | GIS-algal-bloom-2016.jpg (Datei) |  |
35 KB | == Beschreibung == Dunkle Eisoberfläche auf dem Grönländischen Eisschild durch Algenblüte im Sommer 2016 ==Lizenzhinweis== {| style="border:1px solid #8888aa; background-color:#f7f8ff;padding:5px;font-size:95%;" |Quelle: Williamson, C.J., J. Cook, A.G. Tedstone et al. (2020): Algal photophysiology drives darkening and melt of the Greenland Ice Sheet, Proc. Natl. Acad. Sci. U.S.A. 117 (11) 5694-5705, https://doi.org/10.1073/pnas.1918412117<br> Lizenz: CC BY http://creativecommons.org/licenses/by… | 1 |
| 18:55, 27. Mai 2026 | Ice-sheet-processes-2.jpg (Datei) |  |
58 KB | == Beschreibung == Die Abb. zeigt Prozesse, die zum Abschmelzen des Grönländischen Eisschilds beitragen. ==Lizenzhinweis== {| style="border:1px solid #8888aa; background-color:#f7f8ff;padding:5px;font-size:95%;" |Quelle: Winkelmann, R., L. Nicola & D. Notz (2022): The Antarctic Ice Sheet–A Sleeping Giant? Front. Young Minds. 10:702643. doi: 10.3389/frym.2022.702643, https://kids.frontiersin.org/articles/10.3389/frym.2022.702643 <br> Lizenz: [https://creativecommons.org/licenses/by/4.0/ CC BY 4.… | 1 |
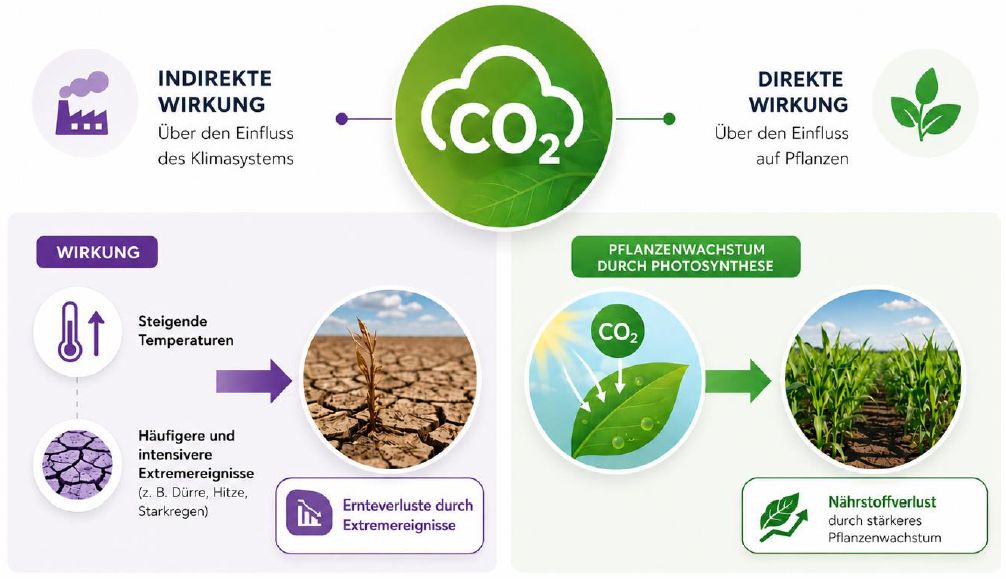
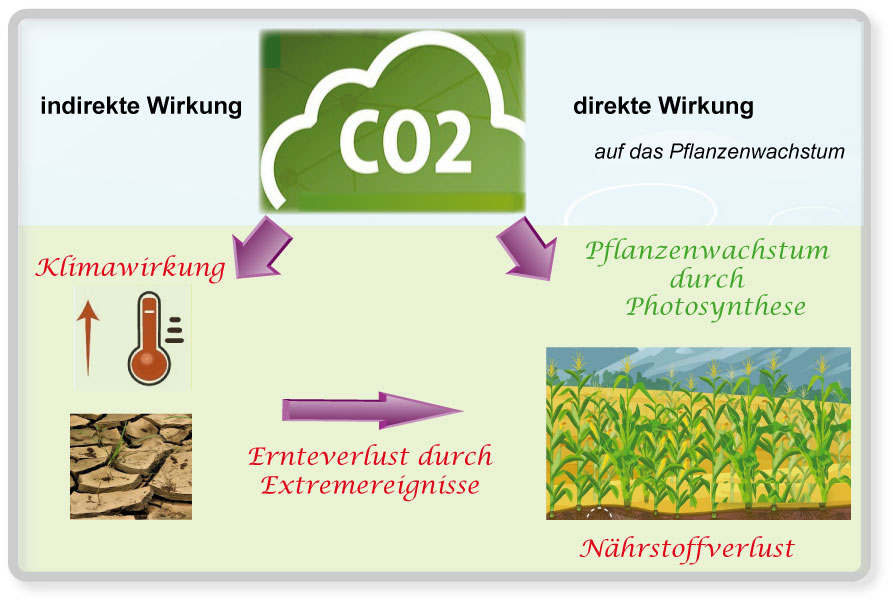
| 16:39, 21. Mai 2026 | Klima- und CO2-Wirkung.jpg (Datei) |  |
80 KB | == Beschreibung == Indirekte und direkte Wirkung von Kohlendioxid auf die Landwirtschaft. ==Lizenzhinweis== {| style="border:1px solid #8888aa; background-color:#f7f8ff;padding:5px;font-size:95%;" | eigene Darstellung<br> Lizenz: CC BY-SA |} | 1 |
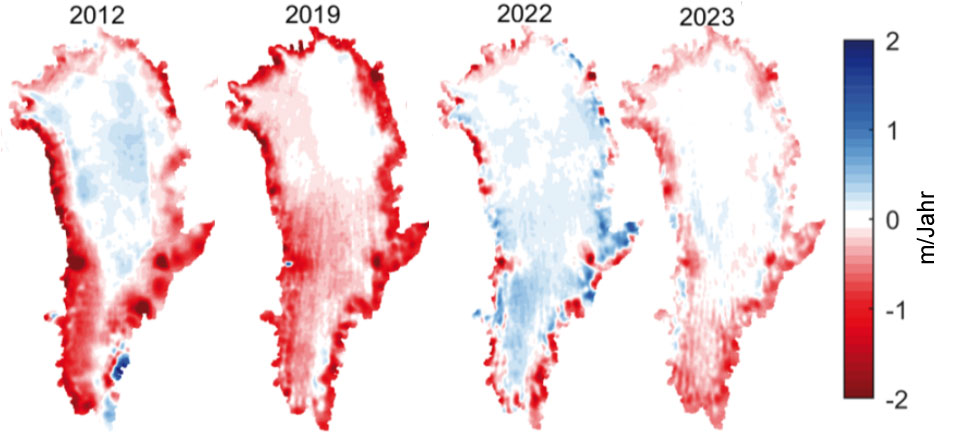
| 15:14, 20. Mai 2026 | Greenland-melting-4-years.jpg (Datei) |  |
65 KB | == Beschreibung == Höhenänderung der Oberfläche Grönlands durch das Abschmelzen von Eis in m/Jahr. 2012 und 2019 waren die Jahre mit dem stärksten Abschmelzen an der Oberfläche des Eisschildes. ==Lizenzhinweis== {| style="border:1px solid #8888aa; background-color:#f7f8ff;padding:5px;font-size:95%;" |Quelle: Khan, S. A., H. Seroussi, M. Morlighem et al. (2025): Smoothed monthly Greenland ice sheet elevation changes during 2003–2023, https://doi.org/10.5194/essd-17-3047-2025<br> Lizenz: CC BY 4.… | 1 |
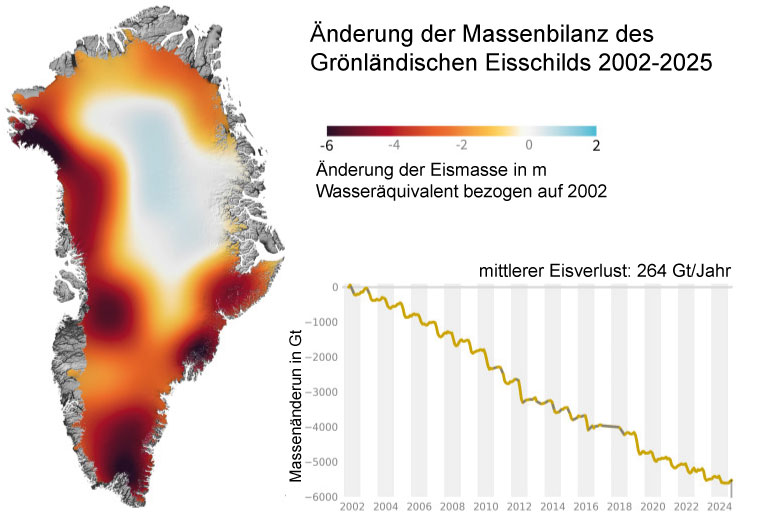
| 15:05, 20. Mai 2026 | GIS-Masse-2002-2025.jpg (Datei) |  |
61 KB | Änderung der Massenbilanz des Grönländischen Eisschildes 2002-2025 ==Lizenzhinweis== {| style="border:1px solid #8888aa; background-color:#f7f8ff;padding:5px;font-size:95%;" |Quelle: NASA (2025): Greenland Ice Mass Loss 2002-2025, https://svs.gsfc.nasa.gov/31156/ , übersetzt<br> Lizenz: public domain |} | 1 |
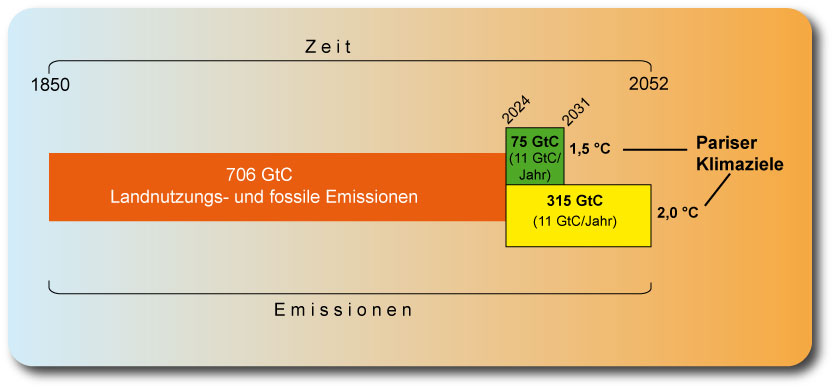
| 16:55, 13. Mai 2026 | Verbleibendes-Budget.jpg (Datei) |  |
37 KB | 3 | |
| 12:47, 12. Mai 2026 | Mangrove loss driver.jpg (Datei) |  |
113 KB | 2 | |
| 09:01, 11. Mai 2026 | CO2 Düngung.jpg (Datei) |  |
95 KB | 2 | |
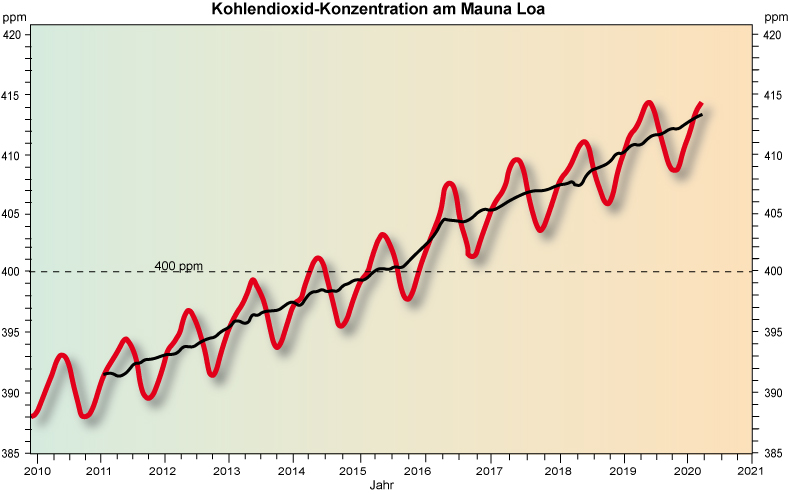
| 17:08, 8. Mai 2026 | CO2-konzentration aktuell.jpg (Datei) |  |
90 KB | 11 | |
| 17:06, 8. Mai 2026 | Konzentration CO2 aktuell.jpg (Datei) |  |
150 KB | 7 | |
| 19:01, 7. Mai 2026 | Klima2know Logo.jpg (Datei) | 26 KB | == Beschreibung == Klima2know - das Logo für das neue Portal für junge Leute == Lizenzhinweis == {| style="border:1px solid #8888aa; background-color:#f7f8ff;padding:5px;font-size:95%;" | |} | 1 | |
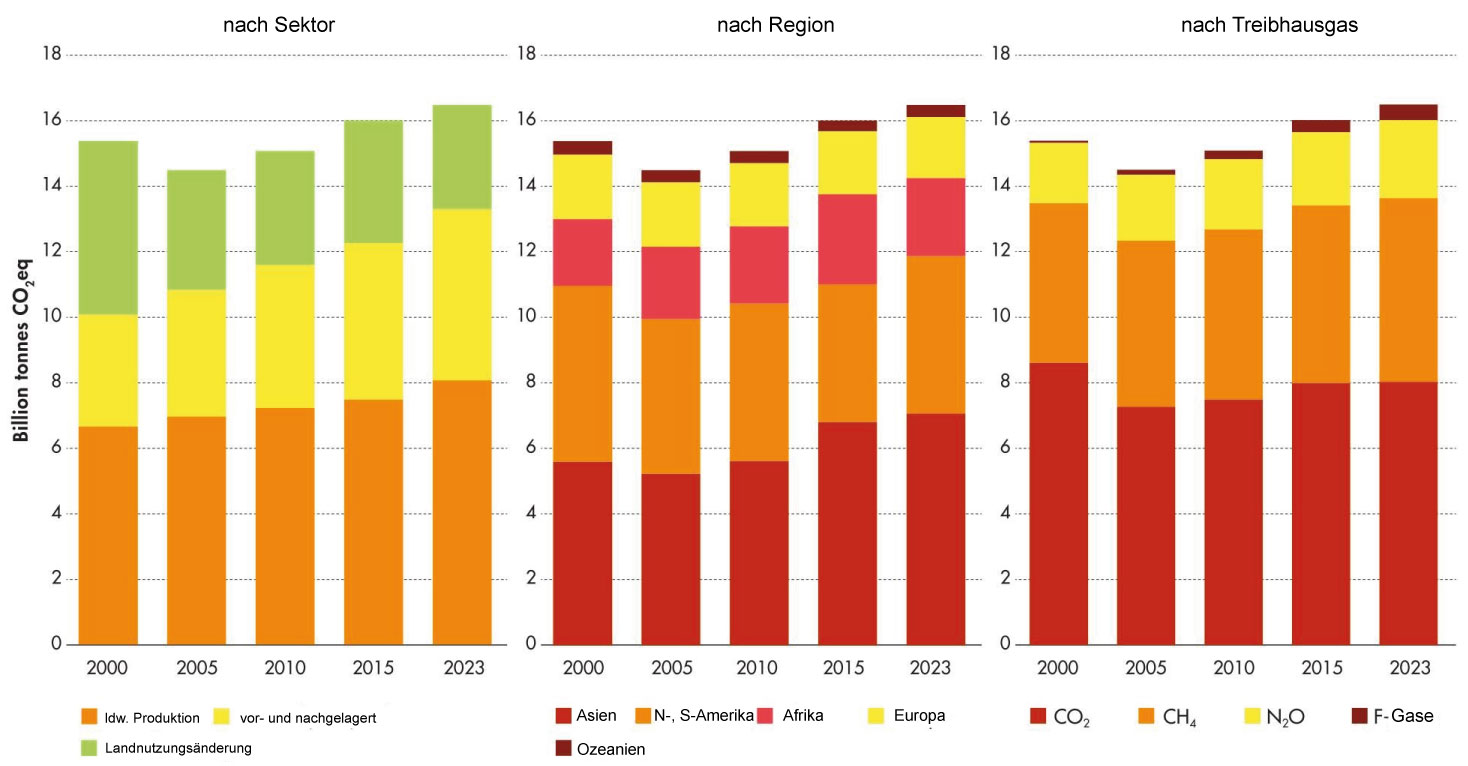
| 19:49, 9. Mär. 2026 | GHG-emissions-AFOLU-25-dt.jpg (Datei) |  |
127 KB | == Beschreibung == Globale Treibhausgasemissionen aus der landwirtschaftlichen Produktion sowie vor- und nachgelagerte Aktivitäten (z.B. Futtermittel- und Saatgutherstellung bzw. Transport und Vermarktung) ==Lizenzhinweis== {| style="border:1px solid #8888aa; background-color:#f7f8ff;padding:5px;font-size:95%;" | Quelle:FAO (2024): [https://doi.org/10.4060/cd2971en World Food and Agriculture – Statistical Yearbook 2024]. Rome, Lizenz: [https://creativecommons.org/licenses/by/4.0/legalcode.e CC… | 1 |
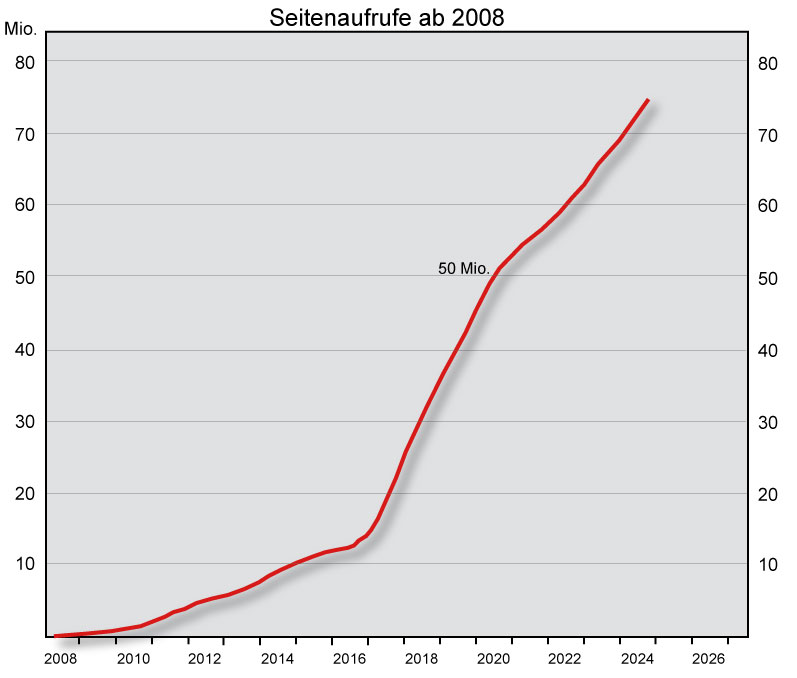
| 17:31, 26. Feb. 2026 | Wiki-Statistik.jpg (Datei) |  |
42 KB | 3 | |
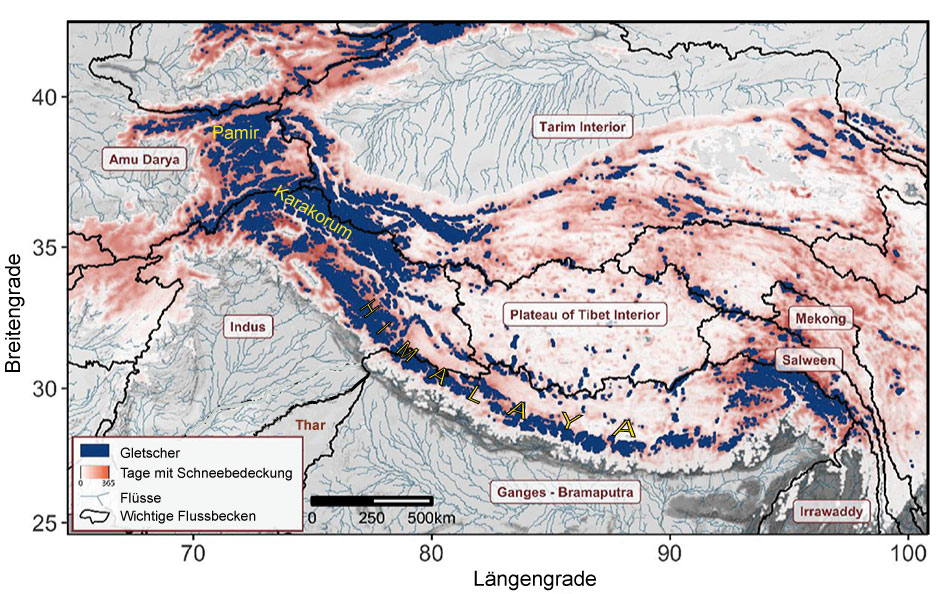
| 16:04, 26. Feb. 2026 | Gletscher-Flussbecken-Himalaya.jpg (Datei) |  |
199 KB | Die Hindukusch-Himalaya-Region mit den wichtigsten Flusseinzugsgebieten. ==Lizenzhinweis== {| style="border:1px solid #8888aa; background-color:#f7f8ff;padding:5px;font-size:95%;" | Quelle: Sharma, E., D. Molden, A. Rahman, Y.R. Khatiwada, L. Zhang, S.P. Singh, T. Yao, and P.s Wester (2019): Introduction to the Hindu Kush Himalaya Assessment, in: P. Wester et al. (eds.) (2019): The Hindu Kush Himalaya Assessment, Figure 1.1, https://doi.org/10.1007/978-3-319-92288-1_7 </br> Lizenz: [https://cr… | 1 |
| 14:44, 26. Feb. 2026 | Climate extremes trends.jpg (Datei) |  |
53 KB | 2 | |
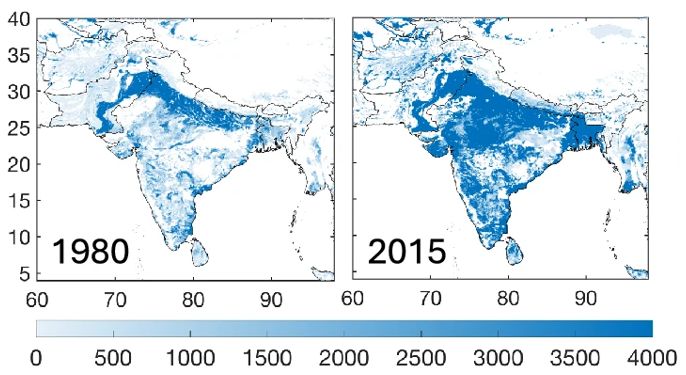
| 18:28, 25. Feb. 2026 | Südasien Bewässerungsfläche.jpg (Datei) |  |
54 KB | Bewässerungsfläche in Südasien 1980 und 2015 ==Lizenzhinweis== {| style="border:1px solid #8888aa; background-color:#f7f8ff;padding:5px;font-size:95%;" | Quelle: Karimzadeh, S., Ahmadi, A., Baldocchi, D. et al. Climate change has increased global evaporative demand except in South Asia. Commun Earth Environ 6, 1009 (2025). https://doi.org/10.1038/s43247-025-02959-x </br> Lizenz: [https://creativecommons.org/licenses/by/4.0/ CC BY] |} | 1 |
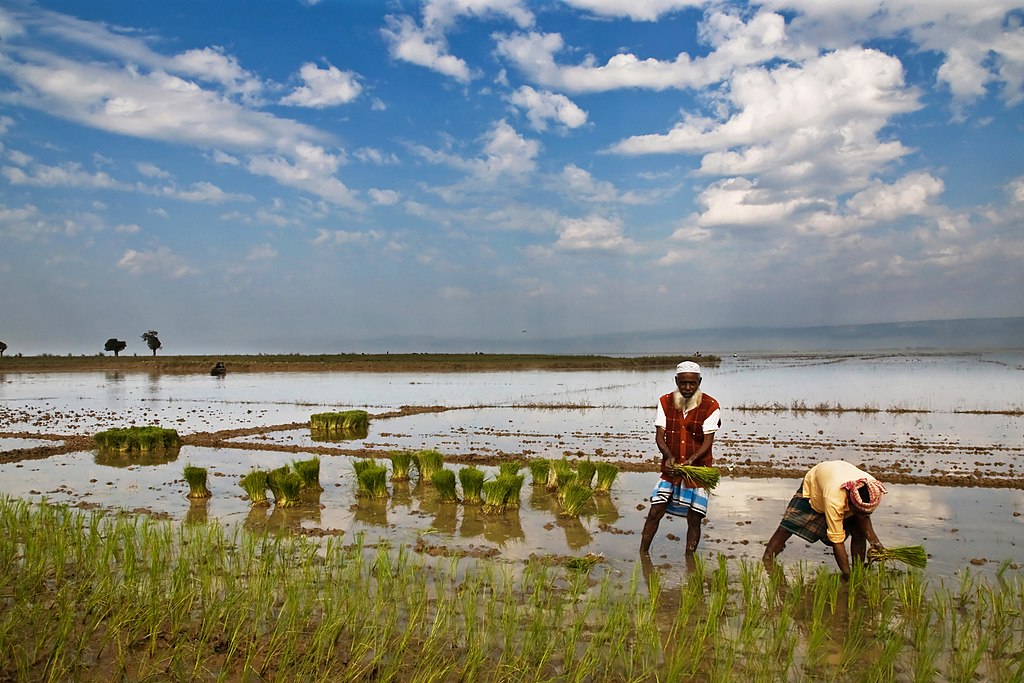
| 17:54, 25. Feb. 2026 | Rice planting Bangladesh.jpg (Datei) |  |
180 KB | Bewässerter Reisanbau ==Lizenzhinweis== {| style="border:1px solid #8888aa; background-color:#f7f8ff;padding:5px;font-size:95%;" | Quelle: Wikimedia Commons (2011): Planting of paddy by a Bangladeshi farmers, https://commons.wikimedia.org/wiki/File:Agriculture_in_Bangladesh_12.jpg </br> Lizenz: CC BY-SA https://creativecommons.org/licenses/by-sa/3.0/deed.en |} | 1 |
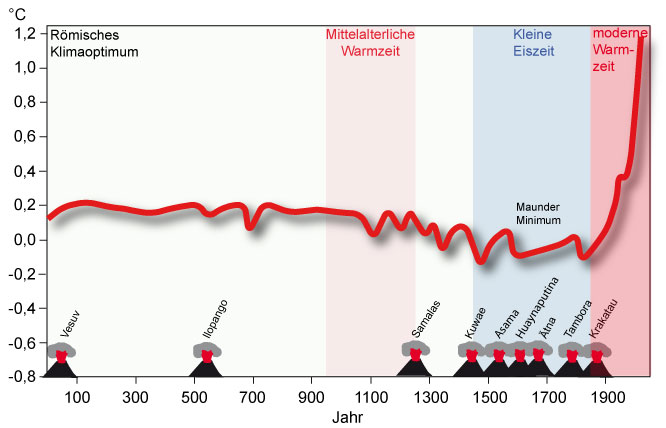
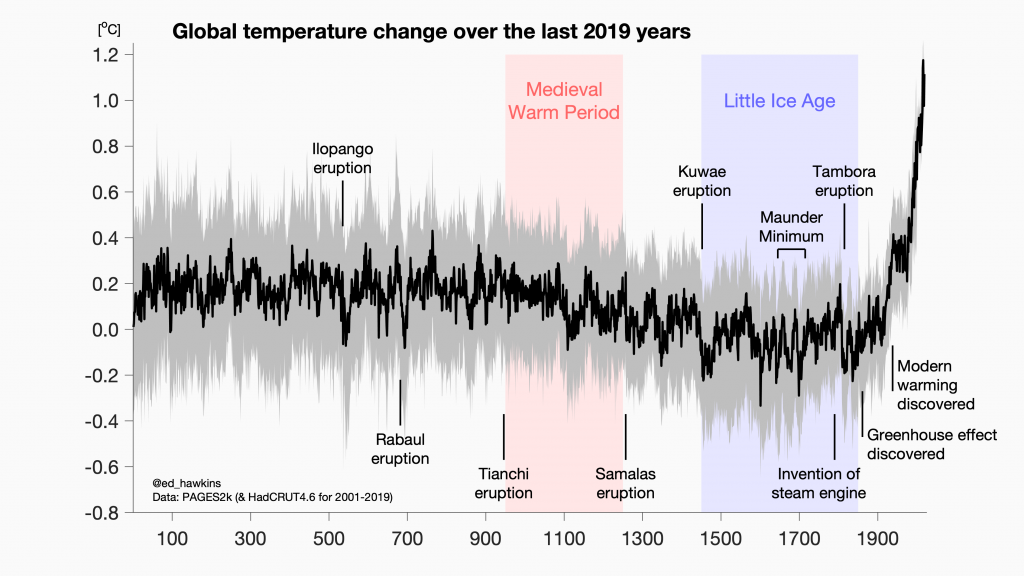
| 10:14, 18. Feb. 2026 | Temp-global-2000.jpg (Datei) |  |
42 KB | == Beschreibung == Temperaturänderung der letzten ca. 2000 Jahre im Vergleich zu 1850-1900. ==Lizenzhinweis== {| style="border:1px solid #8888aa; background-color:#f7f8ff;padding:5px;font-size:95%;" |Quelle: Eigene Darstellung, angelehnt an Ed Hawkins (2020): 2019 years https://www.climate-lab-book.ac.uk/2020/2019-years/; ursprgl. Daten nach PAGES2k, Vulkane beispielhaft nach verschiedenen Quellen<br> Lizenz: CC BY-SA |} | 1 |
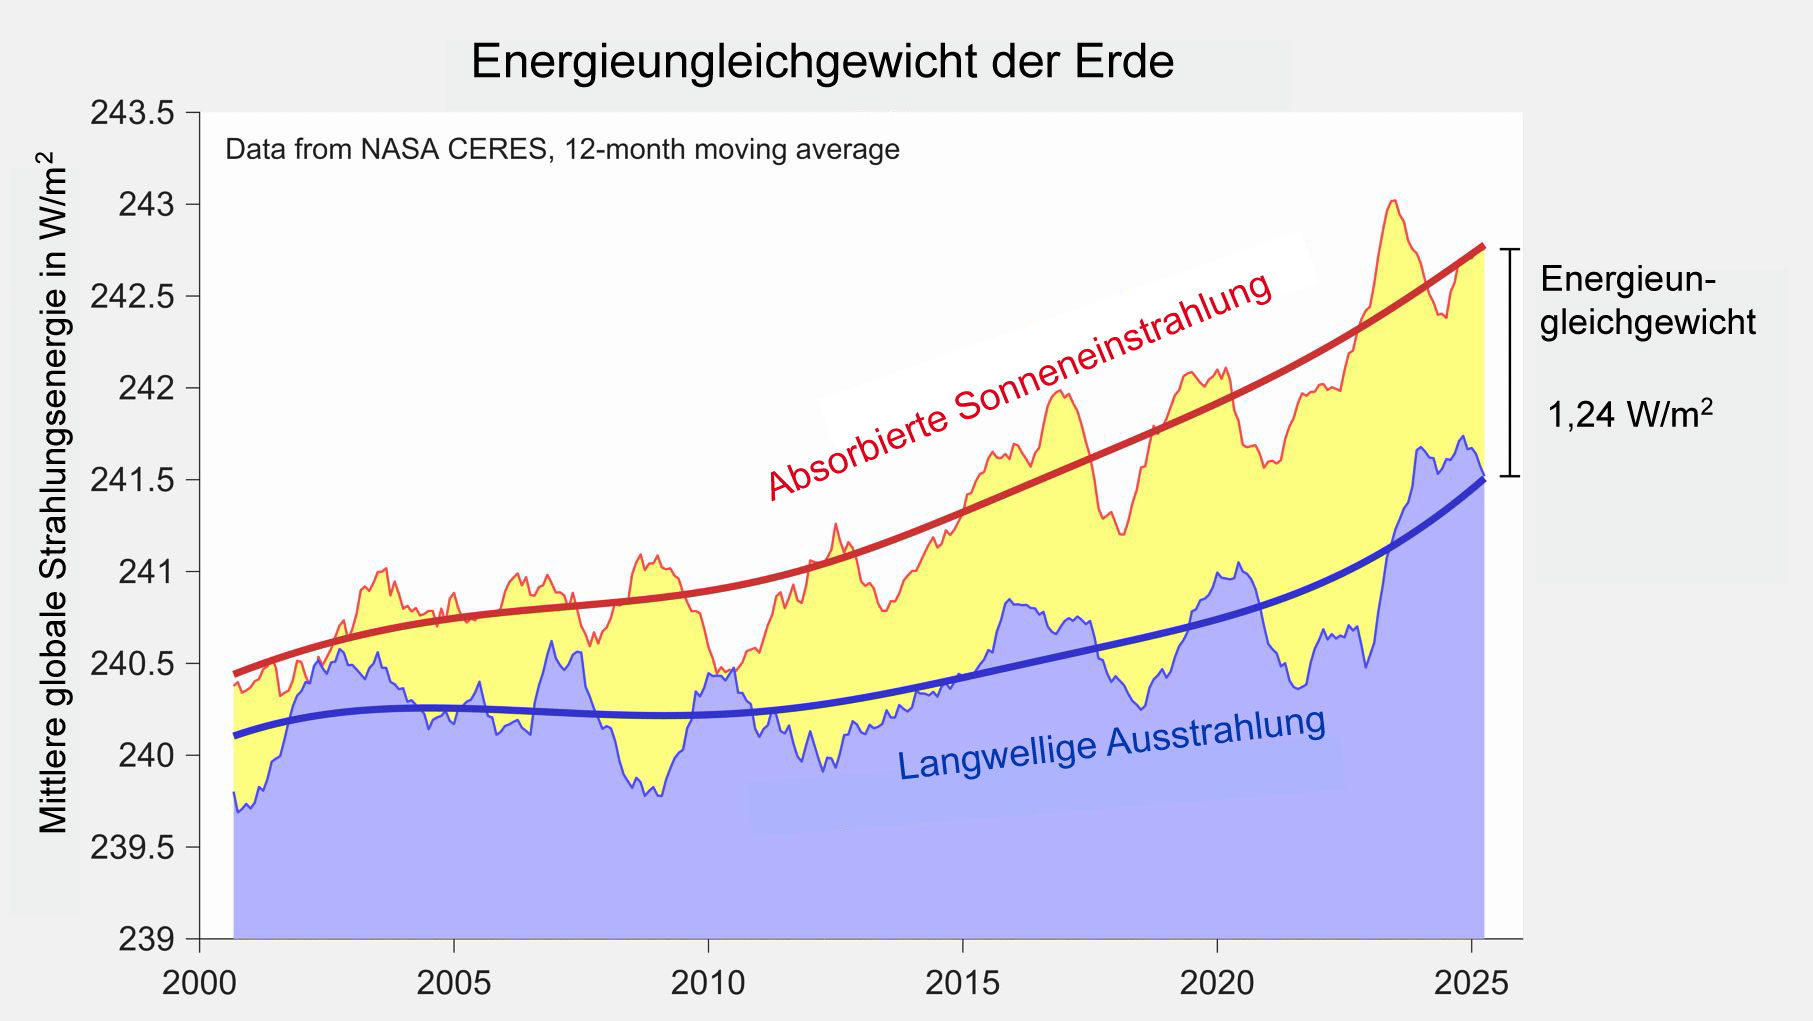
| 17:22, 9. Feb. 2026 | EEI 2000-2025.jpg (Datei) |  |
166 KB | 3 | |
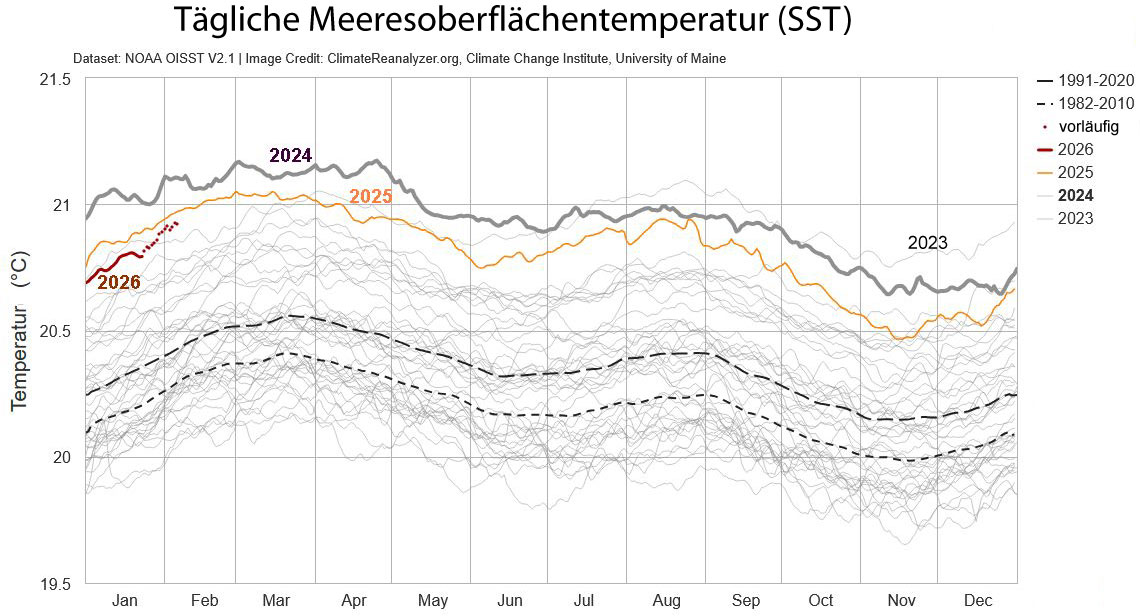
| 19:35, 7. Feb. 2026 | SST global 2025.jpg (Datei) |  |
128 KB | 2 | |
| 17:39, 7. Feb. 2026 | SST-2025-regional-dt.jpg (Datei) |  |
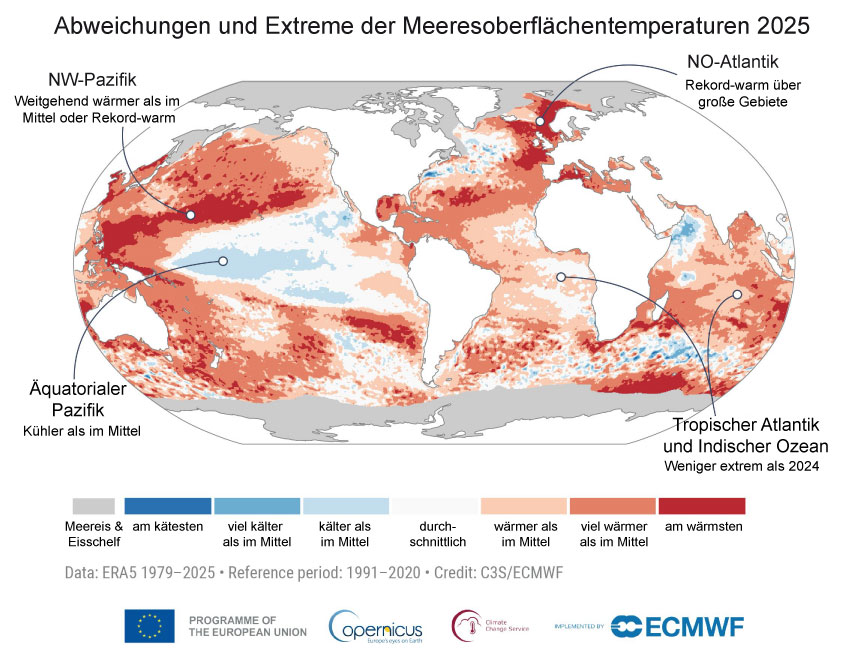
128 KB | == Beschreibung == Abweichungen und Extreme der Meeresoberflächentemperaturen für 2025. Die Abweichungen (kühler, wärmer) beziehen sich auf die Referenzperiode 1991-2020, die Extreme (kälteste, wärmste) auf 1979-2025). Verändert, übersetzt. == Lizenzhinweis == {| style="border:1px solid #8888aa; background-color:#f7f8ff;padding:5px;font-size:95%;" | Quelle: Copernicus Climate Change (2026): Global Climate Highlights 2025, graphics gallery, https://climate.copernicus.eu/GCH2025-graphics-gallery… | 1 |
| 16:47, 7. Feb. 2026 | Globale temp1850-2025.jpg (Datei) |  |
60 KB | 1 | |
| 10:13, 5. Feb. 2026 | ENSO global temp 1950-2025.png (Datei) |  |
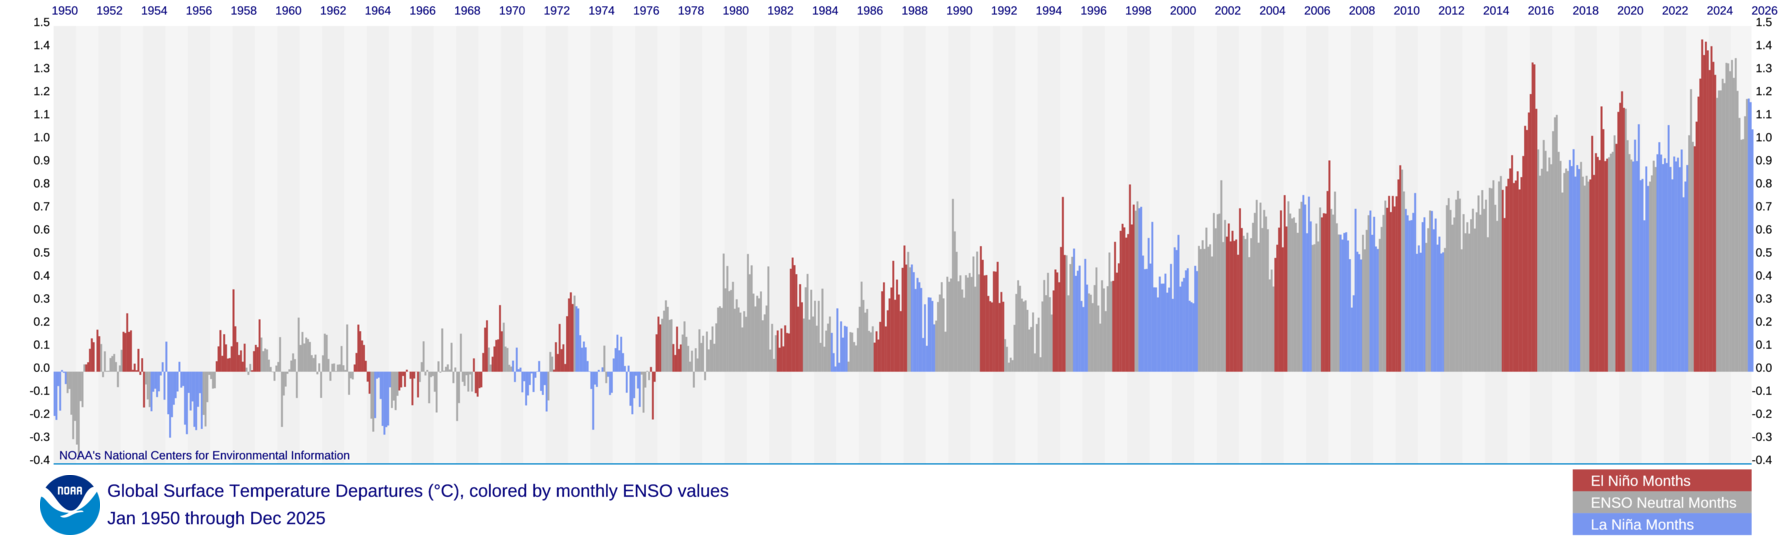
381 KB | == Beschreibung == Änderung der Globalen Monatsmitteltemperaturen und El-Niño- (rot), La-Niña- (blau) und neutrale (grau) Jahre 1950-2025 ==Lizenzhinweis== {| style="border:1px solid #8888aa; background-color:#f7f8ff;padding:5px;font-size:95%;" | Quelle: NOAA National Centers for Environmental Information (2025): [https://www.ncei.noaa.gov/access/monitoring/monthly-report/global/202513 Global Climate Report 2025] <br> Lizenz: public domain |} | 1 |
| 09:51, 5. Feb. 2026 | Land ocean temp1850-2025.png (Datei) |  |
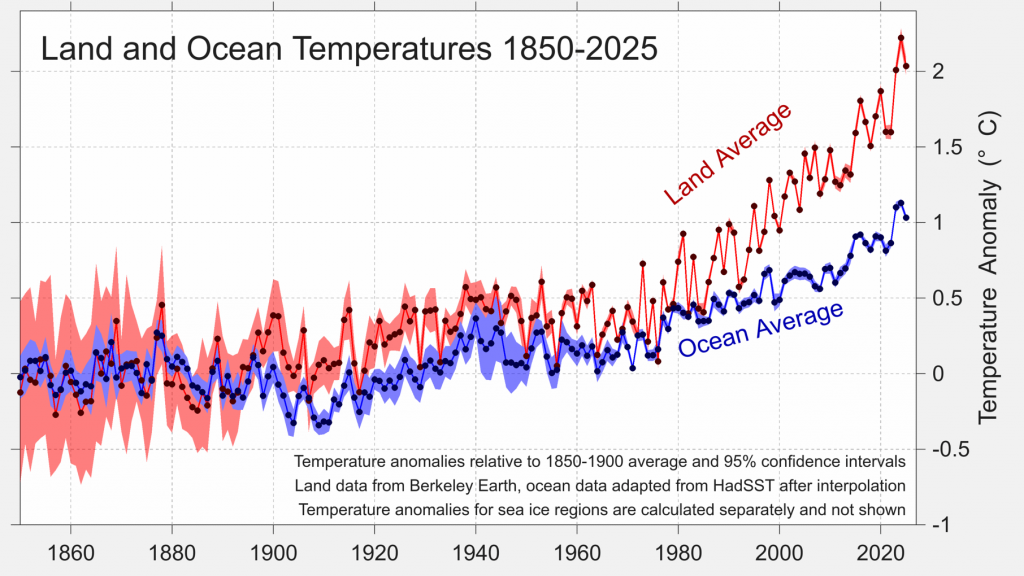
385 KB | == Beschreibung == Erwärmung über Land und Ozean 1850-2025. Temperaturabweichung vom vorindustriellen Mittel 1850-1900. == Lizenzhinweis == {| style="border:1px solid #8888aa; background-color:#f7f8ff;padding:5px;font-size:95%;" | Quelle: Rohde, R., Berkeley Earth (2026): [https://berkeleyearth.org/global-temperature-report-for-2025/ Global Temperature Report for 2025] <br> Lizenz: [https://creativecommons.org/licenses/by-nc/4.0/ CC BY-NC] |} | 1 |
| 09:32, 5. Feb. 2026 | Globale temp1850-2025.png (Datei) |  |
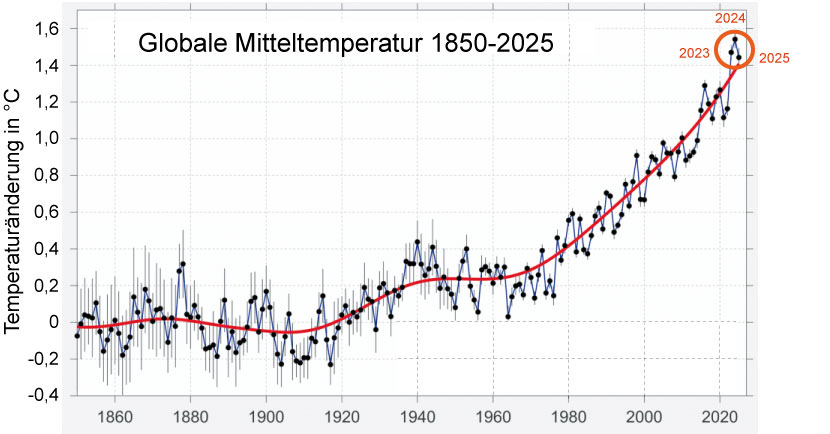
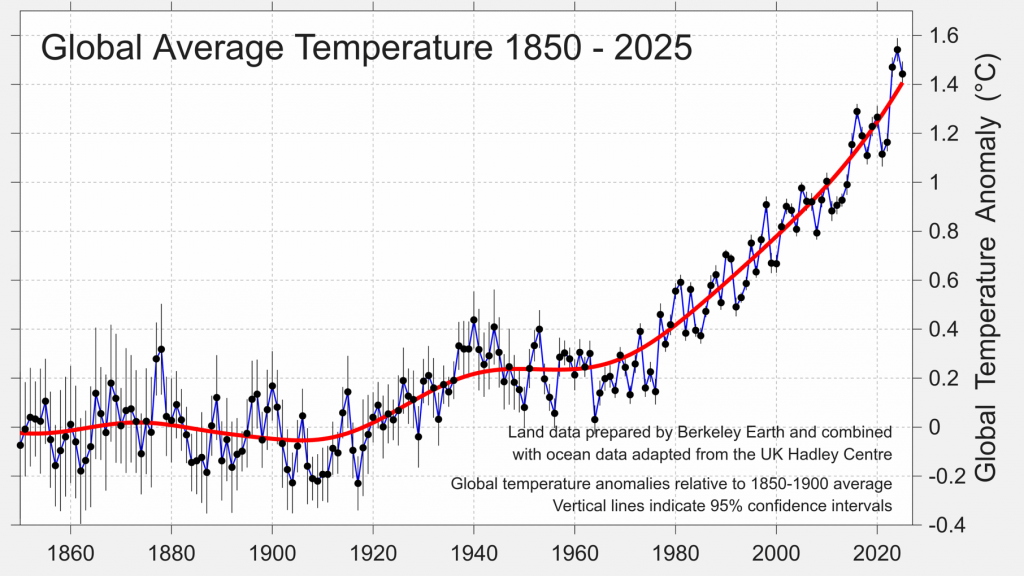
332 KB | == Beschreibung == Globale Jahresmitteltemperatur 1850-2025, relativ zum Mittel 1850-1900 (vorindustriell). Vertikale Linien zeigen Unsicherheitsbereiche an. == Lizenzhinweis == {| style="border:1px solid #8888aa; background-color:#f7f8ff;padding:5px;font-size:95%;" | Quelle: Rohde, R. (2026): [https://berkeleyearth.org/global-temperature-report-for-2025/ Global Temperature Report for 2025]<br> Lizenz: [https://creativecommons.org/licenses/by-nc/4.0/ CC BY-NC 4.0] |} | 1 |
| 19:26, 30. Jan. 2026 | Lübeck im Spätmittelalter.jpg (Datei) |  |
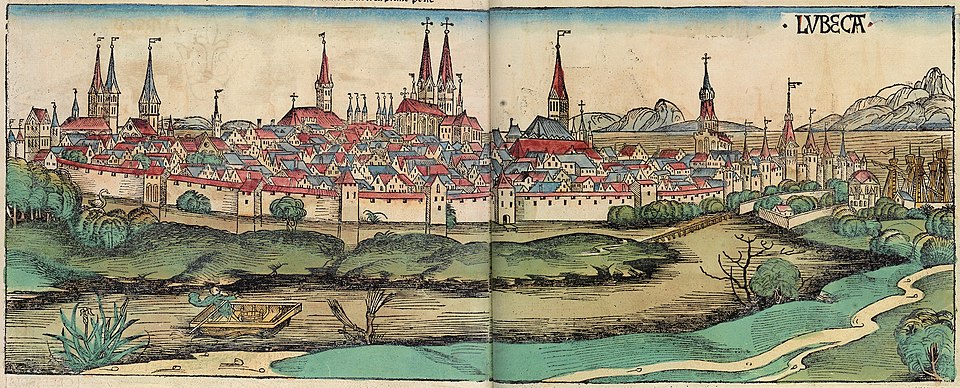
186 KB | == Beschreibung == Lübeck im Spätmittelalter ==Lizenzhinweis== {| style="border:1px solid #8888aa; background-color:#f7f8ff;padding:5px;font-size:95%;" |Quelle: Wikimedia Commons (2009): Abbildung aus der Schedelschen Weltchronik, https://commons.wikimedia.org/wiki/File:Nuremberg_chronicles_f_265-66_(Lubeca).jpg <br> Lizenz: public domain |} | 1 |
| 12:10, 24. Jan. 2026 | Klimawandel-Landwirtschaft.jpg (Datei) |  |
91 KB | Folgen des Klimawandels für die Landwirtschaft ==Lizenzhinweis== {| style="border:1px solid #8888aa; background-color:#f7f8ff;padding:5px;font-size:95%;" | Quelle: Lotze-Campen, H., T. Conradt, F. Ewert u.a. (2023): Klimawirkungen und Anpassung in der Landwirtschaft, in: Brasseur, G.P. , D. Jacob & S. Schuck-Zöller, Hrsg. (2023): Klimawandel in Deutschland, 2. Aufl. https://link.springer.com/book/10.1007/978-3-662-66696-8<br> Lizenz: [https://creativecommons.org/licenses/by/4.0/ CC BY] Mit KI b… | 1 |
| 11:17, 12. Jan. 2026 | Klima-Konsens.jpg (Datei) |  |
16 KB | == Beschreibung == Klima-Konsens nach zwei wissenschaftlichen Untersuchungen ==Lizenzhinweis== {| style="border:1px solid #8888aa; background-color:#f7f8ff;padding:5px;font-size:95%;" | Quelle: SkepticalScience: Consensus studies 2004-2021, https://skepticalscience.com/graphics.php?g=466 <br> Lizenz: CC BY-SA |} | 1 |
| 11:12, 12. Jan. 2026 | Consensus scientists dt.jpg (Datei) |  |
98 KB | == Beschreibung == 97 von 100 Klimawissenschaftlern denken, dass der Mensch das Klima verändert. ==Lizenzhinweis== {| style="border:1px solid #8888aa; background-color:#f7f8ff;padding:5px;font-size:95%;" | Quelle: SkepticalScience: Scientific Consensus on Global Warming, https://skepticalscience.com/graphics.php?g=1 <br> Lizenz: CC BY-SA |} | 1 |
| 20:20, 10. Jan. 2026 | CO2 T Erdneuzeit einfach.jpg (Datei) |  |
55 KB | == Beschreibung == Änderung der CO2-Konzentration und der Temperatur in den letzten 60 Mio. Jahren (Erdneuzeit) ==Lizenzhinweis== {| style="border:1px solid #8888aa; background-color:#f7f8ff;padding:5px;font-size:95%;" |Quelle: Eigene Darstellung, angelehnt an IPCC AR6 WGI (2021): Technical Summary; Hansen et al. (2013): Climate sensitivity, sea level and atmospheric carbon dioxide, Philosophical Transactions of the Royal Society A 371<br> Lizenz: CC BY-SA |} | 1 |
| 18:51, 4. Jan. 2026 | Historische Vulkanausbrüche.jpg (Datei) |  |
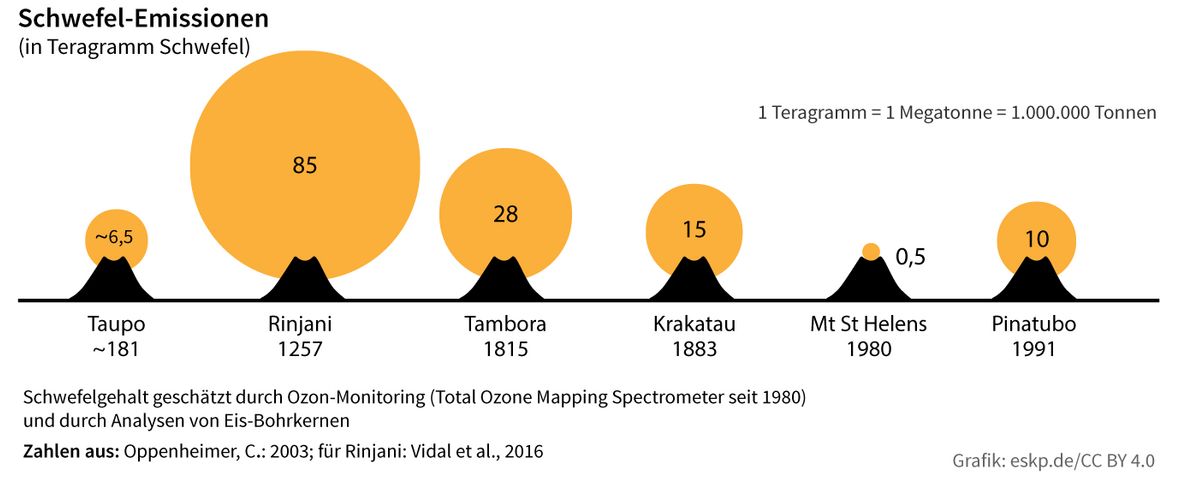
55 KB | == Beschreibung == Historische Vulkanausbrüche mit Angaben zu den Schwefel-Emissionen ==Lizenzhinweis== {| style="border:1px solid #8888aa; background-color:#f7f8ff;padding:5px;font-size:95%;" | Quelle: Wagner, S. (2020): Vulkanismus und Klima in der Vergangenheit: Was lässt sich für die Zukunft lernen? In: Jorzik, O., J. Kandarr, P. Klinghammer & D. Spreen (Hrsg.), ESKP-Themenspezial Vulkanismus und Gesellschaft. Zwischen Risiko, Vorsorge und Faszination, https://themenspezial.eskp.de/vulkanis… | 1 |
| 13:33, 4. Jan. 2026 | Temp pattern 1999-2008.jpg (Datei) |  |
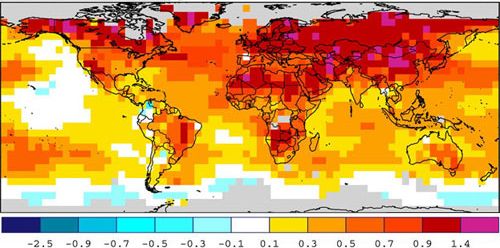
37 KB | == Beschreibung == Geographische Temperaturmuster 1999-2008 im Vergleich zu 1961-1990 ==Lizenzhinweis== {| style="border:1px solid #8888aa; background-color:#f7f8ff;padding:5px;font-size:95%;" |Quelle: SkepticalScience (2025): [https://skepticalscience.com/medieval-warm-period-intermediate.htm How does the Medieval Warm Period compare to current global temperatures?]<br> Lizenz: [http://creativecommons.org/licenses/by-nd/3.0/ CC BY] |} | 1 |
| 13:28, 4. Jan. 2026 | Temperature Pattern MWP.gif (Datei) |  |
52 KB | == Beschreibung == Geographische Temperaturmuster in der Mittelalterlichen Warmzeit (950-1250) im Vergleich zu 1961-1990. Grau: keine Daten. ==Lizenzhinweis== {| style="border:1px solid #8888aa; background-color:#f7f8ff;padding:5px;font-size:95%;" |Quelle: SkepticalScience (2025): How does the Medieval Warm Period compare to current global temperatures?, https://skepticalscience.com/medieval-warm-period-intermediate.htm<br> Lizenz: CC BY http://creativecommons.org/licenses/by-nd/3.0/ |} | 1 |
| 15:50, 2. Jan. 2026 | Global temp 2000years.png (Datei) |  |
289 KB | == Beschreibung == Globale Temperatur der letzten ca. 2000 Jahre. Hervorgehoben sind einzelne Vulkanausbrüche, die Mittelalterliche Warmperiode und die Kleine Eiszeit. Die Mittelalterliche Warmperiode sticht nicht besonders hervor, weil sie kein globales Phänomen war. ==Lizenzhinweis== {| style="border:1px solid #8888aa; background-color:#f7f8ff;padding:5px;font-size:95%;" | Quelle: Davies, B. (2020): Climate Change, https://www.antarcticglaciers.org/glaciers-and-climate/climate-change/<br> Liz… | 1 |
| 14:09, 2. Jan. 2026 | 2000-JahreTemp.jpg (Datei) |  |
57 KB | == Beschreibung == Temperaturveränderung der letzten 1200 Jahre auf der Nordhemisphäre im Vergleich zu 1850–1900 - verändert, übersetzt ==Lizenzhinweis== {| style="border:1px solid #8888aa; background-color:#f7f8ff;padding:5px;font-size:95%;" |Quelle: Esper, J., J.E. Smerdon, K.J. Anchukaitis et al. (2024): [https://doi.org/10.1038/s43247-024-01371-1 The IPCC’s reductive Common Era temperature history]. Commun Earth Environ 5, 222<br> Lizenz: [http://creativecommons.org/licenses/by/4.0/ CC BY]… | 1 |
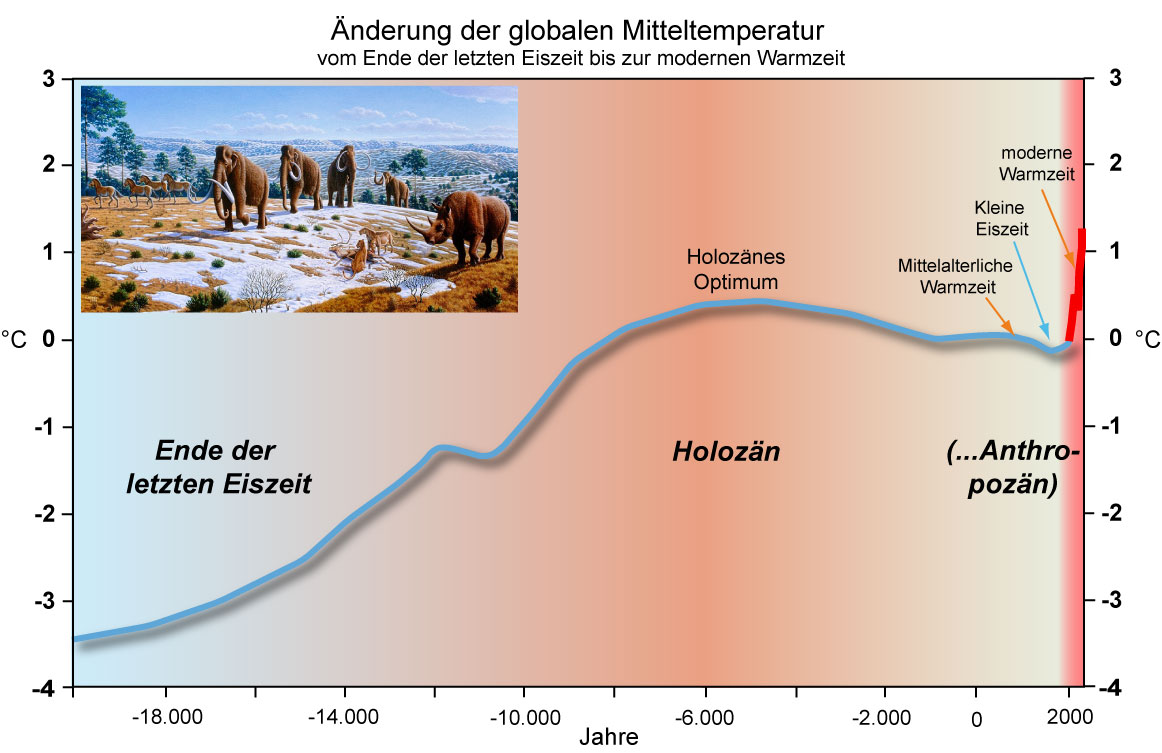
| 12:50, 29. Dez. 2025 | Temp-20.000-Jahre.jpg (Datei) |  |
123 KB | == Beschreibung == Änderung der globalen Mitteltemperatur im Vergleich zu vorindustriell vom Ende der letzten Eiszeit bis zur modernen, durch den Menschen verursachten Warmzeit. Eine neue geologische Epoche, das Anthropozän, wird von vielen Wissenschaftlern gefordert, ist jedoch nicht allgemein anerkannt. ==Lizenzhinweis== {| style="border:1px solid #8888aa; background-color:#f7f8ff;padding:5px;font-size:95%;" | Quelle: Eigene Darstellung, angelehnt an verschiedene Quellen, u.a. USGS 2016, Skep… | 1 |
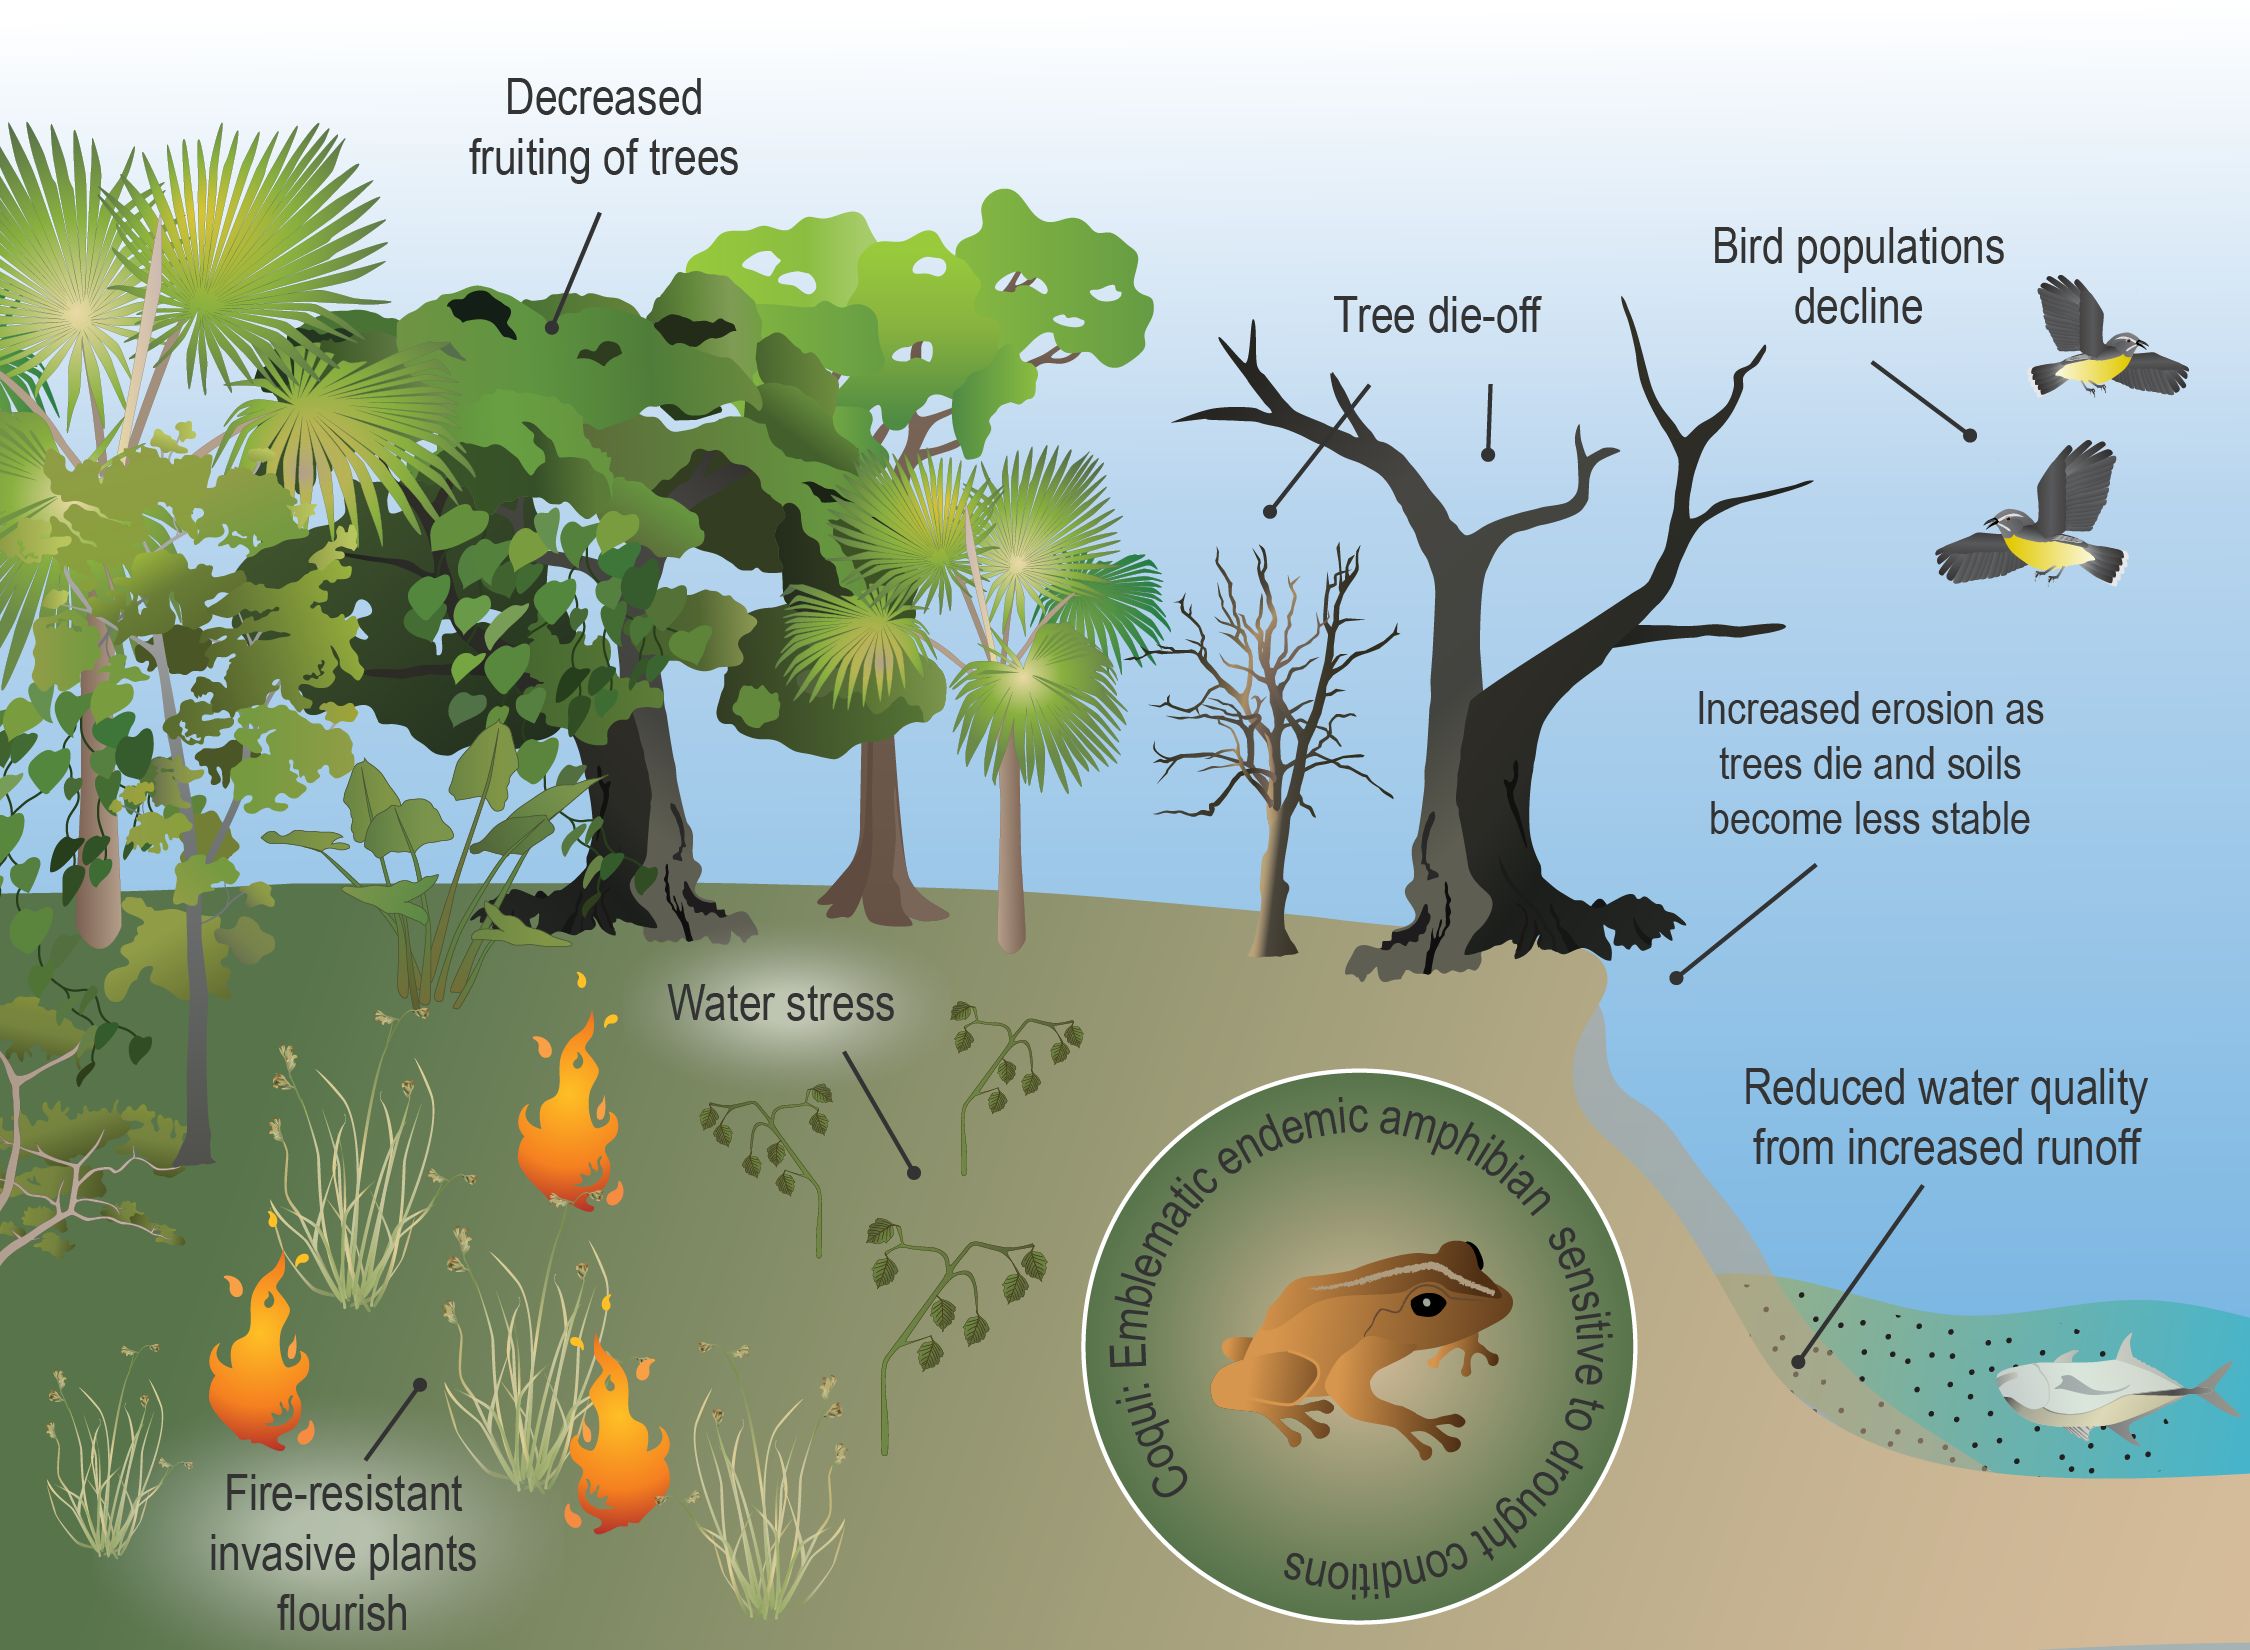
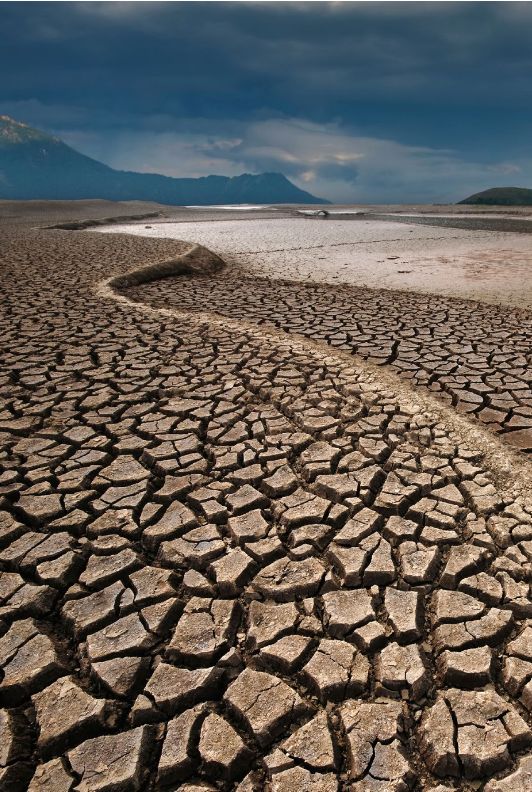
| 13:45, 25. Dez. 2025 | Drought tropical forest.jpg (Datei) |  |
359 KB | == Beschreibung == Auswirkungen von Dürren im tropischen Regenwald. ==Lizenzhinweis== {| style="border:1px solid #8888aa; background-color:#f7f8ff;padding:5px;font-size:95%;" |Quelle: USGS, S. Crausbay et al. : Drought Impacts to Tropical Forest Ecosystems in the U.S. Caribbean, https://www.usgs.gov/programs/climate-adaptation-science-centers/drought-impacts-tropical-forest-ecosystems-us-caribbean <br> Lizenz: public domain |} | 1 |
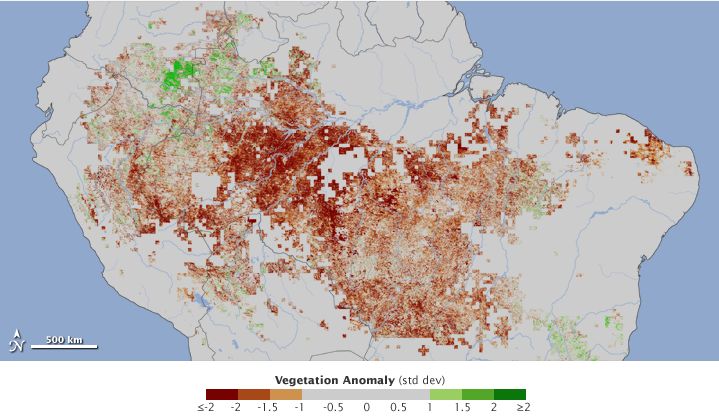
| 13:36, 25. Dez. 2025 | Vegetationsindex Amazonas 2010.jpg (Datei) |  |
59 KB | == Beschreibung == Dürre Amazonas 2010: Die Vegetationskarte zeigt das weit verbreitete Braunwerden des Amazonas-Regenwaldes ==Lizenzhinweis== {| style="border:1px solid #8888aa; background-color:#f7f8ff;padding:5px;font-size:95%;" |Quelle: NASA Earth Observatory (2011): 2010 Drought in the Amazon Forest, https://earthobservatory.nasa.gov/images/50136/2010-drought-in-the-amazon-forest?src=ve <br> Lizenz: public domain |} | 1 |
| 13:28, 25. Dez. 2025 | Dürreereignisse-2001-2018.jpg (Datei) |  |
95 KB | Dürreereignisse 2001-2018 ==Lizenzhinweis== {| style="border:1px solid #8888aa; background-color:#f7f8ff;padding:5px;font-size:95%;" |Quelle: Flores, B.M., E. Montoya, B. Sakschewskiet al. (2024): Critical transitions in the Amazon forest system. Nature 626, 555–564 https://doi.org/10.1038/s41586-023-06970-0<br> Lizenz: CC BY http://creativecommons.org/licenses/by/4.0/ |} | 1 |
| 11:50, 25. Dez. 2025 | Dürre am Amazonas.jpg (Datei) |  |
132 KB | Ausgetrockneter Boden am Amazonas-Ufer ==Lizenzhinweis== {| style="border:1px solid #8888aa; background-color:#f7f8ff;padding:5px;font-size:95%;" | Quelle: Nobre, A.D., (2014): The Future Climate of Amazonia, Scientific Assessment Report. Sponsored by CCST-INPE, INPA and ARA. São José dos Campos, Brazil, 42p, http://www.ccst.inpe.br/wp-content/uploads/2014/11/The_Future_Climate_of_Amazonia_Report.pdf Lizenz: CC BY-NC http://creativecommons.org/licenses/by-nc/4.0/ |} | 1 |
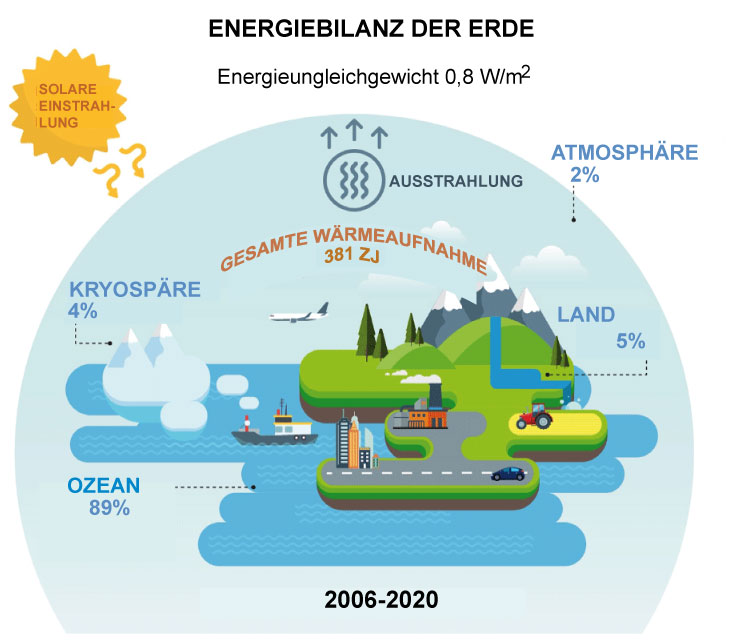
| 21:42, 22. Dez. 2025 | Energiebilanz-2006-2020.jpg (Datei) |  |
66 KB | == Beschreibung == Energiebilanz der Erde und die Aufteilung der zusätzlichen Erwärmung (Total Heat Gain) auf Atmosphäre (1%), Kryospäre (4 %), Land (6%) und Ozean (89%) für 2006-2020 (1971-2020 in Klammern) in Zeta Joule (1 ZJ = 1021 J) == Lizenzhinweis == {| style="border:1px solid #8888aa; background-color:#f7f8ff;padding:5px;font-size:95%;" | Quelle: von Schuckmann, K., A. Minière, F. Gues et al. (2023): Heat stored in the Earth system 1960–2020: where does the energy go? Earth Syst. Sci.… | 1 |
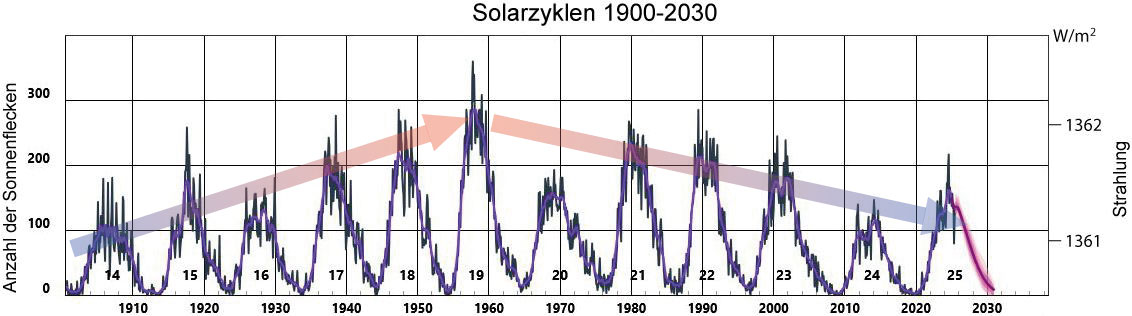
| 12:03, 21. Dez. 2025 | Solarzyklen-1900-2030.jpg (Datei) |  |
67 KB | 2 | |
| 11:10, 21. Dez. 2025 | Sun and Earth.jpg (Datei) |  |
20 KB | == Beschreibung == Ohne die Sonne gäbe es kein Leben auf der Erde. == Lizenzhinweis == {| style="border:1px solid #8888aa; background-color:#f7f8ff;padding:5px;font-size:95%;" |Quelle: NASA Space Place: All About the Sun, https://spaceplace.nasa.gov/all-about-the-sun/en/<br> Lizenz: public domain |} | 1 |
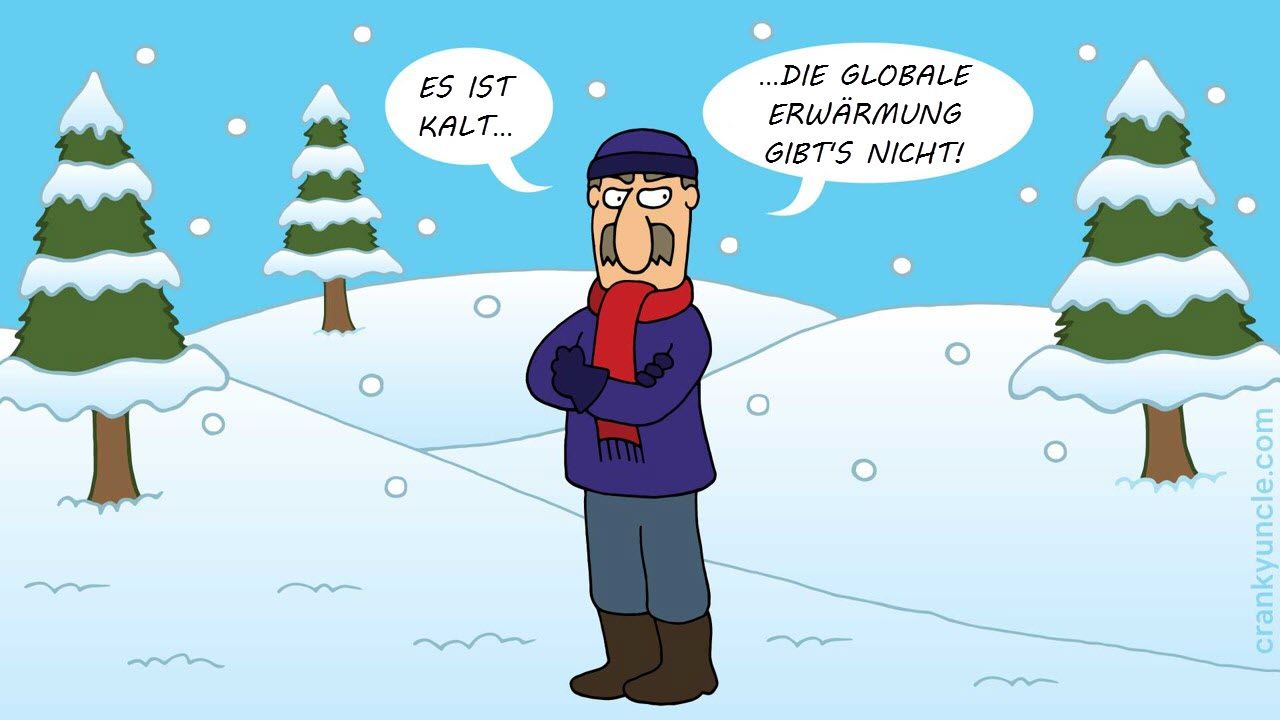
| 09:37, 20. Dez. 2025 | Kaltes Wetter.jpg (Datei) |  |
76 KB | == Beschreibung == "Heute hat es geschneit – also gibt es keine globale Erwärmung." - Meint der Klimaleugner. == Lizenzhinweis == {| style="border:1px solid #8888aa; background-color:#f7f8ff;padding:5px;font-size:95%;" |Quelle: Skeptical Science: [https://skepticalscience.com/graphics.php?g=427 Cranky Cartoon (DE) - CO<sub>2</sub> folgt Temperatur], übersetzt<br> Lizenz: CC BY-SA | 1 |
| 09:30, 20. Dez. 2025 | Klima schon immer geändert.jpg (Datei) |  |
139 KB | == Beschreibung == Das Klima hat sich schon immer geändert. Daher ist auch die gegenwärtige Änderung ganz natürlich. == Lizenzhinweis == {| style="border:1px solid #8888aa; background-color:#f7f8ff;padding:5px;font-size:95%;" |Quelle: Skeptical Science: [https://skepticalscience.com/graphics.php?g=439 Cranky Cartoon (DE) - CO<sub>2</sub> folgt Temperatur], übersetzt<br> Lizenz: CC BY-SA | 1 |
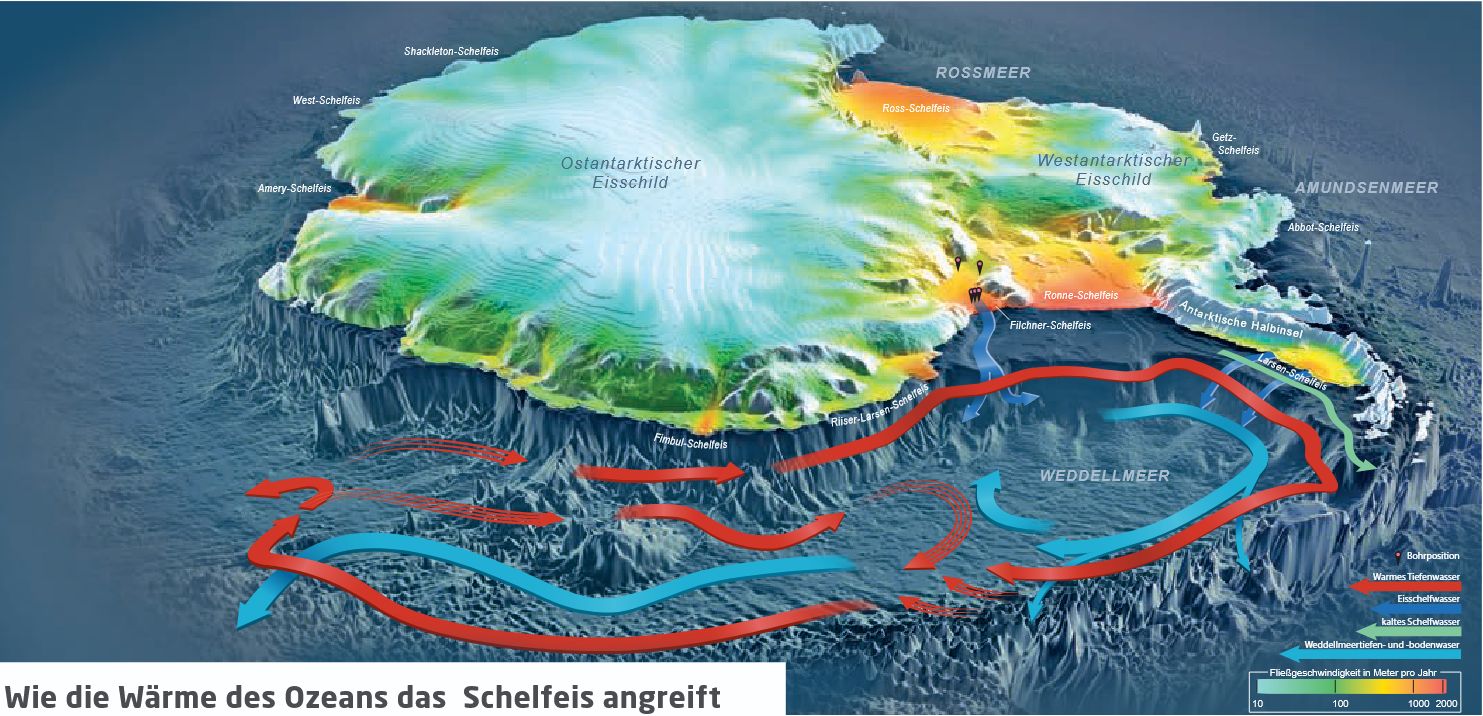
| 12:50, 17. Dez. 2025 | Antarktis Schelfeis Abschmelzen.jpg (Datei) |  |
221 KB | Warmes Wasser schmilzt das antarktische Schelfeis von unten. ==Lizenzhinweis== {| style="border:1px solid #8888aa; background-color:#f7f8ff;padding:5px;font-size:95%;" | Quelle: German Arctic Office (2019): Fact Sheet: Arktis und Antarktis – mehr Unterschiede als Gemeinsamkeiten? https://www.arctic-office.de/fileadmin/user_upload/www.arctic-office.de/PDF_uploads/FactSheet_Arktis-Antarktis_Deutsch_web.pdf<br> Lizenz: [https://creativecommons.org/licenses/by/4.0 CC BY] |} | 1 |
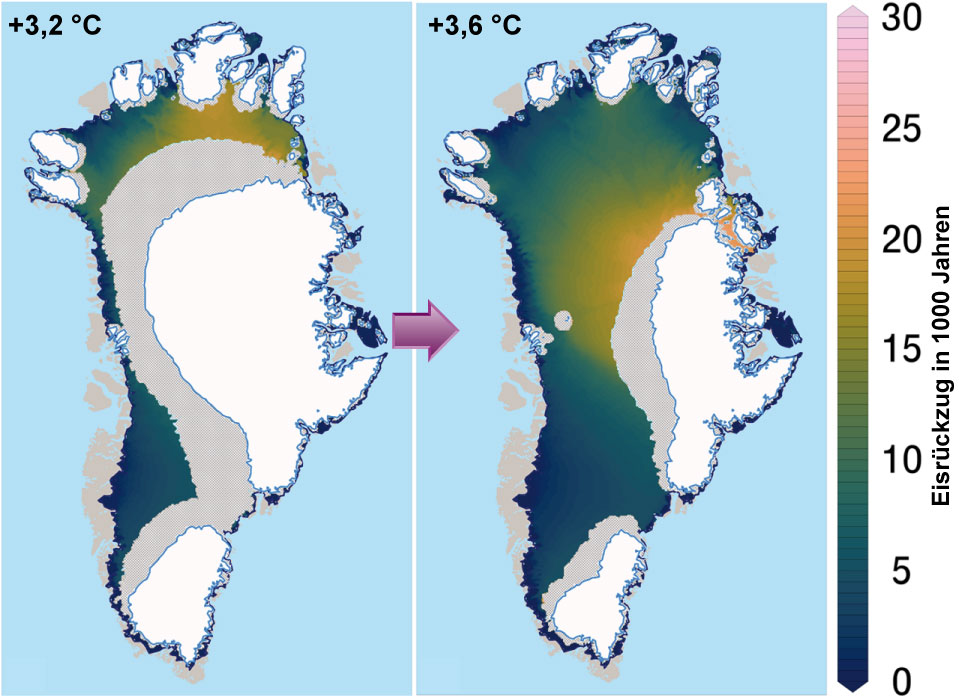
| 15:35, 16. Dez. 2025 | GrIS-Eisverlust-3,6-°C.jpg (Datei) |  |
119 KB | == Beschreibung == Eisrückzug auf Grönland bei einer globalen Erwärmung von 3,2 °C auf 3,4 °C gegenüber vorindustriell. Die Geschwindigkeit des Eisrückzugs wird farblich angezeigt. Weiß markiert das verbleibende Eis, grau Schwankungen durch die Anhebung der Erdkruste. ==Lizenzhinweis== {| style="border:1px solid #8888aa; background-color:#f7f8ff;padding:5px;font-size:95%;" | Quelle: Petrini, M., M.D.W. Scherrenberg, L. Muntjewerf (2025): A topographically controlled tipping point for complete G… | 1 |
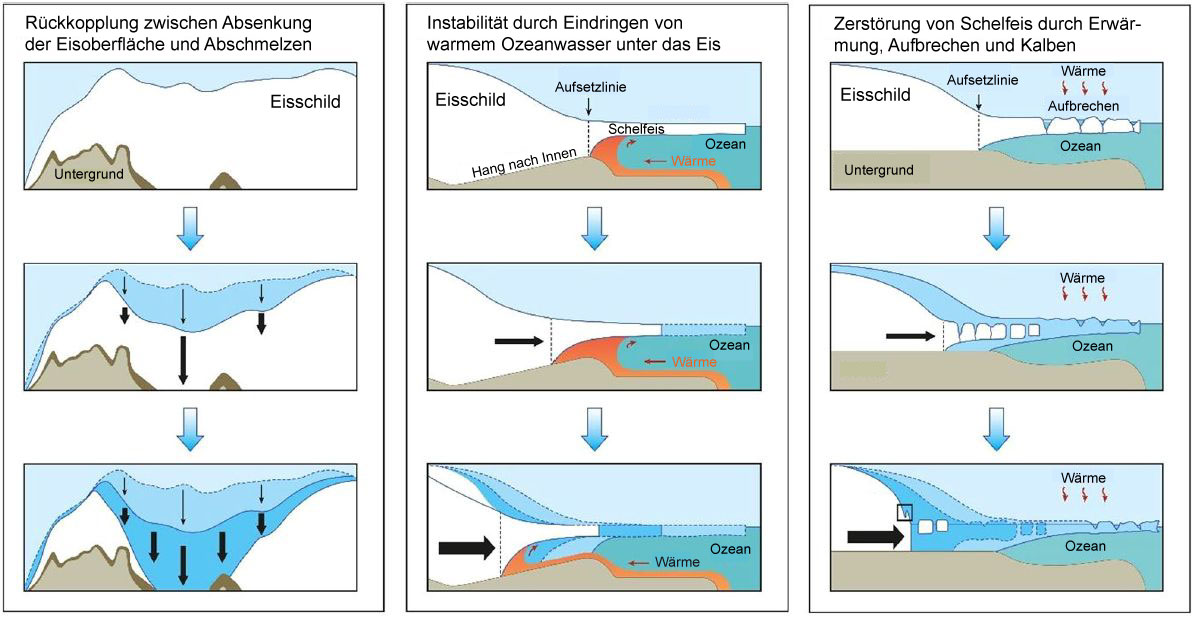
| 12:28, 14. Dez. 2025 | FeedbackProzesse Antarktis.jpg (Datei) |  |
119 KB | == Beschreibung == Feedback-Prozesse, die zu einem schnellen Rückzug des Eisschilds führen können: (1) Absenkung der Oberfläche und verstärktes Abschmelzen, (2) Instabilität mariner Ränder durch Eindringen von Meerwasser und Rückzug der Grundlinie, (3) Kalben an hohen Eiskliffs. ==Lizenzhinweis== {| style="border:1px solid #8888aa; background-color:#f7f8ff;padding:5px;font-size:95%;" | Quelle: Stokes, C.R., Bamber, J.L., Dutton, A. et al. (2025): Warming of +1.5 °C is too high for polar ice she… | 1 |
