Von Dieter Kasang hochgeladene Dateien
Aus Klimawandel
Diese Spezialseite listet alle hochgeladenen Dateien auf.
| Datum | Name | Vorschaubild | Größe | Beschreibung | Versionen |
|---|---|---|---|---|---|
| 13:09, 26. Jan. 2017 | SLR Europe absolut1992-2014.gif (Datei) |  |
593 KB | Absolute Meeresspiegeländerung in Europa 1992-2014 nach Satellitendaten ==Lizenzhinweis== {| style="border:1px solid #8888aa; background-color:#f7f8ff;padding:5px;font-size:95%;" | Quelle: European Environment Agency (2016): Global and European sea l… | 1 |
| 22:48, 27. Dez. 2017 | Antarctica map.png (Datei) |  |
591 KB | Orientierungskarte des Antarktischen Kontinents ==Lizenzhinweis== {| style="border:1px solid #8888aa; background-color:#f7f8ff;padding:5px;font-size:95%;" | Quelle: http://nsidc.org/arcticseaicenews/map-of-antarctica/ National Snow and Ice Data Center:… | 1 |
| 21:44, 15. Apr. 2019 | Arctic snow anomaly April-June1967-2017.png (Datei) |  |
574 KB | Änderung der monatliche Schneebedeckung auf den arktischen Landflächen im April (a), Mai (b) und Juni (c) 1967-2017 als Standardabweichung vom Mittel der Jahre 1981 bis 2010 ==Lizenzhinweis== {| style="border:1px solid #8888aa; background-color:#f7f8… | 1 |
| 12:04, 7. Apr. 2020 | SierraN.snow 2015 2020.png (Datei) |  |
572 KB | Wasseräquivalente der Schneebedeckung in der Sierra Nevada in verschiedenen Jahren ==Lizenzhinweis== {| style="border:1px solid #8888aa; background-color:#f7f8ff;padding:5px;font-size:95%;" | Quelle: NASA Earth Observatory (2020): [https://earthobserv… | 1 |
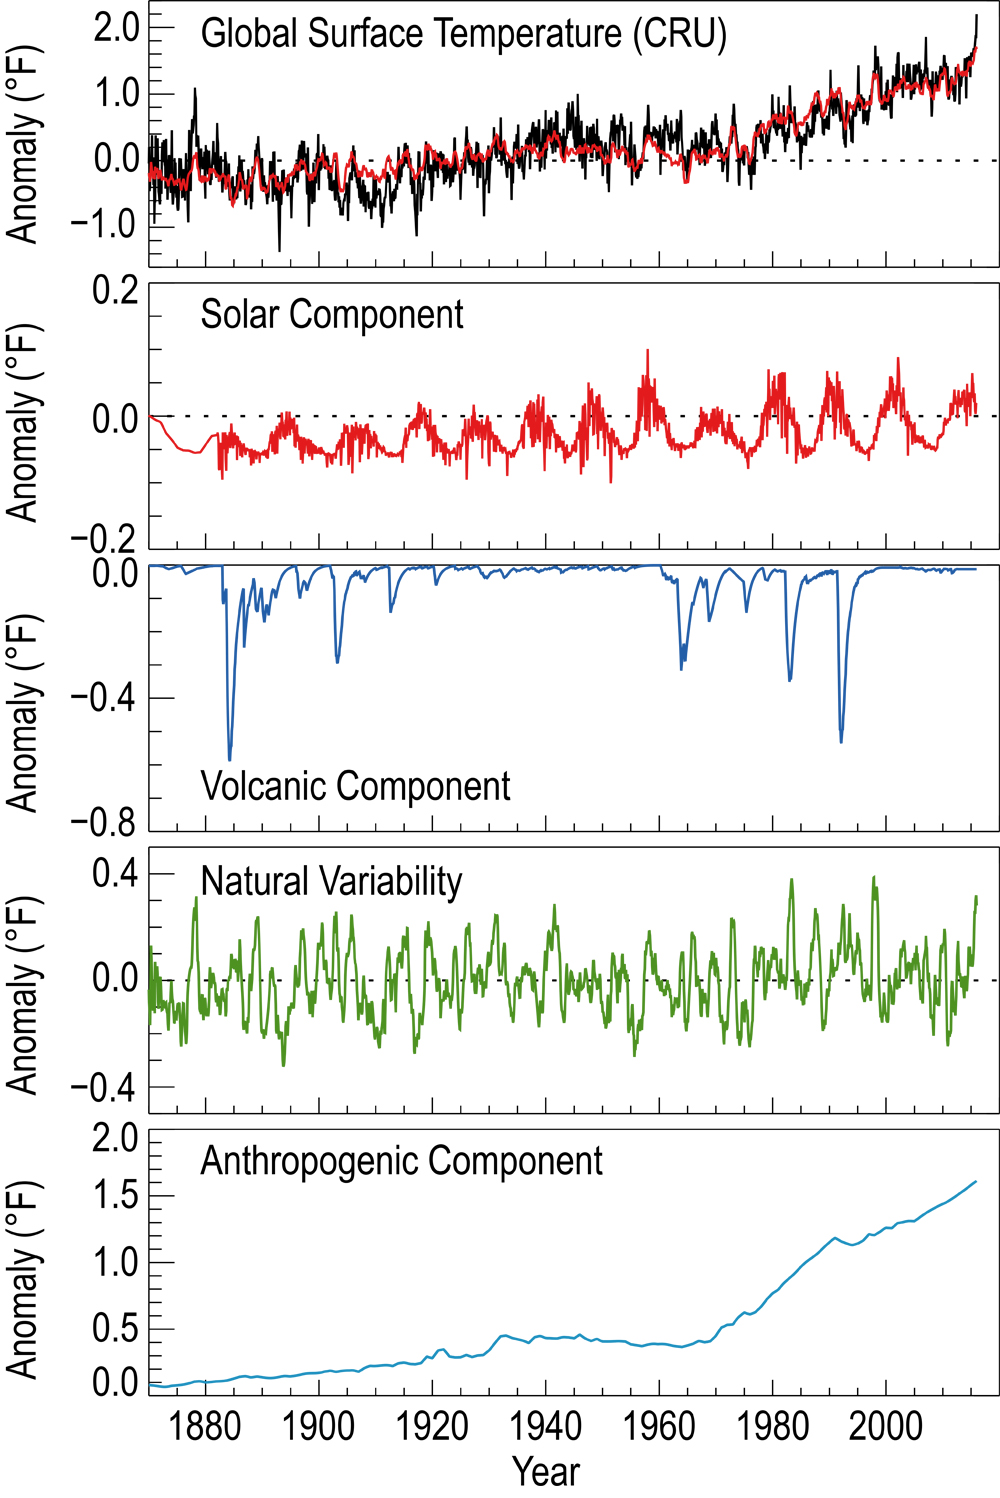
| 15:16, 2. Sep. 2020 | Cc 1870-2016 causes.jpg (Datei) |  |
569 KB | Ursachen von Klimaänderungen 1870 bis 2016 in °F. ==Lizenzhinweis== {| style="border:1px solid #8888aa; background-color:#f7f8ff;padding:5px;font-size:95%;" | Quelle: Knutson, T., J.P. Kossin, C. Mears, J. Perlwitz, and M.F. Wehner (2017): Detection… | 1 |
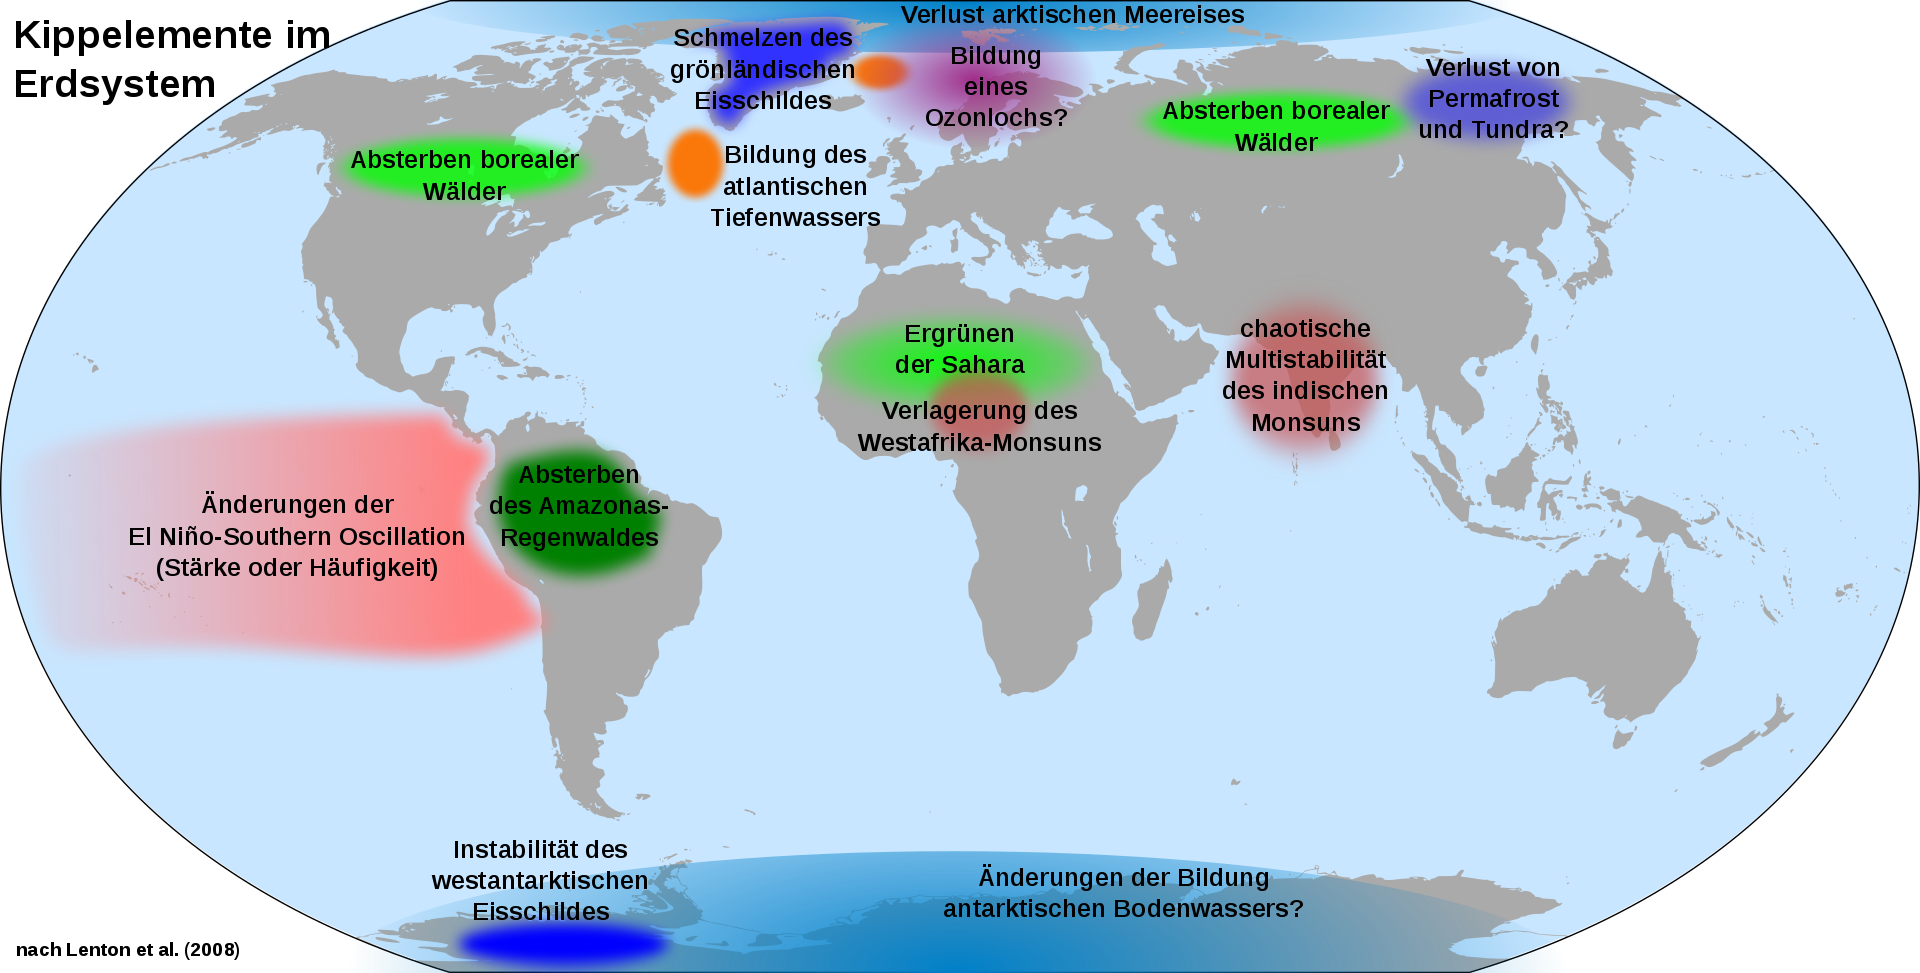
| 20:49, 29. Jul. 2021 | Climate-tipping-points-de.png (Datei) |  |
567 KB | == Beschreibung == Mögliche Kippelemente im Klimasystem ==Lizenzhinweis== {| style="border:1px solid #8888aa; background-color:#f7f8ff;padding:5px;font-size:95%;" | Quelle: Wikimedia Commons (2018): Tipping elements in the Earth's climate system, https://commons.wikimedia.org/wiki/File:Climate-tipping-points-de.svg ; nach T.M. Lenton et al. (2008): Tipping elements in the Earth's climate system. In: Proceedings of the National Academy of the Sciences. February 2008, doi:10.1073/pnas.0705414105… | 1 |
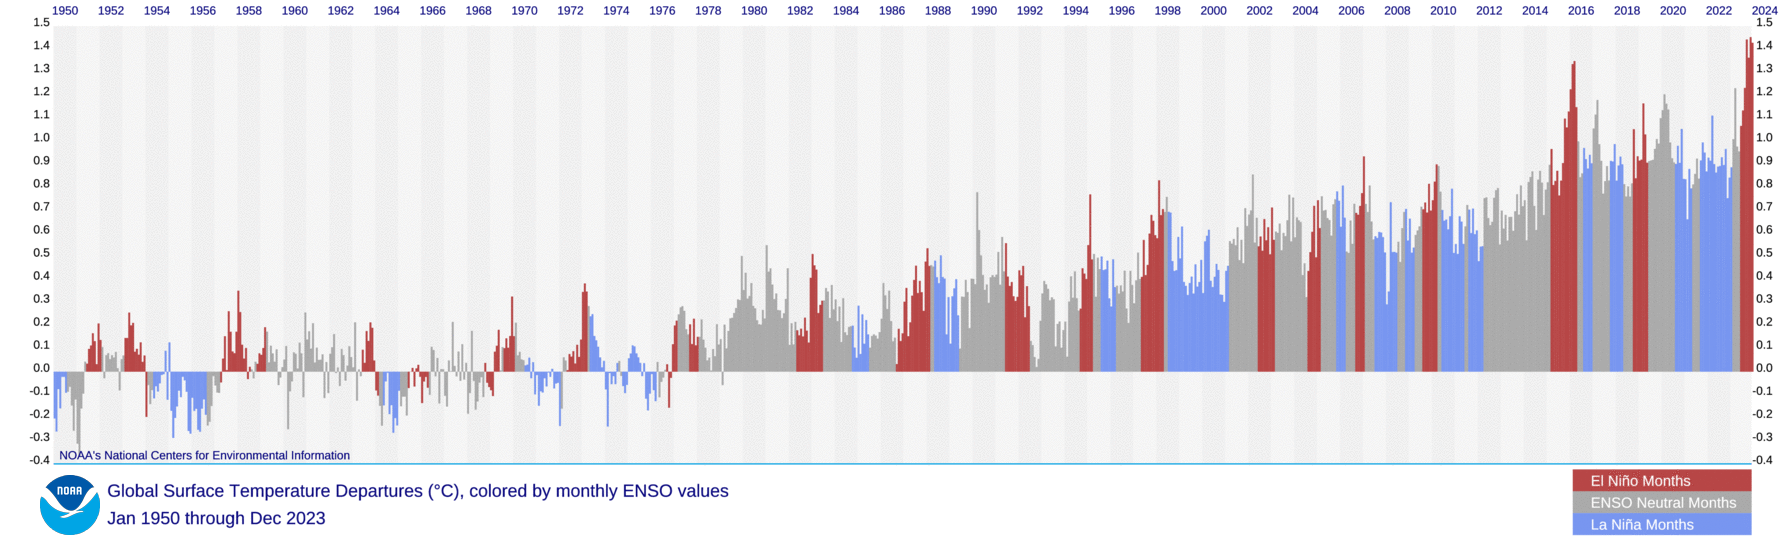
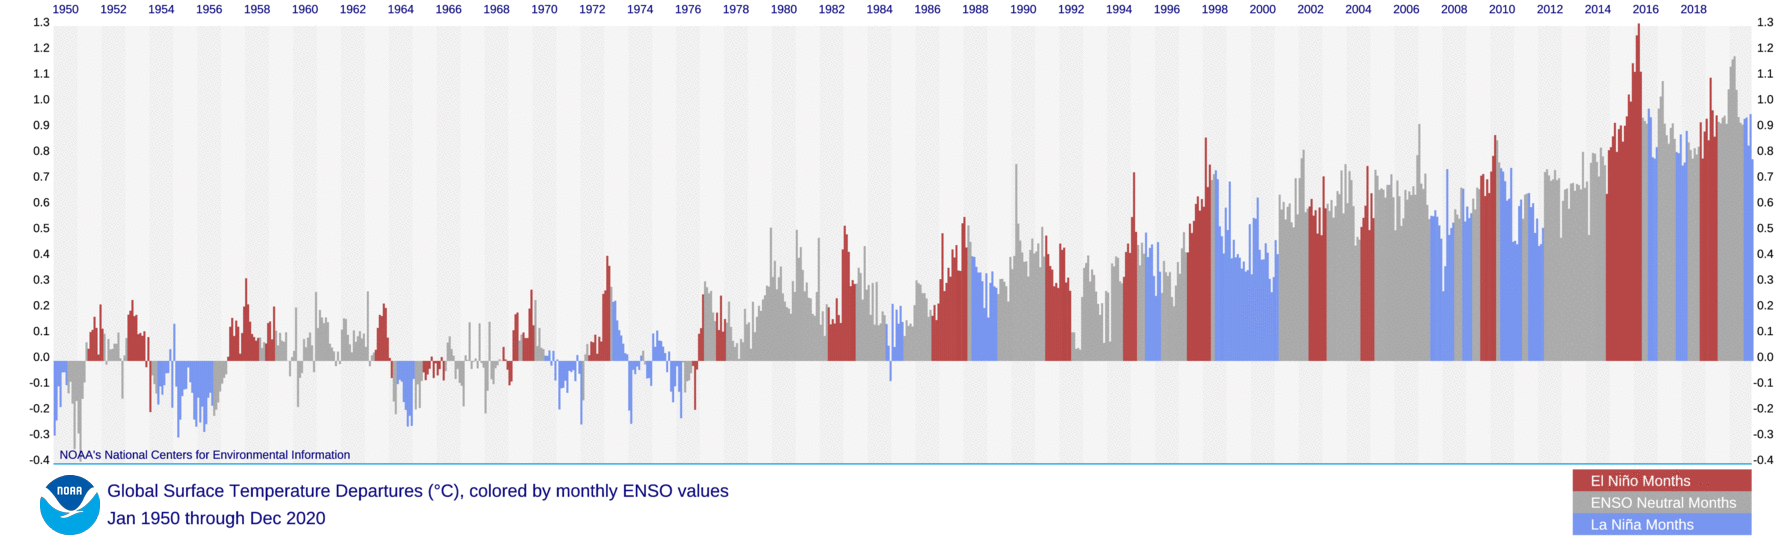
| 17:32, 15. Jan. 2024 | ENSO global temp 1950-2023.png (Datei) |  |
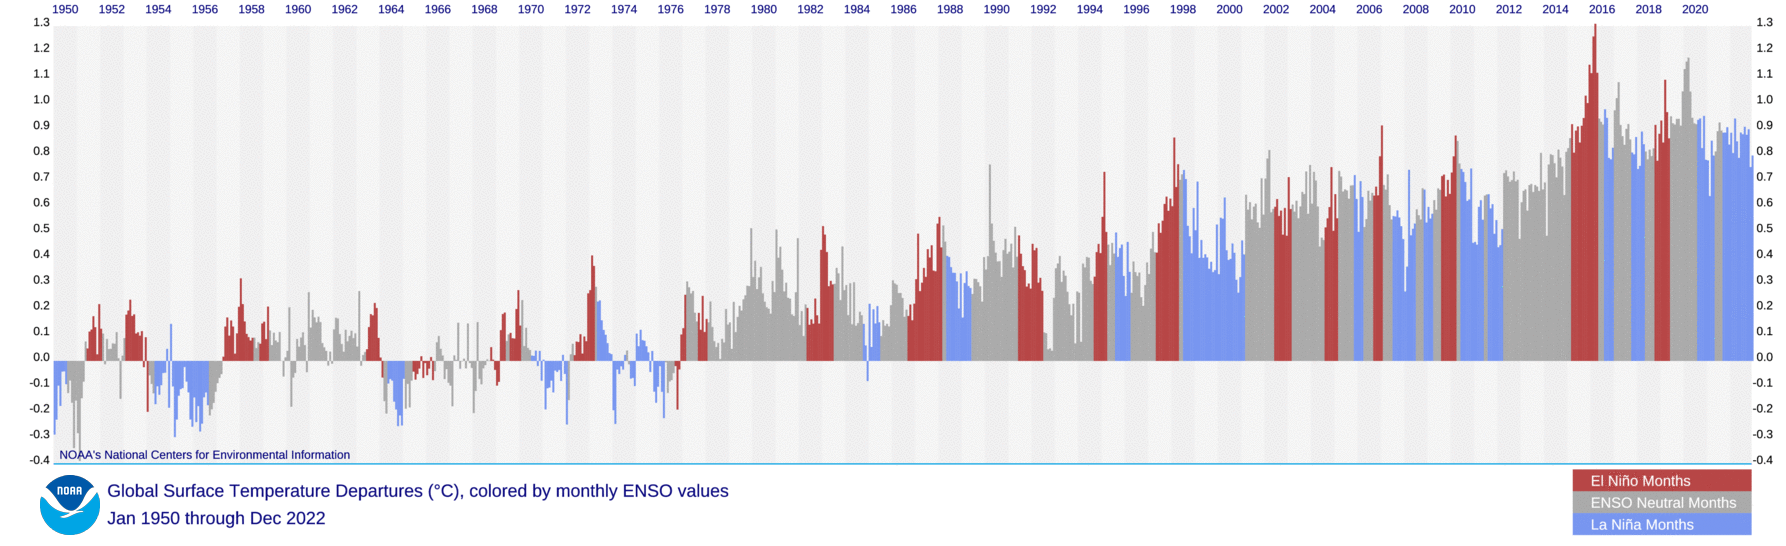
564 KB | == Beschreibung == Globale Temperaturen und ENSO. Globale Monatsmitteltemperaturen und El-Niño- und La-Niña-Jahre 1950-2023 ==Lizenzhinweis== {| style="border:1px solid #8888aa; background-color:#f7f8ff;padding:5px;font-size:95%;" | Quelle: NOAA National Centers for Environmental Information, State of the Climate: Global Climate Report - Annual 2022 (2023): [https://www.ncei.noaa.gov/access/monitoring/monthly-report/global/202213/supplemental/page-2 Monthly temperature anomalies versus El Niño]… | 1 |
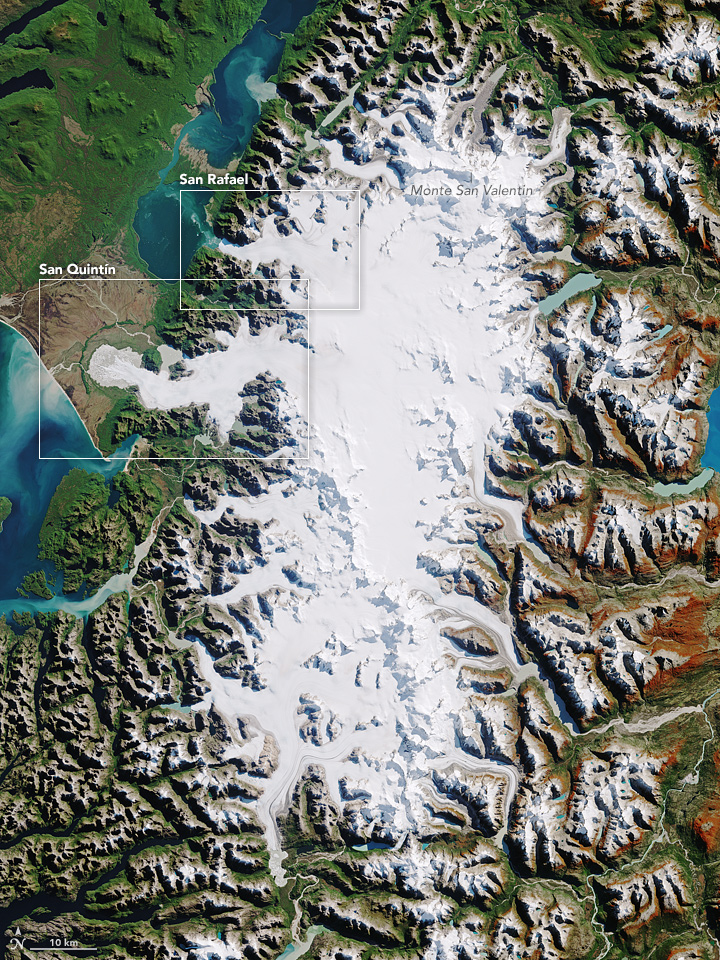
| 12:41, 30. Dez. 2018 | North-patagonia ice field.jpg (Datei) |  |
551 KB | Nordpatagonisches Eisfeld Icefield ==Lizenzhinweis== {| style="border:1px solid #8888aa; background-color:#f7f8ff;padding:5px;font-size:95%;" | Quelle: Quelle: NASA Earth Oberservatory: Northern Patagonia Icefield, 16.4.2017, https://earthobservatory.n… | 1 |
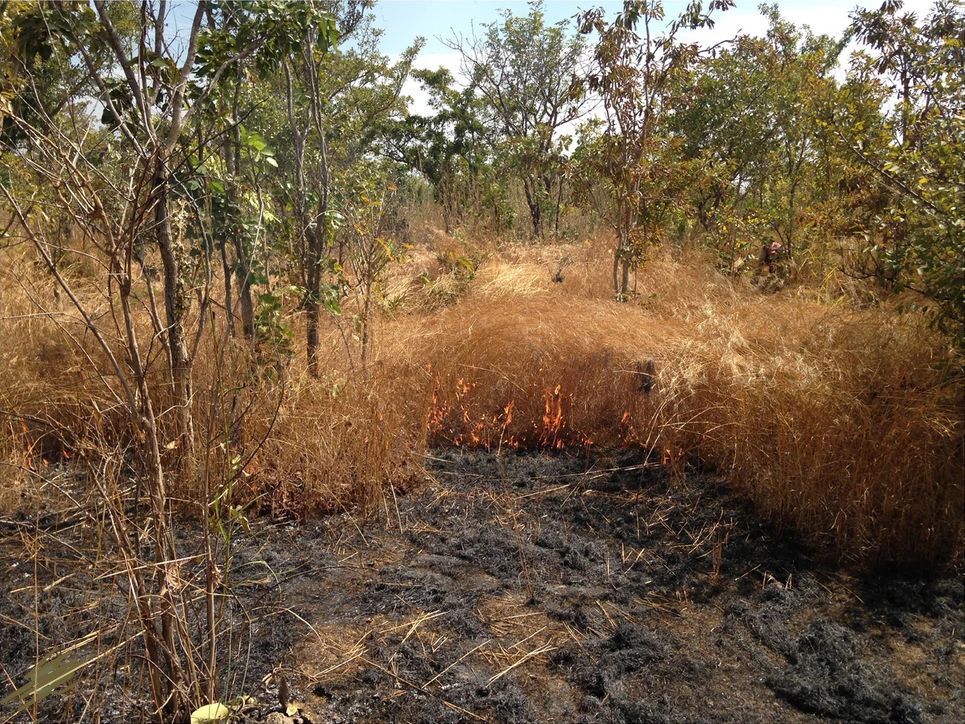
| 22:04, 22. Feb. 2021 | Mali savanna fire.jpg (Datei) |  |
551 KB | Feuer in der Savanne in Mali 2016 ==Lizenzhinweis== {| style="border:1px solid #8888aa; background-color:#f7f8ff;padding:5px;font-size:95%;" |Quelle: Laris, P., Jacobs, R., Koné, M. et al. Determinants of fire intensity in working landscapes of an African savanna. fire ecol 16, 27 (2020). https://doi.org/10.1186/s42408-020-00085-x Lizenz: CC BY 4.0 http://creativecommons.org/licenses/by/4.0/ |} | 1 |
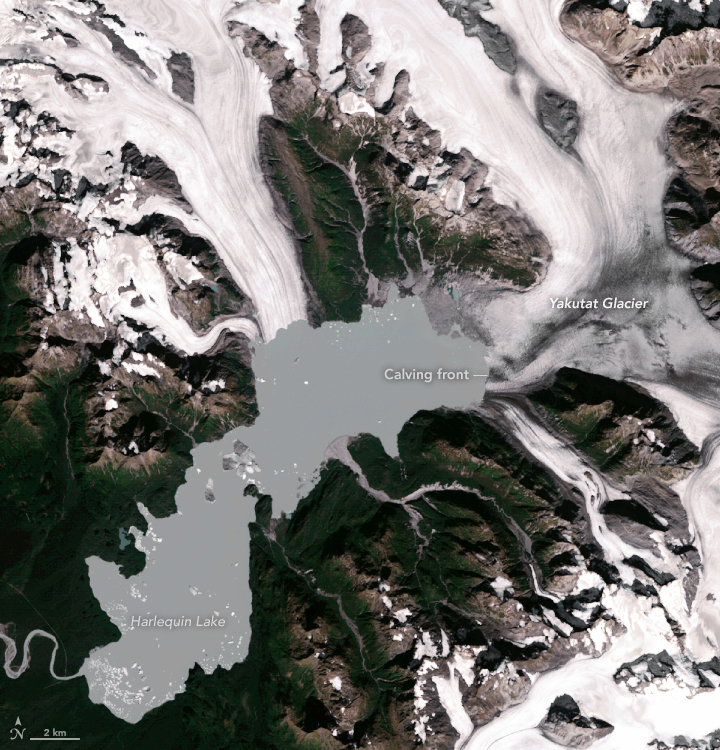
| 12:47, 3. Jan. 2019 | Yakutat glacier2018.jpg (Datei) |  |
549 KB | Der Yakutat-Gletscher am 13. August 2018 ==Lizenzhinweis== {| style="border:1px solid #8888aa; background-color:#f7f8ff;padding:5px;font-size:95%;" | Quelle: NASA Earth Observatory: [https://earthobservatory.nasa.gov/images/144272/watching-a-glacier-di… | 1 |
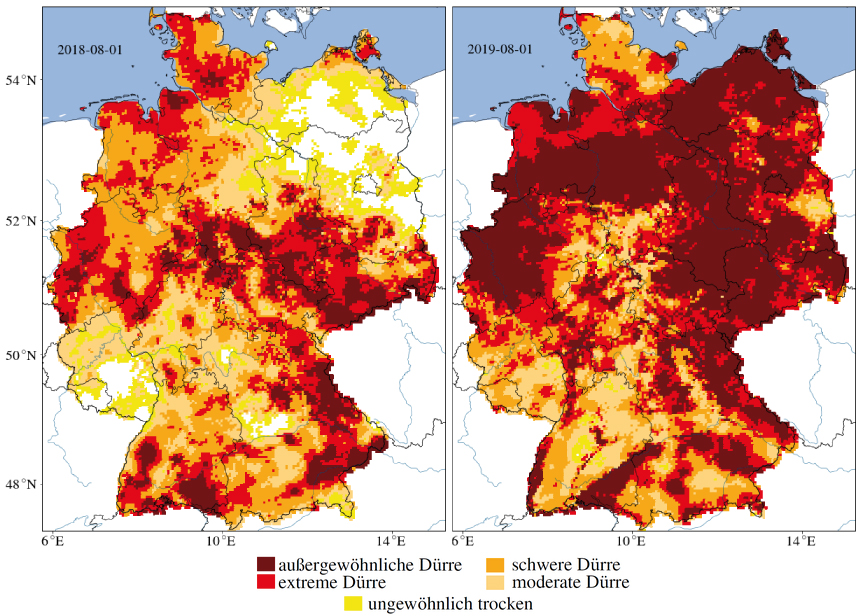
| 16:55, 3. Jan. 2022 | Deutschland Dürre Aug.2018-2019.jpg (Datei) |  |
543 KB | Trockenheit des Gesamtbodens (bis 1,8 m Tiefe) im August 2018 (links) und August 2019 (rechts) in Deutschland. == Lizenzhinweis == {| style="border:1px solid #8888aa; background-color:#f7f8ff;padding:5px;font-size:95%;" |Quelle: UFZ Helmholtz Zentrum für Umweltforschung: Dürremonitor Deutschland https://www.ufz.de/index.php?de=37937<br> Lizenz: „Die Grafiken können im Rahmen von Wissenschaft und Forschung sowie für redaktionelle Zwecke unter Angabe des folgenden Vermerks unentgeltlich genutzt w… | 1 |
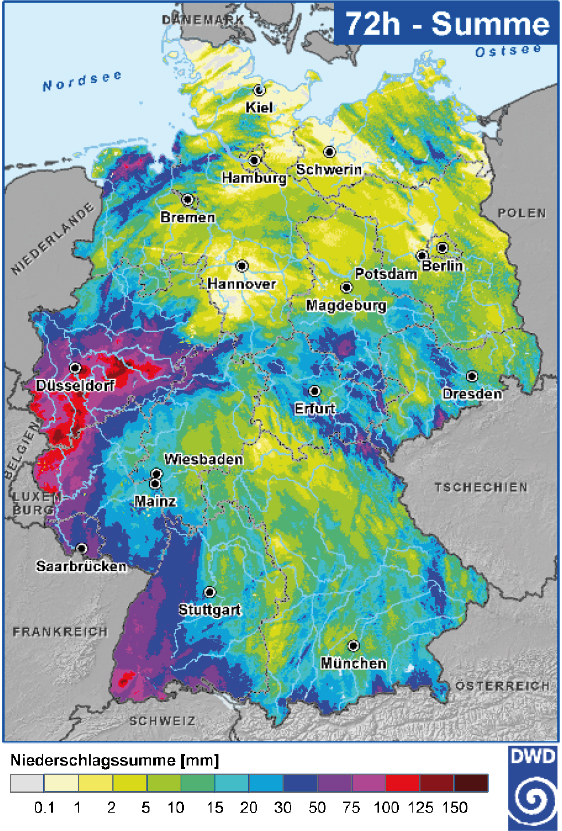
| 15:33, 29. Jul. 2021 | D-Niederschlagssumme-Juni2021.jpg (Datei) |  |
541 KB | == Beschreibung == Niederschlagssumme 12.-15.7.2021 über Deutschland ==Lizenzhinweis== {| style="border:1px solid #8888aa; background-color:#f7f8ff;padding:5px;font-size:95%;" | Quelle: Junghänel, T., P. Bissolli, J. Daßler u.a. – DWD (2021): Hydro-klimatologische Einordnung der Stark- und Dauerniederschläge in Teilen Deutschlands im Zusammenhang mit dem Tiefdruckgebiet „Bernd“ vom 12. bis 19. Juli 2021, https://www.dwd.de/DE/leistungen/besondereereignisse/niederschlag/20210721_bericht_starknie… | 1 |
| 11:14, 23. Apr. 2023 | ENSO global temp 2022.png (Datei) |  |
538 KB | == Beschreibung == Globale Temperaturen und ENSO. Globale Monatsmitteltemperaturen und El-Niño- und La-Niña-Jahre 1950-2020 ==Lizenzhinweis== {| style="border:1px solid #8888aa; background-color:#f7f8ff;padding:5px;font-size:95%;" | Quelle: NOAA National Centers for Environmental Information, State of the Climate: Global Climate Report - Annual 2022 (2023): [https://www.ncei.noaa.gov/access/monitoring/monthly-report/global/202213/supplemental/page-2 Monthly temperature anomalies versus El Niño]… | 1 |
| 14:41, 28. Feb. 2020 | Pyrenees icefields2016.jpg (Datei) |  |
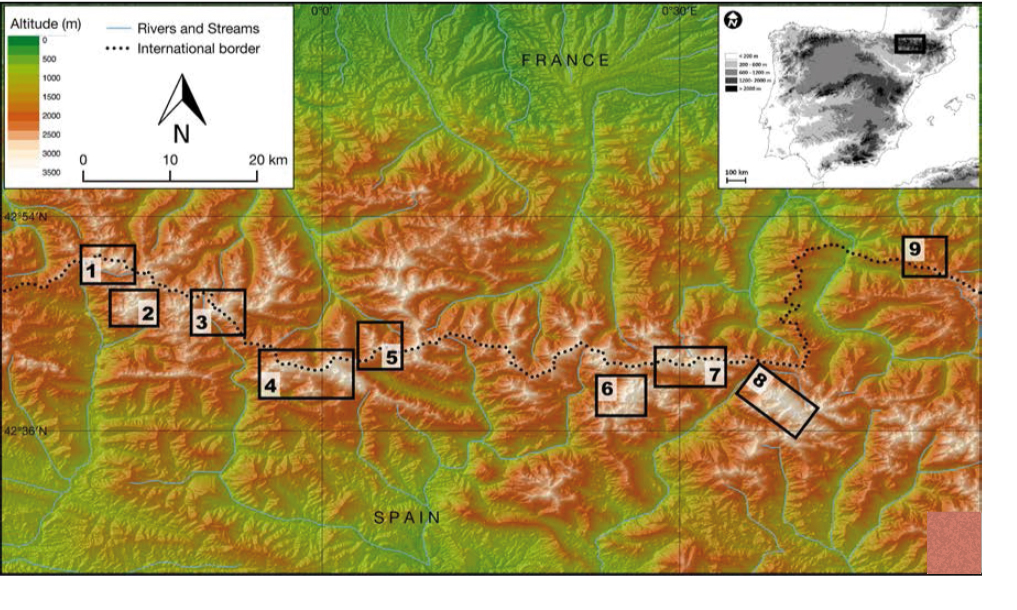
531 KB | Verteilung der aktuellen vergletscherten Massive in den Pyrenäen: Balaitous (1), Infiernos (2), Vignemale (3), Gavarnie-Monte Perdido (4), La Munia (5), Posets (6), Perdiguero (7), Maladeta-Aneto (8) and Mont Valier (9) ==Lizenzhinweis== {| style="bor… | 1 |
| 21:13, 3. Feb. 2023 | Biodiesel from microalgae.jpg (Datei) |  |
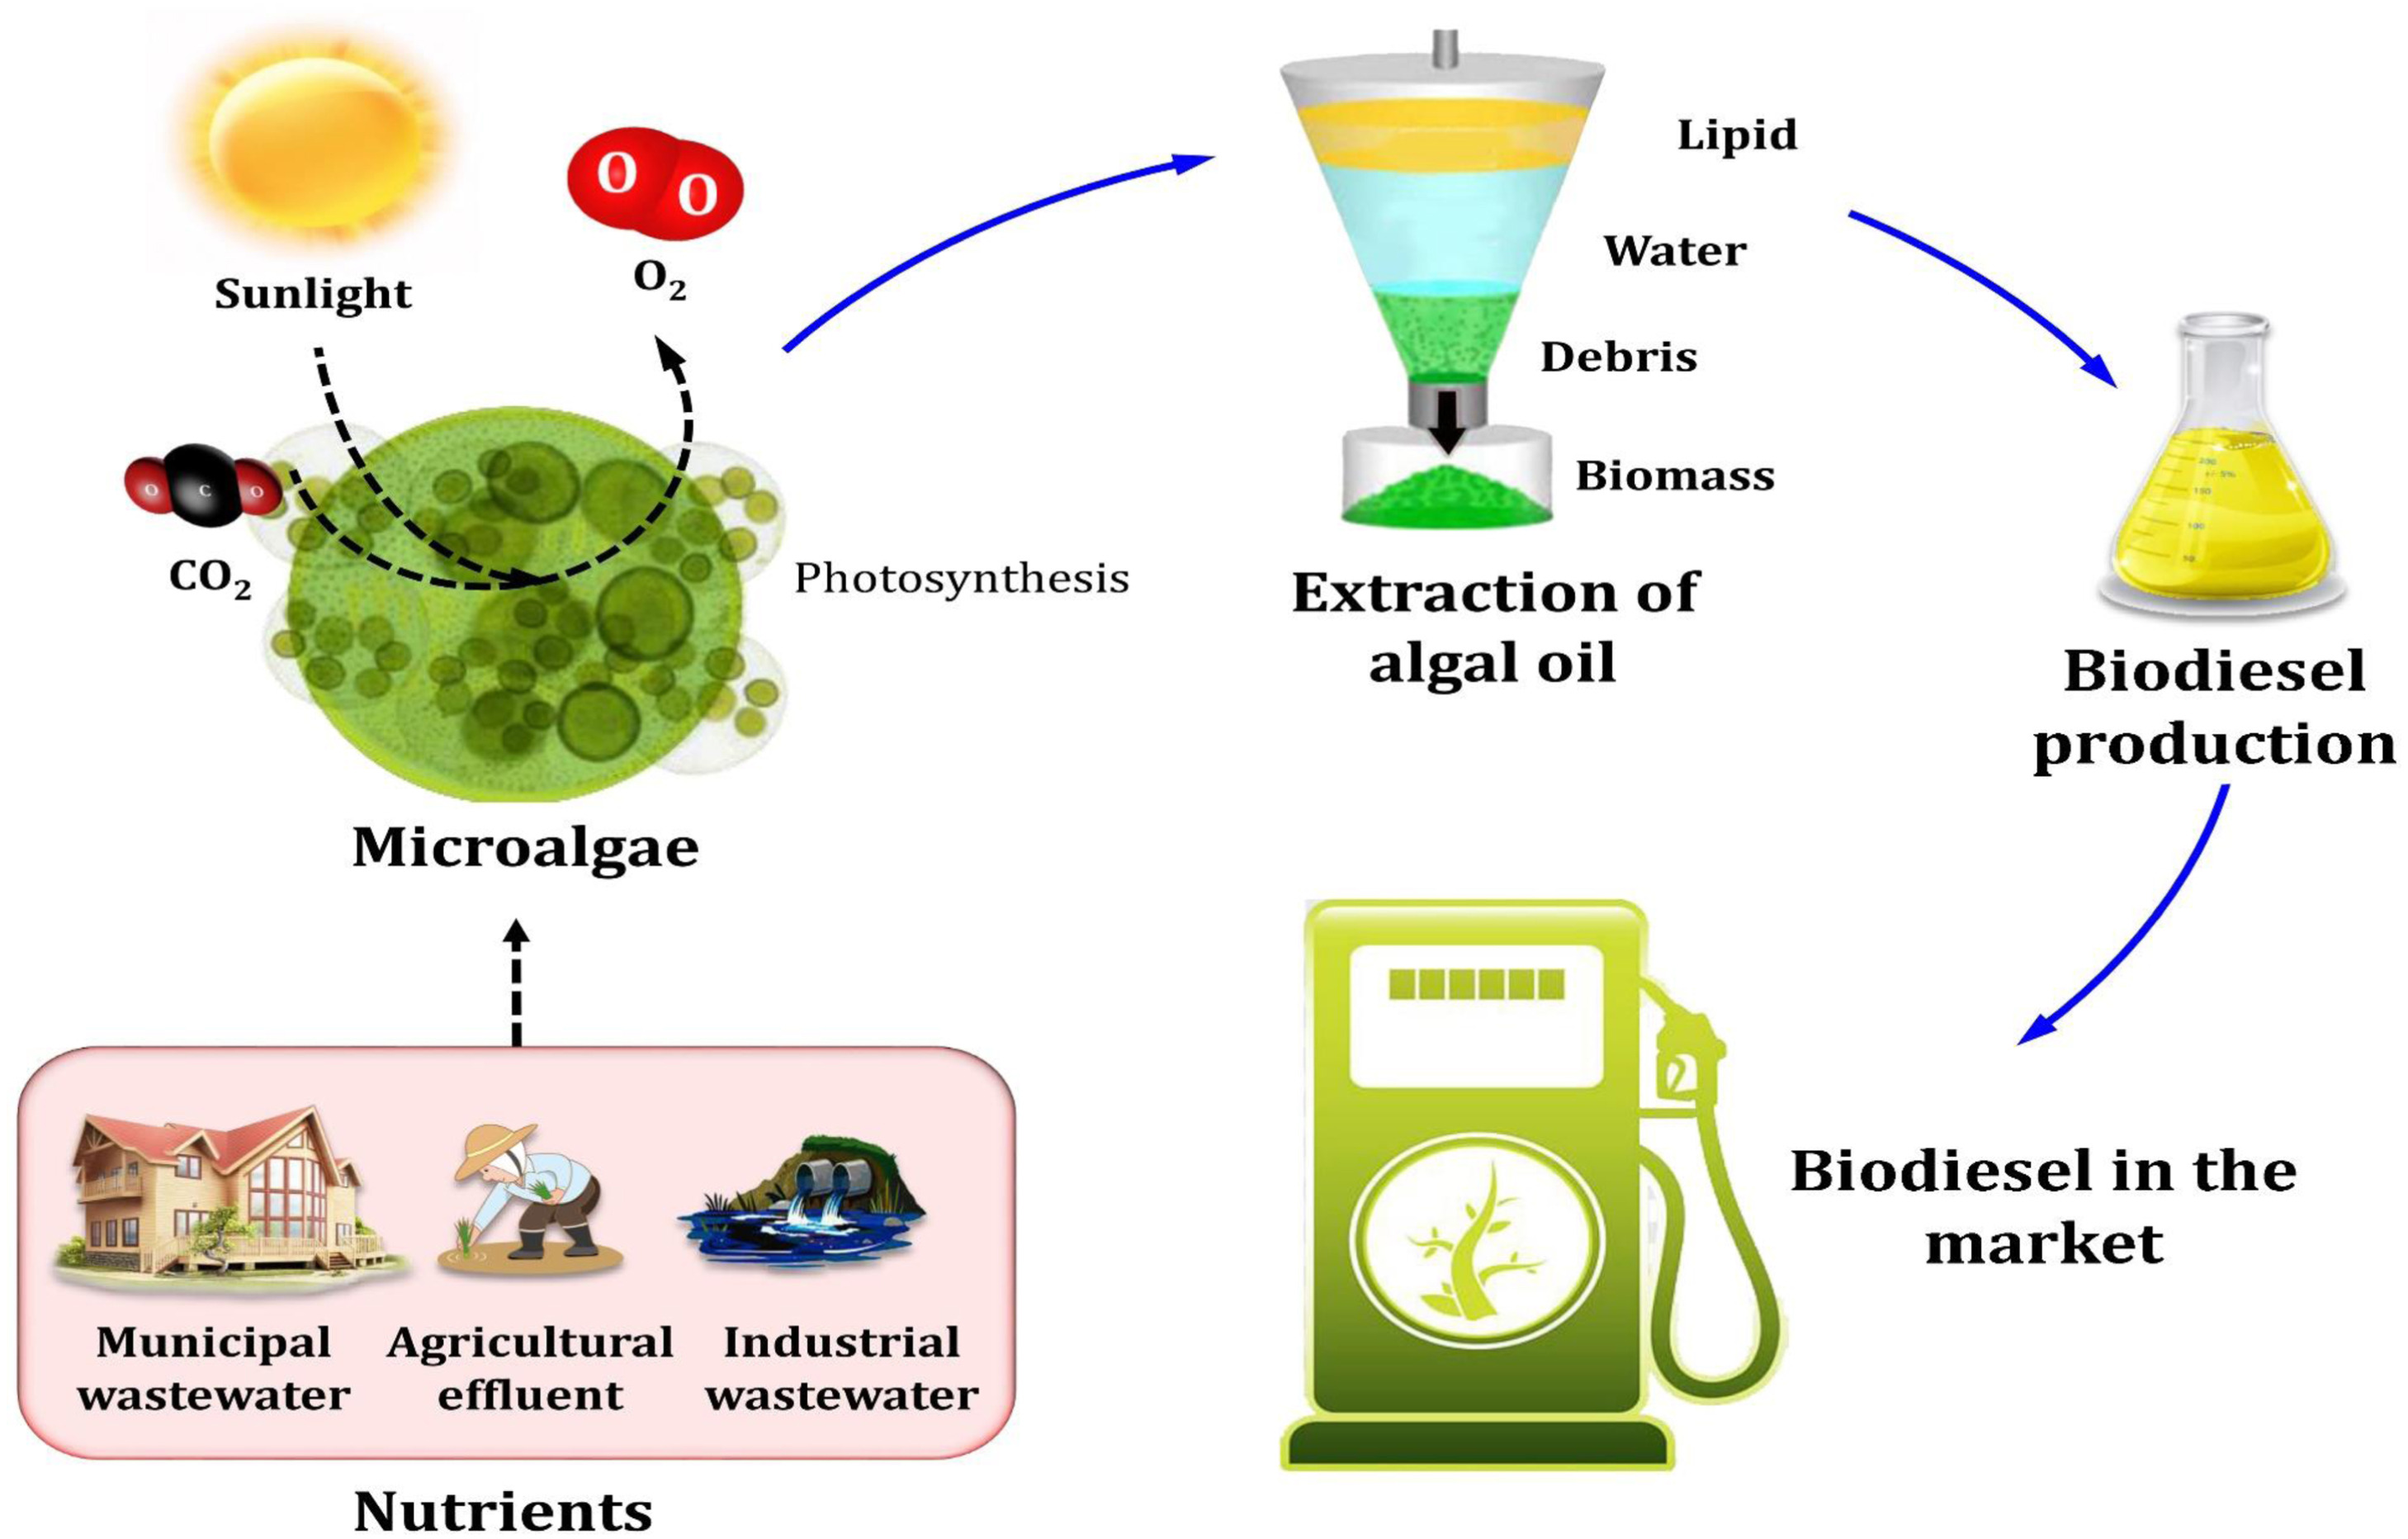
528 KB | == Beschreibung == Biodiesel aus der Biomasse von Mikroalgen == Lizenzhinweis == {| style="border:1px solid #8888aa; background-color:#f7f8ff;padding:5px;font-size:95%;" |Quelle: Ali, S.S., S.G. Mastropetros, M. Schagerl et al. (2022): Recent advances in wastewater microalgae-based biofuels production: A state-of-the-art review, Energy Reports 8, 13253-13280, https://www.sciencedirect.com/science/article/pii/S2352484722018674 <br> Lizenz: CC BY-NC-ND, https://creativecommons.org/licenses/by-nc-… | 1 |
| 14:06, 15. Nov. 2018 | SLR Europe rel 1970-2015.gif (Datei) |  |
528 KB | Relativer Meeresspiegelanstieg Europa: 1993-2015 in mm/Jahr an ausgewählten Pegelstationen ==Lizenzhinweis== {| style="border:1px solid #8888aa; background-color:#f7f8ff;padding:5px;font-size:95%;" | Quelle: European Environment Agency: Trend in rel… | 1 |
| 18:10, 18. Nov. 2021 | Subsidenz-Ursachen-Prozesse.jpg (Datei) |  |
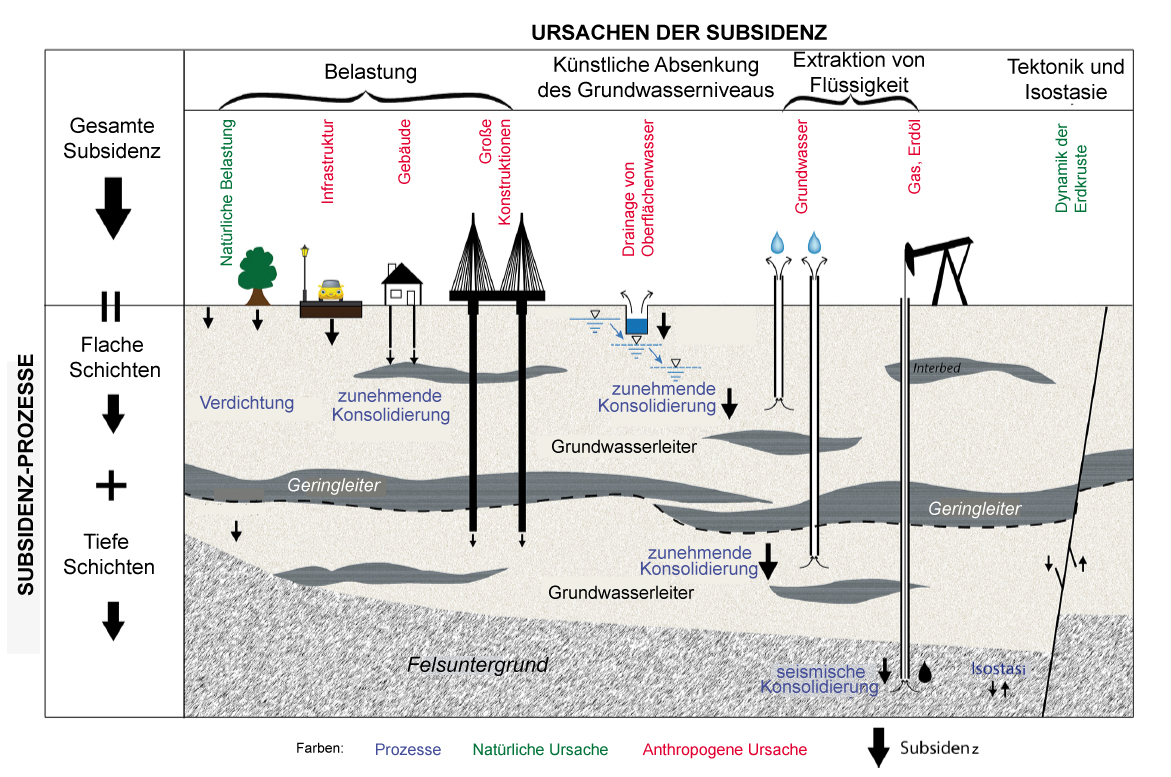
528 KB | == Beschreibung == Subsidenz: Ursachen und Prozesse ==Lizenzhinweis== {| style="border:1px solid #8888aa; background-color:#f7f8ff;padding:5px;font-size:95%;" | Quelle: Minderhoud, P.S.J., G. Erkens, V.H. Pham et al. (2015): Assessing the potential of the multi-aquifer subsurface of the Mekong Delta (Vietnam) for land subsidence due to groundwater extraction, Proc. IAHS, 372, 73–76, https://doi.org/10.5194/piahs-372-73-2015 <br> Lizenz: CC BY |} | 1 |
| 13:11, 26. Jan. 2017 | SLR Europe relative1970-2014.gif (Datei) |  |
528 KB | Relative Meeresspiegeländerungen an ausgewählten europäischen Pegelstationen 1970-2014 ==Lizenzhinweis== {| style="border:1px solid #8888aa; background-color:#f7f8ff;padding:5px;font-size:95%;" | Quelle: European Environment Agency (2016): [http://… | 1 |
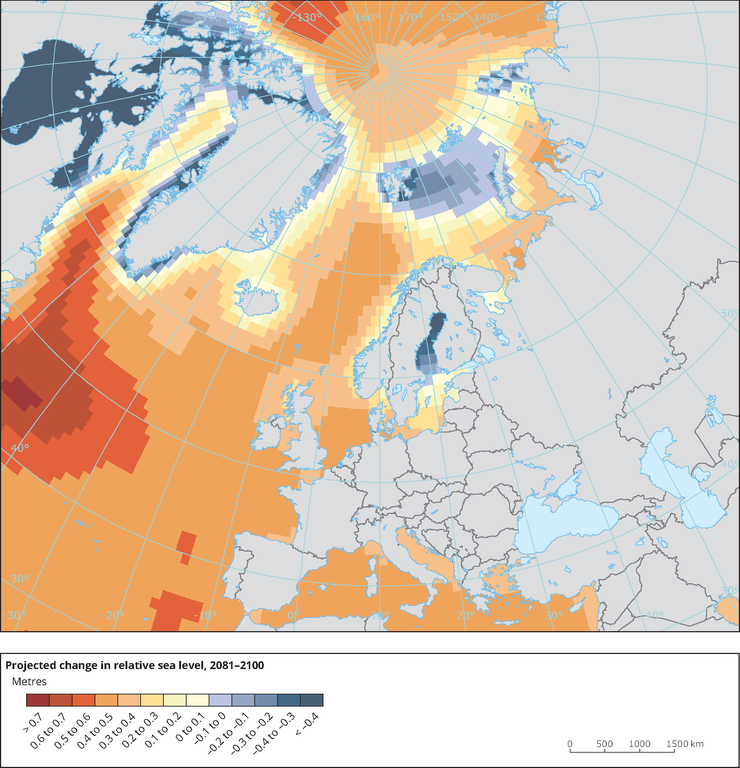
| 14:16, 26. Jan. 2017 | SLR Europe relative projection.gif (Datei) |  |
527 KB | Projektion des relativen Meeresspiegelanstiegs in Europa bis 2081-2100 im Vergleich zu 1986-2005 nach dem Szenario RCP4.5. Für das Schwarze Meer liegen keine Berechnungen vor. ==Lizenzhinweis== {| style="border:1px solid #8888aa; background-color:#f7f… | 1 |
| 21:59, 7. Mai 2020 | Aerosol RF 1750-1990-2015.jpg (Datei) |  |
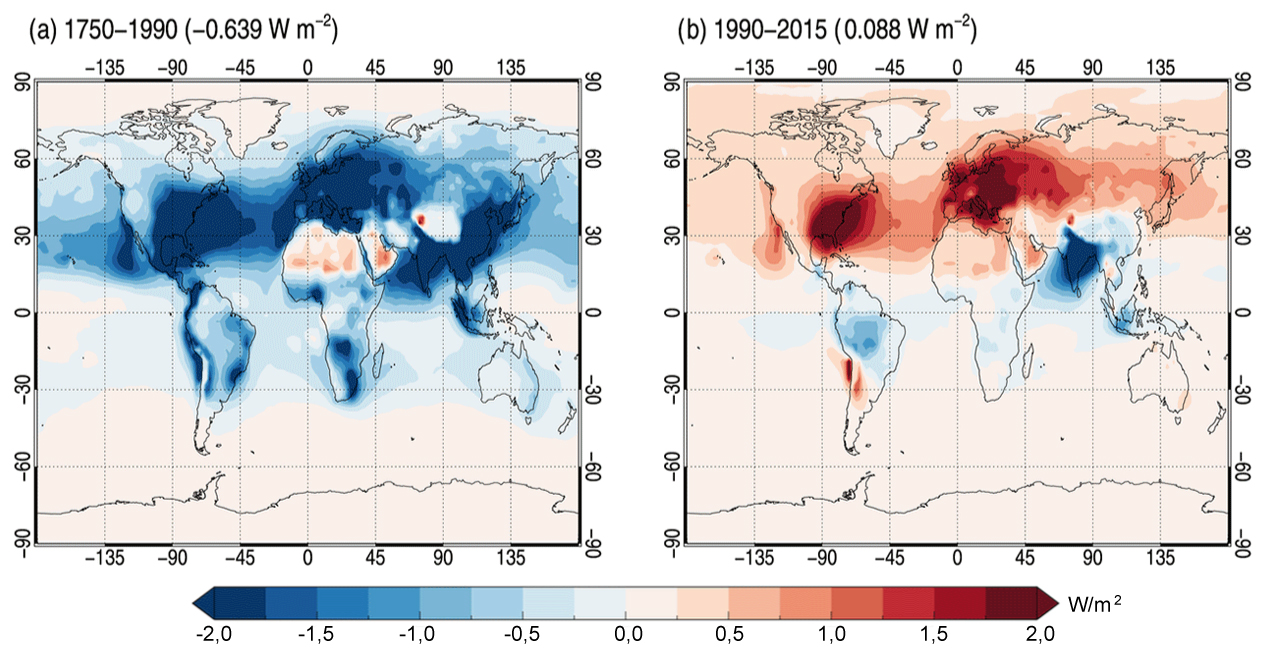
526 KB | Strahlungsantrieb durch Aerosole 1750-1990 (links) und 1990-2015 (rechts) ==Lizenzhinweis== {| style="border:1px solid #8888aa; background-color:#f7f8ff;padding:5px;font-size:95%;" | Quelle: Lund, M. T., Myhre, G., and Samset, B. H.: Anthropogenic aer… | 1 |
| 14:06, 9. Aug. 2023 | EU ranking temp 2022.png (Datei) |  |
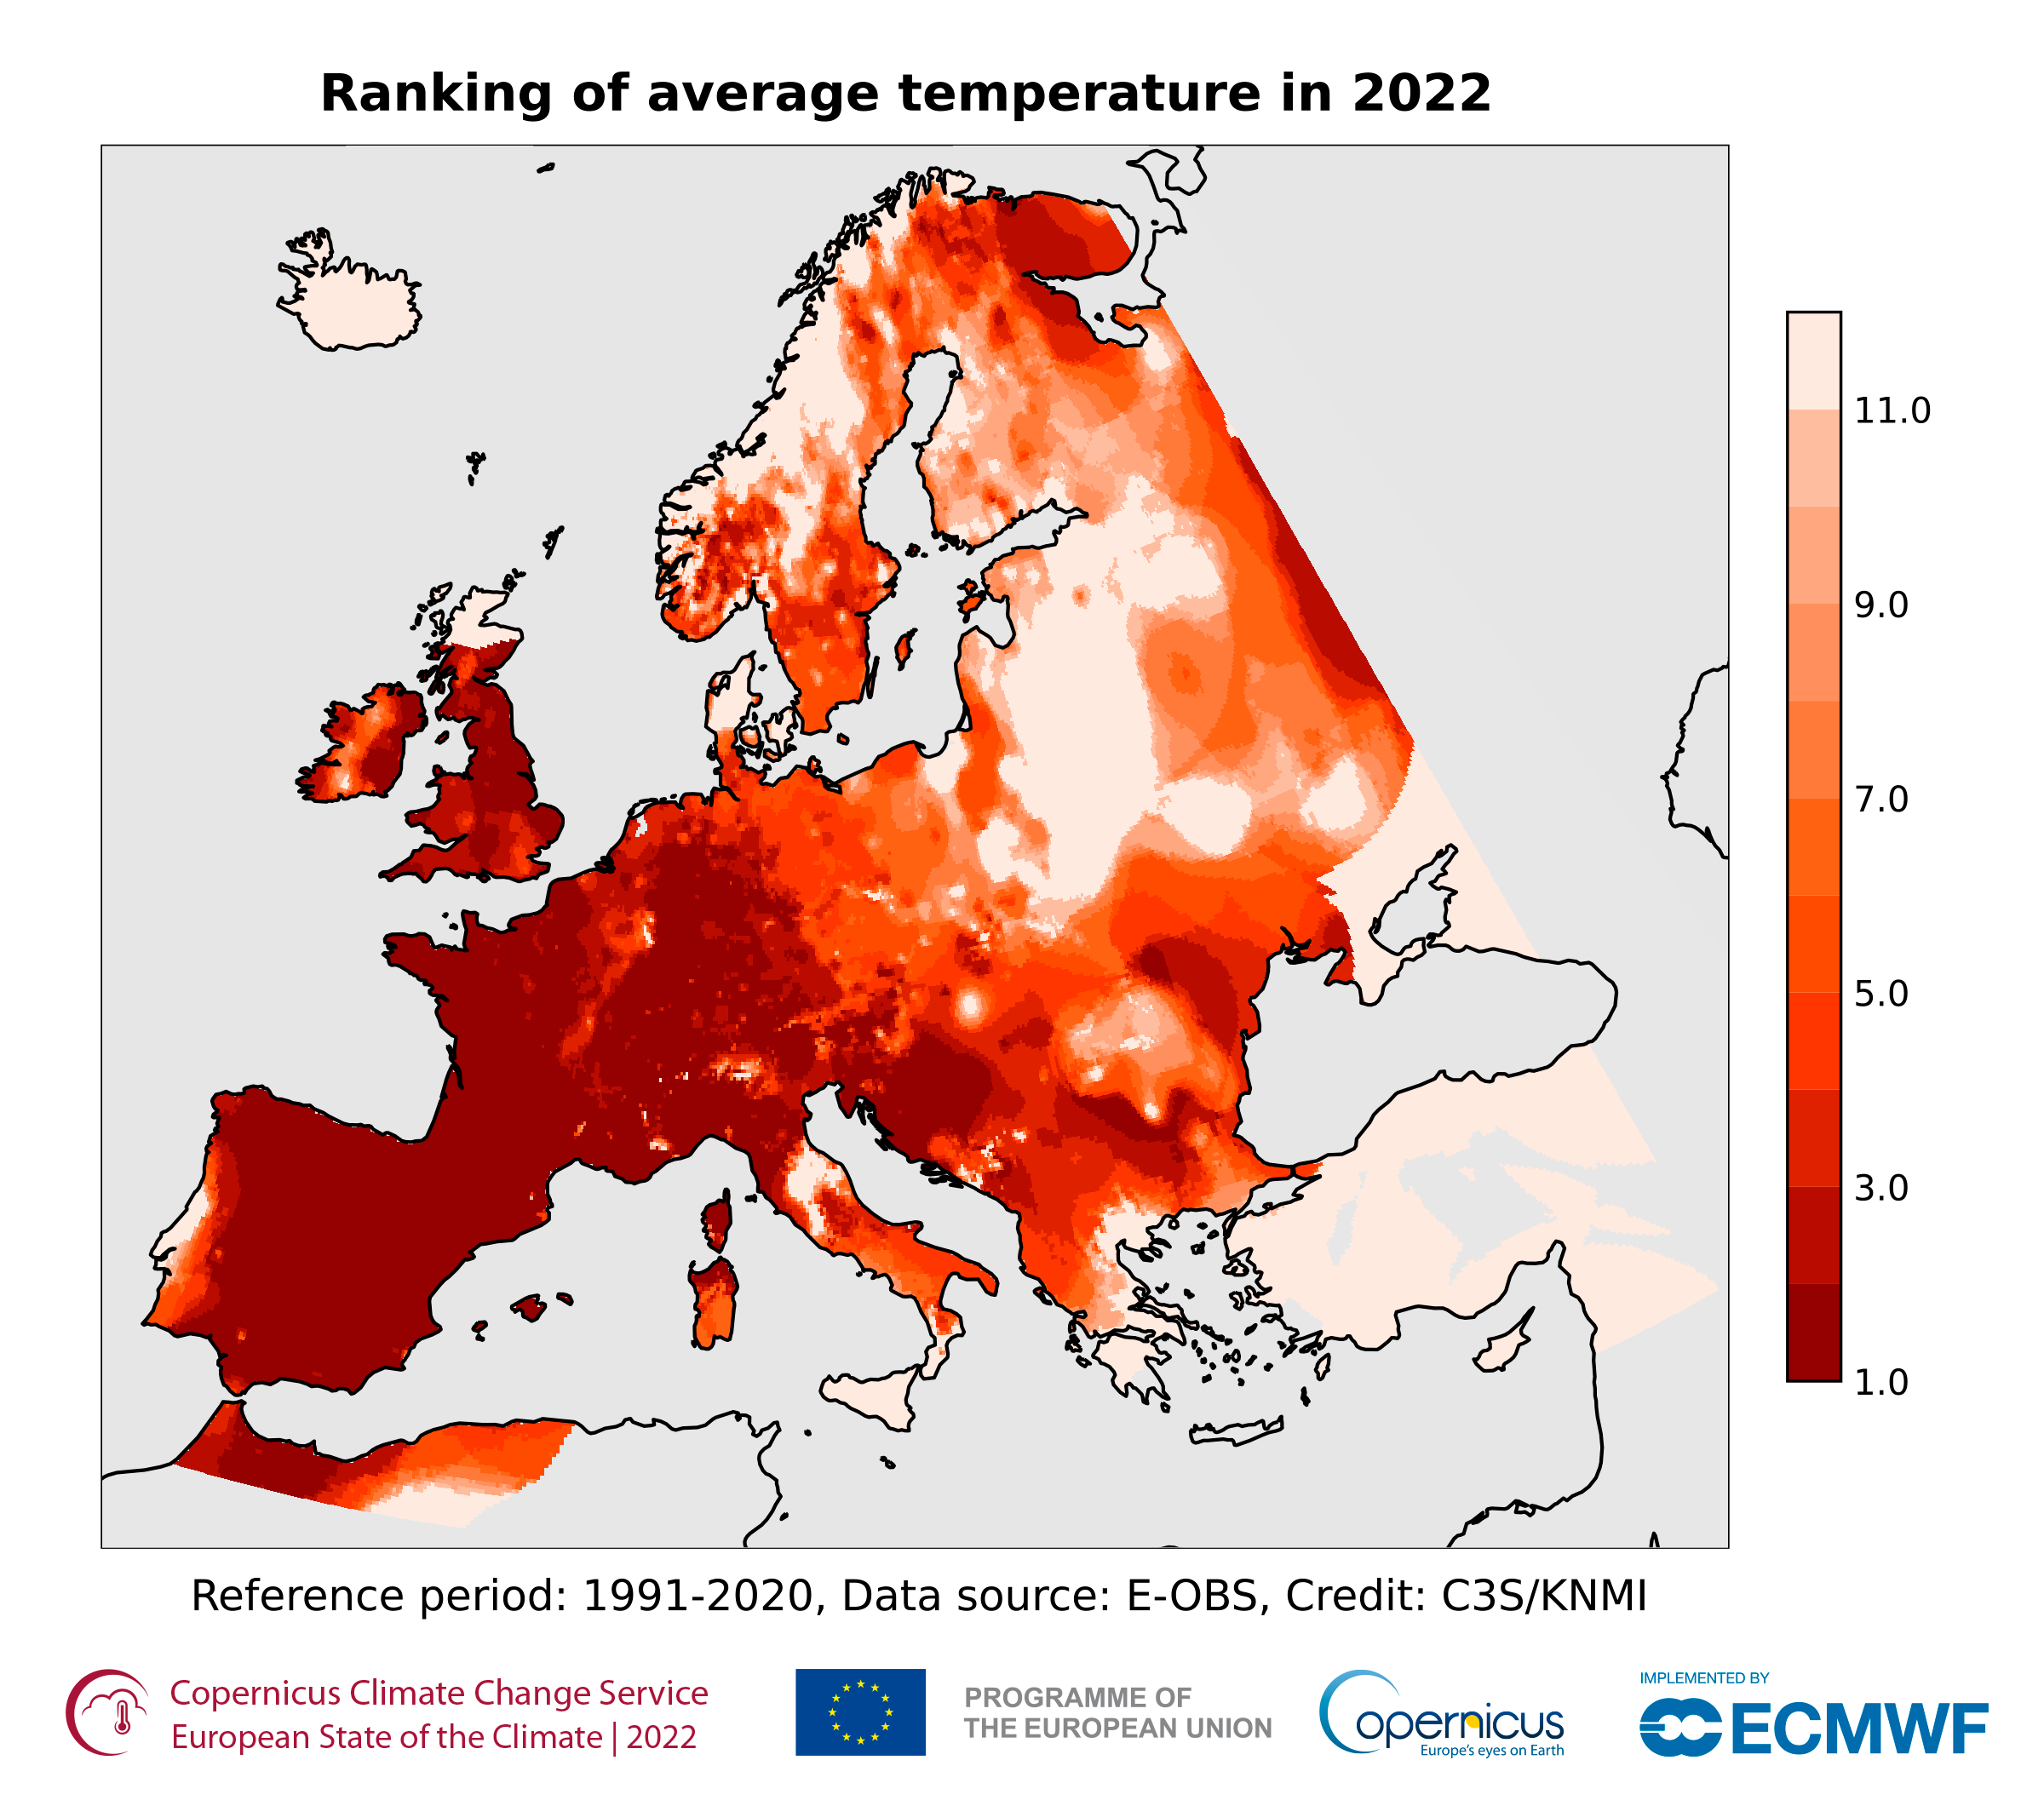
524 KB | == Beschreibung == Ranking der mittleren Tagestemperaturen 2022 für die Periode 195ß-2022. „1“ bedeutet, dass die höchste Tagestemperatur seit 1950 im Jahr 2022 gemessen, „5“, dass 2022 die fünfhöchste Tagestemperatur gemessen wurde usw. ==Lizenzhinweis== {| style="border:1px solid #8888aa; background-color:#f7f8ff;padding:5px;font-size:95%;" | Quelle: Copernicus Climate Change (2023): European State oft the Climate 2022. Extreme heat, https://climate.copernicus.eu/esotc/2022/extreme-heat <br… | 1 |
| 12:04, 28. Nov. 2021 | ENSO global temp 2020.png (Datei) |  |
511 KB | Globale Temperaturen und ENSO. Globale Monatsmitteltemperaturen und El-Niño- und La-Niña-Jahre 1980-2018 ==Lizenzhinweis== {| style="border:1px solid #8888aa; background-color:#f7f8ff;padding:5px;font-size:95%;" | Quelle: NOAA National Centers for Environmental Information, State of the Climate: Global Climate Report - Annual 2020 (2021): Monthly temperature anomalies versus El Niño, https://www.ncdc.noaa.gov/sotc/global/202013/supplemental/page-2<br> Lizenz: public domain |} | 1 |
| 12:17, 7. Apr. 2020 | Snow Alps March2016.jpg (Datei) |  |
502 KB | Schneebedeckung der Alpen am 27. März 2016 ==Lizenzhinweis== {| style="border:1px solid #8888aa; background-color:#f7f8ff;padding:5px;font-size:95%;" | Quelle: NASA Earth Observatory (2020): [https://earthobservatory.nasa.gov/images/87753/spring-snow-… | 1 |
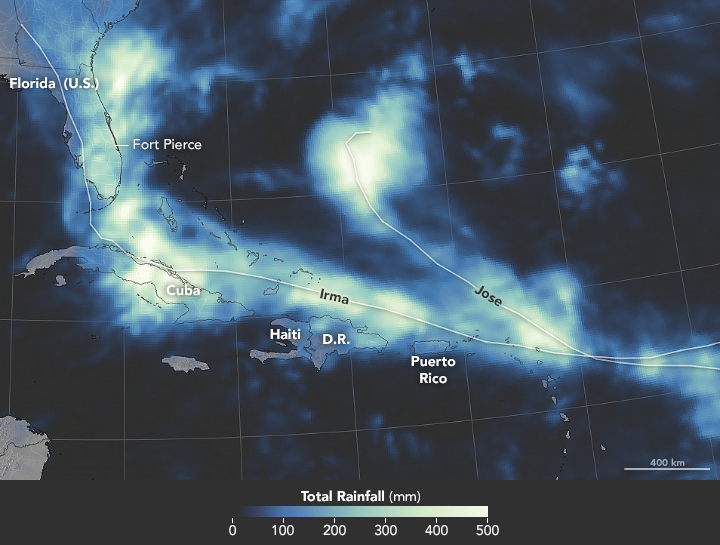
| 20:24, 5. Mär. 2018 | Irma rainfall5.-12.9.2017.png (Datei) |  |
494 KB | Hurrikan-Saison 2017: Niederschlag durch Irma und Jose vom 5. bis 12. September 2017 in mm. ==Lizenzhinweis== {| style="border:1px solid #8888aa; background-color:#f7f8ff;padding:5px;font-size:95%;" | Quelle: NASA Earth Observatory: Rainy Fingerprints… | 1 |
| 17:01, 30. Dez. 2018 | South-patagonia ice field.jpg (Datei) |  |
493 KB | Südpatagonisches Eisfeld Icefield, 28.6.2017 ==Lizenzhinweis== {| style="border:1px solid #8888aa; background-color:#f7f8ff;padding:5px;font-size:95%;" | Quelle: NASA Earth Oberservatory: South Patagonian Icefield, https://earthobservatory.nasa.gov/im… | 1 |
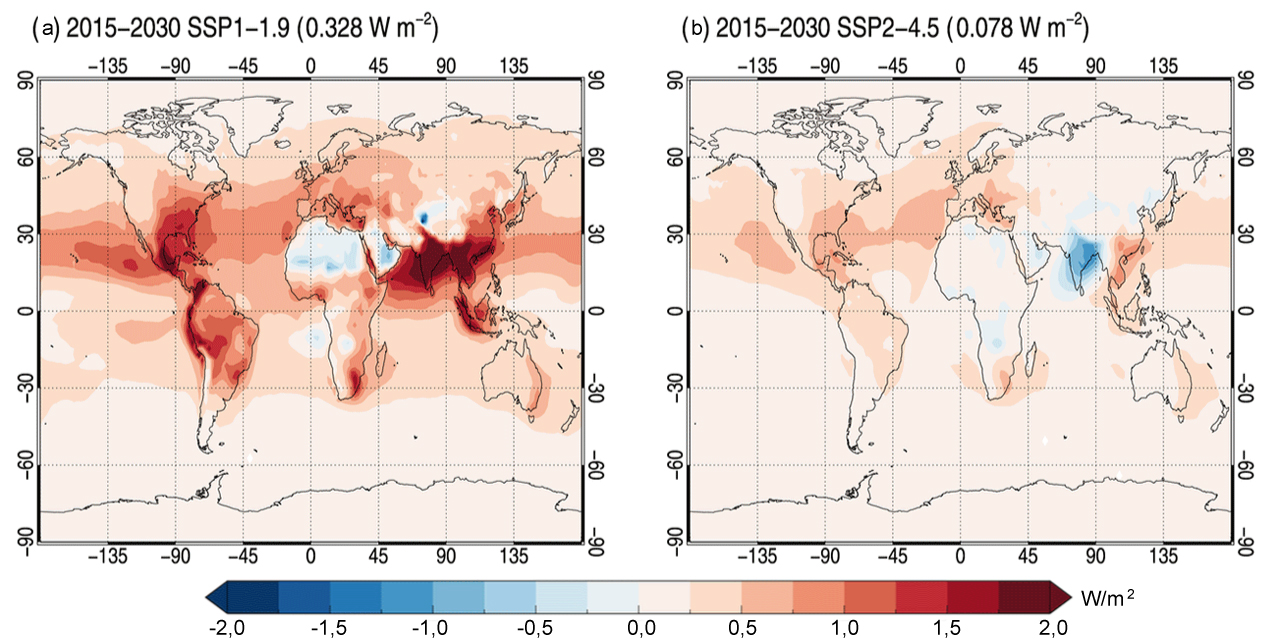
| 22:06, 7. Mai 2020 | Aerosol RF SSP1-2 2030.jpg (Datei) |  |
489 KB | Strahlungsantrieb durch Aerosole bis 2030 nach zwei SSP-Szenarien ==Lizenzhinweis== {| style="border:1px solid #8888aa; background-color:#f7f8ff;padding:5px;font-size:95%;" | Quelle: Lund, M. T., Myhre, G., and Samset, B. H.: Anthropogenic aerosol forc… | 1 |
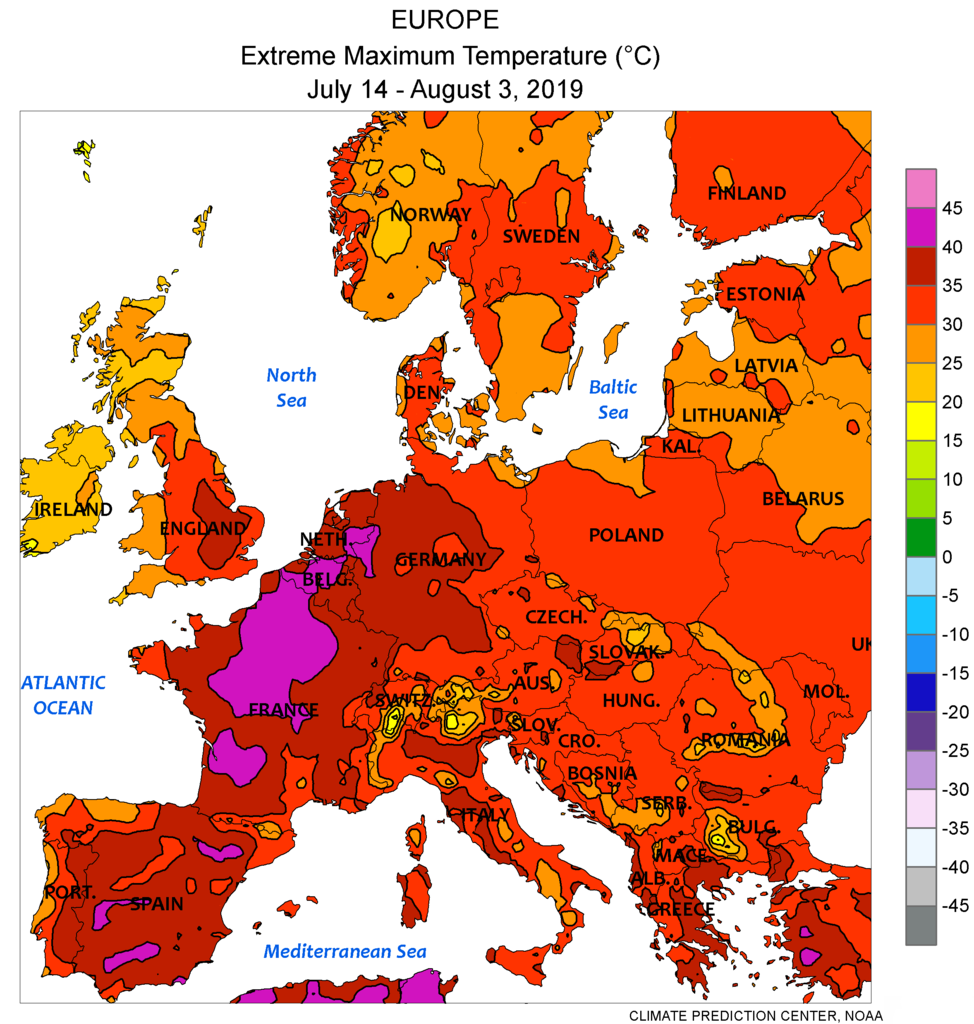
| 14:42, 25. Aug. 2021 | Eu temp.max JUL 2019.png (Datei) |  |
484 KB | == Beschreibung == Höchsttemperaturen 14. Juli – 3. August 2019 ==Lizenzhinweis== {| style="border:1px solid #8888aa; background-color:#f7f8ff;padding:5px;font-size:95%;" | Quelle: Wikipedia Commons (2019): Europe: Extreme maximum temperature July 14 - August 3 2019, https://commons.wikimedia.org/wiki/File:Wcmax1_JUL_14_-_AUG_3_2019_cr.png – ursprgl. NOAA<br> Lizenz: public domain |} | 1 |
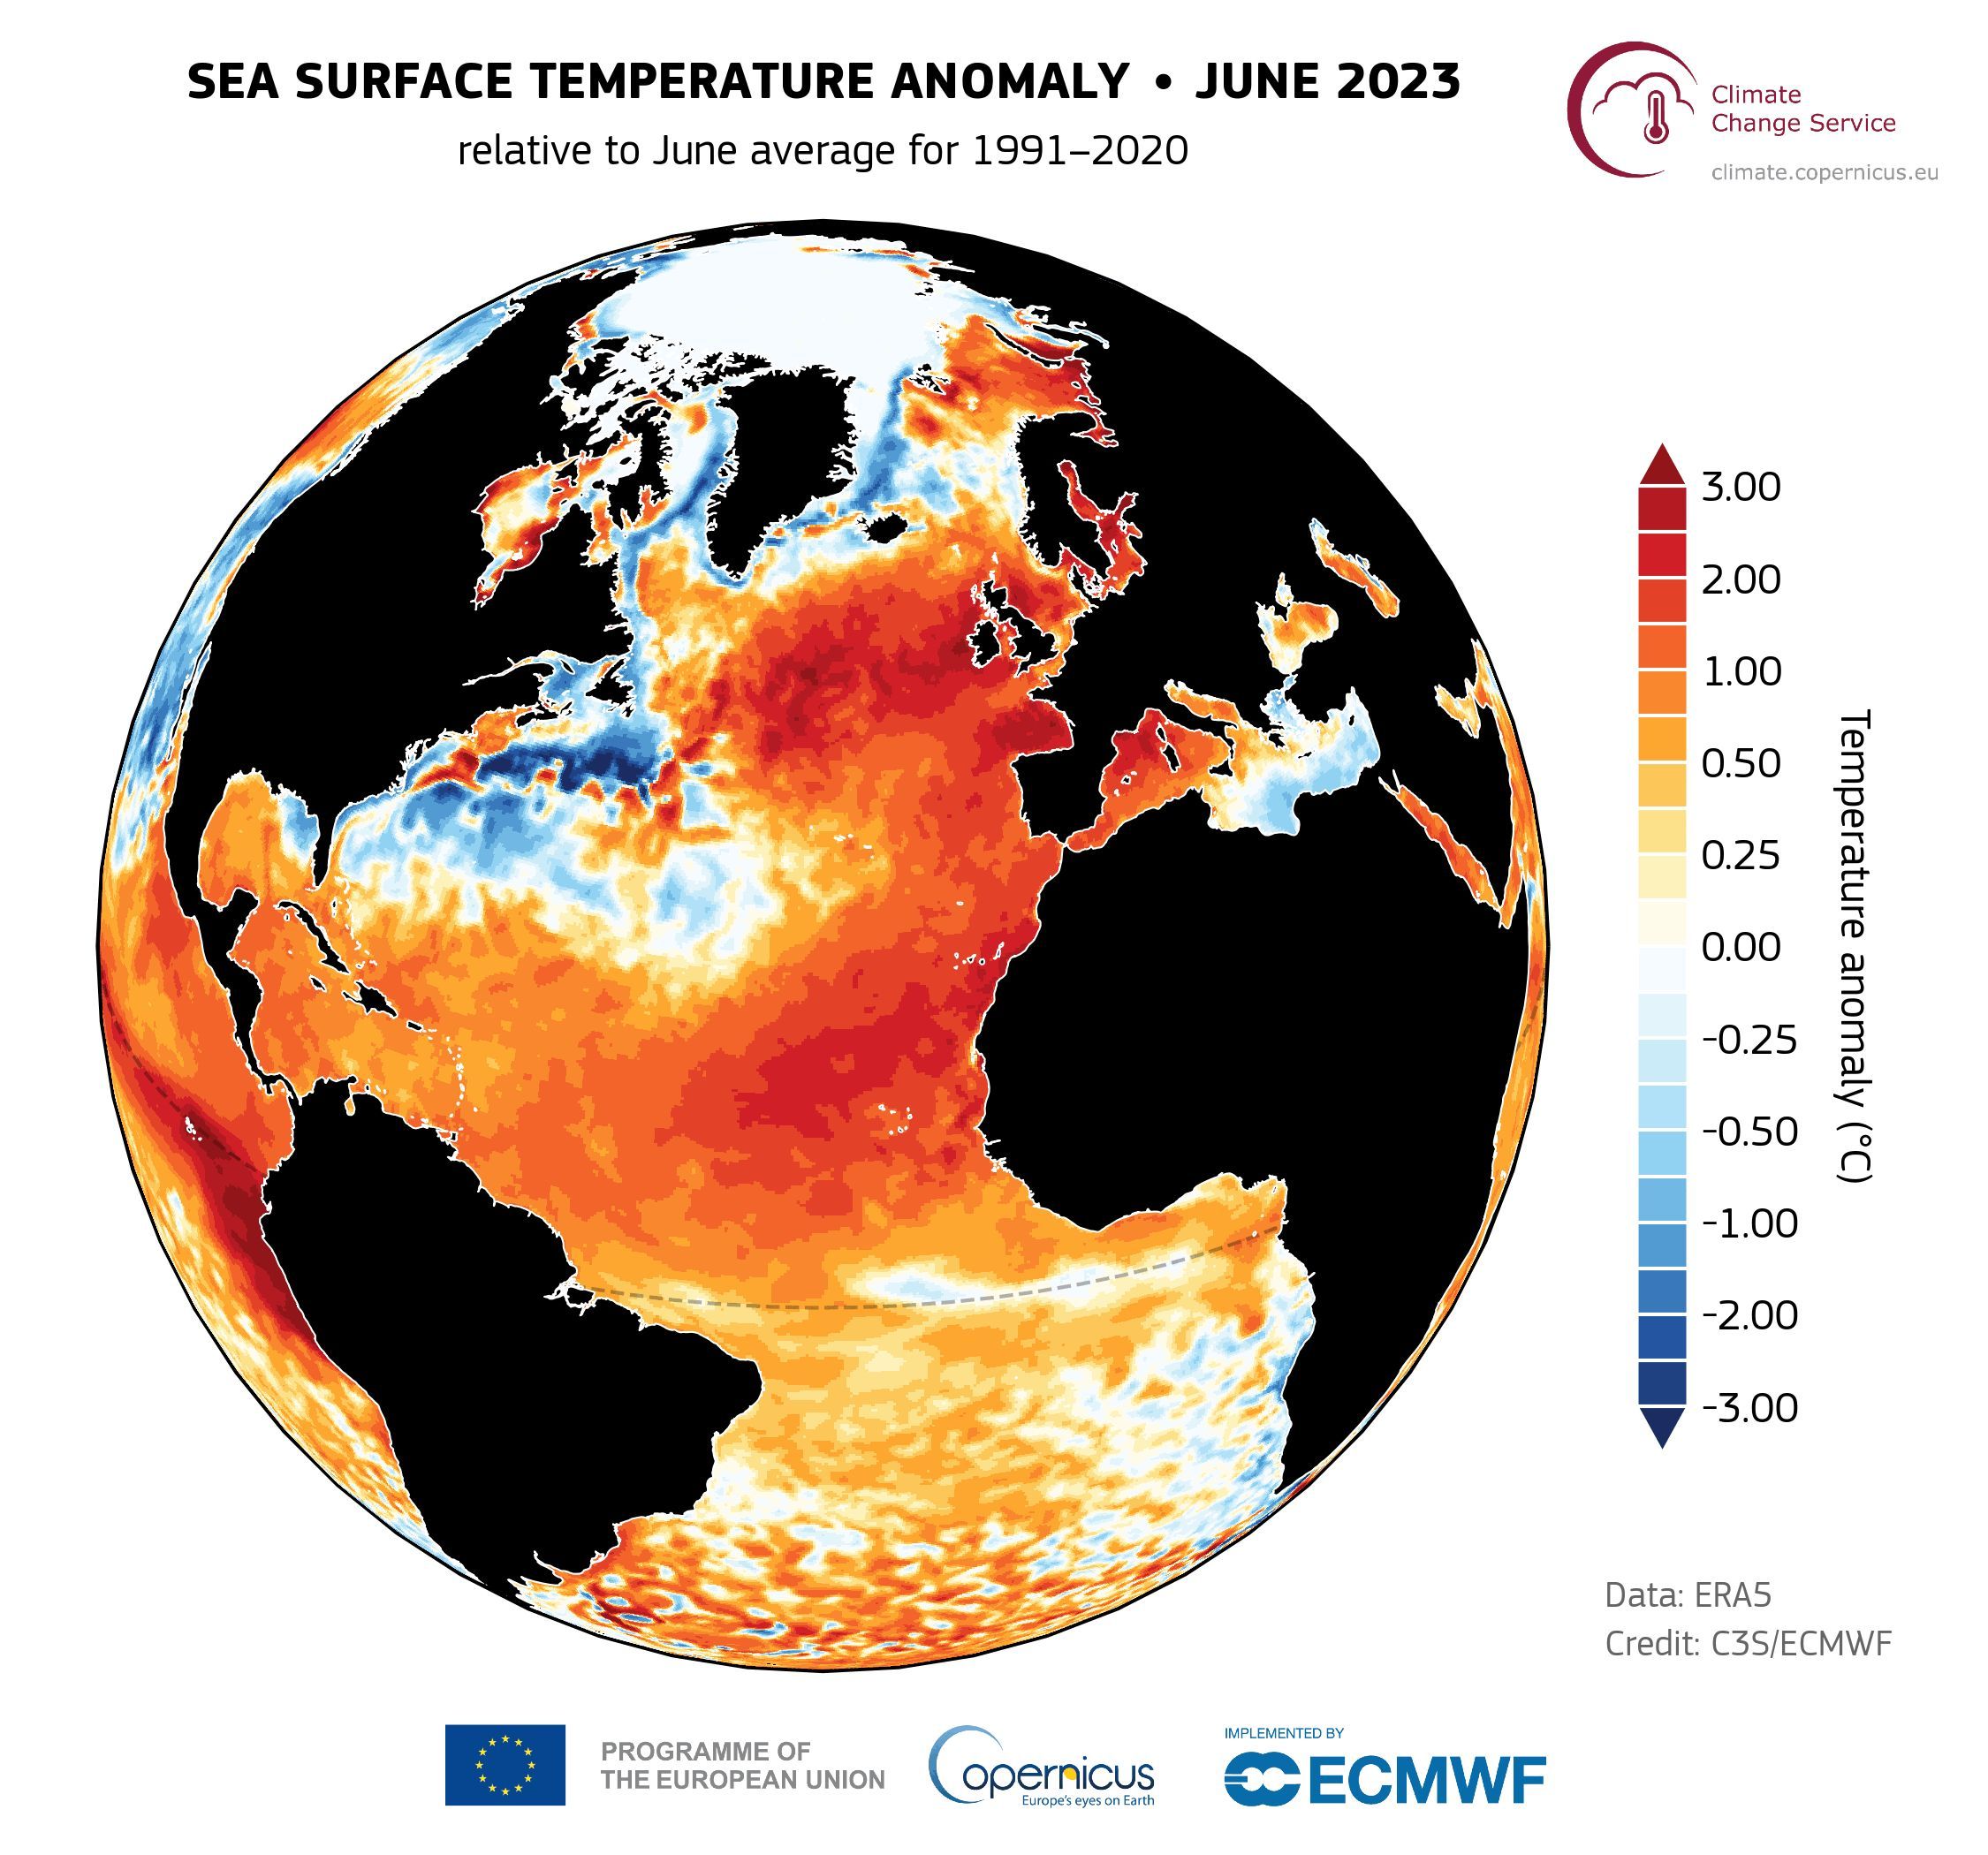
| 15:20, 11. Jan. 2024 | N-Atlantic SST June 2023.jpg (Datei) |  |
479 KB | == Beschreibung == Meeresoberflächentemperatur im Nordatlantik im Juni 2023, Abweichung vom Juni-Mittel1991-2020 ==Lizenzhinweis== {| style="border:1px solid #8888aa; background-color:#f7f8ff;padding:5px;font-size:95%;" | Quelle: Copernicus Climate Change Service (2023): Record-breaking North Atlantic Ocean temperatures contribute to extreme marine heatwaves, https://climate.copernicus.eu/record-breaking-north-atlantic-ocean-temperatures-contribute-extreme-marine-heatwaves <br> Lizenz: Credit:… | 1 |
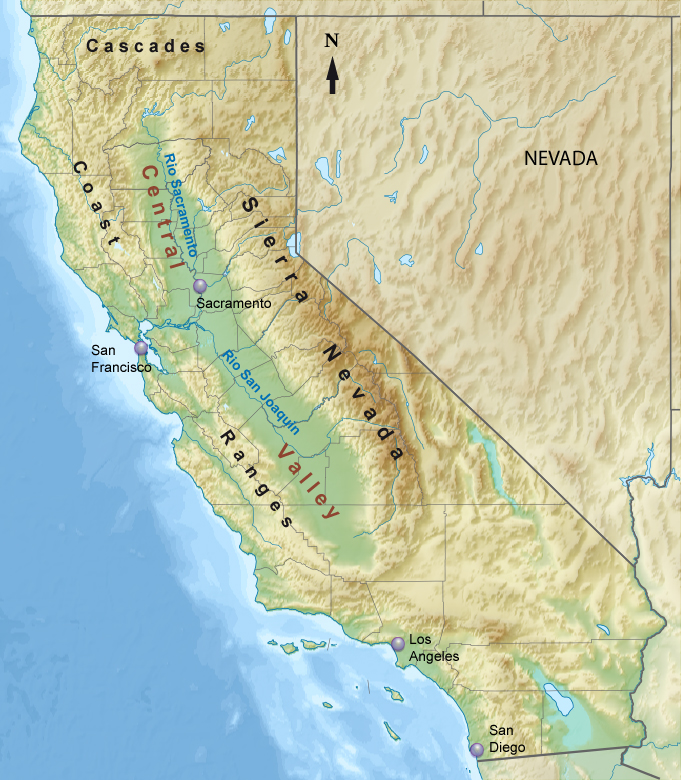
| 16:56, 5. Mai 2020 | Relief map of California.jpg (Datei) |  |
479 KB | Reliefkarte von Kalifornien ==Lizenzhinweis== {| style="border:1px solid #8888aa; background-color:#f7f8ff;padding:5px;font-size:95%;" | Quelle: Wikimedia Commons (2016): https://upload.wikimedia.org/wikipedia/commons/d/d0/Relief_map_of_California.png… | 1 |
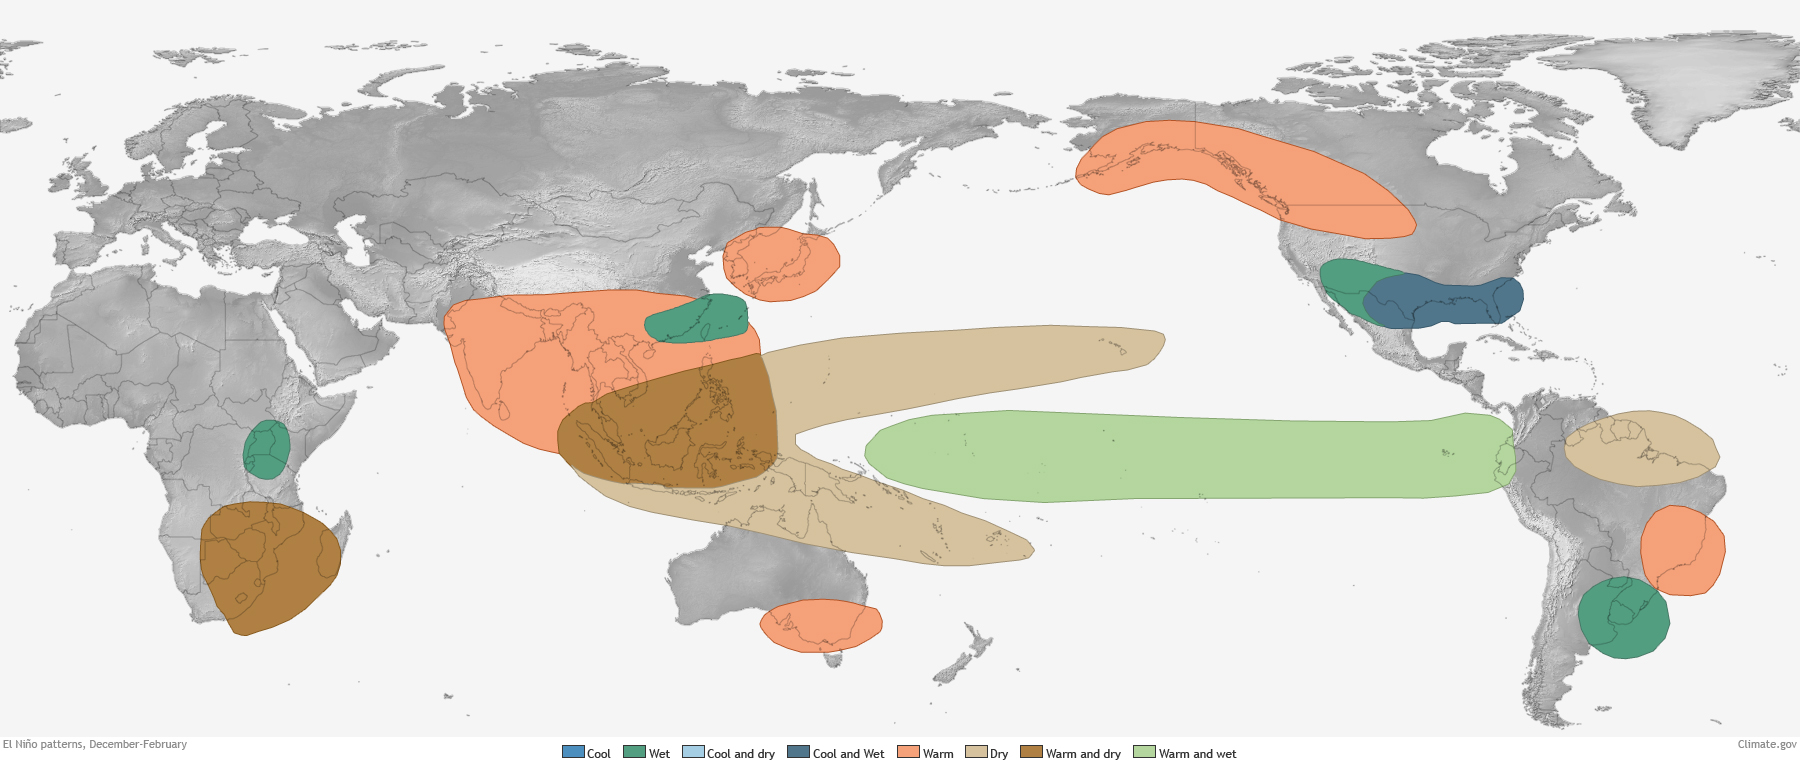
| 20:55, 12. Sep. 2019 | ElNino impacts winter.jpg (Datei) |  |
478 KB | El Niño Folgen im Winter == Lizenzhinweis == {| style="border:1px solid #8888aa; background-color:#f7f8ff;padding:5px;font-size:95%;" |Quelle: Lindsey, R. (NOAA Climate.gov, 2016): Global impacts of El Niño and La Niña, https://www.climate.gov/news-… | 1 |
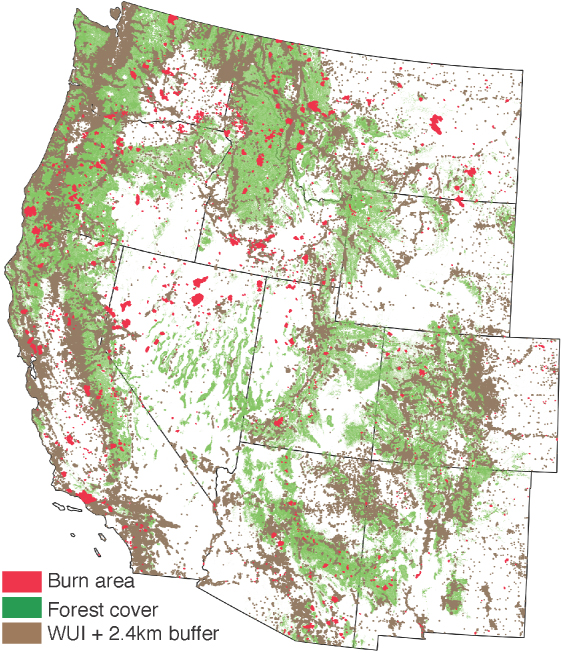
| 18:34, 29. Aug. 2019 | Cal 2017 burned area.jpg (Datei) |  |
477 KB | Waldbrandgebiete 2017 in den westlichen USA ==Lizenzhinweis== {| style="border:1px solid #8888aa; background-color:#f7f8ff;padding:5px;font-size:95%;" | Quelle: Balch, J.K., T. Schoennagel, A.P. Williams et al. (2018): Switching on the Big Burn of 2017… | 1 |
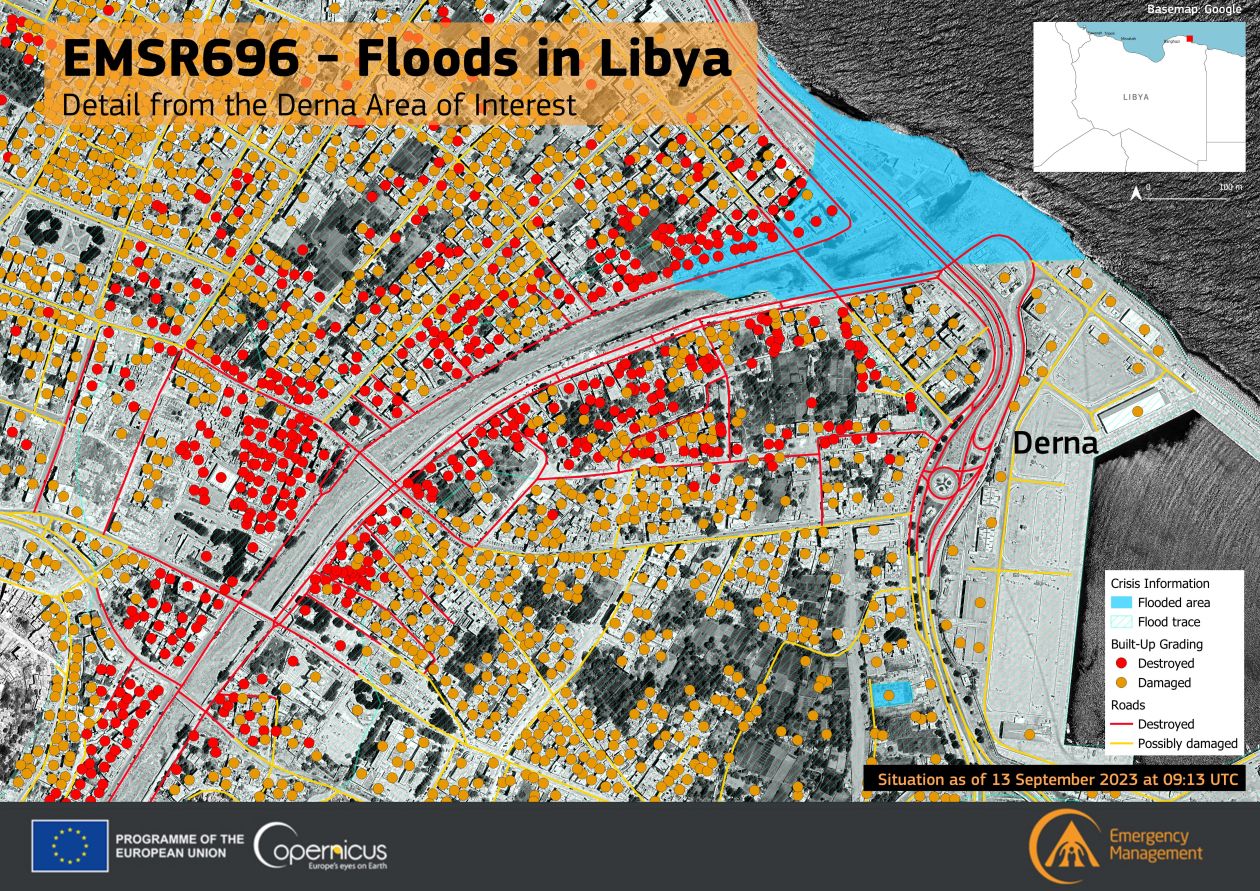
| 11:23, 28. Sep. 2023 | Medicane Daniel DernaFloods.jpg (Datei) |  |
472 KB | == Beschreibung == Zerstörungen in der libyschen Stadt Derna durch den Medicane Daniel ==Lizenzhinweis== {| style="border:1px solid #8888aa; background-color:#f7f8ff;padding:5px;font-size:95%;" | Quelle: European Union, Copernicus Sentinel-X, https://www.copernicus.eu/en/media/image-day-gallery/severe-floods-devastate-derna-libya<br> Lizenz: This Image of the Day may be reused freely and without prior authorisation by the media provided the following attribution is included (s.o.) |} | 1 |
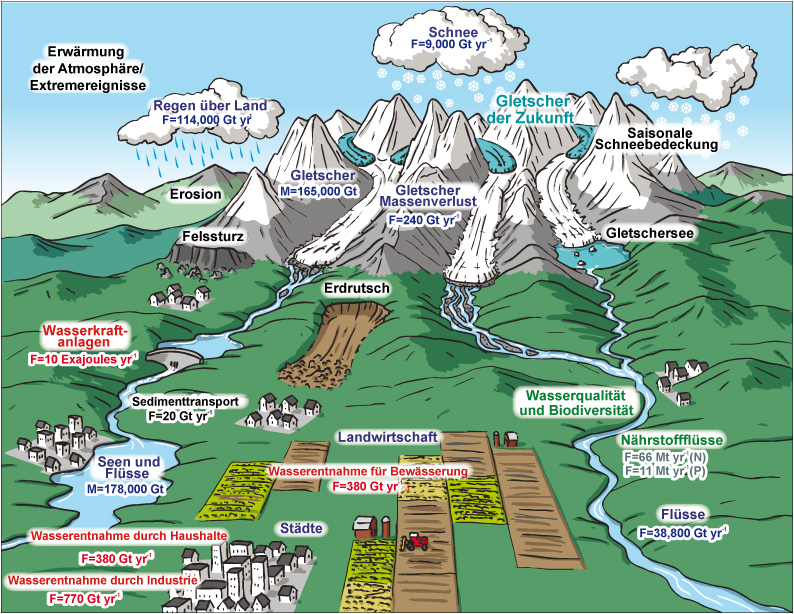
| 12:36, 22. Dez. 2022 | Hochgebirge dt.jpg (Datei) |  |
472 KB | Schematische Darstellung von Hochgebirgsregionen und ihrer Beziehung zum Umland. M: Masse in Gt, F: Massenflüsse in Gigatonnen (Gt) pro Jahr == Lizenzhinweis == {| style="border:1px solid #8888aa; background-color:#f7f8ff;padding:5px;font-size:95%;" | Quelle: Huss, M., B. Bookhagen, C. Huggel, D. Jacobsen et al. (2017): [https://doi.org/10.1002/2016ef000514 Toward mountains without permanent snow and ice]. Earth’s Future 5:418–435; übersetzt Lizenz: [https://creativecommons.org/licenses/by-nc-… | 1 |
| 13:59, 24. Dez. 2018 | PDSI global 2000-2100.jpg (Datei) |  |
463 KB | Änderung des PDSI bis 2100, positive Werte: ungewöhnlich feucht, negative Werte: ungewöhnlich trocken; -4 und niedriger: extrem trocken ==Lizenzhinweis== {| style="border:1px solid #8888aa; background-color:#f7f8ff;padding:5px;font-size:95%;" | Que… | 1 |
| 21:15, 21. Okt. 2021 | CE Verfahren.jpg (Datei) |  |
458 KB | Ausgewählte Verfahren des Climate Engineering im Überblick == Lizenzhinweis == {| style="border:1px solid #8888aa; background-color:#f7f8ff;padding:5px;font-size:95%;" |Quelle: Kiel-Earth-Institute [http://www.spp-climate-engineering.de Climate Engineering] Die Graphik steht unter der [http://creativecommons.org/licenses/by-nc-nd/3.0/deed.de Creative Commons Namensnennung-NichtKommerziell-KeineBearbeitung 3.0 Unported Lizenz]: CC BY-NC-ND |} | 2 |
| 14:47, 15. Nov. 2018 | SLR rel Europe N-Atlantic 2081-2100.png (Datei) |  |
453 KB | Projektion des relativen Meeresspiegelanstiegs in Europa und im Nordatlantikraum bis 2081-2100 im Vergleich zu 1986-2005 nach dem Szenario RCP4.5. ==Lizenzhinweis== {| style="border:1px solid #8888aa; background-color:#f7f8ff;padding:5px;font-size:95%;… | 1 |
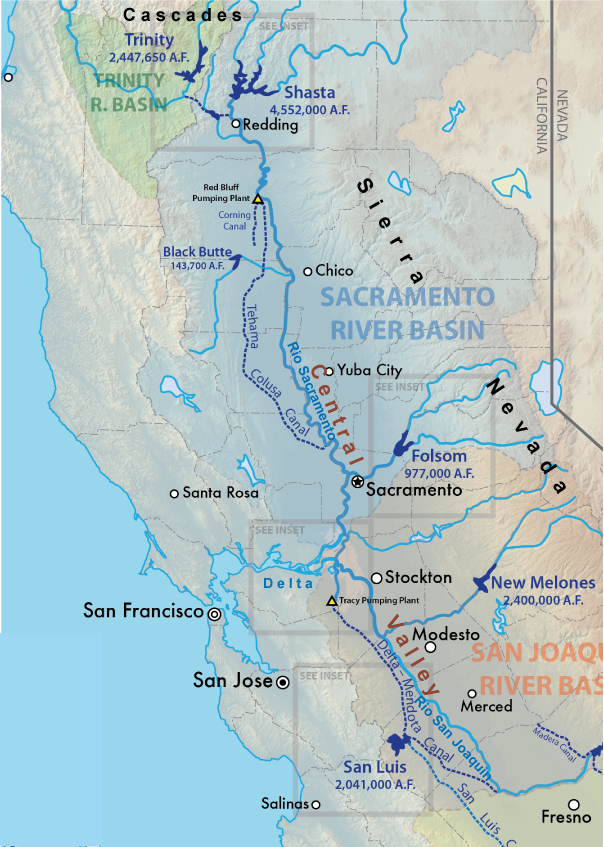
| 21:41, 30. Apr. 2020 | Cal Central Valley project b.jpg (Datei) |  |
448 KB | Wichtige Anlagen des Central Valley Project ==Lizenzhinweis== {| style="border:1px solid #8888aa; background-color:#f7f8ff;padding:5px;font-size:95%;" | Quelle: Wikimedia Commons (2016): Central Valley Project, https://en.wikipedia.org/wiki/File:Centr… | 2 |
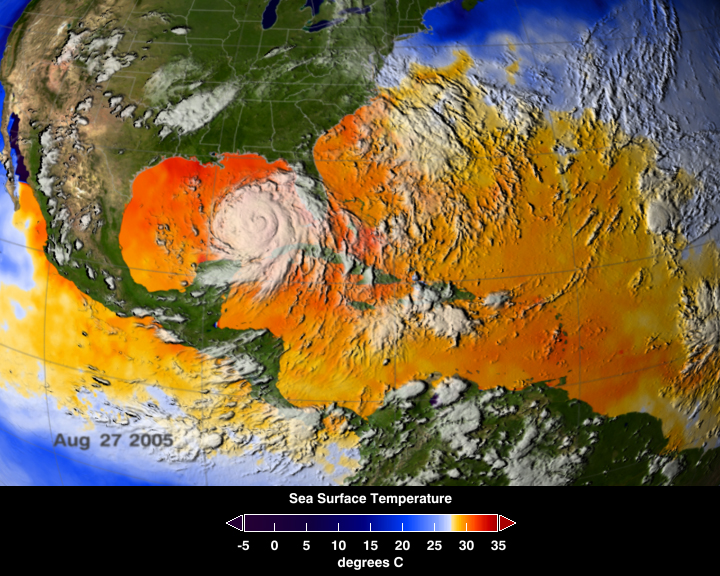
| 12:41, 3. Mär. 2018 | Katrina SST 27.8.2005.jpg (Datei) |  |
448 KB | Hurrikan Katrina am 27.8.2005. Meeresoberflächentemperaturen (SST vom 25.-27.8.2015) vor dem Auftreffen auf Land von Hurrikan Katrina (Position vom 27.8.05) ==Lizenzhinweis== {| style="border:1px solid #8888aa; background-color:#f7f8ff;padding:5px;fon… | 1 |
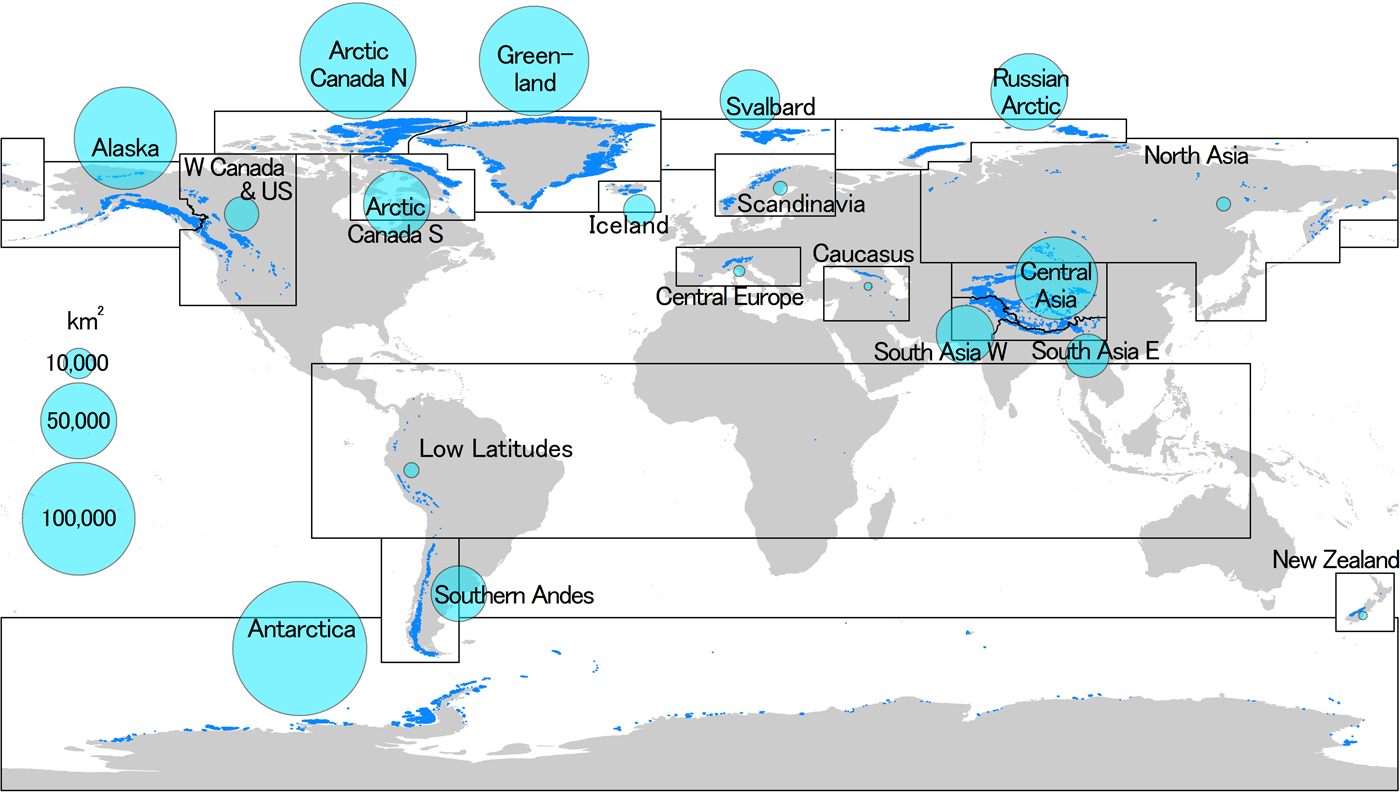
| 20:33, 20. Jun. 2020 | Global glaciers distribution.jpeg (Datei) |  |
447 KB | Globale Gletscher-Gebiete (dunkelblau). Hellblaue Kreise zeigen die Größe der Gletscherfläche in den Regionen an. ==Lizenzhinweis== {| style="border:1px solid #8888aa; background-color:#f7f8ff;padding:5px;font-size:95%;" | Quelle: Hock, R., A. Bliss… | 1 |
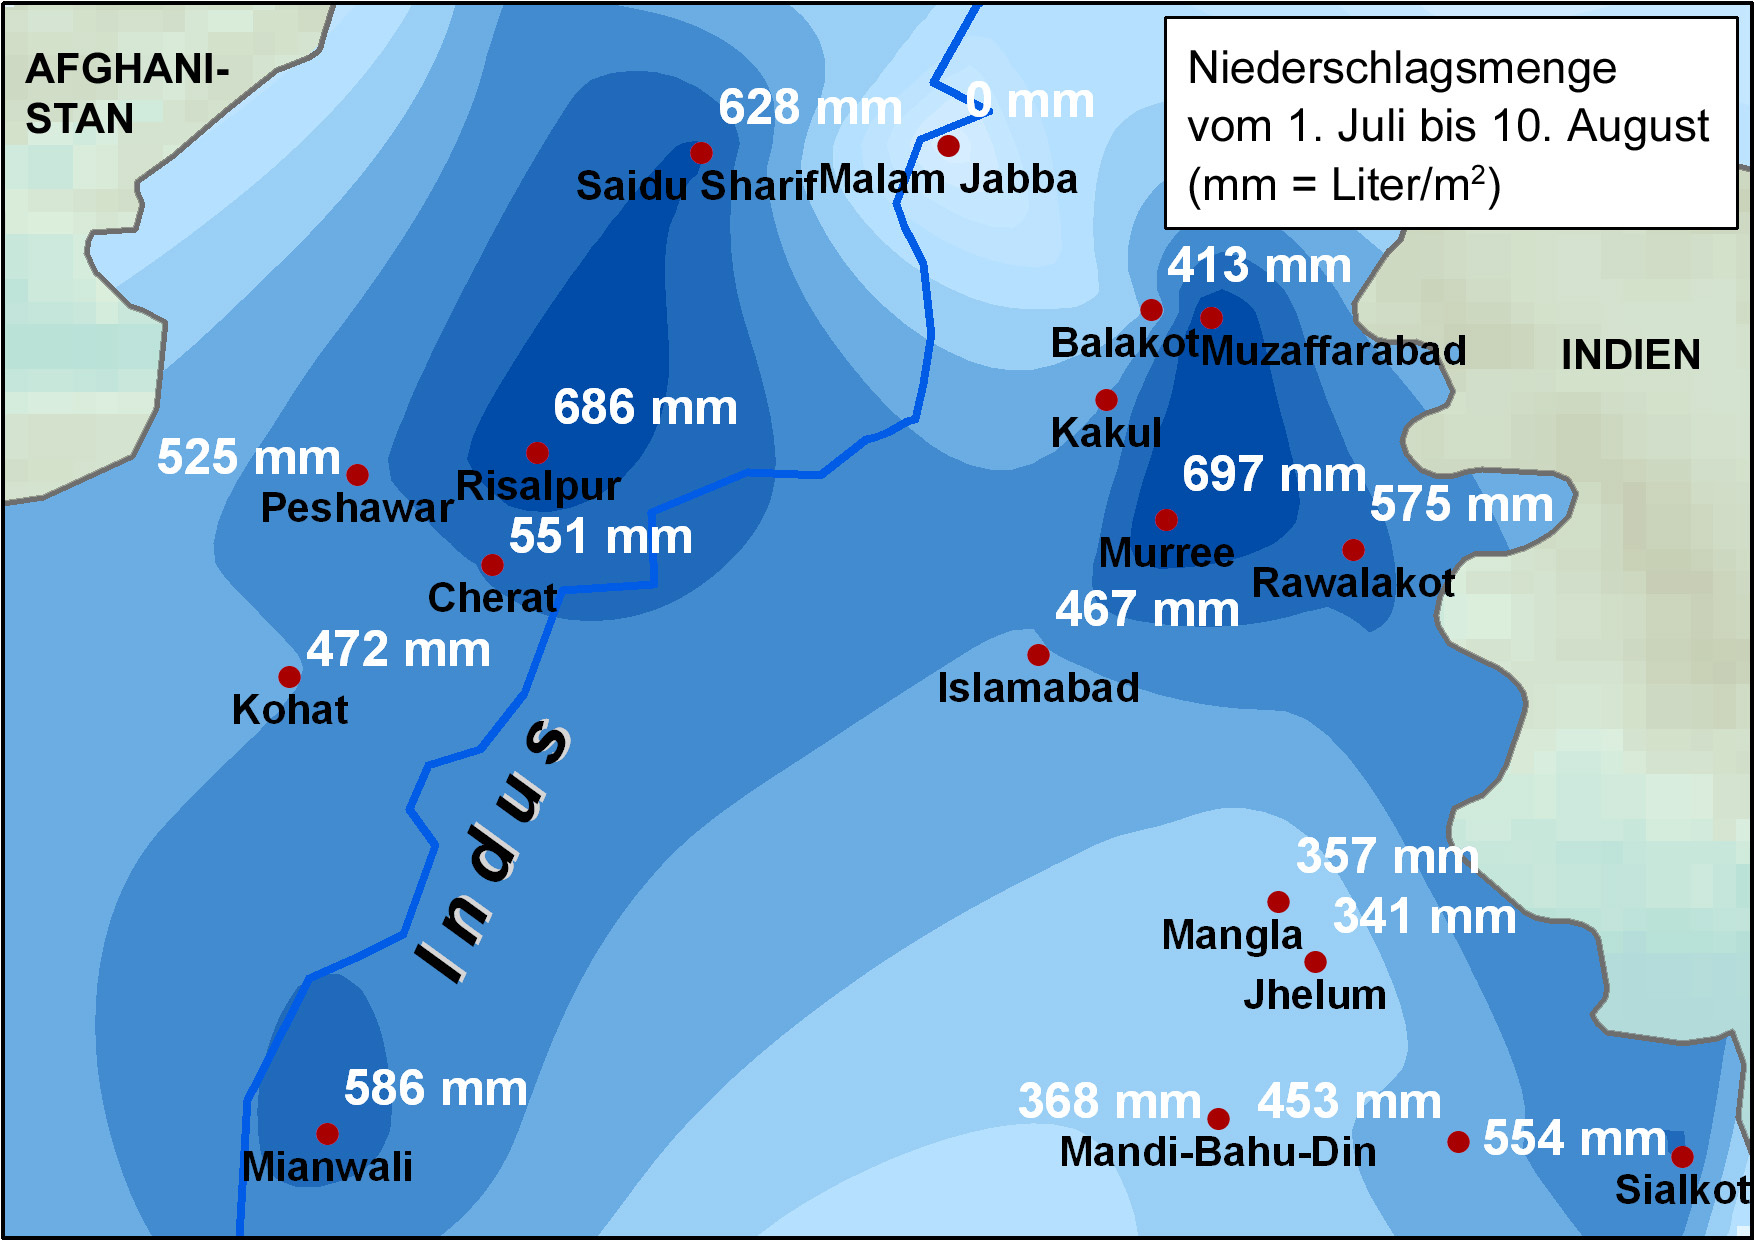
| 20:56, 28. Feb. 2011 | Pakistan Niederschläge2010 DWD.jpg (Datei) |  |
444 KB | Niederschlagssummen des Zeitraums 1. Juli bis 10. August 2010 in Pakistan ==Lizenzhinweis== {| style="border:1px solid #8888aa; background-color:#f7f8ff;padding:5px;font-size:95%;" | Quelle: DWD Pressemitteilung vom 12.8.2010: [http://www.dwd.de/bvbw/appm | 1 |
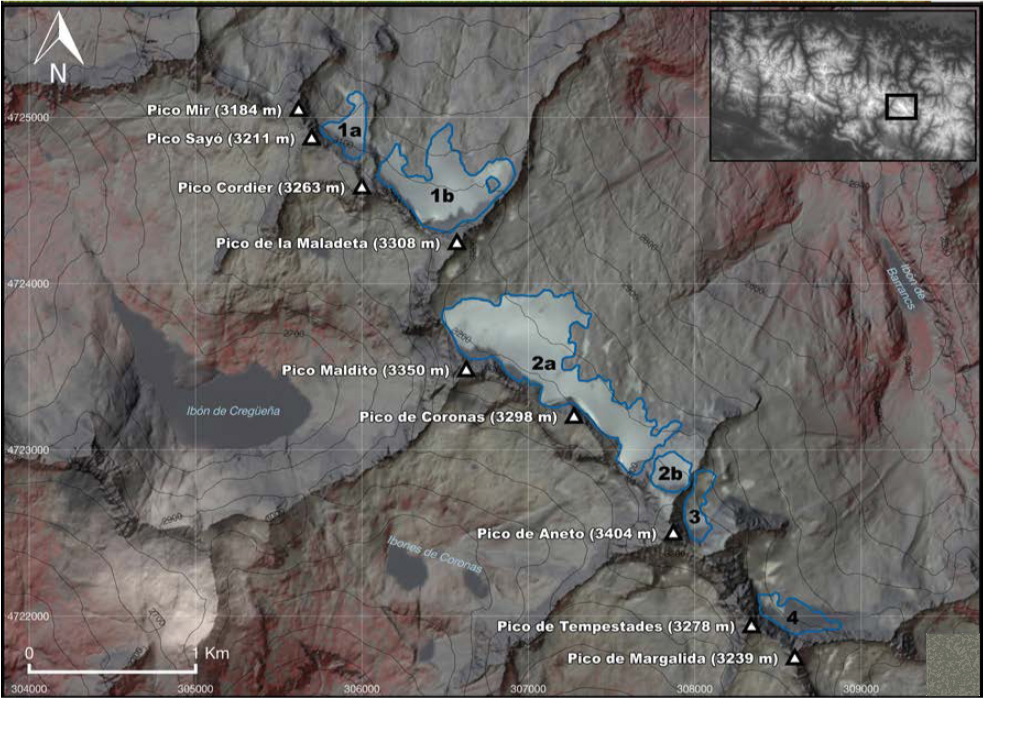
| 14:50, 28. Feb. 2020 | Pyrenees Maladeta-Aneto icefield2016.jpg (Datei) |  |
439 KB | Das Maladeta-Aneto-Massiv ist das mit 96,37 ha gegenwärtig am stärksten vergletscherte Gebiet in den Pyrenäen. ==Lizenzhinweis== {| style="border:1px solid #8888aa; background-color:#f7f8ff;padding:5px;font-size:95%;" | Quelle: Rico, I, Izaguirre, E… | 1 |
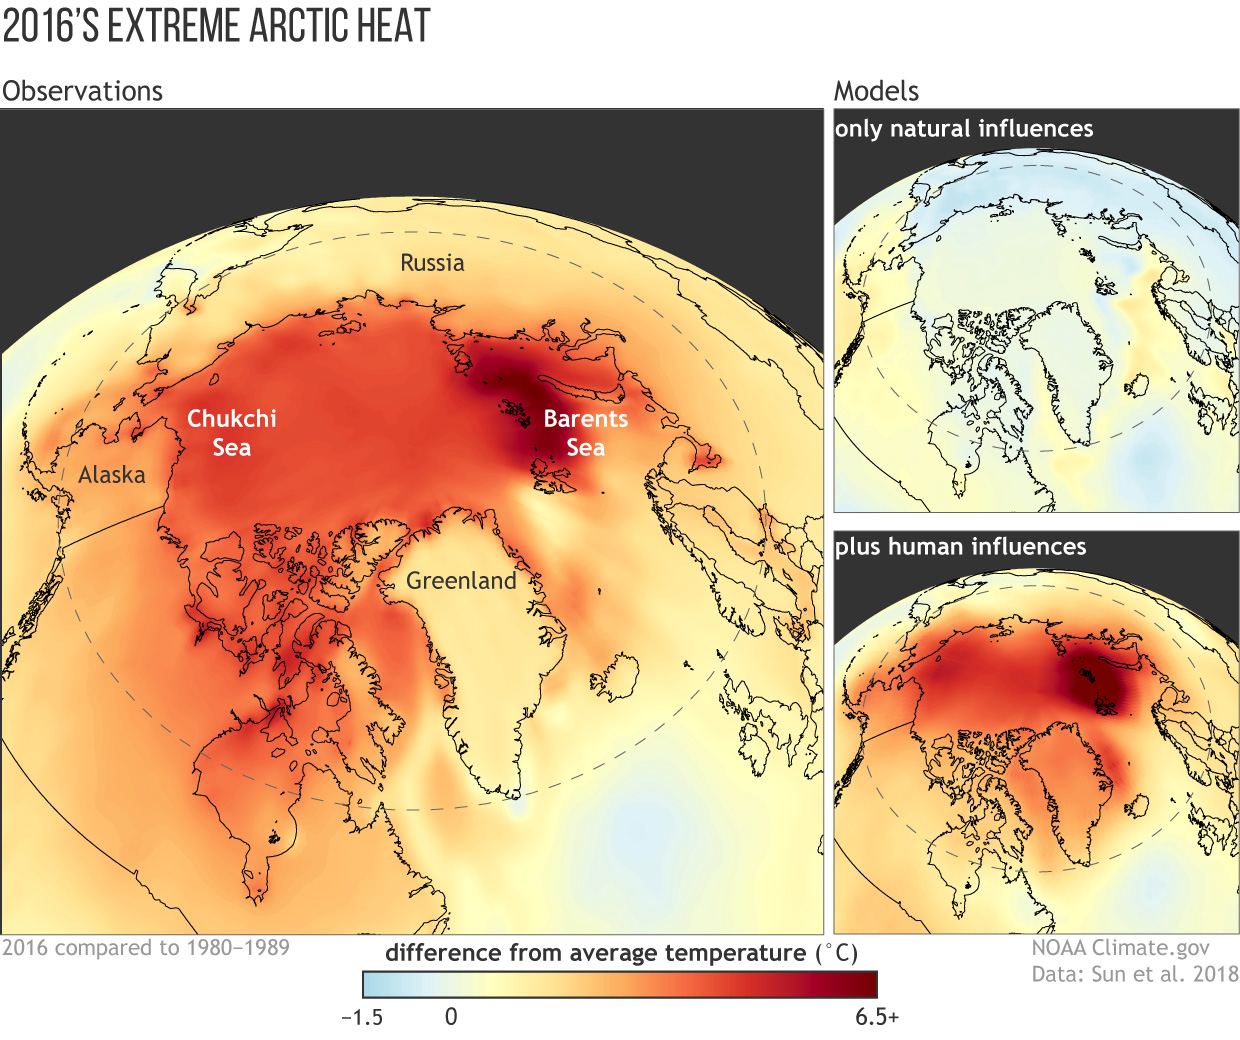
| 21:33, 18. Mär. 2019 | Arctic extremeheat 2016.jpg (Datei) |  |
437 KB | Erwärmung der Arktis und global: Temperaurabweichung im Verhältnis zum Mittel 1981-2010 ==Lizenzhinweis== {| style="border:1px solid #8888aa; background-color:#f7f8ff;padding:5px;font-size:95%;" | Quelle: NOAA Research News (2018): Study: In 2016’s… | 1 |
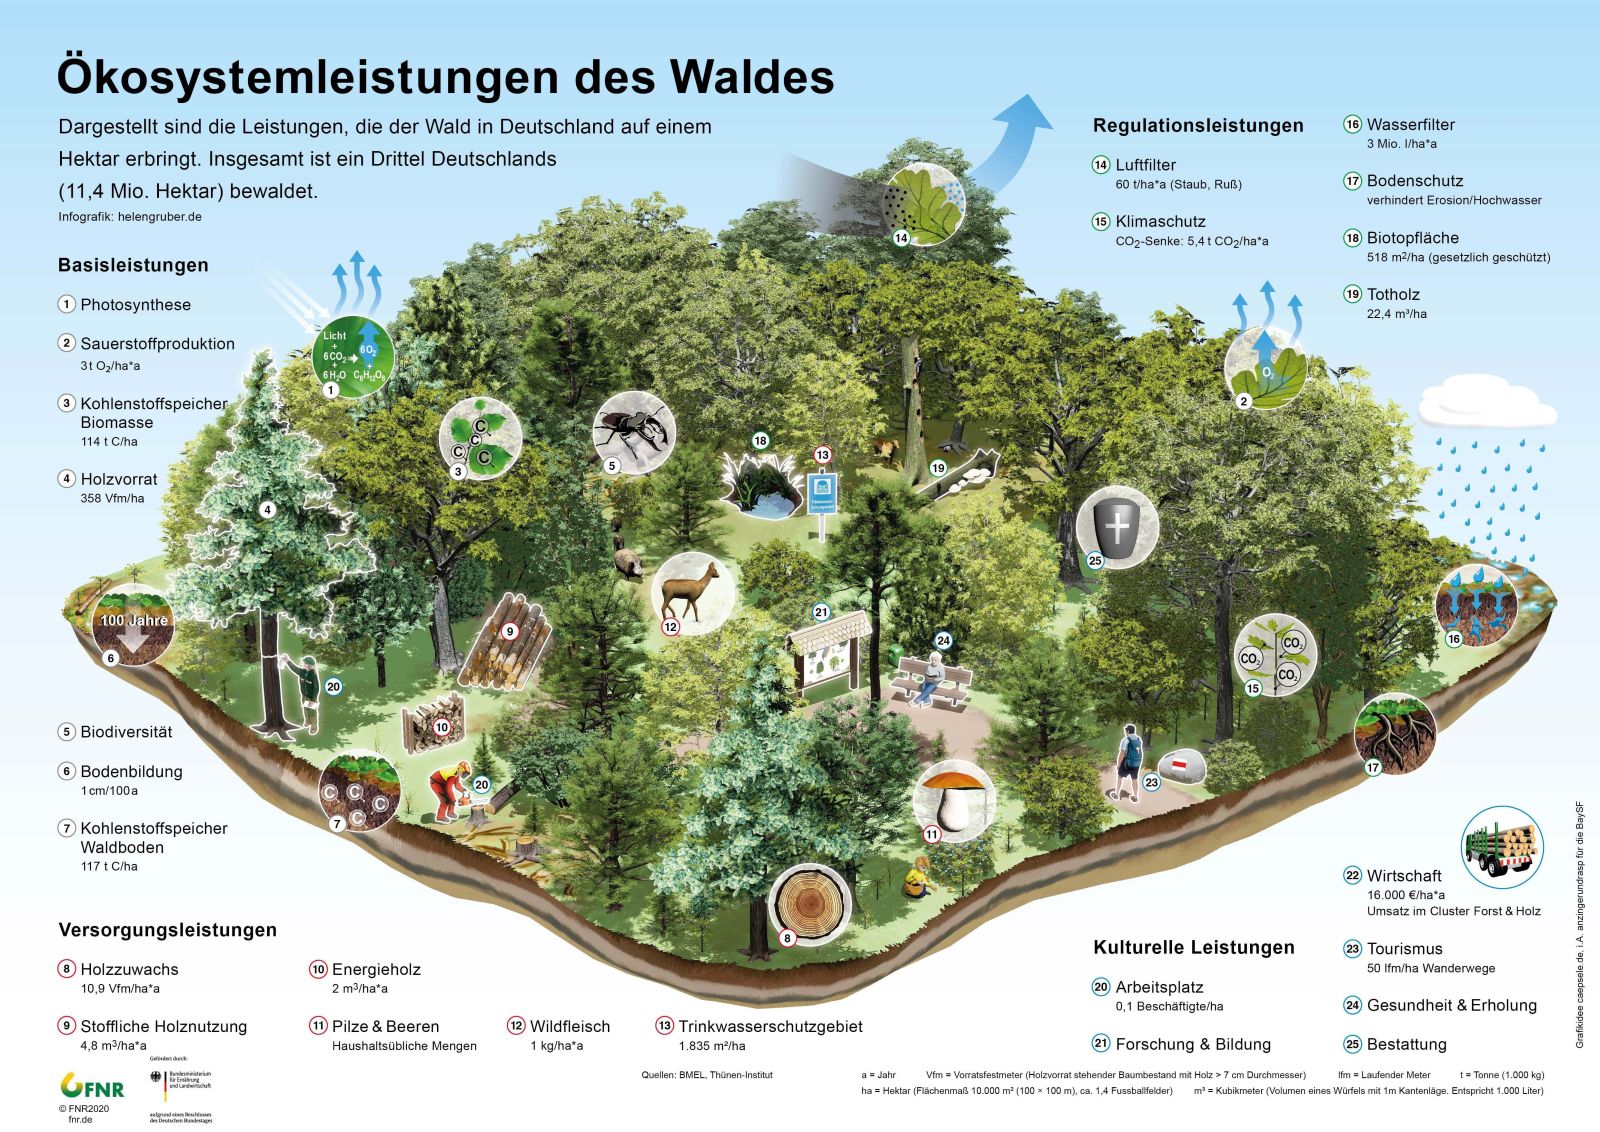
| 15:42, 27. Sep. 2021 | D Ökosystemleistung Wald.jpg (Datei) |  |
434 KB | == Beschreibung == Ökosystemleistungen des Waldes in Deutschland == Lizenzhinweis == {| style="border:1px solid #8888aa; background-color:#f7f8ff;padding:5px;font-size:95%;" | Quelle: Fachagentur Nachwachsende Rohstoffe e.V. (FNR) (2021): Pressegraphiken, Infographik Ökosystemleistungen https://mediathek.fnr.de/grafiken/pressegrafiken/infografik-oekosystemleistungen.html <br> Lizenz: Die Verwendung der angebotenen Grafiken und Fotos ist für redaktionelle Zwecke honorarfrei. Abdruck bitte, wen… | 1 |
| 12:56, 3. Jan. 2019 | Tropische-Anden.jpg (Datei) |  |
434 KB | Gletscher in den Tropischen Anden. Gezeigt werden die wichtigsten beobachteten Gletscher. ==Lizenzhinweis== {| style="border:1px solid #8888aa; background-color:#f7f8ff;padding:5px;font-size:95%;" | Quelle: Rabatel, A., et al. (2013): Current state of… | 1 |
| 17:11, 23. Okt. 2018 | Arctic sea-ice-extent-1500.jpg (Datei) |  |
432 KB | Die Abnahme der Ausdehnung des arktischen Meereises zwischen 1978 und 2016 im Ausdehnung des Arktischen Meereises in den letzten 1500 Jahre ==Lizenzhinweis== {| style="border:1px solid #8888aa; background-color:#f7f8ff;padding:5px;font-size:95%;" | Que… | 1 |
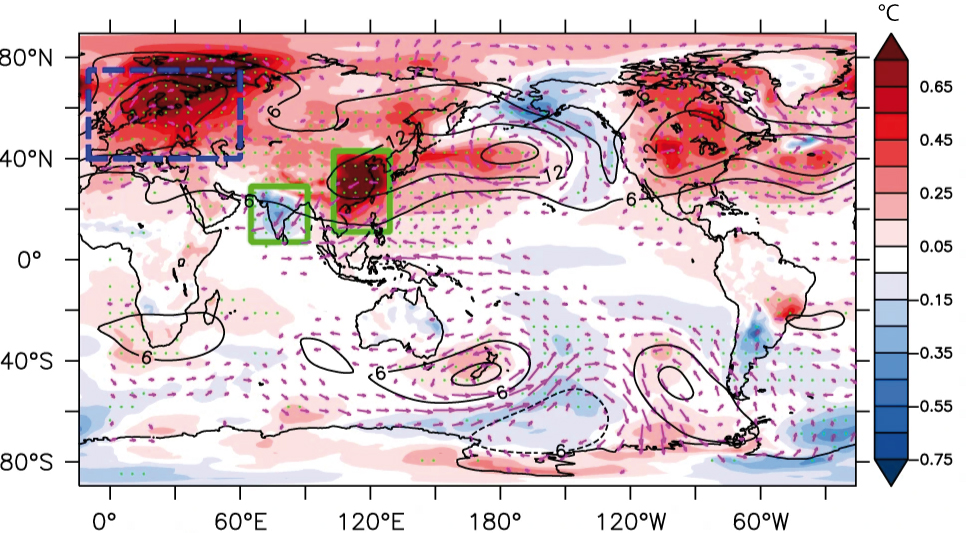
| 17:24, 24. Okt. 2023 | Asian-aerosol-dipole-remote-warming.jpg (Datei) |  |
430 KB | == Beschreibung == Fernwirkungen der Aerosolentwicklung in Süd- und Ostasien. Dargestellt ist die Änderung der Jahresmitteltemperatur in °C, sowie Windströmungen bei 850 hPa. ==Lizenzhinweis== {| style="border:1px solid #8888aa; background-color:#f7f8ff;padding:5px;font-size:95%;" | Quelle: Xiang, B., Xie, SP., Kang, S.M. et al. (2023): An emerging Asian aerosol dipole pattern reshapes the Asian summer monsoon and exacerbates northern hemisphere warming. npj Clim Atmos Sci 6, 77. https://doi.or… | 1 |
| 21:08, 29. Okt. 2020 | N-America ENSO impact.png (Datei) |  |
424 KB | Einfluss von El Niño und La Niña auf das nordamerikanische Wetter im Winter ==Lizenzhinweis== {| style="border:1px solid #8888aa; background-color:#f7f8ff;padding:5px;font-size:95%;" | Quelle: Perlwitz, J., T. Knutson, J.P. Kossin, and A.N. LeGrande… | 1 |
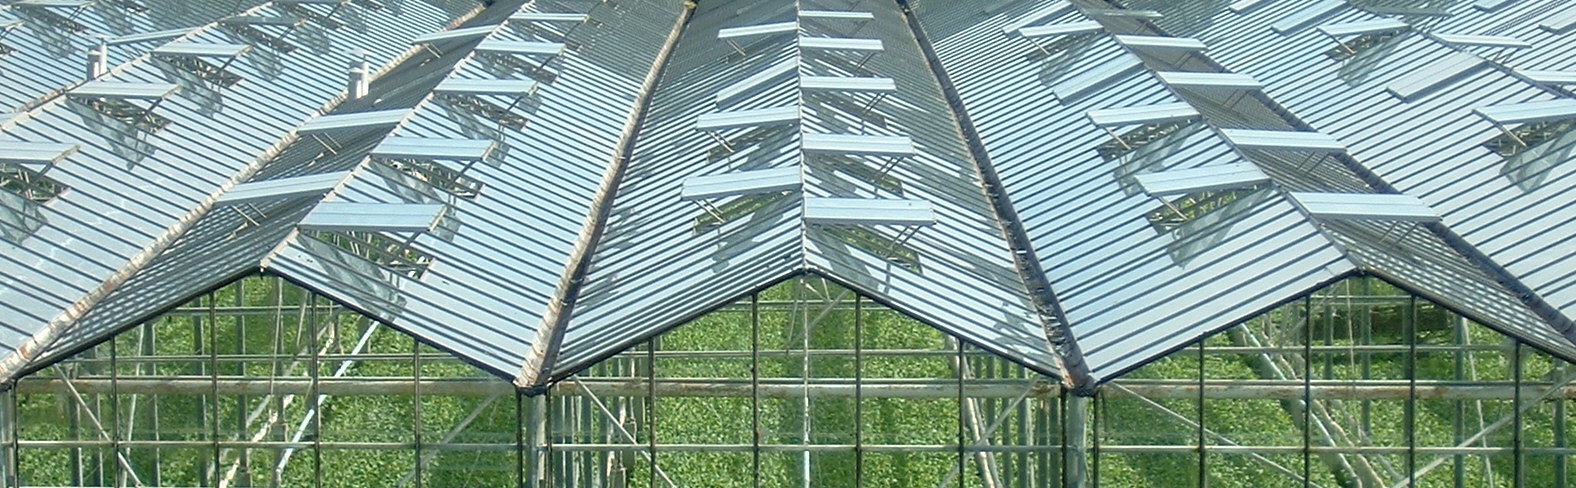
| 22:17, 11. Nov. 2022 | Treibhaus Niederlande.jpg (Datei) |  |
422 KB | == Beschreibung == Treibhaus in den Niederlanden == Lizenzhinweis == {| style="border:1px solid #8888aa; background-color:#f7f8ff;padding:5px;font-size:95%;" |Quelle: Wikimedia Commons (2005): Netherlands: Westland - greenhouses. https://commons.wikimedia.org/wiki/File:Westland_kassen.jpg <br> Lizenz: CC BY-SA | 1 |
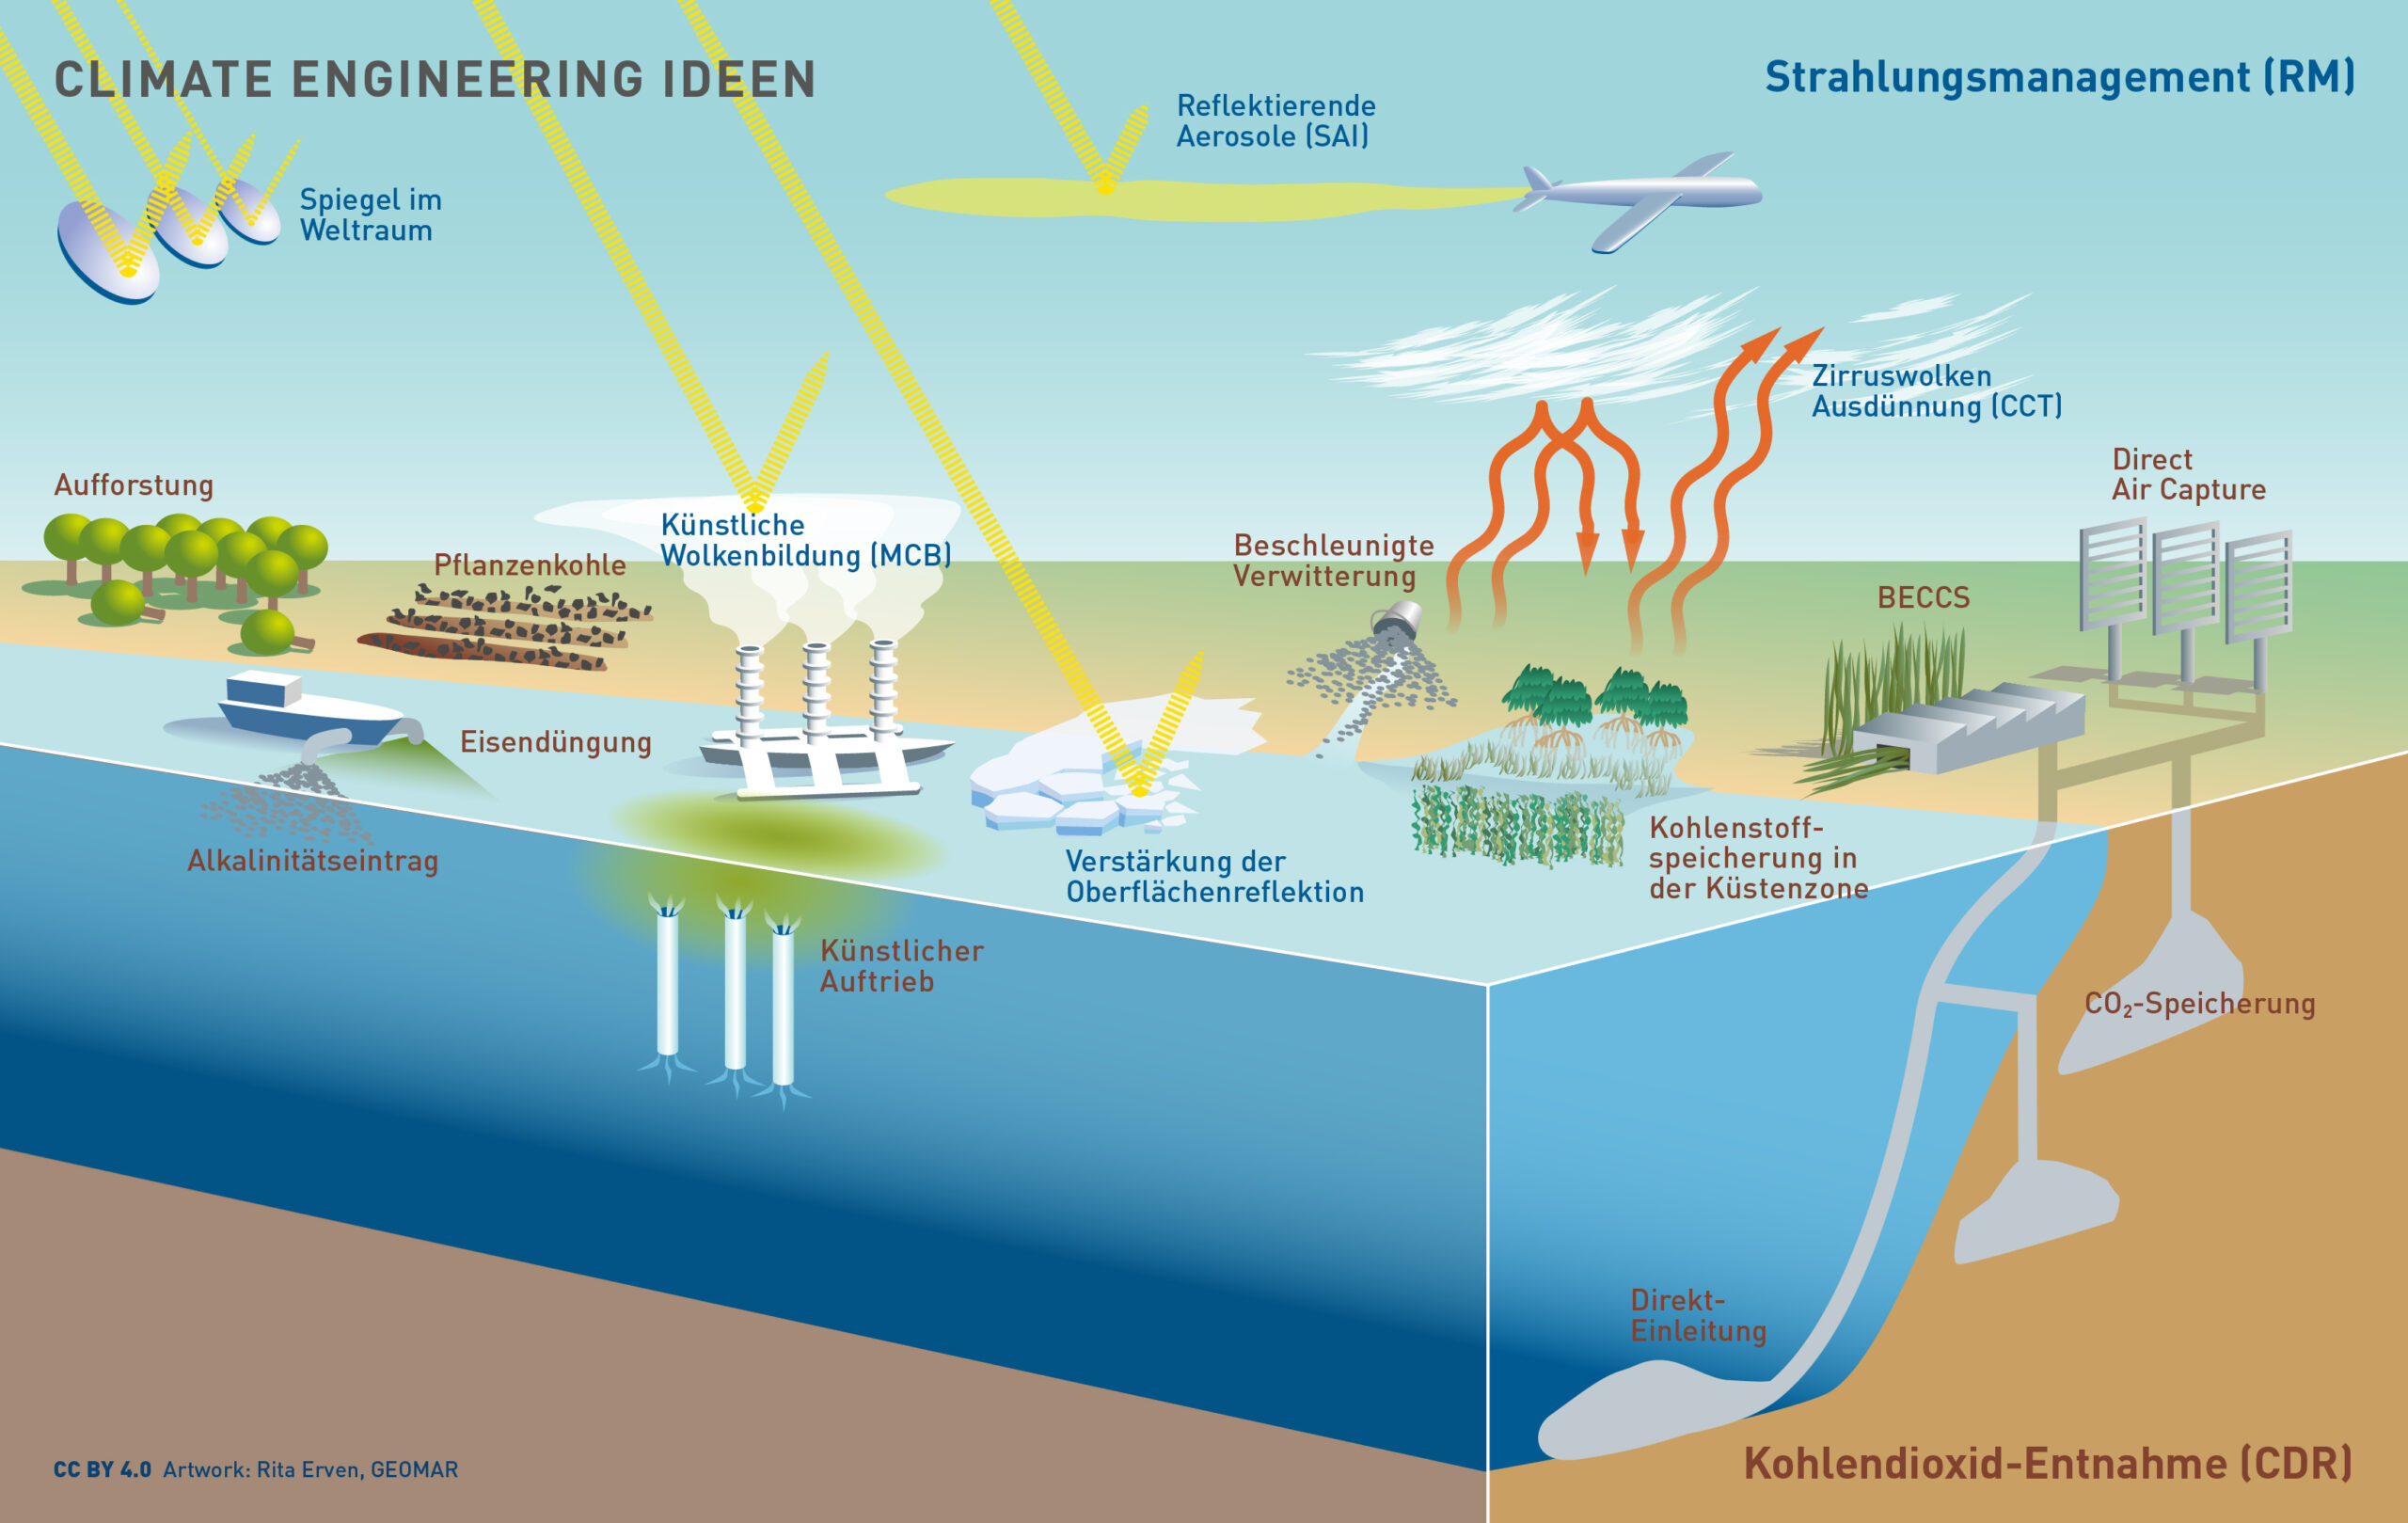
| 21:11, 20. Dez. 2022 | CE CDR und RM.jpg (Datei) |  |
422 KB | == Beschreibung == Strahlungsmanagement und Kohlendioxid-Entnahme == Lizenzhinweis == {| style="border:1px solid #8888aa; background-color:#f7f8ff;padding:5px;font-size:95%;" |Quelle: Carbone Dioxide Removal: Media und Informationen https://carbondioxide-removal.eu/materialien/ Lizenz: [http://creativecommons.org/licenses/by/4.0/ CC BY 4.0] |} | 1 |
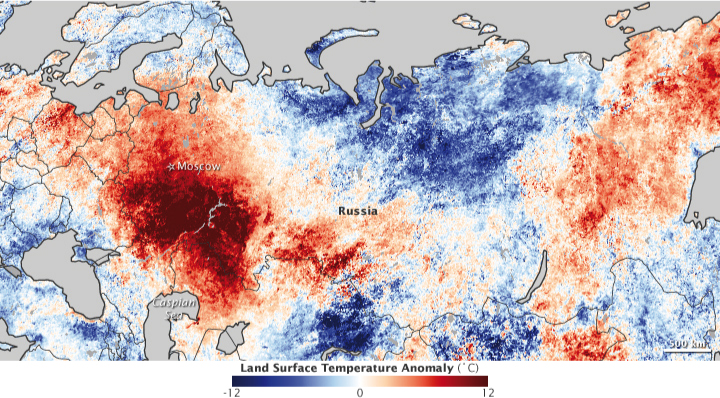
| 21:36, 22. Sep. 2011 | Russia temp2010.jpg (Datei) |  |
422 KB | Temperaturabweichung 20.-27. Juli 2010 im Vergleich zum selben Zeitraum 2000-2008 ==Lizenzhinweis== {| style="border:1px solid #8888aa; background-color:#f7f8ff;padding:5px;font-size:95%;" | Quelle: NASA: [http://earthobservatory.nasa.gov/IOTD/view.php?id | 2 |