Nicht kategorisierte Dateien
Aus Klimawandel
Unten werden bis zu 500 Ergebnisse im Bereich 1.001 bis 1.500 angezeigt.
-
 GermanyCO2 emissions Jan-Aug 2020.jpg 1.075 × 760; 65 KB
-
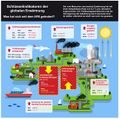
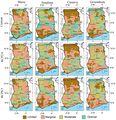 Ghana Anbau klimawandel.jpg 2.113 × 2.185; 1,4 MB
-
 Glacier MB regions 1950-2021.jpg 613 × 460; 120 KB
-
 Glacier Mass Balance Map.png 650 × 477; 108 KB
-
 Glacier elevation Himalaya.jpg 909 × 476; 118 KB
-
 Glacier length global.jpg 559 × 709; 79 KB
-
 Glacier melt runoff.jpg 886 × 386; 36 KB
-
 Glacier national park MT 19June2010.JPG 1.280 × 960; 444 KB
-
 Glaciers-mass-balance-rate.jpg 822 × 736; 220 KB
-
 Glaciers Central Asia 1960-2020.jpg 1.086 × 750; 73 KB
-
 Glaciers mass change1960-2019.jpg 790 × 309; 34 KB
-
 Gletscher-Spitzbergen.jpg 800 × 600; 138 KB
-
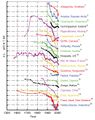
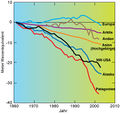
 Gletscher Anden.jpg 751 × 910; 74 KB
-
 Gletscher Himalaya Übersicht.jpg 791 × 378; 59 KB
-
 Gletscher pastoruri peru.jpg 4.608 × 3.456; 3,31 MB
-
 Gletscher weltweit.jpg 806 × 505; 190 KB
-
 Gletscherentwicklung Norwegen.jpg 681 × 368; 96 KB
-
 Gletscherfront Sermilik Icefjord.jpg 1.200 × 800; 977 KB
-
 Gletschergebiete.jpg 401 × 381; 78 KB
-
 Gletschergebiete N-Amerika.jpg 672 × 497; 236 KB
-
 Gletscherrueckzug PNN ElCocuy.JPG 920 × 1.227; 273 KB
-
 Gletscherschwund tropische Anden.jpg 697 × 436; 116 KB
-
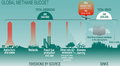 Global-Methane-Budget.png 1.240 × 678; 126 KB
-
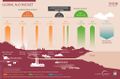 Global-N2O-budget2007-16.jpg 1.024 × 670; 154 KB
-
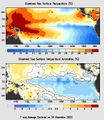
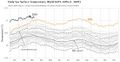 Global-SST-1981-2024.jpg 1.098 × 567; 119 KB
-
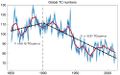 Global-TC-numbers.jpg 1.000 × 623; 83 KB
-
 Global-mangrove-area.jpg 979 × 590; 172 KB
-
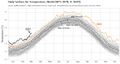 Global-temp-1940-2024.jpg 1.095 × 588; 98 KB
-
 Global-temp-decades.jpg 726 × 555; 45 KB
-
 GlobalAverage temp 1850-2018.png 1.596 × 907; 264 KB
-
 GlobalCO2 emissions2019 June2020.jpg 1.040 × 541; 38 KB
-
 GlobalCO2 emissions2019 June2020a.jpg 636 × 471; 66 KB
-
 GlobalCO2 emissions Jan-Aug 2020.jpg 1.075 × 760; 67 KB
-
 GlobalCO2 emissions sectors June2020.jpg 786 × 440; 122 KB
-
 Global 9sep uspacific coast lrg.jpg 4.098 × 2.305; 1,43 MB
-
 Global 9sep uspacific coast lrg .jpg 4.098 × 2.305; 1,07 MB
-
 Global Bevölkerung Hochwasser 2100.jpg 755 × 485; 123 KB
-
 Global RI TC tracks 2000-2020.jpg 1.075 × 308; 92 KB
-
 Global SO2 emissions regions.jpg 760 × 514; 50 KB
-
 Global THG emissions.jpg 932 × 573; 36 KB
-
 Global Warming Index2019.jpg 920 × 656; 94 KB
-
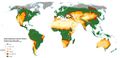
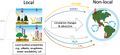
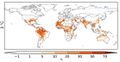
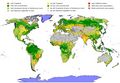
 Global agricultural frontiers climate change.PNG 1.750 × 851; 938 KB
-
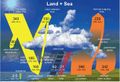
 Global annual water balance.jpg 931 × 336; 46 KB
-
 Global beaches.jpg 1.365 × 527; 109 KB
-
 Global burned area2003-2015.jpg 687 × 354; 29 KB
-
 Global burned area trend.png 1.920 × 1.080; 685 KB
-
 Global burned area trend2001-2016.jpg 674 × 388; 42 KB
-
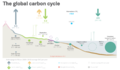 Global carbon cycle.png 2.621 × 1.536; 716 KB
-
 Global circulation clouds.jpg 1.440 × 736; 272 KB
-
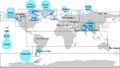
 Global deltas population.jpg 730 × 287; 73 KB
-
 Global drought exposure.jpg 1.200 × 659; 107 KB
-
 Global drought hazards.jpg 1.200 × 654; 122 KB
-
 Global drought risk.jpg 1.200 × 680; 124 KB
-
 Global drought vulnerability.jpg 1.200 × 675; 107 KB
-
 Global drylands.jpg 978 × 578; 62 KB
-
 Global drylands subtypes.jpg 1.024 × 496; 237 KB
-
 Global energy balance.jpg 609 × 417; 57 KB
-
 Global fires 30.4.-9.5.2016.jpg 840 × 420; 53 KB
-
 Global floods droughts future.jpg 720 × 619; 90 KB
-
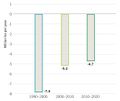 Global forest area change1990-2020.jpg 610 × 514; 19 KB
-
 Global forest area climate domain.jpg 874 × 372; 41 KB
-
 Global forest climate-domain.jpg 807 × 555; 58 KB
-
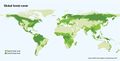 Global forest cover.jpg 800 × 406; 38 KB
-
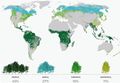
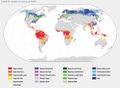 Global forests ecological zones.jpg 1.141 × 833; 92 KB
-
 Global glacier decline1553-2010.jpg 765 × 494; 58 KB
-
 Global glaciers 1900-2010.jpg 748 × 214; 33 KB
-
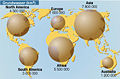
 Global glaciers distribution.jpeg 1.400 × 792; 447 KB
-
 Global glaciers mass-change-2000-2019.jpg 1.512 × 857; 418 KB
-
 Global glaciers mass-change-2050-2022.jpg 613 × 460; 43 KB
-
 Global glaciers thickness1960-2003.gif 685 × 448; 20 KB
-
 Global mangroves areas.jpg 1.166 × 331; 41 KB
-
 Global mangroves distribution.jpg 1.344 × 731; 107 KB
-
 Global map of NET.jpg 1.928 × 1.164; 1,25 MB
-
 Global map temp 2016.jpg 815 × 585; 85 KB
-
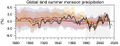 Global monsun prec 1880-2020.jpg 1.058 × 408; 61 KB
-
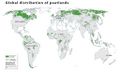 Global peatlands.jpg 1.024 × 612; 111 KB
-
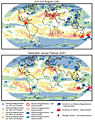
 Global prec anomalies 2017.gif 1.052 × 743; 123 KB
-
 Global temp1979-2018 Copernicus.jpg 693 × 524; 52 KB
-
 Global temp 1850-2017.jpg 840 × 533; 36 KB
-
 Global temp 1880-2017.jpg 1.040 × 587; 86 KB
-
 Global temp 1880-2018.png 735 × 450; 36 KB
-
 Global temp 1880 2017.jpg 731 × 419; 44 KB
-
 Global temp 2101.jpg 540 × 525; 32 KB
-
 Global temp ENSO.jpg 957 × 560; 43 KB
-
 Global temp stratosphere1979-2017.png 750 × 450; 55 KB
-
 Global tree cover1992-2015.png 1.845 × 788; 37 KB
-
 Global warming EUcountries.jpg 615 × 482; 162 KB
-
 Global warming attribution.png 780 × 1.024; 178 KB
-
 Global warming countries2.jpg 1.021 × 444; 49 KB
-
 Global winds sm.jpg 640 × 320; 41 KB
-
 Globale Aerosole.jpeg 1.041 × 521; 112 KB
-
 Globale Trockengebiete1961-1990.jpg 799 × 409; 50 KB
-
 Globale hydrologie2100.jpg 556 × 704; 132 KB
-
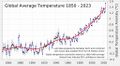 Globale temp1850-2023.jpg 1.024 × 564; 92 KB
-
 Globale temp1890-2016.jpg 584 × 385; 35 KB
-
 Globale zirkulation.jpg 494 × 425; 95 KB
-
 Globales Förderband.jpg 540 × 354; 49 KB
-
 Globaltreecover10pct 2000 2009.jpg 720 × 480; 115 KB
-
 Goldkroete.jpg 800 × 534; 76 KB
-
 Golf-region-monthly-rain.jpg 809 × 376; 126 KB
-
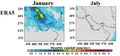
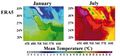 Golf-region-monthly-temp.jpg 801 × 375; 154 KB
-
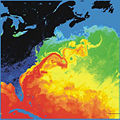 Golfstrom.jpg 363 × 363; 53 KB
-
 Gongga Mountains glacier-area temp1960-2009.jpg 742 × 474; 54 KB
-
 Gorgia streamflow dry wet.gif 624 × 284; 21 KB
-
 Gornergletscher2100.jpg 623 × 438; 245 KB
-
 Grace satellites.jpg 800 × 540; 76 KB
-
 Grass ecosystems anthropocene.jpg 581 × 764; 74 KB
-
 Grass ecosystems global.jpg 1.229 × 622; 135 KB
-
 Grasslands GHG fluxes.jpg 1.200 × 478; 89 KB
-
 Grasslands drivers of change.jpg 1.226 × 703; 133 KB
-
 GreatBarrier bleaching 2017.png 513 × 643; 119 KB
-
 Green roof Manhattan.jpg 800 × 600; 243 KB
-
 Greenhouse-effect.png 1.024 × 621; 315 KB
-
 Greening Sahel 1982-1999.jpg 949 × 365; 64 KB
-
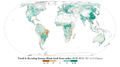
 Greening causes.jpg 2.051 × 754; 186 KB
-
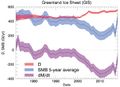
 Greenland MB 1995-2015.jpg 645 × 555; 27 KB
-
 Greenland Melt area12.7.2012.jpg 350 × 680; 94 KB
-
 Greenland SLR 2100.jpg 725 × 472; 102 KB
-
 Greenland SMB D 1972-2018.jpg 726 × 529; 138 KB
-
 Greenland SMB components.jpg 790 × 395; 73 KB
-
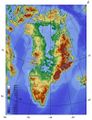 Greenland bedrock.jpg 802 × 1.042; 267 KB
-
 Greenland fire 3.8.2017.jpg 720 × 480; 116 KB
-
 Greenland ice-sheet.jpg 978 × 899; 138 KB
-
 Greenland ice sheet SL2100.jpg 444 × 643; 78 KB
-
 Greenland ocean temp2100.jpg 656 × 529; 184 KB
-
 Greenland speed mass.jpg 577 × 517; 244 KB
-
 Greenland temp 2100.jpg 659 × 524; 235 KB
-
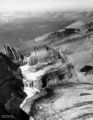 Grinnell Glacier 1938.jpg 1.140 × 1.475; 322 KB
-
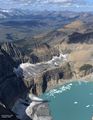 Grinnell Glacier 2019.jpg 1.140 × 1.475; 301 KB
-
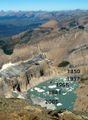 Grinnell glacier1850 1937 1968 1981 2005.jpg 800 × 1.088; 158 KB
-
 Grinnell glacier 1981.jpg 1.262 × 1.800; 1,28 MB
-
 Groenland.gif 221 × 393; 36 KB
-
 Groenland3000-5000.jpg 428 × 341; 92 KB
-
 Groenland Eem.jpg 341 × 439; 93 KB
-
 Grosser Aletschgletscher 3196.jpg 480 × 360; 70 KB
-
 Grosswetterlage Hochwasser Europa2013.png 622 × 400; 61 KB
-
 Große-Grüne-Mauer.jpg 837 × 490; 186 KB
-
 Grundwasser global.jpg 459 × 303; 115 KB
-
 Grus grus flocks.jpg 650 × 738; 151 KB
-
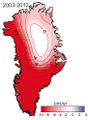 Grönland Oberflächenänderung2003-2012.jpg 363 × 496; 105 KB
-
 Grönland WAIS sea level.jpg 647 × 400; 33 KB
-
 H-NO-Pazifik2013-14.jpg 604 × 501; 61 KB
-
 HCMC-SLR-2m.jpg 830 × 782; 986 KB
-
 HCMC subsidence rate2016-2019.jpg 1.400 × 1.398; 356 KB
-
 HH 1881-2020 climate stripes.jpg 1.006 × 285; 46 KB
-
 HH Sommer- Frosttage 1951-2020.jpg 548 × 538; 44 KB
-
 HH Wind Jahresmittel.jpg 517 × 589; 42 KB
-
 HH Wärmeinsel nachts.jpg 565 × 446; 49 KB
-
 HH prec.jpg 387 × 248; 56 KB
-
 HH temp1901-2007.jpg 405 × 234; 61 KB
-
 HH temp 1881-2015.jpg 857 × 564; 57 KB
-
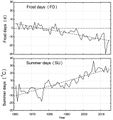 HKH frost-summer-days 1961-2014.jpg 633 × 672; 128 KB
-
 HKH kalteNächte1961-2014.jpg 834 × 491; 50 KB
-
 HKH people.jpg 834 × 514; 54 KB
-
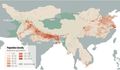 HKH population density.jpg 933 × 542; 55 KB
-
 HKH prec 1901-2014.jpg 688 × 443; 100 KB
-
 HKH runoff snow ice.jpg 883 × 736; 133 KB
-
 HKH temp 1900-2014.jpg 785 × 428; 47 KB
-
 HKH temp 1901-2014.jpg 697 × 397; 38 KB
-
 HKH temp max-min1900-2014.jpg 778 × 420; 54 KB
-
 HKH temp max-min1901-2014.jpg 682 × 394; 40 KB
-
 HKH warmeNächte1961-2014.jpg 830 × 480; 49 KB
-
 HPS-12-Gletscher 1985-2017.jpg 456 × 569; 206 KB
-
 Hadley-Zelle.jpg 757 × 312; 46 KB
-
 Hail Hagel.jpg 120 × 77; 6 KB
-
 Haiyan8.11.2013 NASA.jpg 640 × 714; 116 KB
-
 Haiyan 7.11.2013.jpg 720 × 540; 115 KB
-
 Half-moons Burkina Faso.jpg 357 × 488; 23 KB
-
 Hamburg-Barcelona.jpg 563 × 298; 25 KB
-
 Hamburg-Wien Sommertemp.jpg 591 × 319; 28 KB
-
 Hamburg temp 1760-2020.jpg 881 × 471; 78 KB
-
 Hardangerjökulen.jpg 666 × 372; 64 KB
-
 Hardangervidda 1986.jpg 800 × 553; 148 KB
-
 Harvey SST Aug.jpg 519 × 388; 36 KB
-
 Harvey rain august2017sm.jpg 840 × 1.079; 139 KB
-
 Haushalte anzahl.jpg 460 × 259; 30 KB
-
 Haweswater Reservoir.jpg 640 × 480; 66 KB
-
 Heat-water-stress global wheatproduction.jpg 686 × 301; 38 KB
-
 Heat-waves2071-2100global.jpg 571 × 247; 32 KB
-
 Heat content700m2000myr.png 566 × 380; 27 KB
-
 Heat extremes sigma1950-2020.jpg 703 × 558; 42 KB
-
 Heat mortality Paris London.jpg 1.272 × 909; 92 KB
-
 Heat wave China June2023.jpg 824 × 611; 55 KB
-
 Heatstress west africa.jpg 2.128 × 2.134; 1,08 MB
-
 Heatwave April 2023 W-Mediterranean.jpg 838 × 514; 44 KB
-
 Heatwave N europe.jpg 540 × 451; 209 KB
-
 Heatwave exposure.png 2.590 × 1.794; 1,38 MB
-
 Heatwave precip africa.jpg 2.128 × 1.277; 703 KB
-
 Heisse Tage in Heisse Tage DiffII Ost-Suedostas.png 1.024 × 688; 99 KB
-
 Heisse Tage in Heisse Tage ND A1B diff Jahr Berlin.png 1.024 × 688; 54 KB
-
 Heiße Tage.jpg 1.280 × 604; 97 KB
-
 Heiße Tage Einkommen.jpg 463 × 451; 31 KB
-
 Heiße tage Nächte Einkommen.jpg 716 × 344; 41 KB
-
 Hemispheric temp 1880-2022.png 1.130 × 600; 117 KB
-
 Hessen temp1901-2007.jpg 684 × 329; 112 KB
-
 Heterogene Klimarekonstruktion NH.png 263 × 516; 30 KB
-
 HeterogenesKlima 800-2000.png 700 × 330; 99 KB
-
 High-Mountain-Asia atmospheric circulation.jpg 787 × 554; 102 KB
-
 High-Mountain-Asia glacier elevation.jpg 906 × 806; 182 KB
-
 Highest temp 1966-2015.jpg 776 × 482; 44 KB
-
 Highest temp 1986-2015.jpg 757 × 481; 250 KB
-
 Highest temp megacities1966-2015.jpg 518 × 675; 73 KB
-
 Himalaya Gletscher.jpg 798 × 489; 301 KB
-
 Himalaya Karakorum glacier-volume.jpg 789 × 425; 42 KB
-
 Himmelmoor2.jpg 1.200 × 900; 251 KB
-
 Hindcasts CMIP5-6.jpg 988 × 560; 43 KB
-
 Hindu Kush Himalaya region.jpg 939 × 696; 164 KB
-
 Hindu Kush Himalaya river basins.jpg 1.122 × 658; 135 KB
-
 Hindu Kush Himalaya rivers sm.jpg 920 × 599; 131 KB
-
 Hindukusch-Himalaya Niederschlag2100 RCP8.5.jpg 565 × 368; 31 KB
-
 Hindukush-Himalaya floods.jpg 580 × 601; 209 KB
-
 Hindukush-Himalaya floods1980s 2001-2013.jpg 640 × 795; 80 KB
-
 Hindukush Himalaya region.jpg 840 × 711; 136 KB
-
 Hintereisferner 2.8.2011.jpg 640 × 480; 38 KB
-
 Hintereisferner 9.9.2006.jpg 640 × 480; 73 KB
-
 Hirte Mauretanien2012.jpg 640 × 427; 39 KB
-
 Hist-ESL-Europe-E-Asia.jpg 977 × 415; 244 KB
-
 Hist global extreme SL.jpg 1.226 × 660; 102 KB
-
 Historical C emissions source.png 1.852 × 1.042; 88 KB
-
 Historical anthropogenic carbon emissions.jpg 676 × 582; 38 KB
-
 Hitze Kälte Städte.jpg 688 × 393; 102 KB
-
 Hitze Mortalität 2003 BW.jpg 827 × 493; 33 KB
-
 Hitzebedingte Todesfälle.jpg 509 × 192; 20 KB
-
 Hitzestress Pflanzenanpassung.jpg 778 × 484; 194 KB
-
 Hitzetage Australien.jpg 720 × 524; 49 KB
-
 Hitzewelle2003 EU.jpg 549 × 420; 187 KB
-
 Hitzewelle Europa2015 SST.jpg 780 × 480; 302 KB
-
 Hitzewellen Verbreitung.jpg 604 × 436; 128 KB
-
 Hitzewellentage-2-4°C.jpg 1.118 × 396; 141 KB
-
 Hitzewellentage2050-GHG-Aero.jpg 843 × 264; 115 KB
-
 Hochgebirge Zentralasien.jpg 689 × 413; 54 KB
-
 Hochgebirge dt.jpg 794 × 614; 472 KB
-
 Hochgebirge global prec1900-2013.jpg 943 × 616; 93 KB
-
 Hochgebirge global temp1900-2013.jpg 961 × 624; 91 KB
-
 Hochwasser-Pisek 2002.jpg 800 × 600; 108 KB
-
 Hochwasser China 2003.jpg 720 × 576; 78 KB
-
 Hochwasser Elbe 2013-Havelberg.jpg 500 × 333; 33 KB
-
 Hochwasser Felder Mosambik.jpg 720 × 480; 108 KB
-
 Hochwasser Kontinente 2100.jpg 752 × 265; 24 KB
-
 Hochwasser USA 2100.jpg 615 × 456; 143 KB
-
 Hochwasser Zyklon Idai2019.jpg 640 × 360; 96 KB
-
 Hochwasser global Schäden2100.jpg 766 × 480; 130 KB
-
 Hochwasser unterer Indus 2010.jpg 661 × 663; 76 KB
-
 Hochwasser wetterlagen Europa.jpg 747 × 534; 95 KB
-
 Hochwasserjährlichkeit-Europa.jpg 591 × 311; 77 KB
-
 Hochwasserrisiko Kontinente.jpg 544 × 663; 71 KB
-
 Hoehenmigration.jpg 524 × 411; 66 KB
-
 Hohenpeissenberg-ozon.gif 636 × 430; 70 KB
-
Holzige Biomasse Plantage.jpg Datei fehlt
-
 Hong Kong living1.JPG 800 × 600; 153 KB
-
 Hong Kong living2.JPG 800 × 598; 184 KB
-
 Hot-days-1950-2018.jpg 1.004 × 626; 274 KB
-
 Hot days index per time period in Heisse Tage ND A1B diff Sommer.png 1.024 × 688; 104 KB
-
 Hotday in Heißetage Nordamerika rcp85 diff.png 1.024 × 688; 158 KB
-

-
 Huayna potosi.JPG 3.456 × 2.592; 267 KB
-
 Huglin-Index Weinsorten.jpg 617 × 231; 87 KB
-
 Huglin 5regionen.jpg 783 × 514; 187 KB
-
 Humans effect miroorganisms.jpg 1.200 × 972; 190 KB
-
 Humboldt Current.jpg 573 × 531; 85 KB
-
 Huricane indices.jpg 713 × 546; 149 KB
-
 Hurr4-5 heute proj.jpg 621 × 267; 70 KB
-
 Hurr Atl 1878-2006.jpg 624 × 324; 99 KB
-
 Hurricane-Harvey-rainfall.png 620 × 478; 48 KB
-
 Hurricane Harvey25.8.17.png 620 × 413; 402 KB
-
 Hurricane Harvey floods.jpg 620 × 413; 35 KB
-
 Hurricane Iota 16.Nov.2020.jpg 898 × 612; 168 KB
-
 Hurricane Iota 16.Nov2020.jpg 720 × 480; 130 KB
-
 Hurricane Iota Nov.2020.jpg 897 × 738; 97 KB
-
 Hurricane Ophelia Ireland.jpg 620 × 414; 64 KB
-
 Hurricane Patricia sm.jpg 998 × 996; 155 KB
-
 Hurricane tracks september.jpg 450 × 227; 21 KB
-
 Hurricanes1967-2018.jpg 960 × 684; 193 KB
-
 Hurricanes2005 tracking.jpg 1.040 × 804; 202 KB
-
 Hurricanes2015 tracking.jpg 1.040 × 804; 163 KB
-
 Hurricanes2017 Katia Irma Jose.jpg 800 × 554; 118 KB
-
 Hurricanes2017 tracking.jpg 1.040 × 804; 182 KB
-
 Hurricanes2020 tracking.jpg 1.040 × 804; 193 KB
-
 Hurricanes Eta Iota2020.jpg 720 × 545; 65 KB
-
 Hurricanes Storms1950-2019.jpg 641 × 350; 94 KB
-
 Hurricanes tropical-storms.jpg 831 × 546; 55 KB
-
 Hurrikan-intensitaet.gif 438 × 282; 17 KB
-
 Hurrikan-kategorien.gif 393 × 278; 16 KB
-
 Hurrikan-sst.gif 436 × 385; 15 KB
-
 Hurrikan aufbau.gif 630 × 474; 83 KB
-
 Hurrikan zugbahnen.gif 672 × 341; 26 KB
-
 Hurrikane gegenwärtig zukünftig.jpg 640 × 609; 65 KB
-
 Hydrologic cycle NASA.jpg 490 × 388; 40 KB
-
 HöhenverschiebungVegetationsstufenSchweiz.gif 798 × 523; 15 KB
-
 ICON modell.jpg 351 × 347; 29 KB
-
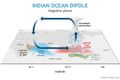 IOD negative.jpg 1.024 × 682; 59 KB
-
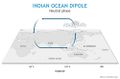 IOD neutral.jpg 995 × 654; 36 KB
-
 IOD positive.jpg 1.024 × 682; 58 KB
-
 IPCC AR1 projection1970-2020.jpg 840 × 370; 29 KB
-
 IPCC AR5 WGI cover.jpg 300 × 406; 251 KB
-
 IPCC Berichte2007.jpg 337 × 380; 111 KB
-
 IPCC SLRglobal RCP4.5-8.5.jpg 554 × 681; 390 KB
-
 IPCC SRES CO2 emissions.jpg 718 × 419; 39 KB
-
 IPCC szenarien.jpg 550 × 474; 116 KB
-
 IS92 concentrations Scenarios.jpg 470 × 402; 26 KB
-
 IS92 emissions Scenarios.jpg 481 × 398; 26 KB
-
 IS92 forcing scenarios.jpg 433 × 433; 18 KB
-
 IS92 scenarios temperature.jpg 648 × 587; 37 KB
-
 ITC.jpg 429 × 167; 26 KB
-
 Iberia NAO prec.jpg 631 × 271; 122 KB
-
 Iberien prec proj2100.jpg 480 × 395; 111 KB
-
 Ice-lost Greenland 2100.jpg 448 × 646; 77 KB
-
 Ice age Sept 2018.png 480 × 542; 137 KB
-
 Ice area Kilimanjaro1912-2018.jpg 428 × 600; 60 KB
-
 Ice shelf sheet ocean.jpg 719 × 453; 37 KB
-
 Iceberg Jakobshavn Isbrae.jpg 1.024 × 682; 82 KB
-
 Iceland Eyjafjallajökull glacier.jpg 628 × 529; 86 KB
-
 Iceland Okjökull1986 2019.jpg 927 × 349; 96 KB
-
 Iceland glacier magma.jpg 742 × 423; 18 KB
-
 Iceland precipitation.jpg 762 × 502; 85 KB
-
 Iceland volcanic zones.jpg 762 × 503; 41 KB
-
 IndiaCO2 emissions2019 June2020.jpg 639 × 470; 90 KB
-
 IndiaCO2 emissions Jan-Aug 2020.jpg 1.075 × 760; 54 KB
-
 India 78 40398E 20 74980N.jpg 800 × 599; 92 KB
-
 India dry soil.jpg 1.024 × 683; 237 KB
-
 India irrigation.jpg 799 × 601; 146 KB
-
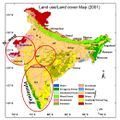 India land-use 2001.jpg 1.040 × 1.040; 148 KB
-
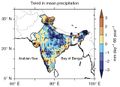 India prec 1950-2015.jpg 640 × 463; 128 KB
-
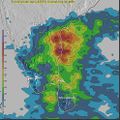 India rain 9-16 nov 2015.jpg 985 × 985; 231 KB
-
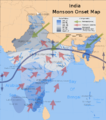 India summer monsoon onset.png 680 × 768; 248 KB
-
 Indian-Ocean-RCP2.6.jpg 785 × 397; 228 KB
-
 Indian Haze NASA.jpg 720 × 480; 314 KB
-
 Indian Monsoon prec 1985-2015.png 2.067 × 1.555; 178 KB
-
 Indian Monsoon rain 1860-2090.png 2.067 × 1.400; 338 KB
-
 Indian Ocean SST 1901-2010.jpg 771 × 454; 55 KB
-
 Indian Ocean SST 1950-2015.jpg 740 × 439; 217 KB
-
 Indien.jpg 480 × 288; 45 KB
-
 Indien Sommertemp 1960-2009.jpg 828 × 248; 29 KB
-
 Indien ns 1960-2006.jpg 608 × 346; 89 KB
-
 Indien reisernte.jpg 787 × 292; 133 KB
-
 Indien temp-mini 2000.jpg 586 × 334; 103 KB
-
 Indien temp 1901-2007.jpg 585 × 323; 98 KB
-
 Indien wet-bulb-Max 2016.jpg 620 × 532; 50 KB
-
 Indien wet-bulb-trend 1979-2015.jpg 620 × 508; 50 KB
-
 Indischer Monsun NS Wind.gif 341 × 747; 34 KB
-
 Indus-Becken Anbaufläche.jpg 594 × 582; 255 KB
-
 Indus-Becken Geographie.jpg 615 × 703; 93 KB
-
 Indus-Becken Jahresniederschlag.jpg 585 × 556; 250 KB
-
 Indus-Becken Klimazonen.jpg 628 × 534; 270 KB
-
 Indus-Becken Trockenheitsindex.jpg 578 × 582; 250 KB
-
 Indus-Becken Verdunstung.jpg 579 × 569; 211 KB
-
 Indus Ganges Brahmaputra.jpg 897 × 652; 133 KB
-
 Indus Hochwasser 2010.jpg 691 × 576; 217 KB
-
 Indus flood2010.jpg 461 × 577; 121 KB
-
 Indus river basin.jpg 840 × 711; 81 KB
-
 IndustrielleRevolution.jpg 819 × 444; 57 KB
-
 IntertropicalConvergenceZone-EO.jpg 480 × 216; 56 KB
-
 Inversion.png 1.169 × 826; 39 KB
-
 Irma rainfall5.-12.9.2017.png 720 × 545; 494 KB
-
 Island Gletscher.jpg 800 × 551; 226 KB
-
 Isobaren bei Orkan.jpg 480 × 317; 58 KB
-
 Italien temp prec1800.jpg 660 × 202; 62 KB
-
 Italy drought heat 1951-2012.jpg 840 × 604; 79 KB
-
 Italy dry soil.jpg 1.024 × 681; 330 KB
-
 Italy temp 10.7.2023.jpg 700 × 700; 114 KB
-
 Ixodes ricinus.jpg 1.000 × 600; 283 KB
-
 Jackson Glacier 1941.jpg 1.500 × 971; 213 KB
-
 Jacobshavn-calving.jpg 649 × 377; 56 KB
-
 Jahres Niederschlag Nordamerika rcp85 d.png 1.024 × 688; 134 KB
-
 Jahresgang-ozon.gif 385 × 300; 15 KB
-
 Jahresgang Bodenfeuchte-VerbrannteFläche.png 1.048 × 791; 80 KB
-
 Jahresniederschlag DiffII West-Suedasi.png 1.024 × 688; 173 KB
-
 Jahreszeitliche klimatische Schwankungen.jpg 512 × 384; 45 KB
-
 Jahrhundertfluten USA 2090.jpg 608 × 497; 353 KB
-
 Jakarta-flooding-SLR-subsidence.jpg 701 × 347; 131 KB
-
 Jakarta-subsidence-flooding-2007.jpg 947 × 489; 327 KB
-
 Jakarta floods.jpg 1.600 × 1.200; 406 KB
-
 Jakarta settlement conditions.jpg 1.068 × 404; 90 KB
-
 Jakobshavn.gif 575 × 416; 86 KB
-
 Jakobshavn retreat NASA.jpg 840 × 630; 82 KB
-
 Jamuna cross-section.jpg 840 × 403; 58 KB
-
 Jet stream pattern.jpg 624 × 457; 87 KB
-
 Jet zonal meridional.jpg 550 × 414; 140 KB
-
 Jetstream.jpg 1.024 × 711; 335 KB
-
 Jetstream Meander.jpg 457 × 444; 25 KB
-
 Jetstream Profil.jpg 600 × 240; 39 KB
-
 Jetstreamconfig.jpg 336 × 193; 29 KB
-
 Jones et. al. - Lufttemperatur.jpg 529 × 384; 30 KB
-
 Jorgemontt glacier.jpg 720 × 720; 270 KB
-
 Juister-strand.jpg 517 × 292; 129 KB
-
 Juni2019 eu global Copernicus.jpg 840 × 659; 60 KB
-
 K-G-Klimazonen-2071-2100.jpg 1.157 × 551; 310 KB
-
 K-G-Klimazonen-Gegenwart.jpg 1.062 × 565; 385 KB
-
 K-G Klimazonen 1984-2013.jpg 887 × 441; 56 KB
-
 K-G Klimazonen Kontinente 2071-2100.jpg 828 × 595; 42 KB
-
 Kailash landscape.jpg 840 × 739; 142 KB
-
 Kalifornien2003 Santa Anna.jpg 540 × 540; 71 KB
-
 Kalifornien Annheim Lake Dürre2015.jpg 788 × 479; 100 KB
-
 Kalifornien Dürre2013 14.jpg 342 × 361; 116 KB
-
 Kalifornien Luftdruck 2050hPa.jpg 697 × 227; 32 KB
-
 Kalte warme Extreme1951-2010.jpg 677 × 417; 139 KB
-
 Kaltfront.gif 1.169 × 826; 14 KB
-
 Kaltfront.jpg 480 × 279; 48 KB
-
 Kaltfront2.jpg 800 × 536; 37 KB
-
 Kamchatka glacier change2000-2014.jpg 551 × 789; 66 KB
-
 Kanada Brandfläche Feuergröße.jpg 788 × 461; 121 KB
-
 Kanada temp 2000.jpg 464 × 302; 64 KB
-
 Karbonatsystem Meerwasser de.png 540 × 334; 41 KB
-
 Kaskawulsh-glacier 03 08 15.jpg 590 × 331; 108 KB
-
 Kaskawulsh-glacier 03 08 15and04 07 16.jpg 590 × 668; 220 KB
-
 Kaskawulsh-glacier 04 07 16.jpg 591 × 329; 112 KB
-
 Kastanie miniermotte.jpg 387 × 341; 152 KB
-
 Kat4-5-TCs present.jpg 806 × 259; 178 KB
-
 Kate 2003.jpg 1.024 × 768; 356 KB
-
 Katrina-new-orleans-flooding-2005.jpg 800 × 600; 143 KB
-
 Katrina 29.8.05.jpg 1.040 × 780; 168 KB
-
 Katrina SST 27.8.2005.jpg 720 × 576; 448 KB
-
 Kazbegi-Jimara glacier change.jpg 922 × 536; 153 KB
-
 Kemeri Bog Letland pine trees.jpg 800 × 530; 104 KB
-
 Kenntage.jpg 356 × 95; 30 KB
-
 Kenntage ND Diagramm.png 1.280 × 720; 36 KB
-
 Kennzahlen Berlin.jpg 959 × 473; 54 KB
-
 Key-indicators-cc dt.jpg 1.241 × 1.234; 862 KB
-
 Kilimandscharo 1912-2011.jpg 607 × 511; 84 KB
-
 Kilimandscharo Eisflächen1912-1975-2012.jpg 742 × 196; 99 KB
-
 KilimanjaroNIF2006.jpg 717 × 477; 243 KB
-
 Kilimanjaro NIF.jpg 720 × 159; 34 KB
-
 Kilimanjaro NIF 2012.jpg 738 × 403; 274 KB
-
 Kilimanjaro Okt 2012.jpg 720 × 480; 125 KB
-
 Kilimanjaro glaciers 1993.jpg 720 × 540; 174 KB
-
 Kilimanjaro glaciers 2000.jpg 720 × 540; 179 KB
-
 Kilimanjaro vegetation zones.jpg 720 × 840; 192 KB
-
 Klimageschichte.jpg 734 × 312; 90 KB
-
 Klimageschichte uebersicht.jpg 762 × 442; 104 KB
-
 Klimagürtel-der-erde-gemäßigte-zone.jpg 480 × 240; 29 KB
-
 Klimagürtel-der-erde-subtropen.jpg 480 × 240; 28 KB
-
 Klimagürtel-der-erde-tropen.jpg 480 × 240; 27 KB
-
 Klimagürtel-der-erde-tundra.jpg 480 × 240; 26 KB
-
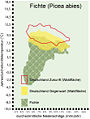 Klimahuelle fichte.jpg 441 × 585; 132 KB
-
 Klimamodell Prozesse.jpg 868 × 604; 91 KB
-
 Klimamodell Video TerraX.jpg 318 × 181; 12 KB
-
 Klimapause Land Ozean.jpg 379 × 466; 86 KB
-
 Klimaprojektionen Berlin heiße Tage.png 1.280 × 591; 244 KB
-
 Klimaprojektionen HH.jpg 614 × 303; 37 KB
-
 Klimaschwankungen Nordatlantik.jpg 655 × 293; 111 KB
-
 Klimasystem.jpg 600 × 348; 46 KB
-
 Klimasystem Antriebe.jpg 753 × 673; 65 KB
-
 Klimasystem DWD.jpg 914 × 541; 66 KB
-
 Klimavorhersagen DWD.jpg 749 × 463; 33 KB
-
 Klimawandel-Auswirkungen-2°C.png 1.920 × 1.080; 55 KB
-
 Klimawandel-Auswirkungen-bei-plus-1-5-Grad-Celsius-113967.png 1.920 × 1.080; 56 KB
-
 Klimawandel ernte 1980-2008.jpg 484 × 320; 48 KB
-
 Klinakliniglacier2000.jpg 800 × 800; 550 KB
-
 Klinakliniglacier2018.jpg 800 × 800; 585 KB
-
 Koeppen-Klimazonen.jpg 800 × 400; 165 KB
-
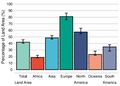
 Kohlenstoff Emission nach Regionen.png 551 × 402; 26 KB
-
 Kohlenstoffspeicher wald holz .jpg 1.696 × 1.200; 392 KB
-
 Kontinente.jpg 599 × 291; 114 KB
-
 Kontinente °C Jahrzehnt.jpg 1.071 × 602; 39 KB
-
 Konzentration CO2 aktuell.jpg 1.001 × 597; 166 KB
-
 Koppen-Geiger Map Africa.png 1.280 × 758; 244 KB
-
 Korallen ErwärmungsindexDHMI.jpg 739 × 494; 21 KB
-
 Korallen Ras Mohammed.jpg 800 × 536; 102 KB
-
 Korallenbleiche1998-2017.jpg 897 × 214; 34 KB
-
 Korallenriff Indonesien.jpg 576 × 768; 156 KB
-
 Korallenriffe.jpg 480 × 240; 101 KB
-
 Kosmische strahlung.jpg 534 × 340; 39 KB
-
 Krankheiten uebersicht.jpg 546 × 574; 241 KB
-
 Kriech-Quecke.jpg 180 × 238; 68 KB
-
 Kryosphaere aenderungen.gif 703 × 321; 33 KB
-
 Kyrill Strommast.JPG 800 × 448; 42 KB
-
 KäferSchweiz.gif 678 × 447; 17 KB
-
 Köln Rheinufer Hochwasser.jpg 589 × 599; 70 KB
-
 Küsten-Ökosysteme.jpg 1.606 × 1.606; 327 KB
-
 KüstenökosystemeWiederherstellung.jpg 429 × 725; 54 KB
-
 LGM Ice-Sheets NH.jpg 869 × 863; 92 KB
-
 LGM SST.jpg 801 × 529; 78 KB
-
 LGM Temp.jpg 812 × 538; 75 KB
-
 LGM population fire.jpg 1.040 × 487; 71 KB
-
 LOHAFEX-Region.jpg 491 × 426; 48 KB
-
 La-Nina-impacts-winter.jpg 727 × 367; 67 KB
-
 LaNina WalkerCirculation.jpg 610 × 305; 30 KB
-
 LaNina impacts winter.jpg 901 × 417; 130 KB
-
 La Nina 4.11.2020.jpg 515 × 592; 67 KB
-
 La Nina Atlantic SST 2020.jpg 740 × 458; 219 KB
-
 La Nina El Nino.jpg 685 × 725; 69 KB
-
 Lai global rcp85.png 720 × 288; 45 KB
-
 Lai historical.png 720 × 400; 179 KB
-
 Lai map rcp85.png 720 × 400; 153 KB
-
 Land-Use-Effects-on-Climate.jpg 721 × 333; 126 KB
-
 Land-area exposed drought heat.jpg 1.106 × 569; 208 KB
-
 Land-area exposed flood TC fire.jpg 1.103 × 555; 221 KB
-
 Land-cover classes FAO.jpg 2.244 × 1.550; 395 KB
-
 Land-ocean-temp2015.jpg 840 × 649; 84 KB
-
 Land-use change850-2100.jpg 929 × 285; 33 KB
-
 LandOcean temp 1850-2018.png 1.024 × 582; 380 KB
-
 Land Ocean temp1850-2020.jpg 1.024 × 577; 275 KB
-
 Land Ocean temp1850-2023.jpg 1.024 × 564; 97 KB
-
 Land Ocean temp1880-2021.png 1.130 × 700; 133 KB
-
 Land carbon sink.png 1.067 × 599; 312 KB
-
 Landanteil 1950 2002.jpg 512 × 341; 52 KB
-
 Landcover atmosphere interaction sm.jpg 962 × 360; 55 KB
-
 Landcover farbschlüssel.jpg 640 × 1.406; 301 KB
-
 Landcover global sm.jpg 840 × 420; 56 KB
-
 Landeis Tabelle.jpg 620 × 231; 41 KB


