Nicht kategorisierte Dateien
Aus Klimawandel
Nachfolgend werden bis zu 50 Ergebnisse im Bereich #951 bis #1.000 angezeigt.
-
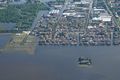 Emilia-Romagna flood May2023.jpg 1.280 × 853; 316 KB
-
 Emissionen durch Landwirtschaft nach Kontinent, 2001-2010.jpg 800 × 347; 40 KB
-
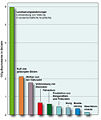 Emissionen landwirtschaft.jpg 501 × 597; 71 KB
-
 Emissionspfade.jpg 617 × 441; 131 KB
-
 Emissionsszenarien.jpg 531 × 441; 103 KB
-
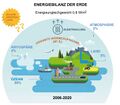 Energiebilanz-2006-2020.jpg 733 × 642; 66 KB
-
 Energiefluss.jpg 389 × 243; 36 KB
-
 Energietraeger global.jpg 722 × 419; 88 KB
-
 Energieverteilung1971-2010.jpg 498 × 526; 82 KB
-
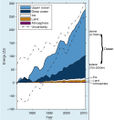
 Energy-accumulation-1971-2020.jpg 691 × 554; 93 KB
-
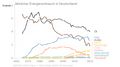 Energy D sources2024.jpg 889 × 500; 120 KB
-
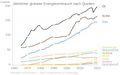 Energy use global source.jpg 792 × 497; 43 KB
-
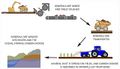
 Enhanced Weathering.gif 2.000 × 707; 126 KB
-
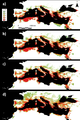
 Enhanced weathering land.jpg 1.273 × 727; 88 KB
-
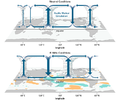
 Enhanced weathering ocean alkalinity.jpg 1.084 × 384; 288 KB
-
 Ensembled projections of the fitted GLM for white mustard suitability using five GCMs.PNG 1.121 × 1.679; 1,15 MB
-
 Enso-teleconnection.jpg 569 × 331; 88 KB
-
 Enso Dec 1997.jpg 1.024 × 574; 176 KB
-
 Enso Jan 2016.jpg 597 × 338; 60 KB
-
 Enso walker.png 720 × 600; 247 KB
-
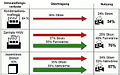
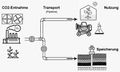 Entnahme-Transport-Nutzung.jpg 797 × 480; 96 KB
-
 Entstehung-Hoch-Tief.jpg 929 × 289; 40 KB
-
 Entstehung.gif 443 × 408; 85 KB
-
 Entstehungsgebiete sulfataerosole.jpg 747 × 370; 47 KB
-
 Entwaldung biochem biophys.jpg 920 × 692; 101 KB
-
 Erdachse.jpg 640 × 457; 86 KB
-
 Erdbahnparameter.jpg 734 × 485; 172 KB
-
 Erde-ohne-Treibhauseffekt-einfach.png 1.920 × 1.080; 26 KB
-
 Erde-ohne-Treibhauseffekt-komplex.png 1.920 × 1.080; 30 KB
-
 ErdsystemModell.jpg 686 × 472; 158 KB
-

-

-
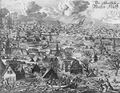 Erschrecklichewasserfluth.jpg 752 × 580; 152 KB
-
 Erträge D 2003.jpg 615 × 360; 55 KB
-
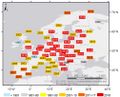
 Eu-Hitzewellen-aktuell-GWL3.jpg 1.998 × 711; 318 KB
-
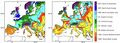
 Eu-Köppen-Geiger1980-2016.jpg 1.339 × 685; 345 KB
-
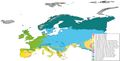
 Eu-Köppen-Geiger2071-2100.jpg 1.333 × 693; 398 KB
-
 Eu-heatwave-days-2051-2100.jpg 1.112 × 536; 136 KB
-
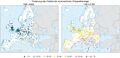
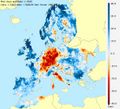
 Eu-precipitation-anomalies2018-19.jpg 1.175 × 538; 334 KB
-
 Eu record years summer temp.jpg 1.004 × 814; 111 KB
-
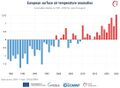
 Eu soil moisture 1979-2020.jpg 1.098 × 356; 38 KB
-
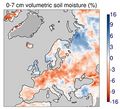 Eu soil moisture summer-2019.jpg 442 × 403; 37 KB
-
 Eu summer temp 1979-2024.jpg 1.085 × 797; 66 KB
-
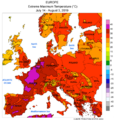 Eu temp.max JUL 2019.png 974 × 1.024; 484 KB
-
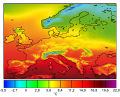
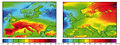 Eu temp diff2100 JJA-DJF.jpg 764 × 288; 212 KB
-
 Eu temp geogr 1961-1990.jpg 480 × 386; 174 KB
-
 Eu wet days 2020.jpg 669 × 607; 74 KB
-
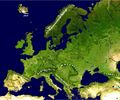 Europa.jpg 950 × 788; 614 KB
-
 Europa2100 N S.jpg 619 × 242; 146 KB
-
 Europa Dürreentwicklung 2071-2100.jpg 540 × 416; 57 KB


