Nicht kategorisierte Dateien
Aus Klimawandel
Nachfolgend werden bis zu 50 Ergebnisse im Bereich #651 bis #700 angezeigt.
-
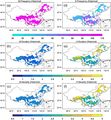
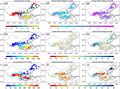
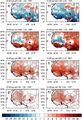 Change di west africa.jpg 2.128 × 3.127; 1,84 MB
-
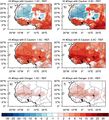 Change heatindex west africa.jpg 2.128 × 2.339; 1,37 MB
-
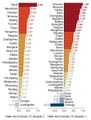
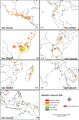 Changes in coffee suitability in 4 coffee growing zones by 2050s.PNG 1.616 × 2.453; 960 KB
-
 Chem. Zusammensetzung der Atmosphäre.gif 660 × 394; 14 KB
-
 Chemical products.jpg 1.006 × 798; 157 KB
-
 Chemische Verwitterung Ozean.jpg 1.131 × 707; 74 KB
-
 Chennai Monsoon rain.jpg 1.280 × 960; 395 KB
-
 Chicago Green Roof.JPG 800 × 600; 118 KB
-
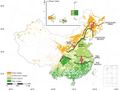
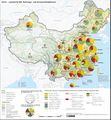 China-Landwirtschaft-Pflanzen.jpg 1.417 × 1.533; 403 KB
-
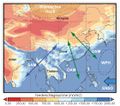
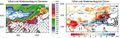 China-Monsun-Regen.jpg 1.149 × 363; 127 KB
-
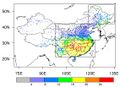
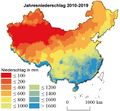 China-Niederschlag-2010er.jpg 803 × 743; 92 KB
-
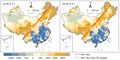
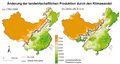 China-Änderung-ldw-Produkti.jpg 922 × 488; 91 KB
-
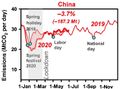 ChinaCO2 emissions2019 June2020.jpg 629 × 468; 104 KB
-
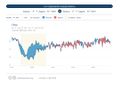 ChinaCO2 emissions Jan-Aug 2020.jpg 1.075 × 760; 56 KB
-
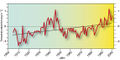
 ChinaTemperature-1850-2021.png 1.024 × 577; 248 KB
-
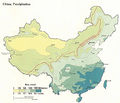 China Niederschlag geogr.jpg 649 × 556; 176 KB
-
 China Nss Klimaeinflüsse.jpg 558 × 492; 243 KB
-
 China Satellite.jpg 800 × 599; 129 KB
-
 China drought2007.png 720 × 480; 606 KB
-
 China drought 2007.jpg 536 × 423; 243 KB
-
 China drought exposure1986-2005.jpg 632 × 534; 205 KB
-
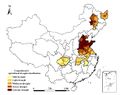 China drought grain areas.jpg 616 × 486; 48 KB
-
 China drought hist.jpg 2.128 × 2.292; 849 KB
-
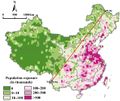
 China drought pop-exposure2020-2039.jpg 670 × 562; 219 KB
-
 China droughts floods1736-2000.jpg 838 × 288; 50 KB
-
 China flash-drought-events.jpg 565 × 409; 50 KB
-
 China flash-droughts T SM ET.jpg 443 × 660; 40 KB
-
 China ldw Produktion 1980-2060.jpg 922 × 488; 91 KB
-
 China map change potentialAgriculturalProductivity.jpg 1.890 × 946; 424 KB
-
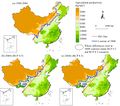 China maps potentialAgriculturalProductivity.jpg 1.867 × 1.654; 616 KB
-
 China multi cropping extension 2050s.jpg 1.145 × 865; 134 KB
-
 China temp 20Jh.jpg 571 × 284; 71 KB
-
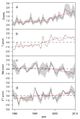
 China tmean precip runoff.jpg 2.128 × 1.578; 773 KB
-
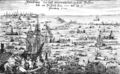 Christmas flood 1717.jpg 800 × 491; 181 KB
-
 Cirrus uncinus.jpg 1.024 × 713; 77 KB
-
 Cities HTY trend.jpg 573 × 755; 86 KB
-
 Claclap.png 960 × 720; 5 KB
-
 Clements glacier 1914.jpg 900 × 750; 81 KB
-
 Clements glacier 2010.jpg 900 × 750; 110 KB
-
 Climate-tipping-points-de.png 1.920 × 973; 567 KB
-
 Climate 1970-2010.jpg 447 × 367; 13 KB
-
 Climate extremes trends.jpg 564 × 488; 53 KB
-
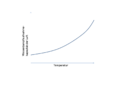
 Climate sensitivity.jpg 682 × 434; 16 KB
-
 Climate sensitivity2020.jpg 721 × 435; 22 KB
-
 Climate system teleconnections.jpg 765 × 751; 409 KB
-
 Climate zones.png 750 × 517; 57 KB
-
 Climate zones Köppen.png 750 × 517; 59 KB
-
 Co2 ML en.png 720 × 250; 18 KB
-
 Co2 trend 2013-11.2018.png 700 × 543; 81 KB
-
 Co2emissionen energie.jpg 460 × 278; 25 KB


