Nicht kategorisierte Dateien
Aus Klimawandel
Unten werden bis zu 50 Ergebnisse im Bereich 2.401 bis 2.450 angezeigt.
-
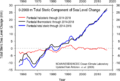
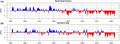
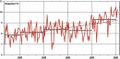 S-H temp 1881-2022.jpg 1.039 × 513; 74 KB
-
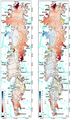 S-Pat Icefield surface2000-2016.jpg 490 × 816; 125 KB
-
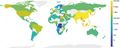
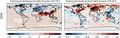
 S. Africa aridity index.jpg 2.128 × 1.748; 364 KB
-
 SE-Tibet glacier-elevation change.jpg 895 × 626; 129 KB
-
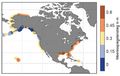 SLR-2050-North-America.jpg 814 × 513; 141 KB
-
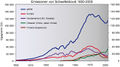
 SLR-Schweden 1886-2009.jpg 463 × 319; 23 KB
-
 SLR-exposed-people-2050.jpg 1.239 × 499; 191 KB
-
 SLR-subsidence-bis-cities.jpg 851 × 484; 112 KB
-
 SLR-subsidence-cities.jpg 710 × 438; 63 KB
-
 SLR1992-2018.png 960 × 540; 410 KB
-
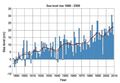
 SLR 1992-2018.jpg 720 × 424; 58 KB
-
 SLR 1993-2020 N-America.jpg 813 × 531; 63 KB
-
 SLR 2100 SROCC.jpg 648 × 315; 57 KB
-
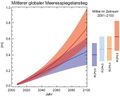
 SLR 2300.jpg 840 × 385; 31 KB
-
 SLR AVISO 2010-2018.jpg 636 × 522; 29 KB
-
 SLR Bangladesh 2050 2100.jpg 651 × 497; 62 KB
-
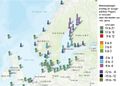 SLR Europa Stationen.jpg 679 × 484; 210 KB
-
 SLR Europe absolut1992-2014.gif 2.025 × 1.311; 593 KB
-
 SLR Europe rel 1970-2015.gif 2.009 × 1.275; 528 KB
-
 SLR Europe relative1970-2014.gif 2.009 × 1.276; 528 KB
-
 SLR Europe relative projection.gif 2.012 × 1.279; 527 KB
-
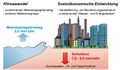
 SLR Gebäude.jpg 1.018 × 290; 26 KB
-
 SLR Global AVISO 1993-2018.png 1.920 × 1.280; 200 KB
-
 SLR Skandinavien.jpg 540 × 507; 36 KB
-
 SLR Stockholm Svinemünde Kolberg.jpg 742 × 285; 130 KB
-
 SLR Topex Poseidon Jason1993-2018.jpg 513 × 397; 36 KB
-
 SLR US-coasts 1993-2018.jpg 1.099 × 479; 52 KB
-
 SLR absol Europe 1993-2015.png 768 × 510; 302 KB
-
 SLR causes1997-2006 2007-2016.jpg 1.019 × 313; 40 KB
-
 SLR influences.jpg 779 × 351; 33 KB
-
 SLR rel Europe N-Atlantic 2081-2100.png 740 × 768; 453 KB
-
 SLR steric 1957-2017 2000m.png 564 × 381; 17 KB
-
 SLR steric US-coasts 1993-2018.jpg 1.114 × 538; 59 KB
-
 SL 7m NASA.jpg 2.048 × 1.024; 361 KB
-
 SL RCP 2100.jpg 462 × 372; 22 KB
-
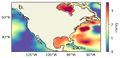
 SL trends S-Asia.jpg 805 × 498; 241 KB
-
 SO-Asien Temp Jahr DiffII RCP8.5.jpg 880 × 576; 279 KB
-
 SO2-Emissionen-regional.jpg 952 × 524; 120 KB
-
 SO2-Emissionen2010.jpg 792 × 456; 76 KB
-
 SO2-Emissionen Quellen.jpg 764 × 576; 144 KB
-
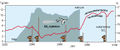 SO2-Injektion Spitzbergen.jpg 575 × 238; 75 KB
-
 SO2 Emissions 1990-2015.jpg 586 × 468; 35 KB
-
 SO2 change 2005-2010.jpg 721 × 425; 60 KB
-
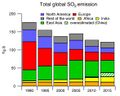
 SO2 emissionen global.jpg 666 × 372; 104 KB
-
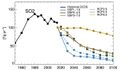 SO2 emissions1950-2100.jpg 634 × 376; 80 KB
-
 SO2 emissions 1950-2020.jpg 1.024 × 526; 58 KB
-
 SO4-trends2000-2014.jpg 702 × 475; 205 KB
-
 SO4 Strahlung 1970-2010-lg.jpg 2.046 × 655; 1,11 MB
-
 SPEI1950-2022 SE-France M-Italy.jpg 1.695 × 626; 141 KB
-
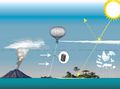 SPICE SRM overview.jpg 800 × 591; 43 KB


