Verwaiste Dateien
Aus Klimawandel
Bitte beachte, dass andere Webseiten eine Datei mit einer direkten URL verlinken können. Diese könnte daher hier aufgelistet sein, obwohl diese in aktiver Verwendung ist.
Nachfolgend werden bis zu 50 Ergebnisse im Bereich #201 bis #250 angezeigt.
-
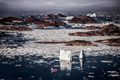
 Eisberge vor Ilulissat.jpg 1.200 × 800; 990 KB
-
 Treibeis bei Kulusuk.jpg 1.200 × 800; 1.010 KB
-
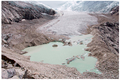
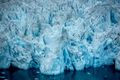 Gletscherfront Sermilik Icefjord.jpg 1.200 × 800; 977 KB
-
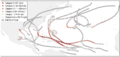
 Ozeanströmungen sm.jpg 600 × 314; 31 KB
-
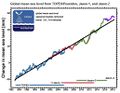
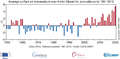
 Land-ocean-temp2015.jpg 840 × 649; 84 KB
-
 Pine-I Twaites ice flux.jpg 559 × 705; 88 KB
-
 Global temp 1880 2017.jpg 731 × 419; 44 KB
-
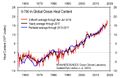 Ocean heat content1955-2018.jpg 683 × 447; 48 KB
-
 Precipitation-global1900-2016.png 928 × 591; 23 KB
-
 SLR Topex Poseidon Jason1993-2018.jpg 513 × 397; 36 KB
-
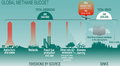 Global-Methane-Budget.png 1.240 × 678; 126 KB
-
 S-H Sommer- Frosttage 1951-2016.jpg 623 × 424; 56 KB
-
 Strahlungshaushalt.gif 685 × 414; 55 KB
-
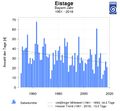 Bayern eistage jahr 1881-2019.jpg 840 × 779; 72 KB
-
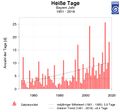 Bayern heiße tage jahr 1881-2019.jpg 840 × 781; 62 KB
-
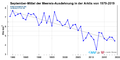
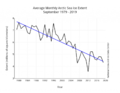 Arctic ice-extent Sept1979-2019.png 1.024 × 791; 209 KB
-
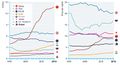 GTCO2e countries+cap1990-2018.jpg 777 × 418; 45 KB
-
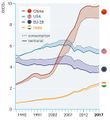 CO2 consumption territorial.jpg 553 × 603; 38 KB
-
 Tropical storm tracks N-Atlantic2017.png 4.096 × 1.933; 875 KB
-
 Jackson Glacier 1941.jpg 1.500 × 971; 213 KB
-
 Glacier national park MT 19June2010.JPG 1.280 × 960; 444 KB
-
 Taku trange summer 2019.jpg 1.140 × 1.140; 126 KB
-
 Nellie Juan Glacier Alaska.jpg 1.140 × 755; 261 KB
-
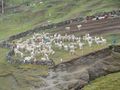 Alpacas peru.jpg 920 × 690; 203 KB
-
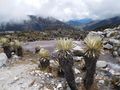 Paramo sierraNevadaElCocuy.jpg 920 × 690; 212 KB
-
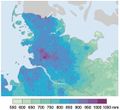 S-H Niederschlag1981-2010.jpg 591 × 544; 41 KB
-
 D global temp 1881-2019.jpg 920 × 427; 60 KB
-
 California SWE 2017.jpg 3.741 × 2.148; 5,69 MB
-
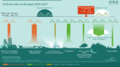
 Mountains ice snow rain.jpg 2.128 × 2.196; 834 KB
-
 New lake Peru.png 2.208 × 1.475; 5,78 MB
-
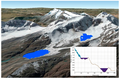 Peru new lakes.png 2.432 × 1.591; 3,43 MB
-
 Sibiria temp June 1950-2020.png 4.764 × 2.348; 293 KB
-
 Arctic ice-extent Sept.1979-2019.png 3.933 × 1.967; 161 KB
-
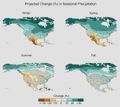 N-America prec 2100 seasons.jpg 1.040 × 929; 130 KB
-
 Methanbudget.png 3.429 × 1.917; 1,33 MB
-
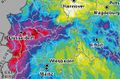 D-Niederschlagssumme-Juni2021sm.jpg 381 × 252; 33 KB
-
 ENSO global temp 2020.png 1.786 × 546; 511 KB
-
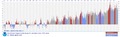
 Runoff Sirba river1956-2018b.png 3.596 × 1.598; 969 KB
-
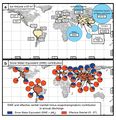
 TG-Emissionen historisch 20Staaten.jpg 829 × 401; 133 KB
-
 Land Ocean temp1880-2021.png 1.130 × 700; 133 KB
-
 CO2-Emissionen-Senken 1850-2022.jpg 738 × 283; 42 KB
-
 ENSO global temp 2022.png 1.786 × 546; 538 KB
-
 Seitenaufrufe.jpg 697 × 647; 121 KB
-
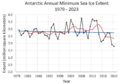 AntarcticMinExtent Febr-2023.png 1.525 × 1.064; 190 KB
-
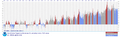
 GHG-emissions1970-2021.jpg 939 × 531; 30 KB
-
 GHG-emissions1970-2021 Tab.jpg 612 × 143; 19 KB
-
 GHG-emissions2000-2021 Tab.jpg 613 × 143; 19 KB
-
 Global THG emissions.jpg 932 × 573; 36 KB
-
 THG-Emissionen 2000-2021.jpg 759 × 199; 26 KB
-
 THG-Konzentration 2022.jpg 458 × 158; 13 KB


