Nicht kategorisierte Dateien
Aus Klimawandel
Unten werden bis zu 500 Ergebnisse im Bereich 1 bis 500 angezeigt.
-
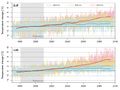
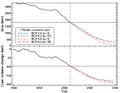
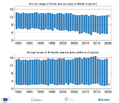
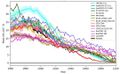
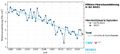
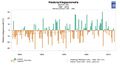
 10 Norwegian glaciers MB.jpg 735 × 355; 108 KB
-
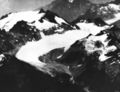 1928 scascade glacier.jpg 1.399 × 1.078; 149 KB
-
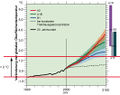 2-Grad-Ziel.jpg 529 × 418; 72 KB
-
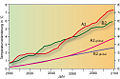
 2000px-Maddison GDP per capita 1500-1950.svg.png 2.000 × 1.250; 121 KB
-
 2006 scascade glacier .jpg 5.817 × 4.049; 8,28 MB
-
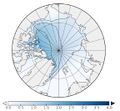
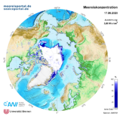
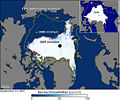 2007 Arctic Sea Ice.jpg 541 × 451; 167 KB
-
 2011 ln water.png 750 × 446; 554 KB
-
 2012 ln greening.jpg 720 × 480; 161 KB
-
 2015 winter summer.jpg 800 × 282; 248 KB
-
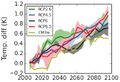
 2016-2020 global temp diff.png 775 × 488; 82 KB
-
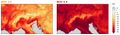
 2mtemp in Temperatur Suedamerika rcp85 dif.png 1.024 × 688; 100 KB
-
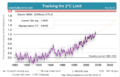 2° limit skepticalscience.png 985 × 631; 273 KB
-
 800.000 CO2 Antarctic temp.png 720 × 240; 12 KB
-
 800px-Sphagnum squarrosum 141006.jpg 800 × 600; 111 KB
-
 90px-Regenmesser Prof Hellmann.JPG 90 × 120; 6 KB
-
 AES MB1992-2017.jpg 753 × 543; 111 KB
-
 AMOC1993-2015.jpg 837 × 360; 54 KB
-
 AMOC2004-2017.jpg 510 × 215; 52 KB
-
 AMOC RAPID.jpg 794 × 317; 44 KB
-
 AMOC projections2300.jpg 581 × 370; 118 KB
-
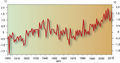
 AMO 1861-2010.png 720 × 354; 26 KB
-
 AR6 SLR 10.000 paleo.jpg 591 × 641; 67 KB
-
 AR6 SLR 2100.jpg 683 × 461; 79 KB
-
 AR6 SSP temp2100.jpg 1.062 × 516; 46 KB
-
 AR6 temp2100.jpg 666 × 456; 70 KB
-
 Abfluss Donau2013.jpg 522 × 429; 26 KB
-
 Abfluss Hwangho.jpg 452 × 469; 108 KB
-
 Abfluss Jangtse.jpg 455 × 469; 109 KB
-
 Abfluss zu niederschlag.gif 680 × 340; 9 KB
-
 Abflusskoeffizient-Sahel.jpg 591 × 359; 98 KB
-
 Above Ground Biomasse.jpg 1.099 × 349; 61 KB
-
 Aboveground soils gases.jpg 982 × 824; 135 KB
-
 Absinkinversion.png 607 × 538; 12 KB
-
 Absorption.gif 498 × 284; 15 KB
-
 AdjustedTCCount 1878-2008.png 721 × 417; 34 KB
-
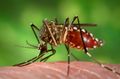 Aedes aegypti.jpg 700 × 463; 31 KB
-
 Aerosol-antrieb indischer ozean.gif 536 × 294; 9 KB
-
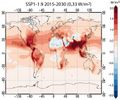 Aerosol-radiation-SSP1-2030.jpg 679 × 568; 251 KB
-
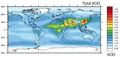
 Aerosol AOD.jpg 720 × 424; 99 KB
-
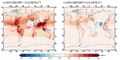
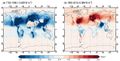 Aerosol RF 1750-1990-2015.jpg 1.271 × 648; 526 KB
-
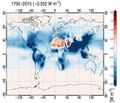 Aerosol RF 1750-2015.jpg 672 × 579; 66 KB
-
 Aerosol RF SSP1-2 2030.jpg 1.287 × 642; 489 KB
-
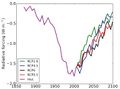 Aerosol forcing1860-2100.jpg 709 × 523; 36 KB
-
 Aerosol micrographs.jpg 720 × 177; 66 KB
-
 Aerosol optical depth2010.jpg 762 × 361; 185 KB
-
 Aerosol teleconnections.jpg 1.272 × 438; 60 KB
-
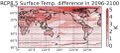 Aerosol temp 2100 RCP8.5.jpg 966 × 426; 128 KB
-
 Aerosol temp 2100 RCP8.5 E-Asia.jpg 690 × 482; 48 KB
-
 Aerosol temp RCP 2100.jpg 661 × 449; 43 KB
-
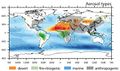 Aerosol types.jpg 703 × 418; 181 KB
-
 Aerosole-SSP-emissionen-antrieb.jpg 999 × 337; 126 KB
-
 Aerosole-Wolken-Strahlung.jpg 716 × 435; 197 KB
-
 Aerosole-temp-2050.jpg 931 × 473; 157 KB
-
 Aerosole Ostchina.jpg 674 × 661; 70 KB
-
 Aerosole Strahlungseffekt.jpg 755 × 437; 88 KB
-
 Aerosole china.gif 498 × 407; 15 KB
-
 Aerosole dimming.gif 447 × 318; 9 KB
-
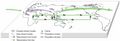
 Aerosole entstehung.gif 669 × 403; 31 KB
-
 Aerosole lebensdauer.gif 488 × 505; 17 KB
-
 Aerosole prozesse.gif 652 × 397; 29 KB
-
 Aerosole russquellen.gif 747 × 370; 22 KB
-
 Aerosole staubquellen.gif 794 × 425; 23 KB
-
 Aerosole temp zonal.gif 456 × 399; 12 KB
-
 Aerosole temperatur geogr.jpg 599 × 292; 132 KB
-
 Aerosolkonzentration2006 Europa.jpg 573 × 490; 276 KB
-
 Aerosols-GHG-prec.jpg 1.022 × 270; 214 KB
-
 Aerosols SST Sahel-rain.jpg 884 × 685; 146 KB
-
 Aerosolszenarien.jpg 575 × 383; 102 KB
-
 Aerosolwirkung-direkt.gif 658 × 465; 25 KB
-
 Aerosolwirkung-indirekt.jpg 842 × 595; 229 KB
-
 Aerosolwirkung oben unten.gif 412 × 536; 14 KB
-
 Africa-hot-nights.jpg 1.462 × 748; 863 KB
-
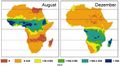 Africa-prec-aug-dec.jpg 826 × 464; 157 KB
-
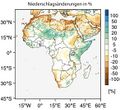 Africa-rainfall-change.jpg 583 × 532; 216 KB
-
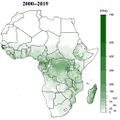 Africa aboveground biomass.jpg 1.041 × 1.041; 99 KB
-
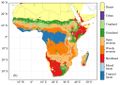
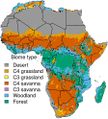 Africa biome type.jpg 893 × 988; 117 KB
-
 Africa land cover2002-2017.jpg 1.017 × 718; 98 KB
-
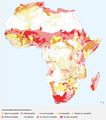 Africa land degradation.jpg 720 × 813; 70 KB
-
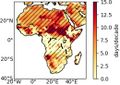 Africa summer days 1980-2018.jpg 1.039 × 736; 88 KB
-
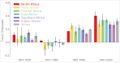 Africa temp trends.jpg 1.184 × 626; 51 KB
-
 Afrika 2100 A1B.jpg 452 × 596; 82 KB
-
 Afrika ITC feucht.jpg 672 × 297; 81 KB
-
 Afrika ITC trocken.jpg 672 × 296; 80 KB
-
 Afrika JJA-Niederschlag2001-2011.jpg 467 × 549; 58 KB
-
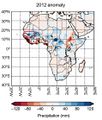 Afrika JJA-Niederschlag 2012.jpg 473 × 556; 57 KB
-
 Afrika Malariagebiet Niederschl.jpg 588 × 255; 107 KB
-
 Afrika Malariagebiet Temp.jpg 568 × 261; 136 KB
-
 Afrika Malariaverbreitung.jpg 483 × 291; 128 KB
-
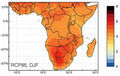 Afrika RCP85 Temp.jpg 410 × 260; 74 KB
-
 Afrika Relative Feuchte Jahr rcp85 dffII.jpg 880 × 576; 248 KB
-
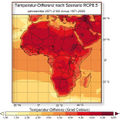 Afrika Temp diff2 RCP8.5.jpg 549 × 548; 180 KB
-
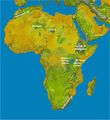 Afrika Topographie.jpg 656 × 718; 380 KB
-
 Afrika agrarproduktion2080.jpg 205 × 270; 46 KB
-
 Afrika monsun.jpg 373 × 244; 60 KB
-
 Afrika sommermonsun.jpg 373 × 244; 37 KB
-
 Afrika temp diff2 RCP4.5 8.5.jpg 840 × 544; 314 KB
-
 Agrarland 2007.jpg 2.128 × 1.046; 445 KB
-
 Agrarlandschaft-Eiderstedt.jpg 800 × 443; 95 KB
-
 Agrarproduktion2080.jpg 550 × 355; 70 KB
-
 Agroforestry Burkina Faso.jpg 1.040 × 788; 262 KB
-
 Agroforestry crop residue.jpg 953 × 803; 195 KB
-
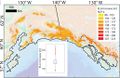 Alaska ELA increase glaciers.jpg 1.032 × 669; 118 KB
-
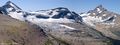
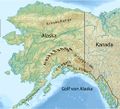 Alaska Mountains.jpg 519 × 471; 316 KB
-
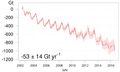 Alaska glaciers2012-2016.jpg 848 × 508; 97 KB
-
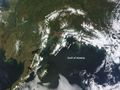 Alaska glaciers NASA.jpg 828 × 621; 130 KB
-
 Alaska greening browning.jpg 1.020 × 384; 87 KB
-
 Alaska precRCP6.0 glaciers.jpg 1.025 × 657; 118 KB
-
 Alaska snowRCP6.0 glaciers.jpg 742 × 481; 261 KB
-
 Alaska temp glaciers regions.jpg 1.023 × 667; 130 KB
-
 Albedo-Eis.jpg 761 × 579; 96 KB
-
 Albedo-Eis2.jpg 771 × 574; 97 KB
-
 Albedo-Werte.gif 1.622 × 2.324; 79 KB
-
 Albedo CO2 60Mio.jpg 447 × 322; 76 KB
-
 Albedo change.jpg 720 × 725; 162 KB
-
 Albedo erde.jpg 540 × 314; 105 KB
-
 Albedo sm.jpg 940 × 564; 47 KB
-
 Aletsch RCP2.6 8.5 2100.jpg 854 × 319; 48 KB
-
 Aletschgletscher.jpg 800 × 600; 142 KB
-
 Aletschgletscher 4.9.1902.jpg 640 × 509; 55 KB
-
 Algenblüte Tag 26 EIFEX.jpg 600 × 475; 0 Bytes
-
 Alpacas peru.jpg 920 × 690; 203 KB
-
 Alpen Lage Höhe.jpg 834 × 479; 100 KB
-
 Alpen Temperatur1770-2003.jpg 468 × 277; 61 KB
-
 AlpineHoehenstufen.jpg 672 × 381; 139 KB
-
 Alps-temp-2100-RCP.jpg 729 × 549; 274 KB
-
 Alps glacial lake Obersulzbach valley.jpg 729 × 485; 78 KB
-
 Alps glacier glacial cycle.jpg 1.063 × 713; 203 KB
-
 Alps glaciers1000-2000.jpg 738 × 782; 101 KB
-
 Alps glaciers1900-2100.jpg 564 × 437; 73 KB
-
 Alps glaciers area change.jpg 1.100 × 380; 82 KB
-
 Alps glaciers elevation change.jpg 1.100 × 394; 92 KB
-
 Alps glaciers length1000-2000.jpg 904 × 358; 48 KB
-
 Alps glaciers mass change.jpg 1.100 × 382; 94 KB
-
 Alps glaciers vol2100 RCP2.6 8.5.jpg 650 × 730; 120 KB
-
 Alps glaciers volume change.jpg 1.769 × 635; 200 KB
-
 Alps regions.jpg 664 × 377; 31 KB
-
 Alps snow mass 2100 RCPs.jpg 1.013 × 296; 56 KB
-
 Alps temp year summer2100.jpg 877 × 351; 65 KB
-
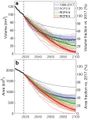 Alps vol area change2100.jpg 451 × 607; 50 KB
-
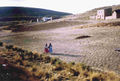 Altiplano.JPG 3.486 × 2.358; 180 KB
-
 Altiplano bolivien.JPG 3.456 × 2.592; 218 KB
-
 Amazon PDSI 1983-1998-2016.jpg 846 × 292; 63 KB
-
 Amazon drought 2005.jpg 350 × 353; 41 KB
-
 Amazon drought fire.jpg 446 × 539; 143 KB
-
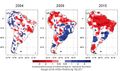 Amazonas-Dürren2004-2009-2015.jpg 701 × 413; 177 KB
-
 Amazonas Bodenfeuchte 2010 2016.jpg 771 × 461; 234 KB
-
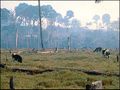 Amazonas Brandrodung.jpg 350 × 263; 27 KB
-
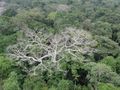 Amazonas Dürre Baum.jpg 640 × 480; 95 KB
-
 Amazonas Feuer 24-26.8.19.jpg 585 × 621; 101 KB
-
 Amazonas Sekundärwald Feuer.jpg 402 × 679; 82 KB
-
 Amazonas deforestation.jpg 620 × 485; 259 KB
-
 Amazonas geographisch.jpg 640 × 422; 65 KB
-
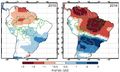
 Amazonas temp Dürren.jpg 679 × 288; 106 KB
-
 Amazonia LAI.jpg 540 × 448; 79 KB
-
 Ambrosia.jpg 684 × 768; 140 KB
-
 Americas land-use colonization.jpg 1.040 × 1.034; 154 KB
-
 Amselküken.JPG 738 × 487; 106 KB
-
 Amundsen Gletscher2008-2015.jpg 668 × 450; 264 KB
-
 Amundsen Sea glaciers speed.jpg 784 × 498; 123 KB
-
 Amundsen glaciers ice flow.jpg 499 × 724; 94 KB
-
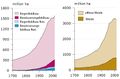 Anbauland Weide 1700-2010.jpg 787 × 519; 42 KB
-
 Andes glacier mass blance.jpg 1.024 × 582; 129 KB
-
 Andes glacier melt contribution.jpg 814 × 693; 369 KB
-
 AnophelesGambiaemosquito.jpg 300 × 196; 13 KB
-
 AntarcticMinExtent Febr-2023.jpg 732 × 511; 99 KB
-
 AntarcticMinExtent Febr-2023.png 1.525 × 1.064; 190 KB
-
 Antarctic PI shelves.jpg 413 × 609; 50 KB
-
 Antarctic Sea-ice2016-17.jpg 720 × 418; 35 KB
-
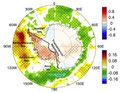
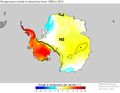
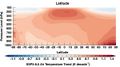
 Antarctic Temperature Trend 1981-2007.jpg 540 × 508; 93 KB
-
 Antarctic nsidc 1991.png 720 × 445; 189 KB
-
 Antarctic nsidc 2019.png 720 × 445; 186 KB
-
 Antarctic nsidc 2021.png 720 × 445; 201 KB
-
 Antarctic peninsula sm.jpg 840 × 785; 136 KB
-
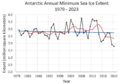
 Antarctic sea ice1979-2016.jpg 701 × 333; 36 KB
-
 Antarctic sea ice Nov.2016.png 640 × 495; 50 KB
-
 Antarctic seaice winter-summer.jpg 722 × 349; 31 KB
-
 Antarctic temp trend 1958-2012 lg.jpg 783 × 610; 90 KB
-
 Antarctic temp trend 1979-2019.jpg 1.725 × 688; 127 KB
-
 Antarctica-temp-reversal.jpg 873 × 705; 84 KB
-
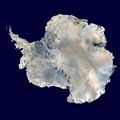 Antarctica.jpg 600 × 600; 37 KB
-
 Antarctica 10000 years.jpg 772 × 425; 54 KB
-
 Antarctica LIMA3.jpg 1.417 × 1.375; 381 KB
-
 Antarctica Ross-Shelf.jpg 600 × 400; 38 KB
-
 Antarctica SMB ice discharge.jpg 840 × 662; 90 KB
-
 Antarctica bed elevation.jpg 982 × 1.024; 301 KB
-
 Antarctica ice bed.jpg 596 × 502; 56 KB
-
 Antarctica ice velocity2013-2018.jpg 720 × 441; 35 KB
-
 Antarctica map.png 1.002 × 1.024; 591 KB
-
 Antarctica satellite.jpg 840 × 840; 98 KB
-
 Antarctica temp change.jpg 840 × 649; 43 KB
-
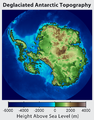 Antarctica without ice sheet.png 782 × 1.000; 675 KB
-
 Antarktis.gif 354 × 365; 22 KB
-
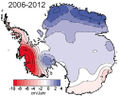 Antarktis Eisverlust 2006-2012.jpg 505 × 408; 105 KB
-
 Antarktis MB 2015-2018.jpg 588 × 596; 81 KB
-
 Antarktis Meereis Trends.jpg 412 × 596; 52 KB
-
 Antarktis Meereisausdehnung-1979-2022.jpg 989 × 583; 177 KB
-
 Antarktis Oberflächenänderung.jpg 690 × 587; 268 KB
-
 Antarktis Teile.jpg 731 × 628; 63 KB
-
 Antarktische hi.gif 472 × 467; 43 KB
-
 Antarktisches Meereis Jahreszeiten.jpg 473 × 375; 23 KB
-
 Anteil landwirtschaftlicher Prozesse an Emissionen.png 493 × 225; 29 KB
-
 Anthromes Europe2000.jpg 791 × 1.024; 230 KB
-
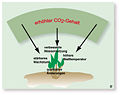
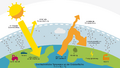 Anthropogener-Treibhauseffekt-einfach.png 1.920 × 1.080; 44 KB
-
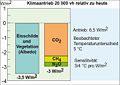 Antrieb20000 heute.jpg 725 × 511; 44 KB
-
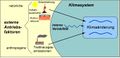 Antriebsfaktoren.jpg 662 × 321; 82 KB
-
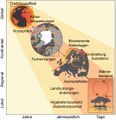 Antriebskräfte-Hitzewellen.jpg 1.076 × 1.117; 417 KB
-
 Anvil shaped cumulus panorama edit crop.jpg 800 × 329; 50 KB
-
 Apfelanbau himalaya.jpg 4.402 × 1.588; 882 KB
-
 ApusApusDistribution.png 1.070 × 898; 315 KB
-
 Aquakultur Vestmanna.jpg 640 × 426; 70 KB
-
 Arable areas for sequential and single cropping.jpg 2.244 × 1.475; 237 KB
-
 Aragonite RCP4.5-8.5 2090-2099.jpg 827 × 768; 73 KB
-
 Aralship2.jpg 800 × 600; 90 KB
-
 Arcti global warming.jpg 1.536 × 1.024; 158 KB
-
 Arctic-A Eurasia-cooling.jpg 385 × 699; 124 KB
-
 Arctic-Sea-ice standard deviation.jpg 1.020 × 749; 109 KB
-
 Arctic-sea-ice Sept2012 March2013.jpg 777 × 581; 49 KB
-
 ArcticWarming-1900-2021.png 1.024 × 577; 210 KB
-
 Arctic Antarctic sea-ice-area anomalies1979-2019.png 1.040 × 893; 109 KB
-
 Arctic Nov ice 1978-2016.jpg 862 × 647; 45 KB
-
 Arctic Ocean SST-Trend.png 820 × 1.178; 338 KB
-
 Arctic Ocean currents.jpg 705 × 675; 86 KB
-
 Arctic Sea Ice freeze-date.jpg 720 × 480; 125 KB
-
 Arctic Sept ice1879-2013.jpg 817 × 433; 70 KB
-
 Arctic Warming seasons.jpg 858 × 499; 70 KB
-
 Arctic amplification.png 720 × 360; 186 KB
-
 Arctic amplification vertical2100.jpg 600 × 333; 26 KB
-
 Arctic antarctic sea-ice-area1979-2019.png 1.040 × 893; 96 KB
-
 Arctic changes cc.jpg 846 × 649; 64 KB
-
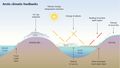 Arctic climatic feedbacks.jpg 840 × 475; 30 KB
-
 Arctic extremeheat 2016.jpg 1.240 × 1.040; 437 KB
-
 Arctic global temp1900-2020.jpg 940 × 413; 48 KB
-
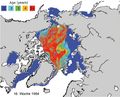
 Arctic ice-Age 2018.jpg 620 × 532; 169 KB
-
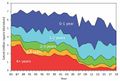
 Arctic ice-age 1984-2018.jpg 560 × 411; 94 KB
-
 Arctic ice-age 1984.jpg 477 × 385; 126 KB
-
 Arctic ice-age 1985-2019.jpg 669 × 454; 39 KB
-
 Arctic ice-age 1985 2019.ai.jpg 1.020 × 639; 108 KB
-
 Arctic ice-area Sept1979-2018.png 3.933 × 1.967; 151 KB
-
 Arctic ice-extent Sept.1979-2019.png 3.933 × 1.967; 161 KB
-
 Arctic ice-extent Sept1979-2018.png 3.933 × 1.967; 158 KB
-
 Arctic ice-extent Sept1979-2019.png 1.024 × 791; 209 KB
-
 Arctic ice-free.jpg 1.080 × 849; 54 KB
-
 Arctic nsidc 1991.png 720 × 545; 359 KB
-
 Arctic nsidc 2019.png 720 × 545; 357 KB
-
 Arctic old ice lost.jpg 620 × 380; 40 KB
-
 Arctic oscillation NOAA.png 750 × 450; 39 KB
-
 Arctic sea-ice-extent-1500.jpg 1.000 × 732; 432 KB
-
 Arctic sea-ice-thickness1984-2018.png 940 × 1.308; 224 KB
-
 Arctic sea-ice-volume1984-2018.png 2.068 × 1.320; 90 KB
-
 Arctic sea-ice 16.9.12.jpg 800 × 450; 69 KB
-
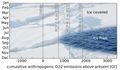 Arctic sea-ice CO2 emissions.jpg 774 × 453; 52 KB
-
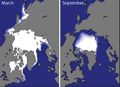 Arctic sea-ice March Sept.jpg 710 × 515; 54 KB
-
 Arctic sea-ice Sept1979-2020.jpg 800 × 381; 47 KB
-
 Arctic sea-ice extent.jpg 676 × 528; 109 KB
-
 Arctic sea-ice mass1960-2100.jpg 1.077 × 668; 96 KB
-
 Arctic sea-ice temp projection.jpg 987 × 575; 77 KB
-
 Arctic sea-ice thickness 2000-2012.jpg 573 × 531; 49 KB
-
 Arctic sea ice SSP 2100.jpg 1.200 × 335; 53 KB
-
 Arctic seaice March-Sept.png 620 × 459; 49 KB
-
 Arctic snow-cover trend1972-2016.jpg 750 × 653; 111 KB
-
 Arctic snow anomaly April-June1967-2017.png 3.255 × 1.036; 574 KB
-
 Arctic snow cover1967-2016.jpg 726 × 461; 32 KB
-
 Arctic snow duration trend seasons.jpg 890 × 371; 85 KB
-
 Arctic snow extent mass.png 620 × 351; 79 KB
-
 Arctic summer temp2000.jpg 834 × 284; 124 KB
-
 Arctic temp13.10.2010.jpg 550 × 550; 53 KB
-
 Arctic temp1979-2020.jpg 1.129 × 583; 100 KB
-
 Arctic temp 2090.jpg 456 × 464; 42 KB
-
 Arctic topography.jpg 550 × 549; 70 KB
-
 Arctic tundra1950-2015.jpg 595 × 514; 190 KB
-
 Arctic warming 1900-2017.jpg 1.240 × 534; 101 KB
-
 Arctic warming cold warm seasons.jpg 887 × 489; 99 KB
-
 Arctic warming water vapour.jpg 726 × 339; 57 KB
-
 Area number fires Mediterranean.jpg 625 × 461; 85 KB
-
 ArguBrowser.PNG 463 × 393; 24 KB
-
 Arktis-Albedo.jpg 495 × 249; 53 KB
-
 Arktis Abgrenzung.jpg 544 × 548; 61 KB
-
 Arktis Gliederung.jpg 791 × 764; 93 KB
-
 Arktis Meereis Ausdehnung aktuell.jpg 1.240 × 560; 75 KB
-
 Arktis meereis 9-2020.png 800 × 800; 949 KB
-
 Arktis meereis Vergleich 9-2020.png 920 × 460; 105 KB
-
 Arktis temp1900-2011.jpg 622 × 329; 82 KB
-
 Arktis temp 2100.jpg 502 × 331; 71 KB
-
 Arktis temp sommer winter1979-2010.jpg 577 × 273; 70 KB
-
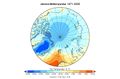 Arktis temperatur 1971-2000.jpg 880 × 576; 208 KB
-
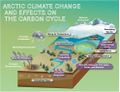 Artic C-Cycle cc.jpg 986 × 759; 113 KB
-
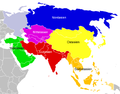 Asia-UNsubregions.png 534 × 418; 116 KB
-
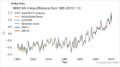 Asia temp 1900-2021.jpg 1.070 × 598; 57 KB
-
 Asian-aerosol-dipole-remote-warming.jpg 966 × 533; 430 KB
-
 Atlanta thermal.jpg 540 × 379; 112 KB
-
 Atlantic-ACE Index 1950-2019.png 900 × 900; 86 KB
-
 Atlantic Ocean temp1900-2020.jpg 561 × 406; 65 KB
-
 Atlantik Pazifik SST.jpg 449 × 447; 92 KB
-
 Atmosphaere ozean.jpg 634 × 294; 99 KB
-
 Atmosphaerische zirkulationszellen.jpg 682 × 333; 105 KB
-
 Atmospheric river.jpg 720 × 480; 135 KB
-
 Atmosphäre Stockwerke sm.jpg 640 × 906; 85 KB
-
 Atoll yap.jpg 800 × 524; 74 KB
-
 Aufbau der Atmosphäre.gif 543 × 728; 27 KB
-
 Aufforstung-Klima.jpg 910 × 491; 221 KB
-
Aufforstungsregionen.jpg Datei fehlt
-
 Auftrieb Wellenpumpe.jpg 915 × 621; 88 KB
-
 Ausdehnung Tropen.jpg 502 × 382; 88 KB
-
 Auslassgletscher Karal.jpg 1.200 × 800; 746 KB
-
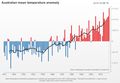
 Australia-temperature-chart.jpg 897 × 504; 75 KB
-
 Australia fire.png 720 × 480; 312 KB
-
 Australia fire 2020 Jan.jpg 720 × 720; 217 KB
-
 Australia heatwave 2013.jpg 720 × 511; 216 KB
-
 Australia high pressure June2017.jpg 596 × 437; 58 KB
-
 Australia maxtemp 1961-1990.png 750 × 517; 41 KB
-
 Australia maxtemp dec 1910-2019.jpg 1.240 × 680; 114 KB
-
 Australia rain1.7.-31.12.2019.gif 680 × 467; 68 KB
-
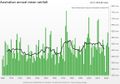 Australia rainfall 1900-2023.jpg 1.151 × 806; 103 KB
-
 Australia rainfall 1961-1990.png 750 × 517; 42 KB
-
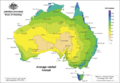
 Australia rainfall 1981-2010.png 750 × 517; 42 KB
-
 Australia rainfall 2015-2018.gif 680 × 467; 62 KB
-
 Australia rainfall 2018-2019.gif 680 × 467; 71 KB
-
 Australia temp 1910-2019.jpg 905 × 629; 56 KB
-
 Australia temp 1961-1990.png 750 × 517; 65 KB
-
 Australia wildfire aerosols.jpg 1.040 × 612; 69 KB
-
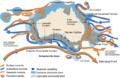 Australian ocean currents.png 550 × 358; 161 KB
-
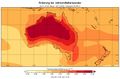
 Australien-Regentage-2100.jpg 601 × 545; 186 KB
-
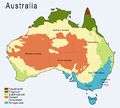 Australien Klimazonen.JPG 674 × 608; 48 KB
-
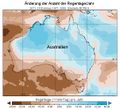
 Australien Temp.diff 2100 rcp85.jpg 880 × 576; 196 KB
-
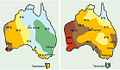 Australien ns2100.jpg 554 × 321; 92 KB
-
 Australien temp1910-2011.jpg 545 × 314; 89 KB
-
 Australien temp2100.jpg 274 × 320; 44 KB
-
 Bagladesch folgen.gif 747 × 253; 10 KB
-
 Baltic Sea temp1871-2011.jpg 717 × 232; 117 KB
-
 Baltic prec 2100 winter summer.jpg 794 × 498; 95 KB
-
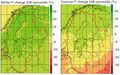
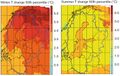 Baltic temp 2100 winter summer.jpg 783 × 498; 94 KB
-
-
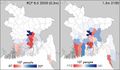
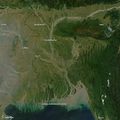 Bangladesch.jpg 720 × 720; 128 KB
-
 Bangladesch Risikozonen.jpg 519 × 554; 196 KB
-
 Bangladesch Weizen Reis Dürre.jpg 617 × 443; 97 KB
-
 Bangladesch kueste.gif 483 × 500; 31 KB
-
 Bangladesh flood 2007.jpg 803 × 474; 97 KB
-
 Bangladesh migration SLR 2050 2100.jpg 780 × 452; 176 KB
-
 Bangladesh paddy drought.jpg 280 × 213; 18 KB
-
 Baumbedeckung-W-Afrika.jpg 1.036 × 451; 195 KB
-
 Baumwachstum1961-1990.gif 653 × 332; 11 KB
-
 BaumwachstumVerringert.gif 667 × 330; 13 KB
-
 Bayerischer wald kahlgefressen.jpg 500 × 376; 75 KB
-
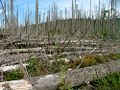
 Bayern eistage jahr 1881-2019.jpg 840 × 779; 72 KB
-
 Bayern heiße Eistage1951-2018.jpg 798 × 370; 116 KB
-
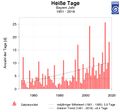 Bayern heiße tage jahr 1881-2019.jpg 840 × 781; 62 KB
-
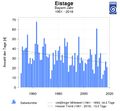
 Bayern niederschlag jahr 1881-2019.jpg 840 × 472; 42 KB
-
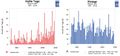
 Bayern temp 1881-2019.jpg 860 × 484; 42 KB
-
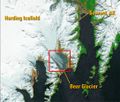
 Bear Glacier landsat 020601.jpg 1.082 × 916; 343 KB
-
 Bear Glacier landsat 110613.jpg 1.082 × 918; 357 KB
-
 Bear Glacier landsat 160589.jpg 1.081 × 917; 411 KB
-
 Begriffe Meereisdicke.jpg 1.100 × 613; 41 KB
-
 Bering Gletscher.jpg 840 × 615; 106 KB
-
Bewirtschafteter Wald.jpg Datei fehlt
-
 Bewässerung Nebraska.jpg 840 × 517; 88 KB
-
 Biodiesel from microalgae.jpg 2.917 × 1.864; 528 KB
-
 Biogeophysikalische WW.png 1.058 × 794; 2,41 MB
-
Biomasse Gras.JPG Datei fehlt
-
 Blackfoot Jackson 1914.jpg 4.913 × 1.838; 970 KB
-
 Blackfoot Jackson 2009.jpg 4.913 × 1.838; 619 KB
-
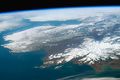 Blick von ISS Alaska.jpg 5.127 × 3.415; 2,45 MB
-
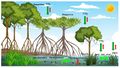 Blue-carbon-exchange2.dt.jpg 920 × 523; 336 KB
-
 Blue carbon exchange.png 1.674 × 950; 1,45 MB
-
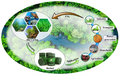 Blue carbon mitigation cc.png 1.258 × 790; 1,29 MB
-
 Boden C 2100.jpg 593 × 294; 74 KB
-
 Boden klima.jpg 535 × 368; 112 KB
-
 Bodenfeuchte.jpg 499 × 317; 89 KB
-
 Bodenfeuchte Jahresmittel2005.png 1.000 × 631; 302 KB
-
 Bodenfunktionen FAO-dt.jpg 1.297 × 1.025; 653 KB
-
 Bodentemperatur.jpg 635 × 263; 81 KB
-
 Borealer Wald.jpg 750 × 494; 245 KB
-
 Borkenkäfer.jpg 640 × 426; 117 KB
-
 BorreliaBurgdorferi.jpg 800 × 527; 68 KB
-
 Bossons Glacier19.Jh.jpg 584 × 480; 58 KB
-
 Bossons Glacier 2014.jpg 640 × 404; 44 KB
-
 Boxmodel Stommel groß.jpg 800 × 500; 30 KB
-
 Brahmaputra river basin.jpg 840 × 692; 61 KB
-
 Brandenburg hydrologie2050.jpg 357 × 369; 27 KB
-
 Brandenburg temp ns 2100.jpg 374 × 460; 63 KB
-
 Brazil drought Sos yield.jpg 579 × 224; 104 KB
-
 Brazil land cover change2001 2017.jpg 1.040 × 362; 83 KB
-
 Bridge Glacier.jpg 708 × 543; 87 KB
-
 Brikdalsbreen sm.jpg 448 × 290; 100 KB
-
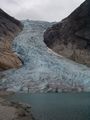 Briksdalsbreen.jpg 450 × 600; 56 KB
-
 BrockenSnowedTrees.jpg 120 × 77; 3 KB
-
 Bundestag.jpg 398 × 265; 75 KB
-
 Burned area MODIS.5.0.jpg 871 × 441; 70 KB
-
 Buschfeuer Australien 2016.jpg 605 × 177; 40 KB
-
 C-emissions1850-2021.jpg 1.691 × 1.021; 77 KB
-
 CA-evapo-1941-2020.jpg 808 × 226; 84 KB
-
 CA-wasserprod.-verbrauch.jpg 512 × 369; 168 KB
-
 CAT-Thermometer-2022.11.png 3.630 × 2.970; 234 KB
-
 CAT-Thermometer2100.jpg 1.037 × 824; 114 KB
-
 CAT-Thermometer2100.png 3.630 × 2.970; 234 KB
-
 CC-by-sa.png 88 × 31; 0 Bytes
-
 CCA3.0.jpg 94 × 35; 2 KB
-
 CCC global temp1850-2020.jpg 1.042 × 552; 151 KB
-
 CCC global temp1970-2020.jpg 1.038 × 579; 220 KB
-
 CC BY SA 88x31.png 88 × 31; 5 KB
-
 CDHW duration 1951-2100.jpg 1.057 × 633; 63 KB
-
 CDR methods.jpg 1.987 × 1.453; 204 KB
-
 CE-Struktur.gif 826 × 598; 50 KB
-
 CE CDR und RM.jpg 2.560 × 1.619; 422 KB
-
 CE Verfahren.jpg 2.500 × 1.597; 458 KB
-
 CFC-11 1977-2020.png 695 × 434; 47 KB
-
 CFC-12 1977-2020.png 695 × 420; 44 KB
-
 CH4-emissions sources regions2017.jpg 1.725 × 1.023; 144 KB
-
 CH4 1984-2018.jpg 761 × 550; 62 KB
-
 CH4 1987-2012.jpg 660 × 339; 88 KB
-
 CH4 1987-2017.jpg 660 × 397; 94 KB
-
 CH4 640000.jpg 667 × 224; 106 KB
-
 CH4 MaunaLoa 1983-2018.jpg 892 × 679; 76 KB
-
 CH4 N2O szenarien.jpg 888 × 362; 139 KB
-
 CH4 annual increase.png 1.000 × 600; 29 KB
-
 CH4 emissions1985-2003.jpg 633 × 275; 101 KB
-
 CH4 growth rate 1984-2018.jpg 742 × 561; 56 KB
-
 CIMG0399.JPG 1.600 × 1.200; 1,15 MB
-
 CMIP5-CMIP6 Greenland temp.png 2.067 × 1.015; 278 KB
-
 CMIP6-Strahlungsantrieb DE.png 940 × 739; 88 KB
-
 CO2-Budget 2007-2016.jpg 748 × 708; 80 KB
-
 CO2-Concentrations SSPs 1980-2100 DE.png 940 × 711; 83 KB
-
 CO2-Emissionen-Senken 1850-2022.jpg 738 × 283; 42 KB
-
 CO2-Emissionen1990-2008.jpg 450 × 342; 53 KB
-
 CO2-Emissionen1990-2014.jpg 775 × 462; 105 KB
-
 CO2-Emissionen staaten.jpg 727 × 451; 148 KB
-
 CO2-Entnahme Tab.2.jpg 768 × 450; 54 KB
-
 CO2-Entnahme Tab.jpg 820 × 237; 40 KB
-
 CO2-Land-Ocean-sink.jpg 513 × 682; 212 KB
-
 CO2-Ozean-Landveg-Strahlung-Temp.jpg 1.013 × 616; 70 KB
-
 CO2-Ozean-Veg-Strahlung.jpg 1.018 × 430; 62 KB
-
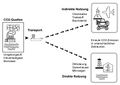 CO2-Quellen-Nutzung.jpg 799 × 563; 95 KB
-
 CO2-capture-storage-utilisation.jpg 998 × 451; 130 KB
-
 CO2-einfluss.jpg 462 × 365; 55 KB
-
 CO2-emissions2000-2016.jpg 667 × 510; 40 KB
-
 CO2-emissions Corona1970-2020.jpg 621 × 548; 22 KB
-
 CO2-emissions Corona2020.jpg 1.024 × 576; 32 KB
-
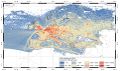 CO2-emissions Europe-map2012.jpg 963 × 568; 151 KB
-
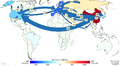 CO2-emissions production consumption.png 3.230 × 1.772; 620 KB
-
 CO2-emissions regions 1960-2022.png 1.852 × 1.042; 149 KB
-
 CO2-emissions world-map2012.jpg 1.024 × 594; 165 KB
-
 CO2-konzentration aktuell.jpg 790 × 494; 128 KB
-
 CO2-kreislauf-land.jpg 568 × 490; 38 KB
-
 CO2-kreislauf.gif 550 × 535; 35 KB
-
 CO2-kreislauf.jpg 550 × 535; 211 KB
-
 CO2-kumulative-Emissionen-1850-2022.jpg 583 × 788; 77 KB
-
 CO2-ppm 420Mio.years.jpg 851 × 341; 118 KB
-
 CO2-solar forcing420Mio.years.jpg 847 × 477; 148 KB
-
 CO2-temp-2015-2100a.gif 918 × 608; 49 KB
-
 CO2 2007.jpg 589 × 473; 113 KB
-
 CO2 3000 Nullemission.jpg 566 × 258; 52 KB
-
 CO2 400000years.gif 700 × 453; 21 KB
-
 CO2 640000.jpg 671 × 229; 90 KB
-
 CO2 CH4 N2O emissions 1970-2012.jpg 840 × 430; 56 KB
-
 CO2 Emissionen D Sektoren.jpg 862 × 442; 56 KB
-
 CO2 Emissionen EU Sektoren.jpg 862 × 442; 59 KB
-
 CO2 Emissionen Flugverkehr.jpg 829 × 367; 86 KB
-
 CO2 Emissionen Schiffahrt.jpg 815 × 366; 111 KB
-
 CO2 Emissionen Sektoren.jpg 850 × 442; 59 KB
-
 CO2 Emissionen historisch.jpg 567 × 375; 24 KB
-
 CO2 H2O absorption.png 720 × 107; 12 KB
-
 CO2 MaunaLoa 1958-2018.png 700 × 543; 116 KB
-
 CO2 Mauna Loa Wachstumsrate.jpg 691 × 512; 55 KB
-
 CO2 Mineralisierung.jpg 631 × 467; 96 KB
-
 CO2 Ozeantiefen.jpg 474 × 528; 113 KB
-
 CO2 anteile.jpg 741 × 448; 194 KB
-
 CO2 budget 2002-2011.jpg 661 × 622; 62 KB
-
 CO2 budget 2005-2014.jpg 731 × 687; 71 KB
-
 CO2 concentration growth-rate1980-2017.jpg 840 × 526; 56 KB
-
 CO2 consumption territorial.jpg 553 × 603; 38 KB
-
 CO2 consumption territorial2.jpg 1.454 × 1.017; 98 KB
-
 CO2 emissionen.jpg 420 × 415; 73 KB
-
 CO2 emissions1900-2020.jpg 1.327 × 670; 75 KB
-
 CO2 emissions1990-2017.jpg 826 × 510; 107 KB
-
 CO2 emissions 1.5-2.0°C.png 840 × 560; 229 KB
-
 CO2 emissions 1990-2022.jpg 887 × 551; 93 KB
-
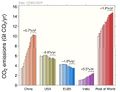
 CO2 emissions China US EU India1959-2017.jpg 837 × 513; 52 KB
-
 CO2 emissions person states1959-2017.jpg 752 × 524; 41 KB
-
 CO2 emissions world countries.jpg 877 × 522; 151 KB
-
 CO2 erdneuzeit IPCC-AR6.jpg 847 × 539; 125 KB
-
 CO2 global distribution2016.jpg 1.103 × 647; 88 KB
-
 CO2 ice-age-2017.gif 620 × 266; 16 KB
-
 CO2 ice 420Mio.years.jpg 946 × 337; 48 KB
-
 CO2 mineralization.jpg 1.208 × 883; 92 KB
-
 CO2 mitigation curves 2° dt.jpg 1.335 × 751; 315 KB
-
 CO2 ozean.gif 505 × 440; 13 KB
-
 CO2 ppm 1980-2018.png 700 × 543; 86 KB
-
 CO2 separation utilisation.gif 1.500 × 632; 244 KB
-
 CO2 sources sinks.jpg 861 × 472; 67 KB
-
 CO2 sources sinks2022.jpg 861 × 472; 179 KB
-
 CO2 szenarien.jpg 568 × 449; 136 KB
-
 CO2 temp 2300.jpg 563 × 513; 106 KB
-
 CO2 temp 3000 stabileKonzentration.jpg 559 × 506; 100 KB
-
 CO2 temp 720000.jpg 1.022 × 438; 143 KB
-
 CO2 trend aktuell.png 682 × 509; 84 KB
-
 CO2 und Mikroalgen.jpg 948 × 483; 83 KB
-
 C emissions 1990-2019.png 1.852 × 1.042; 46 KB
-
 C fluxes-geological-dt.jpg 982 × 757; 255 KB
-
 Ca Wildfire09Nov2018.png 620 × 413; 371 KB
-
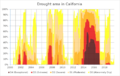 Cal-Drought area.png 1.024 × 650; 108 KB
-
 Cal 2017 burned area.jpg 563 × 653; 477 KB


