Verwaiste Dateien
Aus Klimawandel
Bitte beachten Sie, dass andere Webseiten eine Datei mit einer direkten URL verlinken können. Sie könnte daher hier aufgelistet sein, obwohl sie in aktiver Verwendung ist.
Unten werden bis zu 100 Ergebnisse im Bereich 1 bis 100 angezeigt.
-
 Sommer2100.gif 728 × 549; 33 KB
-
 Frankreich2003.gif 324 × 267; 13 KB
-
 Permafrostverbreitung.gif 300 × 342; 34 KB
-
 Groenland.gif 221 × 393; 36 KB
-
 Jakobshavn.gif 575 × 416; 86 KB
-
 Groenland3000-5000.jpg 428 × 341; 92 KB
-
 Antarktis.gif 354 × 365; 22 KB
-
 Eisschmelzen.gif 481 × 205; 7 KB
-
 Antarktische hi.gif 472 × 467; 43 KB
-
 Reaktionsgleichung1.gif 303 × 52; 2 KB
-
 Reaktionsgleichung2.gif 212 × 60; 2 KB
-
 Reaktionsgleichung3.gif 363 × 29; 1 KB
-
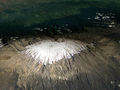 Kilimanjaro glaciers 1993.jpg 720 × 540; 174 KB
-
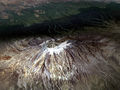 Kilimanjaro glaciers 2000.jpg 720 × 540; 179 KB
-
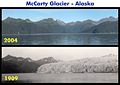 McCarty Glacier.jpg 800 × 565; 69 KB
-
 Meeresspiegel bevoelkerung.gif 480 × 254; 8 KB
-
 Aufbau der Atmosphäre.gif 543 × 728; 27 KB
-
 Chem. Zusammensetzung der Atmosphäre.gif 660 × 394; 14 KB
-
 Zirkulation abb1.gif 659 × 348; 14 KB
-
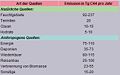 Tabelle Methanquellen.jpg 398 × 250; 16 KB
-
 Hurrikan-sst.gif 436 × 385; 15 KB
-
 Hurrikan-kategorien.gif 393 × 278; 16 KB
-
 Hurrikan-intensitaet.gif 438 × 282; 17 KB
-
 Sulfatwirkung1990.gif 567 × 368; 30 KB
-
 Aerosolwirkung oben unten.gif 412 × 536; 14 KB
-
 Carbonat ionen.jpg 793 × 541; 111 KB
-
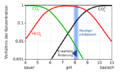 Karbonatsystem Meerwasser de.png 540 × 334; 41 KB
-
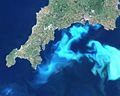 Cornwall algenbluete.jpg 750 × 600; 108 KB
-
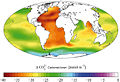
 Temp 21C Karte.gif 645 × 443; 34 KB
-
 OzeanischerKohlenstoffkreislauf.gif 627 × 527; 19 KB
-
 T-trend1901-2005 horizontal.gif 654 × 412; 47 KB
-
 PDSI.gif 567 × 601; 53 KB
-
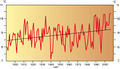
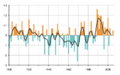 Winter-NAO-Index.png 800 × 499; 54 KB
-
 Waldbrandgefahr-Russland.gif 607 × 353; 7 KB
-
 Temperatur 2100.gif 453 × 418; 16 KB
-
 Meeresspiegelanstieg nildelta.gif 491 × 286; 16 KB
-
 Aerosole dimming.gif 447 × 318; 9 KB
-
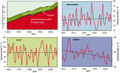
 Nao abb1.gif 621 × 433; 18 KB
-
 Senegal reforestation.jpg 450 × 310; 87 KB
-
 Aralship2.jpg 800 × 600; 90 KB
-
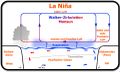 MeteoLaNina.jpg 480 × 289; 40 KB
-
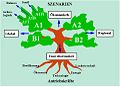 Szenarien1.jpg 480 × 349; 46 KB
-
 Modelle4.gif 454 × 630; 26 KB
-
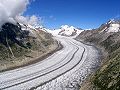 Grosser Aletschgletscher 3196.jpg 480 × 360; 70 KB
-
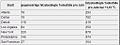 Hitzebedingte Todesfälle.jpg 509 × 192; 20 KB
-
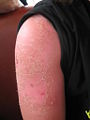 Sonnenbrand.JPG 768 × 1.024; 75 KB
-
 VerbreitungMalaria1961-1990.gif 790 × 390; 12 KB
-
 MalariaKolumbienElNino.gif 554 × 398; 57 KB
-
 PrognosenMalaria2020.gif 789 × 369; 13 KB
-
 Atmosphaere ozean.jpg 634 × 294; 99 KB
-
 Meereis modelle.jpg 640 × 469; 97 KB
-
 Temp2100 geographisch.jpg 350 × 587; 198 KB
-
 Zonal 2100.jpg 615 × 390; 78 KB
-
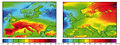
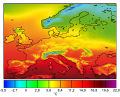
 Europa Temp Differenz JJA.jpg 488 × 386; 175 KB
-
 Ozon2.png 290 × 60; 5 KB
-
 Ozon3.png 275 × 34; 4 KB
-
 Ozon4.png 339 × 31; 4 KB
-
 The Earth seen from Apollo 17.jpg 599 × 599; 99 KB
-
 Glacier Mass Balance Map.png 650 × 477; 108 KB
-
 Wiki nachfragekurve.png 865 × 399; 6 KB
-
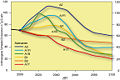 Aerosolszenarien.jpg 575 × 383; 102 KB
-
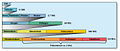 Klimageschichte.jpg 734 × 312; 90 KB
-
 Schwefelgehalt 2100.jpg 493 × 346; 85 KB
-
 Ostsee wintertemp 2100.jpg 498 × 409; 124 KB
-
 D temp2100.jpg 664 × 370; 81 KB
-
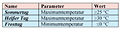 Kenntage.jpg 356 × 95; 30 KB
-
 Eu temp diff2100 JJA-DJF.jpg 764 × 288; 212 KB
-
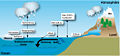
 CO2-kreislauf.gif 550 × 535; 35 KB
-
 Nordamerika tempA1B.jpg 372 × 679; 262 KB
-
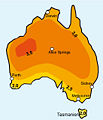 Australien temp2100.jpg 274 × 320; 44 KB
-
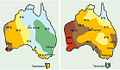 Australien ns2100.jpg 554 × 321; 92 KB
-
 OH 1978 2004.jpg 533 × 219; 51 KB
-
 CH4 emissions1985-2003.jpg 633 × 275; 101 KB
-
 Temp eu1000.jpg 493 × 302; 71 KB
-
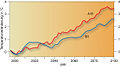
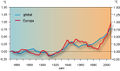 Temp eu global.jpg 551 × 325; 69 KB
-
 Eu temp geogr 1961-1990.jpg 480 × 386; 174 KB
-
 Europa hitzewellen.jpg 395 × 422; 196 KB
-
 De temp1761-2007.jpg 669 × 317; 132 KB
-
 HH temp1901-2007.jpg 405 × 234; 61 KB
-
 CO2 anteile.jpg 741 × 448; 194 KB
-
 De prec1900-2007.jpg 599 × 377; 157 KB
-
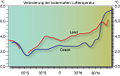
 Aerosole temperatur geogr.jpg 599 × 292; 132 KB
-
 Indian Haze NASA.jpg 720 × 480; 314 KB
-
 Gletschergebiete.jpg 401 × 381; 78 KB
-
 Med temp geogr 1961-1990.jpg 540 × 288; 124 KB
-
 HH prec.jpg 387 × 248; 56 KB
-
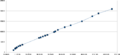
 CO2-Emissionen1990-2008.jpg 450 × 342; 53 KB
-
 Temp winter2009-10.jpg 675 × 399; 191 KB
-
 China temp 20Jh.jpg 571 × 284; 71 KB
-
 Monsunniederschlag indien.jpg 304 × 379; 44 KB
-
 Niederschlag2100.jpg 688 × 461; 208 KB
-
 Temp global juli2010.jpg 596 × 405; 303 KB
-
 Vb Sachsen.jpg 472 × 328; 37 KB
-
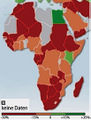 Afrika agrarproduktion2080.jpg 205 × 270; 46 KB
-
 Hurr4-5 heute proj.jpg 621 × 267; 70 KB
-
 Langl Hurr Atl 1878-2006.jpg 624 × 353; 83 KB
-
 Hurr Atl 1878-2006.jpg 624 × 324; 99 KB
-
 Landanteil 1950 2002.jpg 512 × 341; 52 KB
-
 Iberien prec proj2100.jpg 480 × 395; 111 KB
-
 Feuchte Tage1951-2003.jpg 520 × 301; 71 KB


