Dateiliste
Aus Klimawandel
Diese Spezialseite listet alle hochgeladenen Dateien auf.
| Datum | Name | Vorschaubild | Größe | Benutzer | Beschreibung | Versionen |
|---|---|---|---|---|---|---|
| 20:53, 23. Mai 2021 | Sahel-LAI-change-2100-RCP8.5.jpg (Datei) |  |
197 KB | Dieter Kasang | == Beschreibung == Änderung des Blattflächen-Index (LAI = Leaf Area Index) im nördlichen Afrika im Juni-August 2071-2100 im Vergleich zu 1951-2005 nach RCP8.5 und 27 Modellsimulationen == Lizenzhinweis == {| style="border:1px solid #8888aa; background-color:#f7f8ff;padding:5px;font-size:95%;" | Quelle: Pausata, F.S.R., M. Gaetani, G. Messori (2020): [https://doi.org/10.1016/j.oneear.2020.03.002. The Greening of the Sahara: Past Changes and Future Implications], One Earth 2, 3, 235-250<br> Lize… | 1 |
| 20:46, 23. Mai 2021 | Greening Sahel 1982-1999.jpg (Datei) |  |
64 KB | Dieter Kasang | == Beschreibung == Greening im Sahel 1982-1999 nach dem NDVI-Index == Lizenzhinweis == {| style="border:1px solid #8888aa; background-color:#f7f8ff;padding:5px;font-size:95%;" | Quelle: Wikimedia Commons (2005): Greening Sahel 1982-1999, https://en.wikipedia.org/wiki/File:Greening_Sahel_1982-1999.jpg <br> Lizenz: CC BY-SA https://creativecommons.org/licenses/by-sa/2.5/deed.en |} | 1 |
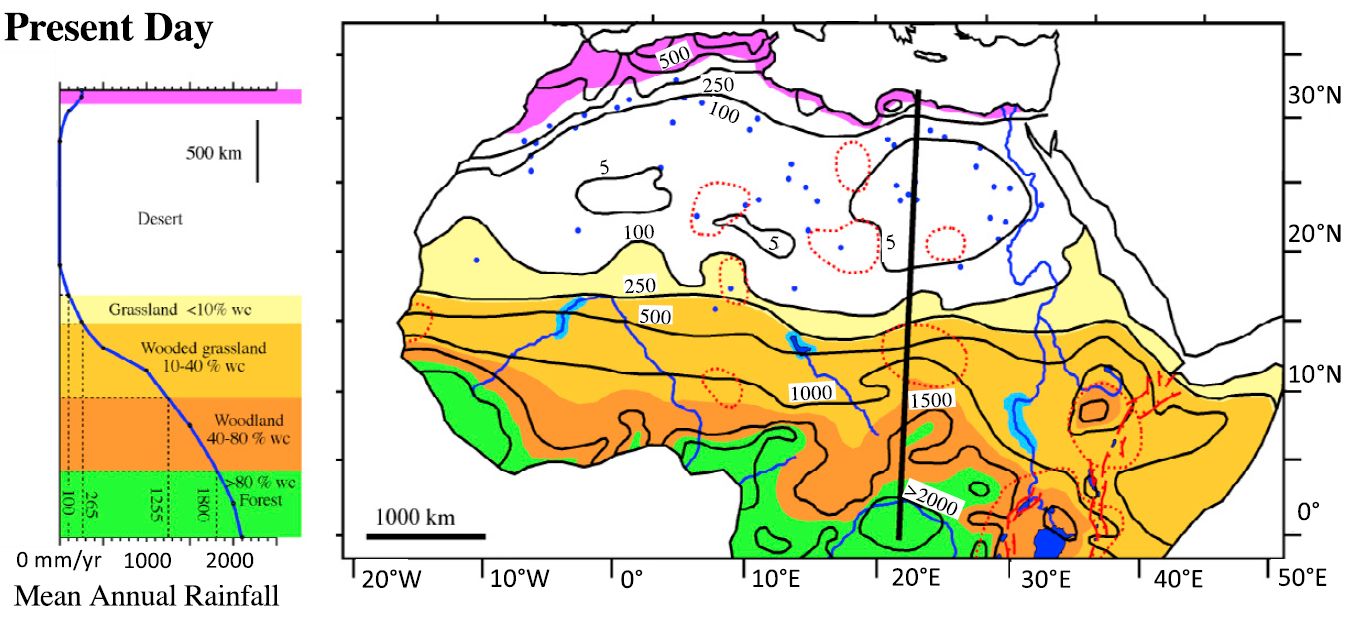
| 20:42, 23. Mai 2021 | N-Africa vegetation precipitation.jpg (Datei) |  |
136 KB | Dieter Kasang | == Beschreibung == Vegetationszonen und Niederschlag im nördlichen Afrika == Lizenzhinweis == {| style="border:1px solid #8888aa; background-color:#f7f8ff;padding:5px;font-size:95%;" | Quelle: Pausata, F.S.R., M. Gaetani, G. Messori (2020): The Greening of the Sahara: Past Changes and Future Implications, One Earth 2, 3, 235-250, https://doi.org/10.1016/j.oneear.2020.03.002.<br> Lizenz: CC BY 4.0 https://creativecommons.org/licenses/by/4.0/ |} | 1 |
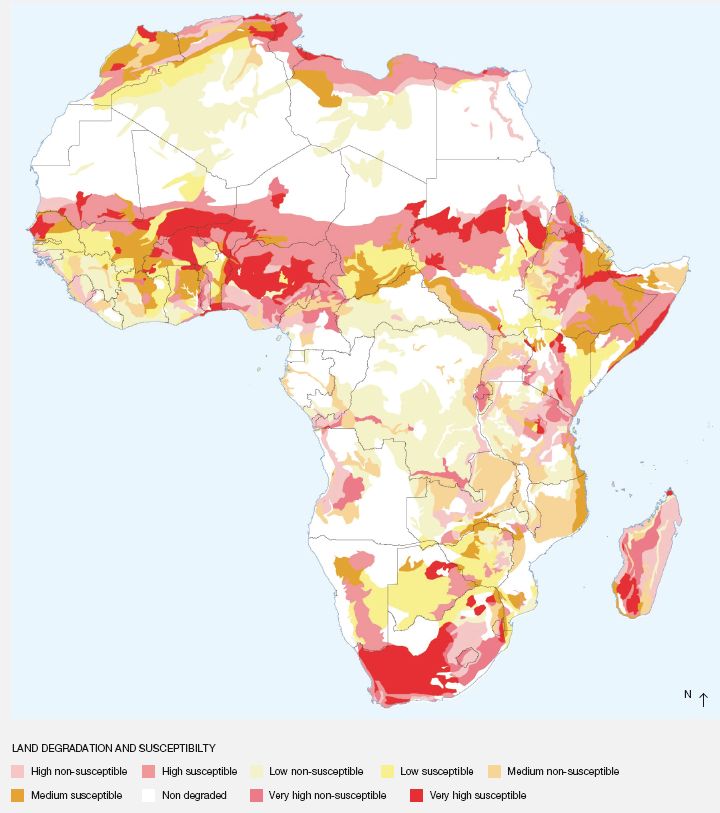
| 20:36, 23. Mai 2021 | Africa land degradation.jpg (Datei) |  |
70 KB | Dieter Kasang | == Beschreibung == Landdegradation und Risikoniveau == Lizenzhinweis == {| style="border:1px solid #8888aa; background-color:#f7f8ff;padding:5px;font-size:95%;" | Quelle: IPBES (2018): The IPBES regional assessment report on biodiversity and ecosystem services for Africa. Archer, E. Dziba, L., Mulongoy, K. J., Maoela, M. A., and Walters, M. (eds.). Secretariat of the Intergovernmental Science-Policy Platform on Biodiversity and Ecosystem Services, Bonn, Germany, http://www.ipbes.net/ <br> Lizen… | 1 |
| 20:31, 23. Mai 2021 | Africa aboveground biomass.jpg (Datei) |  |
99 KB | Dieter Kasang | == Beschreibung == Oberirdische Biomasse in Afrika == Lizenzhinweis == {| style="border:1px solid #8888aa; background-color:#f7f8ff;padding:5px;font-size:95%;" | Quelle: Martens, C., T. Hickler, C. Davis-Reddy et al. (2020): [https://doi.org/10.1111/gcb.15390 Large uncertainties in future biome changes in Africa call for flexible climate adaptation strategies], Glob. Change Biol., 27, 340–358<br> Lizenz: [http://creativecommons.org/licenses/by/4.0/ CC BY] |} | 1 |
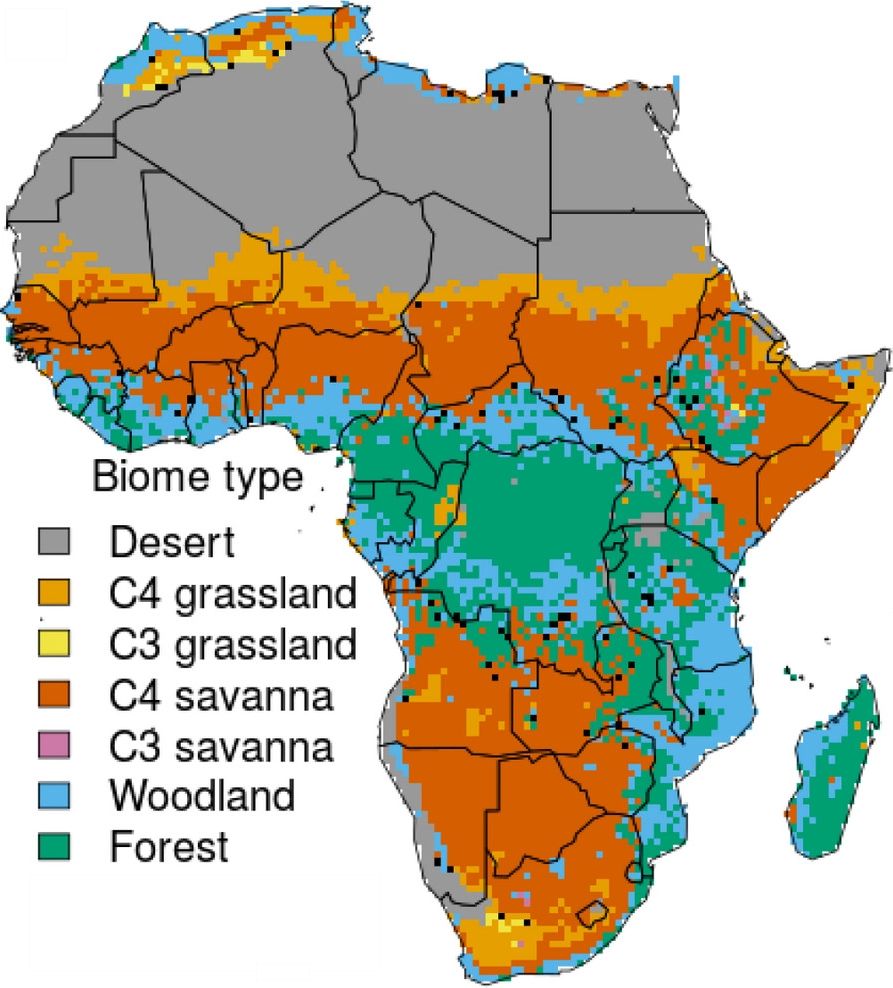
| 20:25, 23. Mai 2021 | Africa biome type.jpg (Datei) |  |
117 KB | Dieter Kasang | == Beschreibung == Ökoregionen (Biome) in Afrika == Lizenzhinweis == {| style="border:1px solid #8888aa; background-color:#f7f8ff;padding:5px;font-size:95%;" | Quelle: Martens, C., T. Hickler, C. Davis-Reddy et al. (2020): Large uncertainties in future biome changes in Africa call for flexible climate adaptation strategies, Glob. Change Biol., 27, 340–358, https://doi.org/10.1111/gcb.15390<br> Lizenz: CC BY http://creativecommons.org/licenses/by/4.0/ |} | 1 |
| 18:24, 18. Mai 2021 | Drylands population.jpg (Datei) |  |
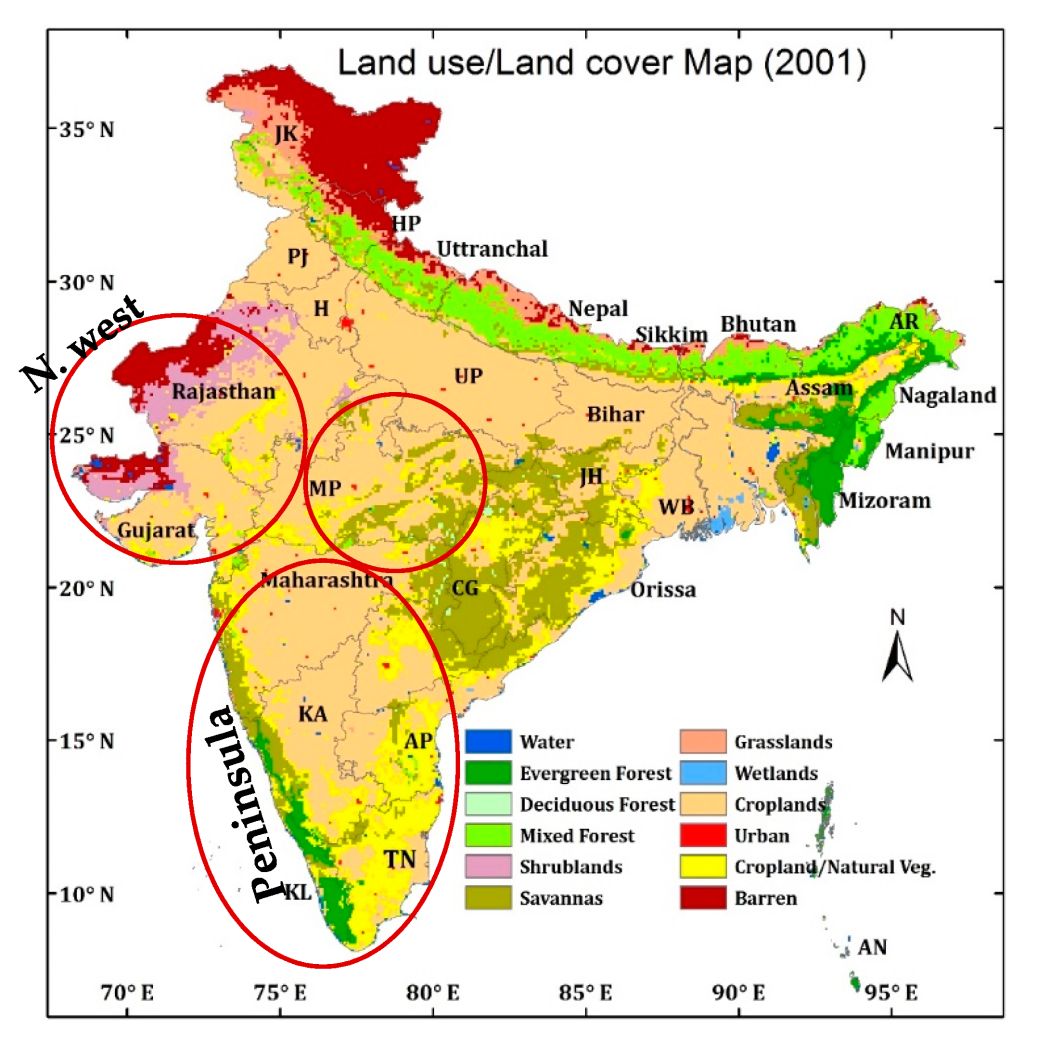
17 KB | Dieter Kasang | == Beschreibung == Landnutzung und Landbedeckung in Indien 2001 (Kreise: Untersuchungsgebiete der Studie) ==Lizenzhinweis== {| style="border:1px solid #8888aa; background-color:#f7f8ff;padding:5px;font-size:95%;" | Quelle: Parida, B.R., A.C. Pandey, N.R. Patel (2020): [https://doi.org/10.3390/cli8080092 Greening and Browning Trends of Vegetation in India and Their Responses to Climatic and Non-Climatic Drivers]. Climate. 2020; 8(8):92. <br>[http://www.grida.no/publications/425 GRID Arendal] <… | 1 |
| 17:06, 18. Mai 2021 | India land-use 2001.jpg (Datei) |  |
148 KB | Dieter Kasang | Landnutzung und Landbedeckung in Indien 2001 ==Lizenzhinweis== {| style="border:1px solid #8888aa; background-color:#f7f8ff;padding:5px;font-size:95%;" | Quelle: Parida, B.R., A.C. Pandey, N.R. Patel (2020): Greening and Browning Trends of Vegetation in India and Their Responses to Climatic and Non-Climatic Drivers. Climate. 2020; 8(8):92. https://doi.org/10.3390/cli8080092 <br>[http://www.grida.no/publications/425 GRID Arendal] <br /> Lizenz: CC BY https://creativecommons.org/licenses/by/4.0/… | 1 |
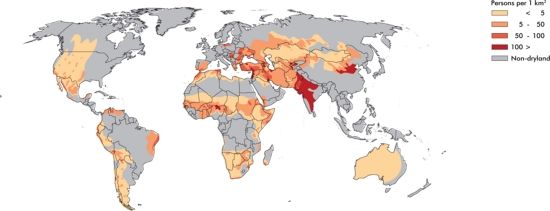
| 17:48, 14. Mai 2021 | Global drylands subtypes.jpg (Datei) |  |
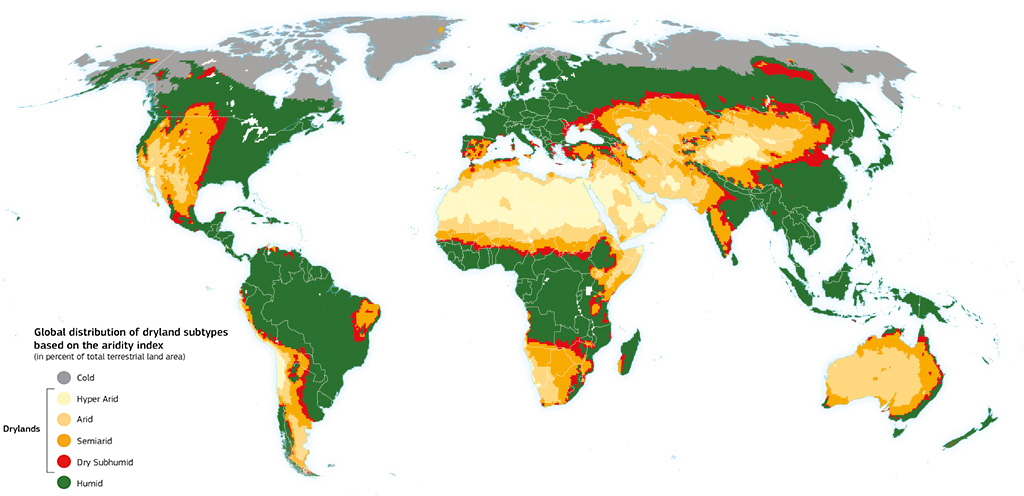
237 KB | Dieter Kasang | == Beschreibung == Globale Trockengebiete == Lizenzhinweis == {| style="border:1px solid #8888aa; background-color:#f7f8ff;padding:5px;font-size:95%;" | Quelle: McSweeney, CarbonBrief (2019): ‘Desertification’ and the role of climate change https://www.carbonbrief.org/explainer-desertification-and-the-role-of-climate-change <br> Lizenz: CC BY-NC-ND 4.0 https://creativecommons.org/licenses/by-nc-nd/4.0/legalcode |} | 1 |
| 17:41, 14. Mai 2021 | Drylands land use.jpg (Datei) |  |
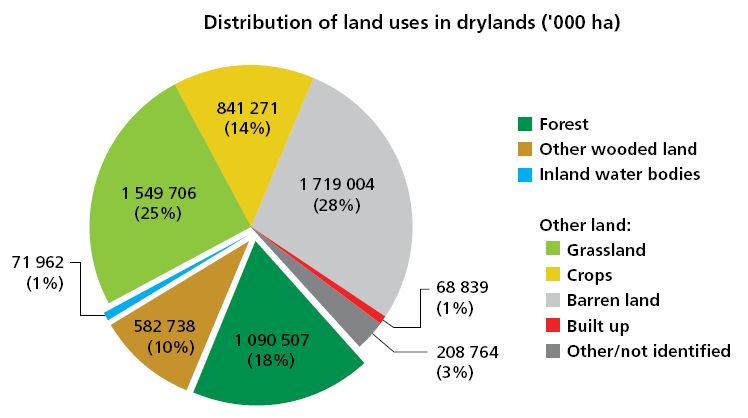
37 KB | Dieter Kasang | Landnutzung in Trockengebieten in 1000 ha und in %. == Lizenzhinweis == {| style="border:1px solid #8888aa; background-color:#f7f8ff;padding:5px;font-size:95%;" | Quelle: FAO (2019): Trees, forests and land use in drylands: the first global assessment – Full report. FAO Forestry Paper No. 184. Rome.<br> Lizenz: CC [https://creativecommons.org/licenses/by-nc-sa/4.0/ BY-NC-SA] |} | 1 |
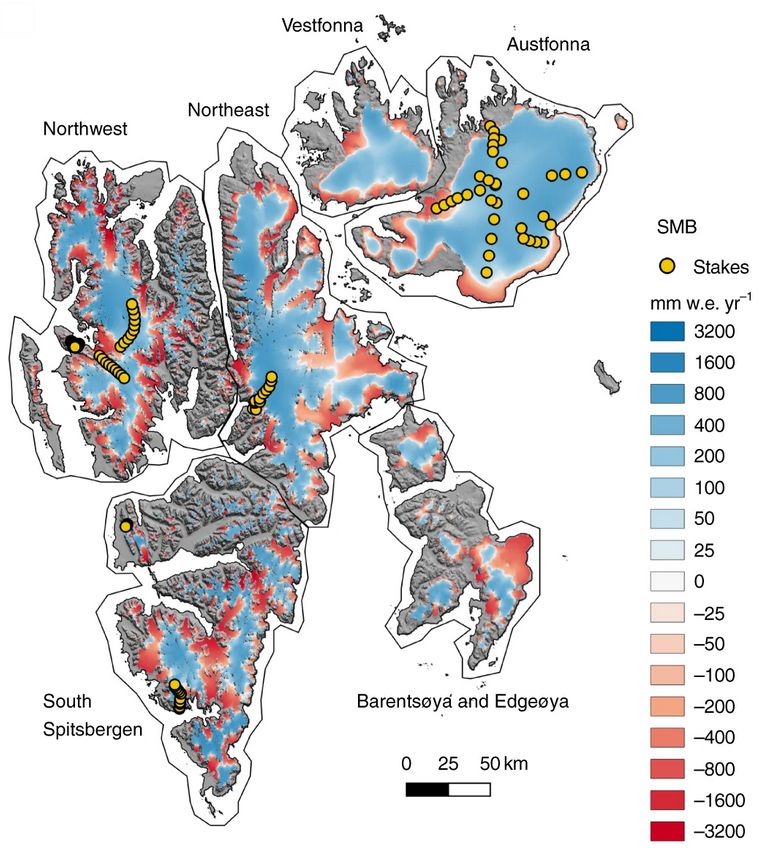
| 10:28, 10. Mai 2021 | Spitzbergen Ablationszone 2005-2012 2013.jpg (Datei) |  |
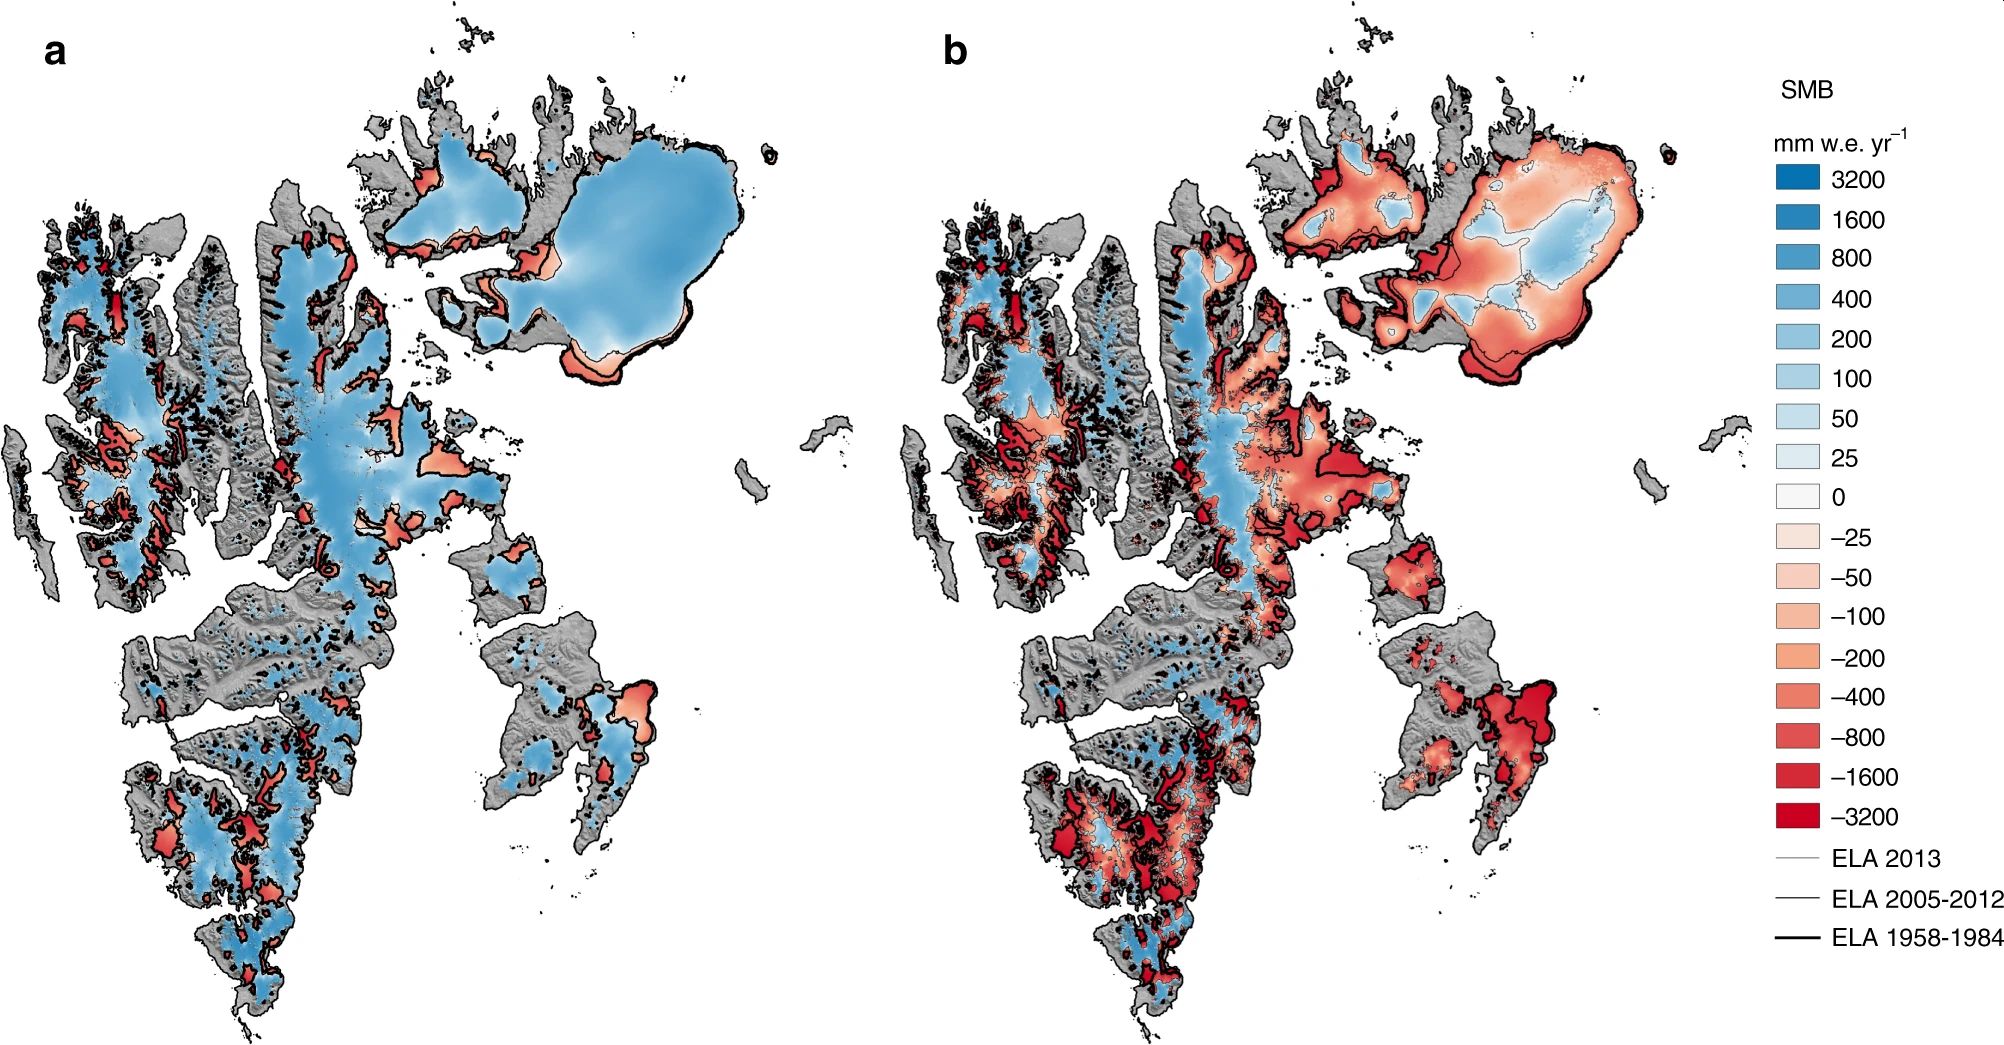
322 KB | Dieter Kasang | == Beschreibung == Oberflächenmassenbilanz (SMB) in mm Wasseräquivalent/Jahr (mm w.e. yr-1) 2005-2012 und 2013 sowie die Lage der Gleichgewichtszone (ELA) ==Lizenzhinweis== {| style="border:1px solid #8888aa; background-color:#f7f8ff;padding:5px;font-size:95%;" | Quelle: Noël, B., Jakobs, C.L., van Pelt, W.J.J. et al. (2020): [https://doi.org/10.1038/s41467-020-18356-1 Low elevation of Svalbard glaciers drives high mass loss variability]. Nat Commun 11, 4597, suppl. information<br /> Lizenz: [h… | 1 |
| 13:13, 7. Mai 2021 | Svalbard MB discharge.jpg (Datei) |  |
93 KB | Dieter Kasang | == Beschreibung == Oberflächenmassenbilanz (SMB), Eisabfluss und gesamte Massenbilanz 1958-2018 ==Lizenzhinweis== {| style="border:1px solid #8888aa; background-color:#f7f8ff;padding:5px;font-size:95%;" | Quelle: Noël, B., Jakobs, C.L., van Pelt, W.J.J. et al. (2020): [https://doi.org/10.1038/s41467-020-18356-1 Low elevation of Svalbard glaciers drives high mass loss variability]. Nat Commun 11, 4597, suppl. information<br /> Lizenz: [http://creativecommons.org/licenses/by/4.0/ CC BY] |} | 1 |
| 13:11, 7. Mai 2021 | Svalbard SMB 1958-2018.jpg (Datei) |  |
129 KB | Dieter Kasang | == Beschreibung == Oberflächenmassenbilanz (SMB) in mm Wasseräquivalent/Jahr (mm w.e. yr-1) 1958-2018 ==Lizenzhinweis== {| style="border:1px solid #8888aa; background-color:#f7f8ff;padding:5px;font-size:95%;" | Quelle: Noël, B., Jakobs, C.L., van Pelt, W.J.J. et al. (2020): [https://doi.org/10.1038/s41467-020-18356-1 Low elevation of Svalbard glaciers drives high mass loss variability]. Nat Commun 11, 4597, suppl. information<br /> Lizenz: [http://creativecommons.org/licenses/by/4.0/ CC BY] |} | 1 |
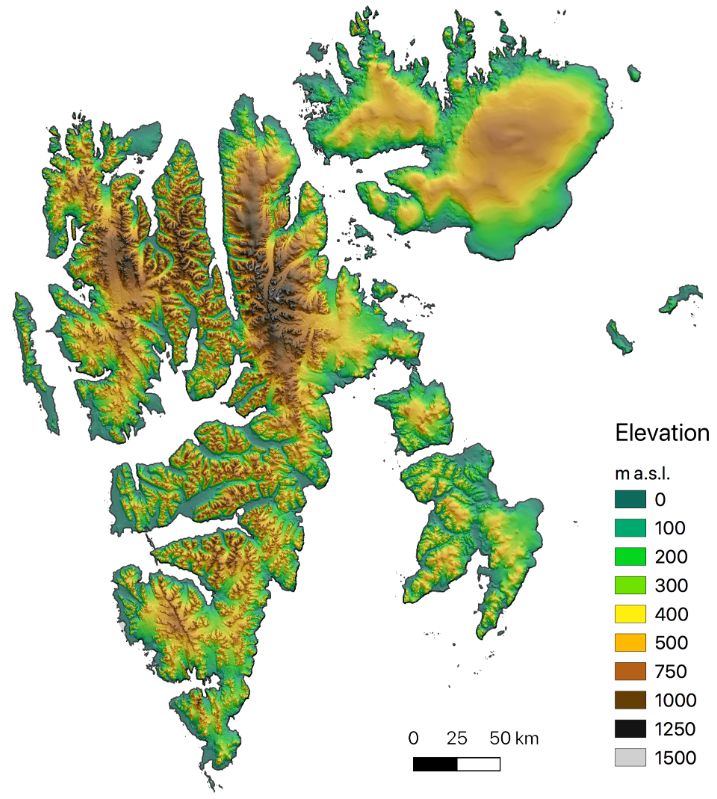
| 13:07, 7. Mai 2021 | Svalbard elevation.jpg (Datei) |  |
104 KB | Dieter Kasang | Höhenkarte von Spitzbergen ==Lizenzhinweis== {| style="border:1px solid #8888aa; background-color:#f7f8ff;padding:5px;font-size:95%;" | Quelle: Noël, B., Jakobs, C.L., van Pelt, W.J.J. et al. (2020): Low elevation of Svalbard glaciers drives high mass loss variability. Nat Commun 11, 4597, suppl. information. https://doi.org/10.1038/s41467-020-18356-1 <br /> Lizenz: CC BY http://creativecommons.org/licenses/by/4.0/ |} | 1 |
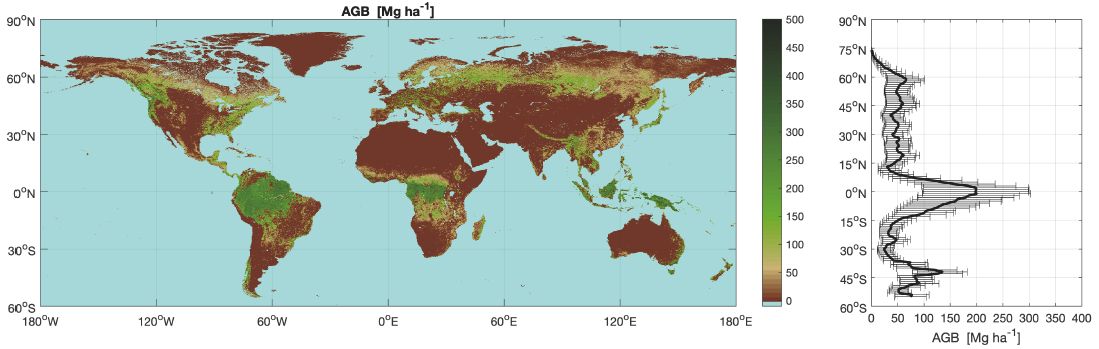
| 20:13, 6. Mai 2021 | Above Ground Biomasse.jpg (Datei) |  |
61 KB | Dieter Kasang | == Beschreibung == Oberirdische Biomasse (AGB=Above Ground Biomass) in Mg C (t Kohlenstoff) pro ha in 2010 (Karte) und nach Breitengrad (rechts). == Lizenzhinweis == {| style="border:1px solid #8888aa; background-color:#f7f8ff;padding:5px;font-size:95%;" | Quelle: Santoro, M., O. Cartus, N. Carvalhais et al. (2020): The global forest above-ground biomass pool for 2010 estimated from high-resolution satellite observations, Earth Syst. Sci. Data Discuss. [preprint], https://doi.org/10.5194/essd… | 1 |
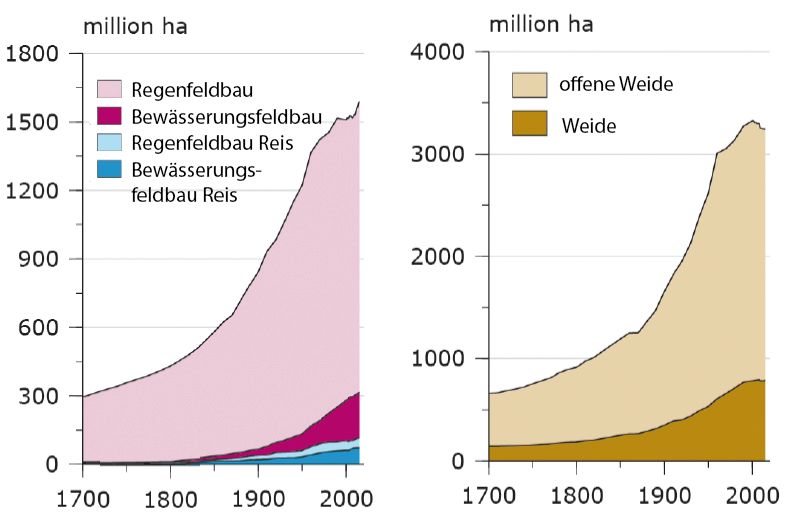
| 20:09, 6. Mai 2021 | Anbauland Weide 1700-2010.jpg (Datei) |  |
42 KB | Dieter Kasang | == Beschreibung == Anbaufläche, Weideland (rangeland) und Wiesen (pasture) 1700 bis 2010 == Lizenzhinweis == {| style="border:1px solid #8888aa; background-color:#f7f8ff;padding:5px;font-size:95%;" | Quelle: Klein Goldewijk, K., Beusen, A., Doelman, J., and Stehfest, E.: [https://doi.org/10.5194/essd-9-927-2017 Anthropogenic land use estimates for the Holocene – HYDE 3.2], Earth Syst. Sci. Data, 9, 927–953<br> Lizenz: [https://creativecommons.org/licenses/by/3.0/ CC BY] |} | 1 |
| 20:15, 5. Mai 2021 | Meeresspiegel 65Mio Jahre.jpg (Datei) |  |
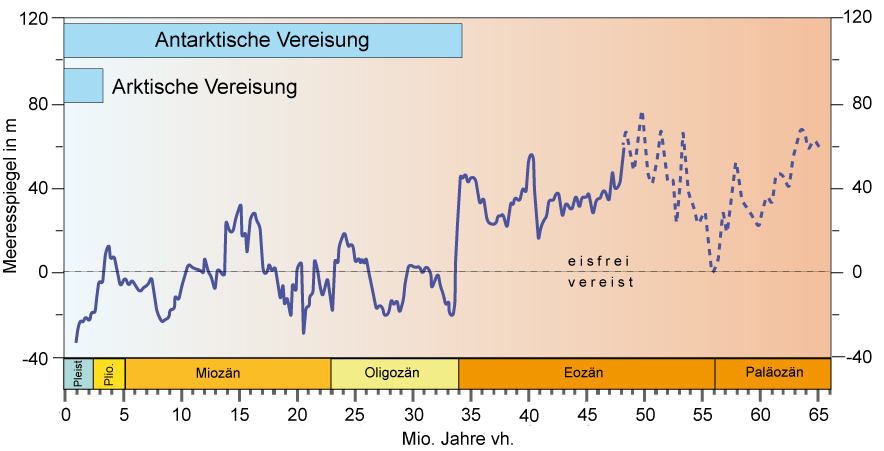
140 KB | Dieter Kasang | Veränderung des Meeresspiegels über die letzten 65 Mio. Jahre (Känozoikum). Gestrichelte Linie: unsichere Datenlage. ==Lizenzhinweis== {| style="border:1px solid #8888aa; background-color:#f7f8ff;padding:5px;font-size:95%;" |Quelle: Miller, K.G., W.J. Schmelz, J.V. Browning et al. (2020): Ancient Sea Level as Key to Future, Oceanography 33, 2, 33-41<br> Lizenz: CC BY https://creativecommons.org/licenses/by/4.0/ |} | 1 |
| 16:20, 21. Apr. 2021 | Rangeland-pasture-6000-2000.jpg (Datei) |  |
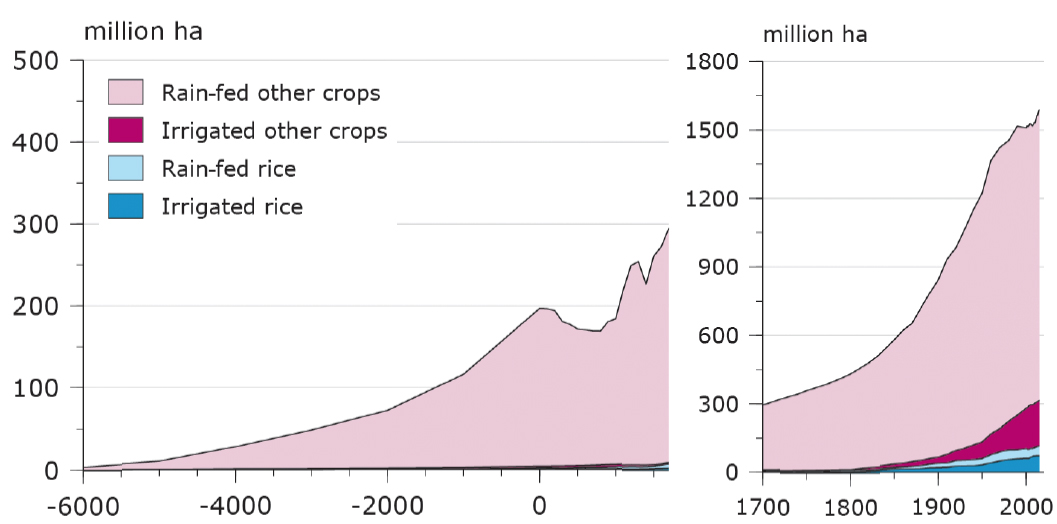
93 KB | Dieter Kasang | == Beschreibung == Weideland (rangeland) und Wiesen (pasture) 8000 vh. bis 2010 == Lizenzhinweis == {| style="border:1px solid #8888aa; background-color:#f7f8ff;padding:5px;font-size:95%;" | Quelle: Klein Goldewijk, K., Beusen, A., Doelman, J., and Stehfest, E.: [https://doi.org/10.5194/essd-9-927-2017 Anthropogenic land use estimates for the Holocene – HYDE 3.2], Earth Syst. Sci. Data, 9, 927–953<br> Lizenz: [https://creativecommons.org/licenses/by/3.0/ CC BY] |} | 1 |
| 16:14, 21. Apr. 2021 | Cropland-6000-2000.jpg (Datei) |  |
101 KB | Dieter Kasang | == Beschreibung == Anbaufläche 8000 vh. bis 2010 == Lizenzhinweis == {| style="border:1px solid #8888aa; background-color:#f7f8ff;padding:5px;font-size:95%;" | Quelle: Klein Goldewijk, K., Beusen, A., Doelman, J., and Stehfest, E.: Anthropogenic land use estimates for the Holocene – HYDE 3.2, Earth Syst. Sci. Data, 9, 927–953, https://doi.org/10.5194/essd-9-927-2017<br> Lizenz: CC BY https://creativecommons.org/licenses/by/3.0/ |} | 1 |
| 15:28, 21. Apr. 2021 | Land-use change850-2100.jpg (Datei) |  |
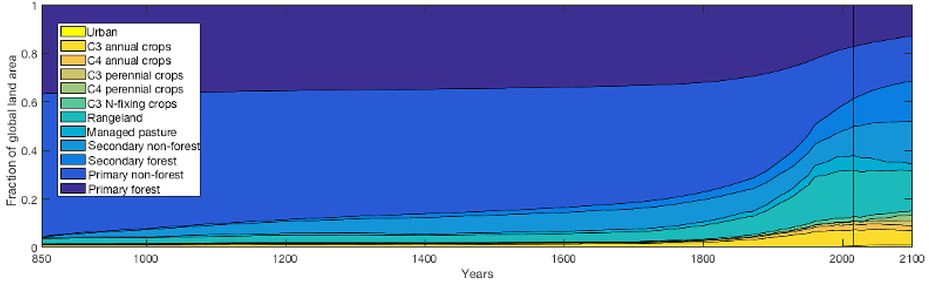
33 KB | Dieter Kasang | == Beschreibung == Landnutzungsänderungen 850-2100. Nach 2015 nach dem Szenario SSP1. == Lizenzhinweis == {| style="border:1px solid #8888aa; background-color:#f7f8ff;padding:5px;font-size:95%;" | Quelle: Hurtt, G.C., Chini, L.P., Frolking, S. et al. (2011): [https://doi.org/10.1007/s10584-011-0153-2 Harmonization of land-use scenarios for the period 1500–2100: 600 years of global gridded annual land-use transitions, wood harvest, and resulting secondary lands.] Climatic Change 109, 117<br> Li… | 1 |
| 12:34, 17. Mär. 2021 | EU forestation1950-2020.jpg (Datei) |  |
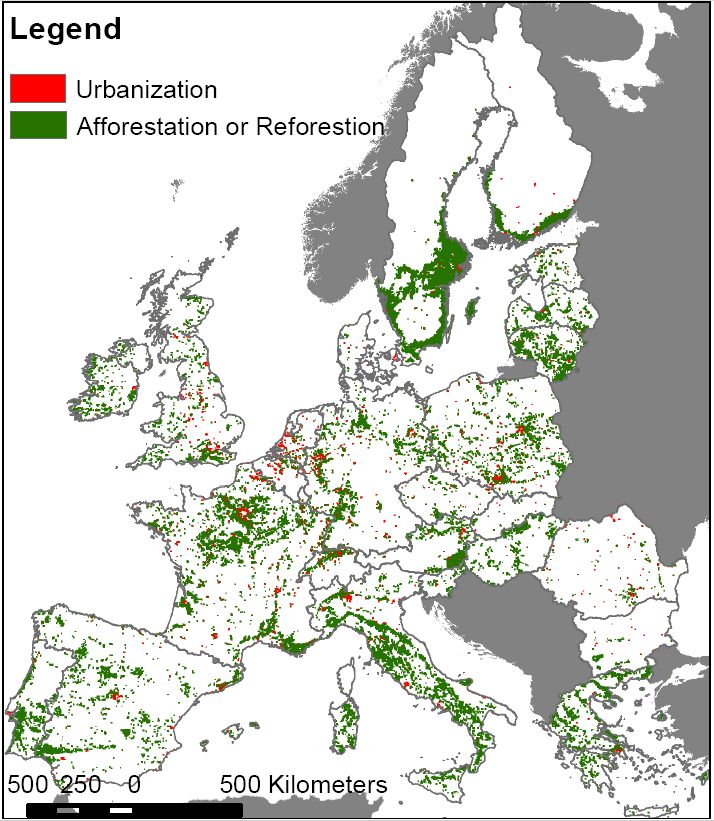
135 KB | Dieter Kasang | == Beschreibung == Waldausdehnung und Wiederbewaldung in der EU und der Schweiz 1950-2010 == Lizenzhinweis == {| style="border:1px solid #8888aa; background-color:#f7f8ff;padding:5px;font-size:95%;" | Quelle: Fuchs, R., M. Herold, P.H. Verburg, and J.G.P.W. Clevers (2013): A high-resolution and harmonized model approach for reconstructing and analysing historic land changes in Europe, Biogeosciences, 10, 1543–1559, https://doi.org/10.5194/bg-10-1543-2013<br> Lizenz: CC BY 3.0 |} | 1 |
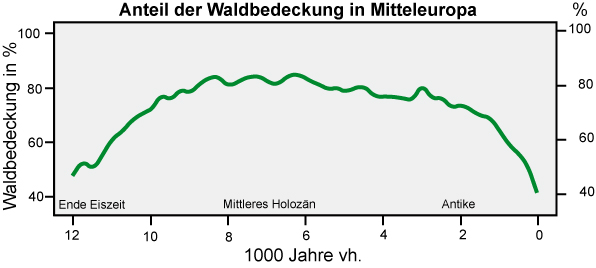
| 20:52, 15. Mär. 2021 | Waldbedeckung Mitteleuropa Holozän.jpg (Datei) |  |
41 KB | Dieter Kasang | == Beschreibung == Gegenwärtige Waldbedeckung in Europa == Lizenzhinweis == {| style="border:1px solid #8888aa; background-color:#f7f8ff;padding:5px;font-size:95%;" | Quelle: Zanon M, Davis BAS, Marquer L, Brewer S and Kaplan JO (2018): European Forest Cover During the Past 12,000 Years: A Palynological Reconstruction Based on Modern Analogs and Remote Sensing. Front. Plant Sci. 9:253. doi: 10.3389/fpls.2018.00253<br> Lizenz: CC BY |} | 1 |
| 17:53, 15. Mär. 2021 | Forest cover present large.jpg (Datei) |  |
834 KB | Dieter Kasang | Gegenwärtige Waldbedeckung in Europa == Lizenzhinweis == {| style="border:1px solid #8888aa; background-color:#f7f8ff;padding:5px;font-size:95%;" | Quelle: Zanon M, Davis BAS, Marquer L, Brewer S and Kaplan JO (2018): European Forest Cover During the Past 12,000 Years: A Palynological Reconstruction Based on Modern Analogs and Remote Sensing. Front. Plant Sci. 9:253. doi: 10.3389/fpls.2018.00253<br> Lizenz: CC BY |} | 1 |
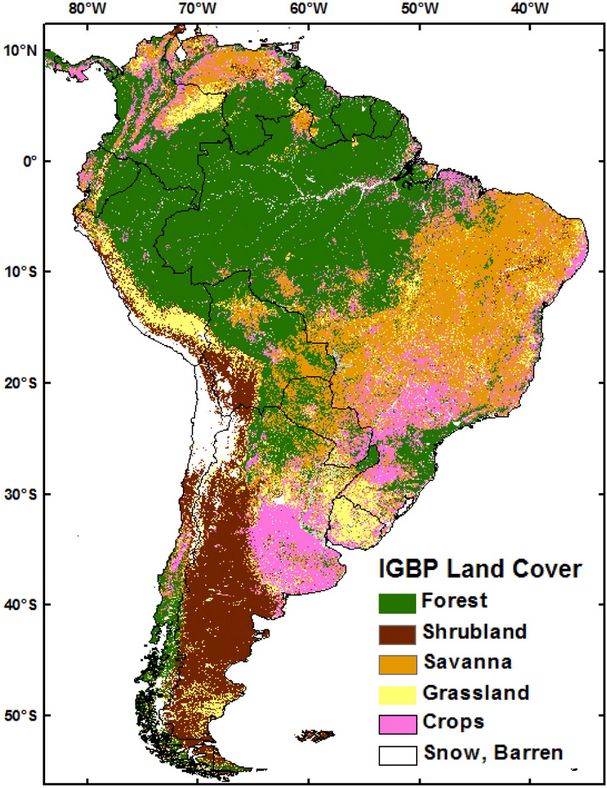
| 13:23, 24. Feb. 2021 | S-America land-cover2001.jpg (Datei) |  |
113 KB | Dieter Kasang | == Beschreibung == Landbedeckung von Südamerika im Jahr 2001. == Lizenzhinweis == {| style="border:1px solid #8888aa; background-color:#f7f8ff;padding:5px;font-size:95%;" | Quelle: Powell, R.L., E.-H. Yoo, C.J. Still (2012): Vegetation and soil carbon-13 isoscapes for South America: integrating remote sensing and ecosystem isotope measurements, Ecosphere 3, 1-25, https://doi.org/10.1890/ES12-00162.1<br> Lizenz: [http://creativecommons.org/licenses/by/3.0/ CC BY] |} | 1 |
| 13:13, 24. Feb. 2021 | W-Africa humid savanna.jpg (Datei) |  |
49 KB | Dieter Kasang | == Beschreibung == Feuchtsavanne in Westafrika in der mittleren (links) und späten Trockenzeit (rechts) == Lizenzhinweis == {| style="border:1px solid #8888aa; background-color:#f7f8ff;padding:5px;font-size:95%;" | Quelle: N’Dri, A.B., Soro, T.D., Gignoux, J. et al. Season affects fire behavior in annually burned humid savanna of West Africa. fire ecol 14, 5 (2018). https://doi.org/10.1186/s42408-018-0005-9<br> Lizenz: CC BY http://creativecommons.org/licenses/by/4.0/ |} | 1 |
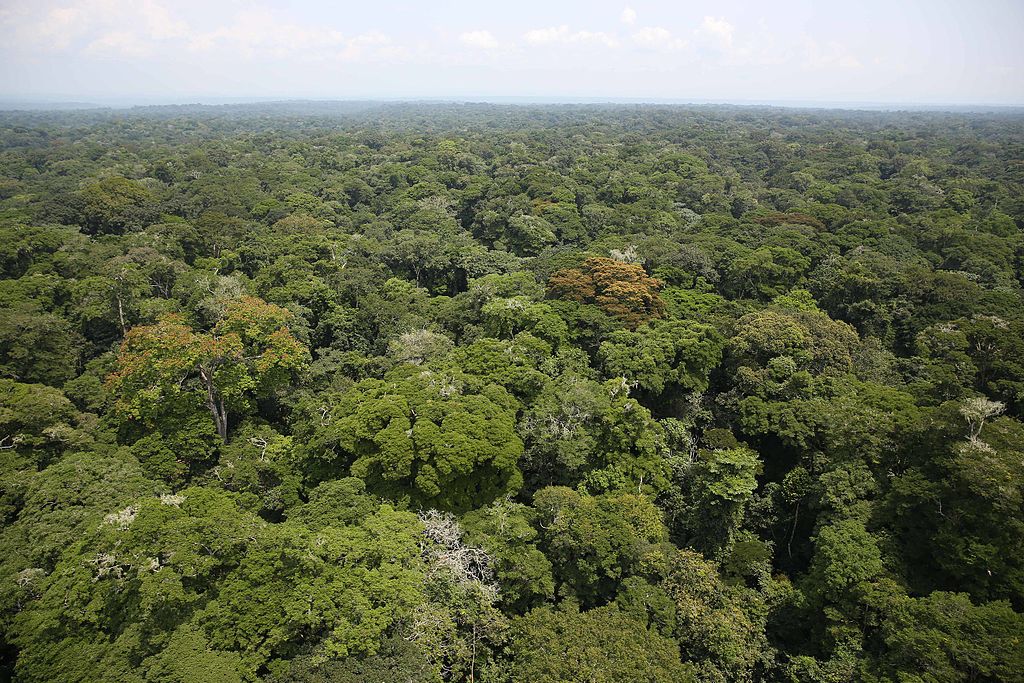
| 13:01, 24. Feb. 2021 | Rainforest Congo.jpg (Datei) |  |
239 KB | Dieter Kasang | == Beschreibung == Tropischer Regenwald in der Demokratischen Republik Kongo == Lizenzhinweis == {| style="border:1px solid #8888aa; background-color:#f7f8ff;padding:5px;font-size:95%;" | Quelle: Wikimedia Commons (2015): Rainforest Ituri, Autor: MONUSCO Photos https://www.flickr.com/people/67163702@N07, https://commons.wikimedia.org/wiki/File:Rainforest_-_Ituri_(20874628148).jpg<br> Lizenz: [http://creativecommons.org/licenses/by/4.0/ CC BY] |} | 1 |
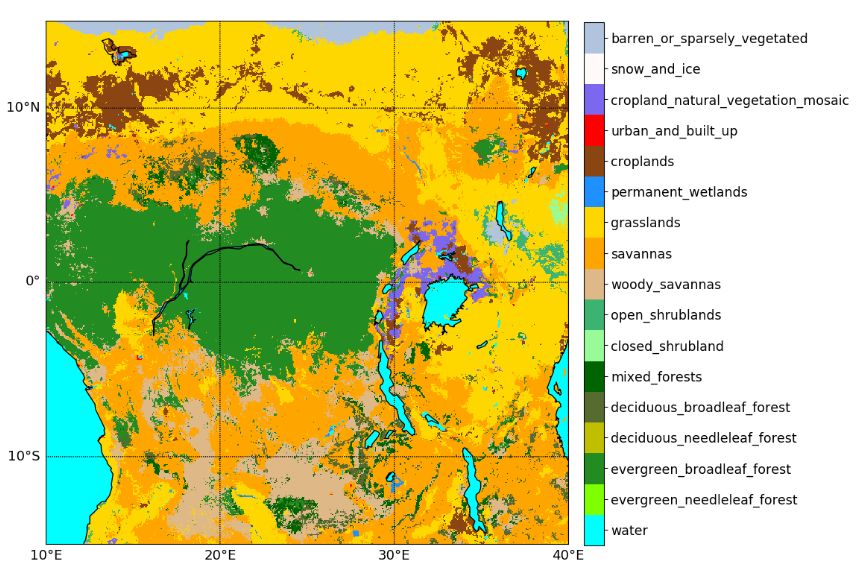
| 12:43, 24. Feb. 2021 | Central Africa land cover2010.jpg (Datei) |  |
115 KB | Dieter Kasang | == Beschreibung == Landbedeckung in Zentralafrika == Lizenzhinweis == {| style="border:1px solid #8888aa; background-color:#f7f8ff;padding:5px;font-size:95%;" | Quelle: Jiang, Y., and L. Zhou and A. Raghavendra (2020): Observed changes in fire patterns and possible drivers over Central Africa, Environmental Research Letters 15, 9, https://doi.org/10.1088/1748-9326/ab9db2<br> Lizenz: [http://creativecommons.org/licenses/by/4.0/ CC BY] |} | 1 |
| 12:36, 24. Feb. 2021 | Africa land cover2002-2017.jpg (Datei) |  |
98 KB | Dieter Kasang | Landbedeckung in Afrika südlich der Sahara == Lizenzhinweis == {| style="border:1px solid #8888aa; background-color:#f7f8ff;padding:5px;font-size:95%;" | Quelle: van Wees, D., und G.R. van der Werf (2019): Modelling biomass burning emissions and the effect of spatial resolution: a case study for Africa based on the Global Fire Emissions Database (GFED), Geosci. Model Dev., 12, 4681–4703, https://doi.org/10.5194/gmd-12-4681-2019<br> Lizenz: CC BY http://creativecommons.org/licenses/by/4.0/ |} | 1 |
| 13:00, 23. Feb. 2021 | Temp NH 300-2010.jpg (Datei) |  |
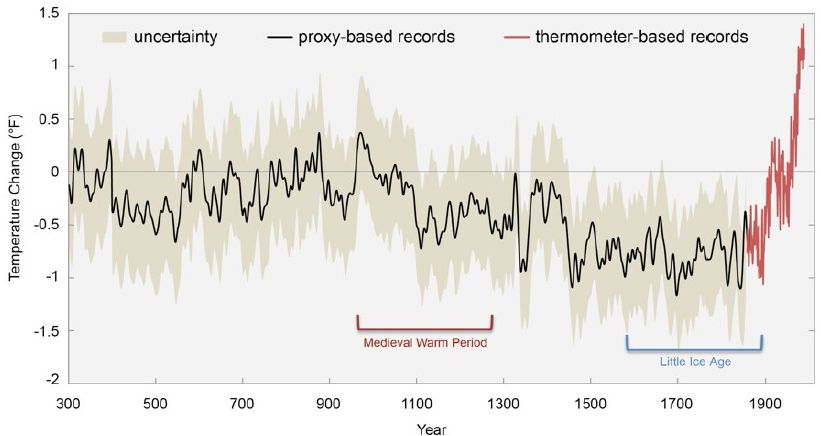
41 KB | Dieter Kasang | == Beschreibung == Temperatur der letzten 1700 Jahre in °F (1 °F Differenz = 0,56 °C Differenz) ==Lizenzhinweis== {| style="border:1px solid #8888aa; background-color:#f7f8ff;padding:5px;font-size:95%;" |Quelle: USGCRP (2017): Climate Science Special Report: Fourth National Climate Assessment, Volume I [Wuebbles, D.J., D.W. Fahey, K.A. Hibbard, D.J. Dokken, B.C. Stewart, and T.K. Maycock (eds.)]. U.S. Global Change Research Program<br> Lizenz: In all cases, permissions were secured by the U.S.… | 1 |
| 12:53, 23. Feb. 2021 | Temp global 0-2000.png (Datei) |  |
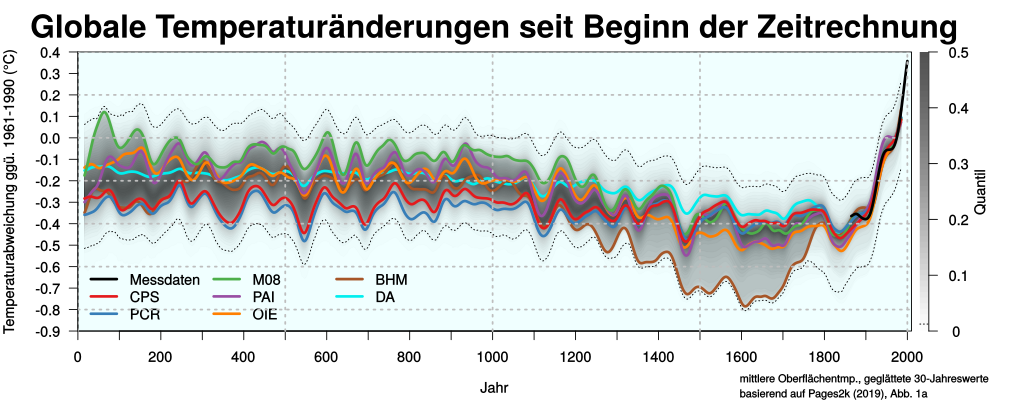
228 KB | Dieter Kasang | Temperaturänderungen der letzten 2000 Jahre ==Lizenzhinweis== {| style="border:1px solid #8888aa; background-color:#f7f8ff;padding:5px;font-size:95%;" |Quelle: Wikimedia Commons (Autor: DeWikiMan) : Temperaturanomalien der letzten 2000 Jahr, basierend auf Daten und Berechnungen von Pages2K (2019), doi:10.1038/s41561-019-0400-0, in Anlehnung an Abb. 1a, https://commons.wikimedia.org/wiki/File:Temp_anomalies_2000yrs_pages2k-de.svg<br> Lizenz: CC BY-SA https://creativecommons.org/licenses/by-sa/4… | 1 |
| 22:17, 22. Feb. 2021 | Central Africa burned area trends.jpg (Datei) |  |
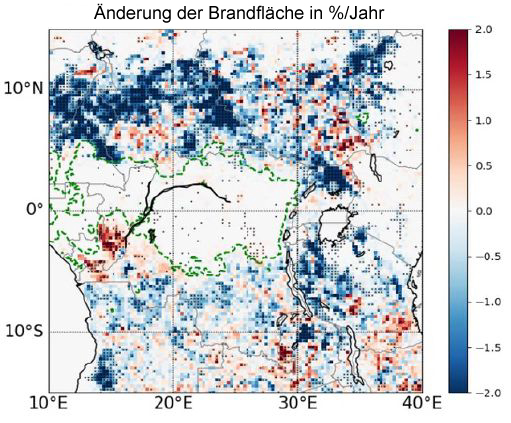
163 KB | Dieter Kasang | Änderung der jährlichen Brandflächen in Zentralafrika in % der Gitterzellen (0,25° x 0,25°) zwischen 2003 und 2017 nach Global Fire Emission Database (GFED4s) == Lizenzhinweis == {| style="border:1px solid #8888aa; background-color:#f7f8ff;padding:5px;font-size:95%;" | Quelle: Jiang, Y., L. Zhou and A. Raghavendra (2020): Observed changes in fire patterns and possible drivers over Central Africa, Environmental Research Letters 15, 9, https://iopscience.iop.org/article/10.1088/1748-9326/ab9db2… | 1 |
| 22:04, 22. Feb. 2021 | Mali savanna fire.jpg (Datei) |  |
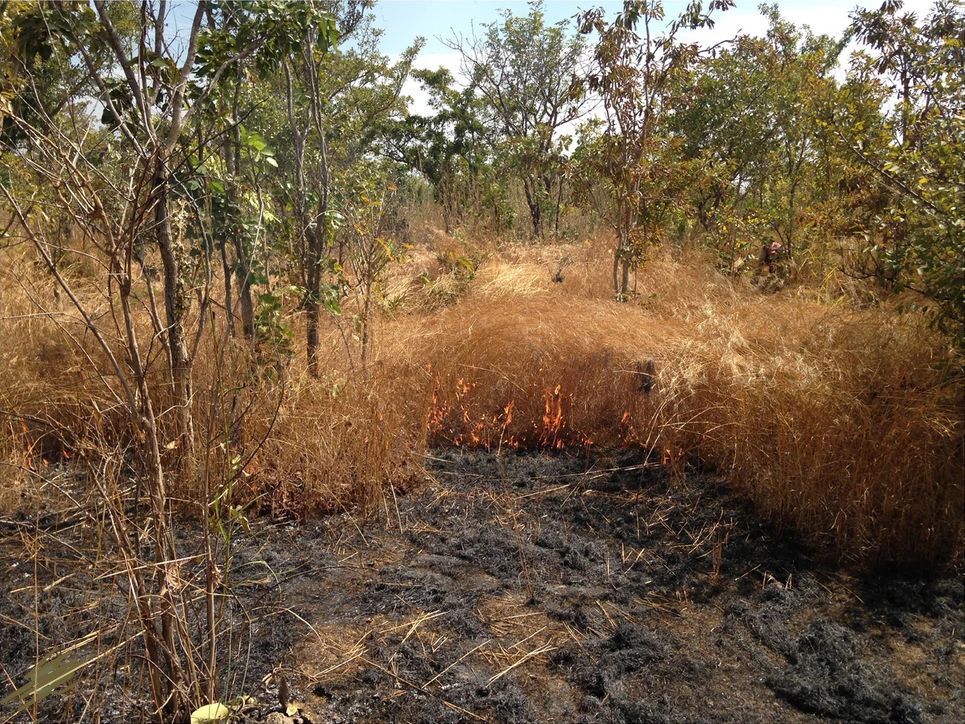
551 KB | Dieter Kasang | Feuer in der Savanne in Mali 2016 ==Lizenzhinweis== {| style="border:1px solid #8888aa; background-color:#f7f8ff;padding:5px;font-size:95%;" |Quelle: Laris, P., Jacobs, R., Koné, M. et al. Determinants of fire intensity in working landscapes of an African savanna. fire ecol 16, 27 (2020). https://doi.org/10.1186/s42408-020-00085-x Lizenz: CC BY 4.0 http://creativecommons.org/licenses/by/4.0/ |} | 1 |
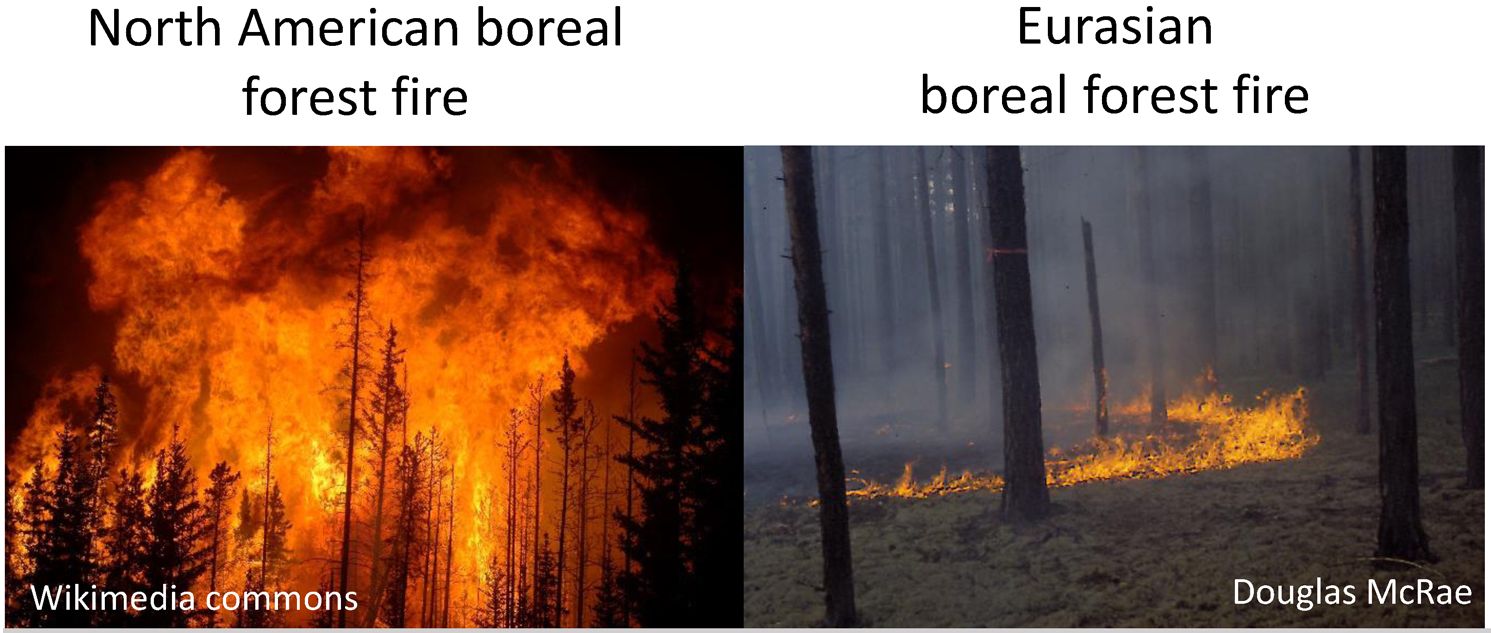
| 11:54, 20. Feb. 2021 | N-America Eurasia boreal fire.jpg (Datei) |  |
132 KB | Dieter Kasang | == Beschreibung == Kronen- und Bodenfeuer in borealen Wäldern in Nordamerika und Eurasien ==Lizenzhinweis== {| style="border:1px solid #8888aa; background-color:#f7f8ff;padding:5px;font-size:95%;" |Quelle: Archibald, S., C.E.R Lehmann and C.M. Belcher et al. (2018): Biological and geophysical feedbacks with fire in the Earth system, Environmental Research 13, 3, https://doi.org/10.1088/1748-9326/aa9ead </br> Lizenz: CC BY http://creativecommons.org/licenses/by/3.0/ |} | 1 |
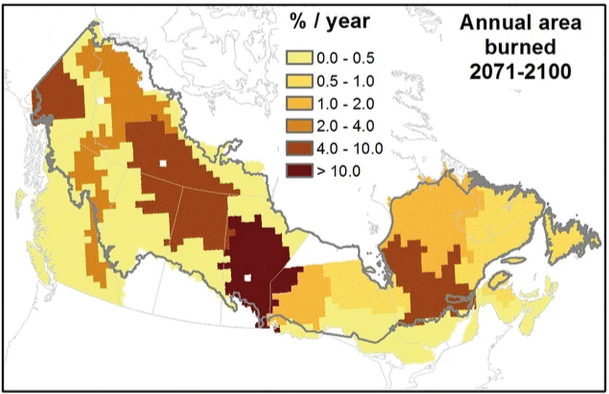
| 11:49, 20. Feb. 2021 | Canada area burned2071-2100.jpg (Datei) |  |
142 KB | Dieter Kasang | == Beschreibung == Feuerfläche in Kanada 2071-2100 in % der Gitterzelle pro Jahr ==Lizenzhinweis== {| style="border:1px solid #8888aa; background-color:#f7f8ff;padding:5px;font-size:95%;" |Quelle: Boucher, D., Gauthier, S., Thiffault, N. et al. (2020): [https://doi.org/10.1007/s11056-019-09745-6 How climate change might affect tree regeneration following fire at northern latitudes: a review.] New Forests 51, 543–571 </br> Lizenz: [https://creativecommons.org/licenses/by/4.0/ CC BY 4.0] |} | 1 |
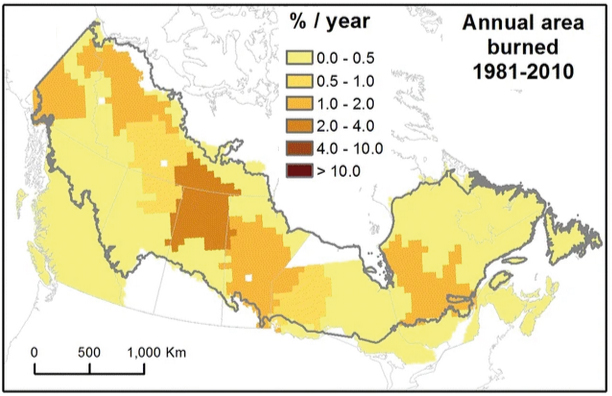
| 11:44, 20. Feb. 2021 | Canada area burned1981-2010.jpg (Datei) |  |
133 KB | Dieter Kasang | Feuerfläche in Kanada 1981-2010 in % der Gitterzellen pro Jahr ==Lizenzhinweis== {| style="border:1px solid #8888aa; background-color:#f7f8ff;padding:5px;font-size:95%;" |Quelle: Boucher, D., Gauthier, S., Thiffault, N. et al. (2020): How climate change might affect tree regeneration following fire at northern latitudes: a review. New Forests 51, 543–571 https://doi.org/10.1007/s11056-019-09745-6</br> Lizenz: CC BY 4.0 https://creativecommons.org/licenses/by/4.0/ |} | 1 |
| 22:14, 7. Feb. 2021 | Rice climate change.jpg (Datei) |  |
124 KB | Dieter Kasang | == Beschreibung == Einfluss des Klimawandels auf die Erträge von Reis 1974-2013 in t/ha/Jahr == Lizenzhinweis == {| style="border:1px solid #8888aa; background-color:#f7f8ff;padding:5px;font-size:95%;" |Quelle: Ray, D.K., P.C. West, M. Clark, J.S. Gerber, A.V. Prishchepov, S. Chatterjee (2019): Climate change has likely already affected global food production. PLoS ONE 14(5): e0217148. https://doi.org/10.1371/journal.pone.0217148<br> Lizenz [https://creativecommons.org/licenses/by-nc/4.0/ CC… | 1 |
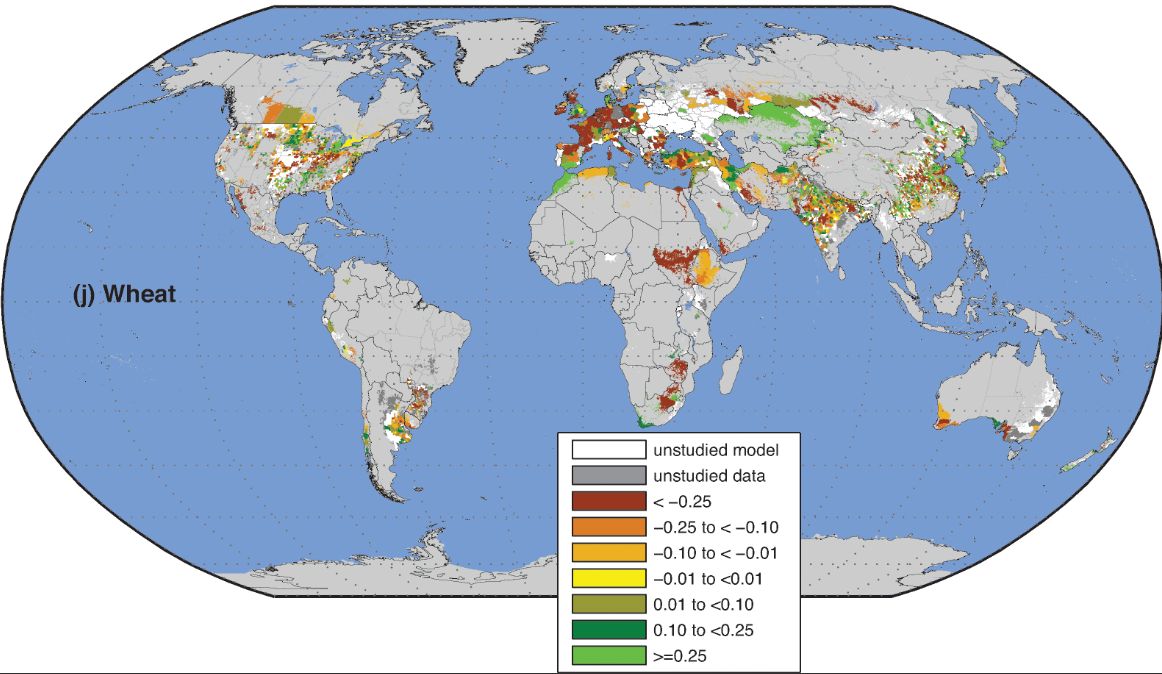
| 22:07, 7. Feb. 2021 | Wheat climate change.jpg (Datei) |  |
118 KB | Dieter Kasang | == Beschreibung == Einfluss des Klimawandels auf die Erträge verschiedener Nutzpflanzen in Tonnen pro Hektar pro Jahr == Lizenzhinweis == {| style="border:1px solid #8888aa; background-color:#f7f8ff;padding:5px;font-size:95%;" |Ray DK, West PC, Clark M, Gerber JS, Prishchepov AV, Chatterjee S (2019): [https://journals.plos.org/plosone/article?id=10.1371/journal.pone.0217148 Climate change has likely already affected global food production. PLoS ONE 14(5)] Lizenz [https://creativecommons.org/li… | 1 |
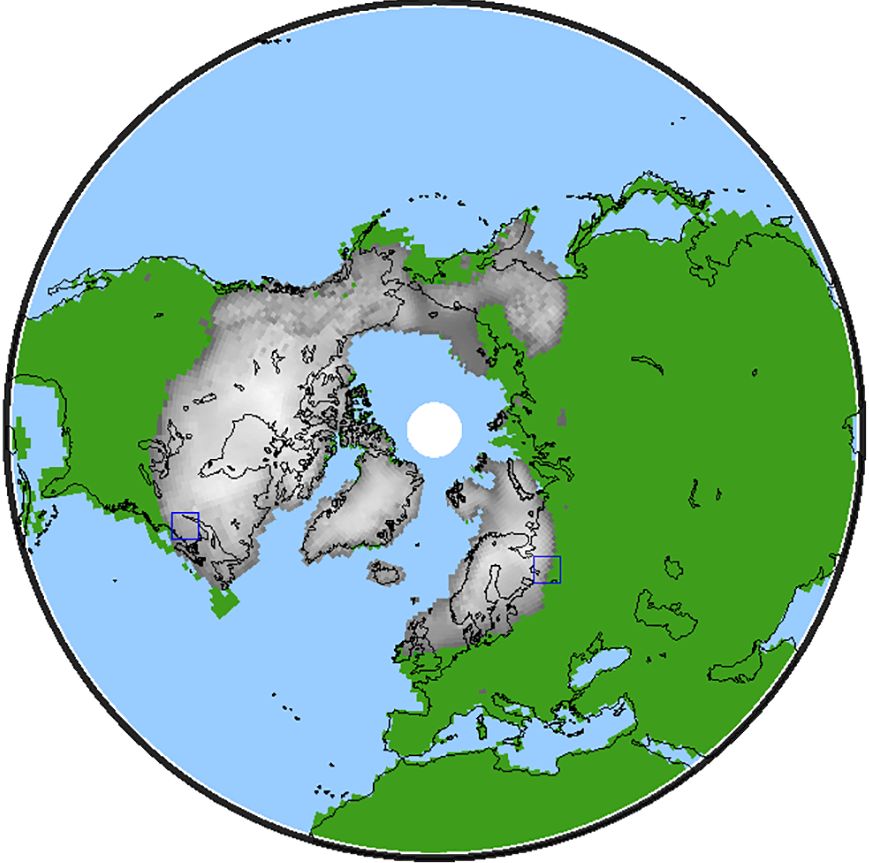
| 21:24, 7. Feb. 2021 | LGM Ice-Sheets NH.jpg (Datei) |  |
92 KB | Dieter Kasang | == Beschreibung == Ausdehnung der Eisschilde auf der Nordhalbkugel während des Höhepunkts der letzten Eiszeit vor 21000 Jahren ==Lizenzhinweis== {| style="border:1px solid #8888aa; background-color:#f7f8ff;padding:5px;font-size:95%;" | '''Quelle:''' Willeit, M. and Ganopolski, A.: The importance of snow albedo for ice sheet evolution over the last glacial cycle, Clim. Past, 14, 697–707, https://doi.org/10.5194/cp-14-697-2018 <br /> '''Lizenz:''' [https://creativecommons.org/licenses/by/4.0/ CC… | 1 |
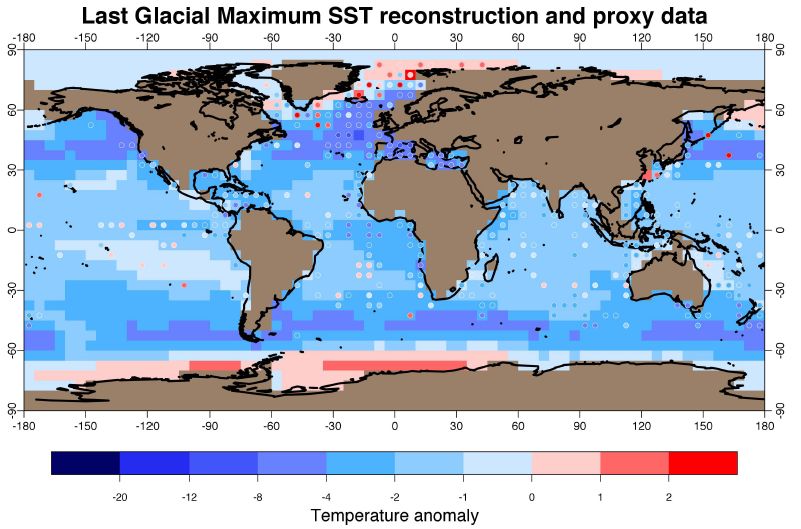
| 21:21, 7. Feb. 2021 | LGM SST.jpg (Datei) |  |
78 KB | Dieter Kasang | == Beschreibung == Abweichungen der bodennahen Meeresoberflächentemperatur während des Höhepunkts der letzten Eiszeit als Abweichungen vom vorindustriellen Klima ==Lizenzhinweis== {| style="border:1px solid #8888aa; background-color:#f7f8ff;padding:5px;font-size:95%;" | '''Quelle:''' Annan, J. D. and Hargreaves, J. C.: A new global reconstruction of temperature changes at the Last Glacial Maximum, Clim. Past, 9, 367–376, https://doi.org/10.5194/cp-9-367-2013 <br /> '''Lizenz:''' [https://creati… | 1 |
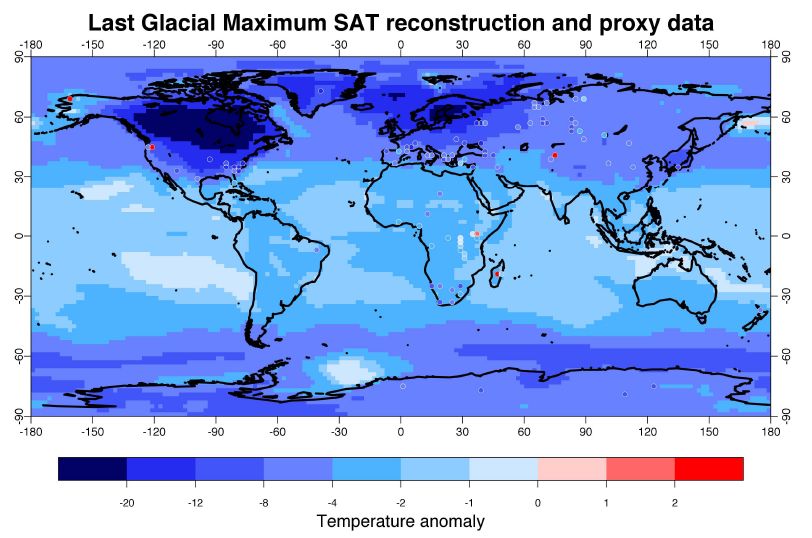
| 21:19, 7. Feb. 2021 | LGM Temp.jpg (Datei) |  |
75 KB | Dieter Kasang | == Beschreibung == Abweichungen der bodennahen Lufttemperatur während des Höhepunkts der letzten Eiszeit als Abweichungen vom vorindustriellen Klima ==Lizenzhinweis== {| style="border:1px solid #8888aa; background-color:#f7f8ff;padding:5px;font-size:95%;" | '''Quelle:''' Annan, J. D. and Hargreaves, J. C.: A new global reconstruction of temperature changes at the Last Glacial Maximum, Clim. Past, 9, 367–376, https://doi.org/10.5194/cp-9-367-2013 <br /> '''Lizenz:''' [https://creativecommons.org… | 1 |
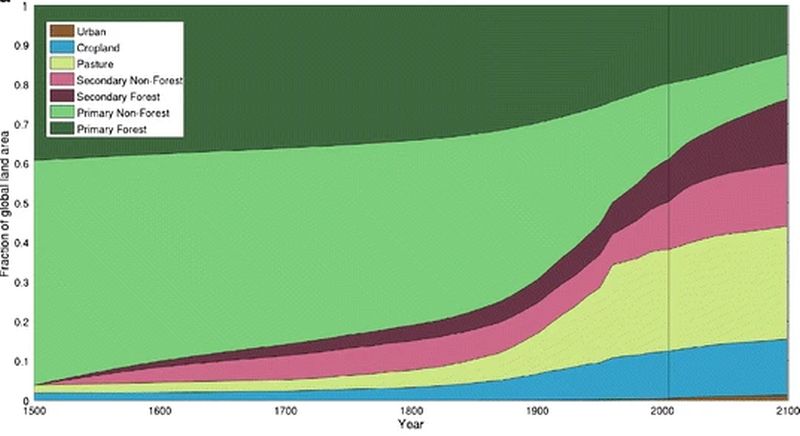
| 18:41, 6. Feb. 2021 | Landnutzung 1500-2100.jpg (Datei) |  |
36 KB | Dieter Kasang | Änderung der Landnutzung 1500-2100. (von unten nach oben) Braun: Stadtgebiete, blau: Anbaugebiete, gelb: Weideland, lila hell: sekundär nicht bewaldet*, dunkel lila: Sekundärwald, hellgrün: primär nicht bewaldet, dunkelgrün: Primärwald. “nicht bewaldet”= weniger als 2 kg C/m2 Biomasse == Lizenzhinweis == {| style="border:1px solid #8888aa; background-color:#f7f8ff;padding:5px;font-size:95%;" | Quelle: Hurtt, G.C., Chini, L.P., Frolking, S. et al. (2011): Harmonization of land-use scenarios for… | 1 |
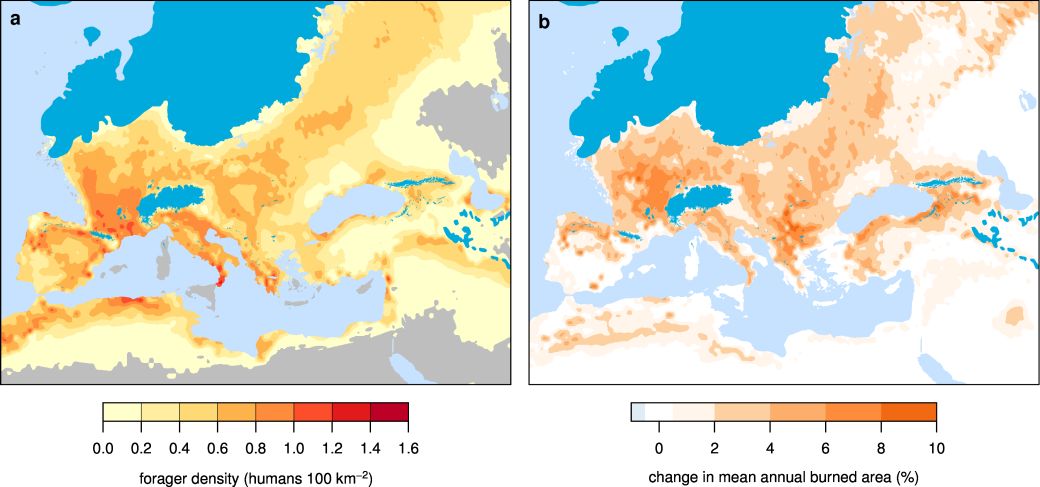
| 14:37, 2. Feb. 2021 | LGM population fire.jpg (Datei) |  |
71 KB | Dieter Kasang | Bevölkerungsdichte (a) und die anthropogene Änderung der natürlichen Feueraktivität (b) während des Höhepunkts der letzten Eiszeit um 21 000 Jahren vh. Dunkelblau: Eisbedeckung; hellblau: Wasser. ==Lizenzhinweis== {| style="border:1px solid #8888aa; background-color:#f7f8ff;padding:5px;font-size:95%;" | '''Quelle:''' Kaplan, J.O., M. PfeifferJ.C.A. Kolen, B.A.S. Davis (2016): Large Scale Anthropogenic Reduction of Forest Cover in Last Glacial Maximum Europe. PLoS ONE 11(11): e0166726. doi:10.13… | 1 |
| 18:38, 1. Feb. 2021 | Land-area exposed drought heat.jpg (Datei) |  |
208 KB | Dieter Kasang | == Beschreibung == Landgebiete, die bei einer globalen Erwärmung von 2 °C von Dürren und Hitzewellen betroffen sind, in % der Gitterzelle (0,5°x0,5°). ==Lizenzhinweis== {| style="border:1px solid #8888aa; background-color:#f7f8ff;padding:5px;font-size:95%;" | Quelle: Lange, S., Volkholz, J., Geiger, T., Zhao, F., Vega, I., Veldkamp, T., et al. (2020). Projecting exposure to extreme climate impact events across six event categories and three spatial scales. Earth's Future, 11, e2020EF001616. ht… | 1 |
| 18:32, 1. Feb. 2021 | Land-area exposed flood TC fire.jpg (Datei) |  |
221 KB | Dieter Kasang | == Beschreibung == Landgebiete, die bei einer globalen Erwärmung von 3 °C von Flussüberschwemmungen, Ernteausfällen, tropischen Wirbelstürmen und Waldbränden betroffen sind, in % der Gitterzelle (0,5°x0,5°) ==Lizenzhinweis== {| style="border:1px solid #8888aa; background-color:#f7f8ff;padding:5px;font-size:95%;" | Quelle: Lange, S., Volkholz, J., Geiger, T., Zhao, F., Vega, I., Veldkamp, T., et al. (2020). Projecting exposure to extreme climate impact events across six event categories and thre… | 1 |
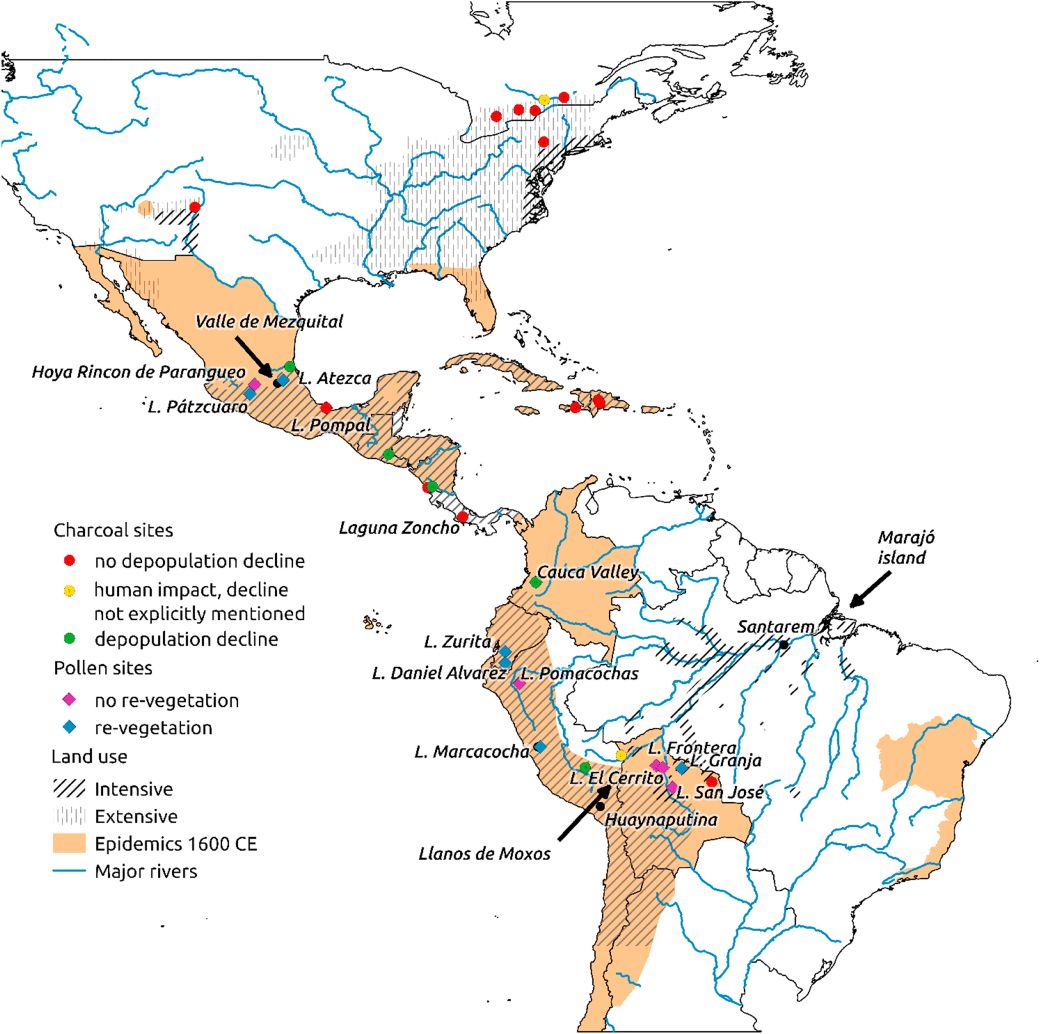
| 21:36, 26. Jan. 2021 | Americas land-use colonization.jpg (Datei) |  |
154 KB | Dieter Kasang | Vorkoloniale Landnutzung, Epidemien um 1600 und die Folgen == Lizenzhinweis == {| style="border:1px solid #8888aa; background-color:#f7f8ff;padding:5px;font-size:95%;" | Quelle: Koch, A., C. Brierley, M.M. Maslin, S.L. Lewis (2019): Earth system impacts of the European arrival and Great Dying in the Americas after 1492, Quaternary Science Reviews 207, 13-36, ISSN 0277-3791, https://doi.org/10.1016/j.quascirev.2018.12.004. <br> Lizenz: [http://creativecommons.org/licenses/by/4.0/ CC BY] |} | 1 |
| 21:33, 26. Jan. 2021 | Brazil land cover change2001 2017.jpg (Datei) |  |
83 KB | Dieter Kasang | Landnutzung im Staat Mato Grosso, Brasilien, 2001 und 2017 == Lizenzhinweis == {| style="border:1px solid #8888aa; background-color:#f7f8ff;padding:5px;font-size:95%;" | Quelle: Maciel, A.M., M.C.A. Picol, L. Vinhas, G. Camara (2020): Identifying Land Use Change Trajectories in Brazil’s Agricultural Frontier. Land. 2020; 9(12):506. https://doi.org/10.3390/land9120506 <br> Lizenz: CC BY http://creativecommons.org/licenses/by/4.0/ |} | 1 |
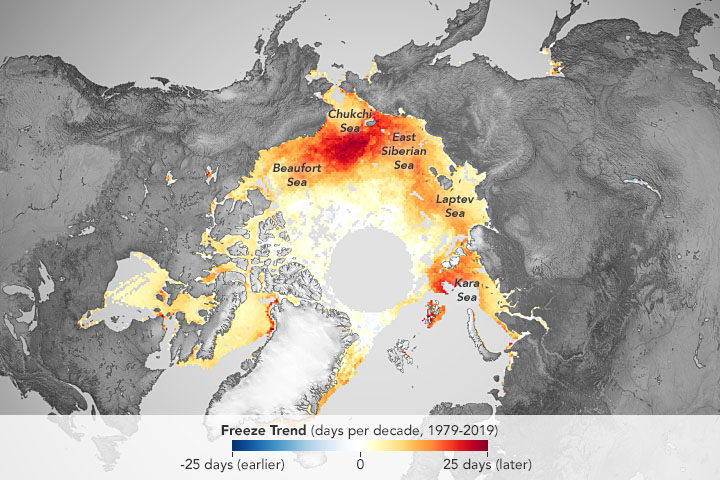
| 17:37, 11. Jan. 2021 | Arctic Sea Ice freeze-date.jpg (Datei) |  |
125 KB | Dieter Kasang | == Beschreibung == Änderung des Gefrierdatums in der Arktis 1979-2019. Angegeben ist die Anzahl der Tage pro Jahrzehnt, um die sich das Gefrierdatum verschiebt. == Lizenzhinweis == {| style="border:1px solid #8888aa; background-color:#f7f8ff;padding:5px;font-size:95%;" | Quelle: NASA, Visible Earth (2021): The Long Decline of Arctic Sea Ice, https://visibleearth.nasa.gov/images/147746/the-long-decline-of-arctic-sea-ice/147746f <br> Lizenz: public domain |} | 1 |
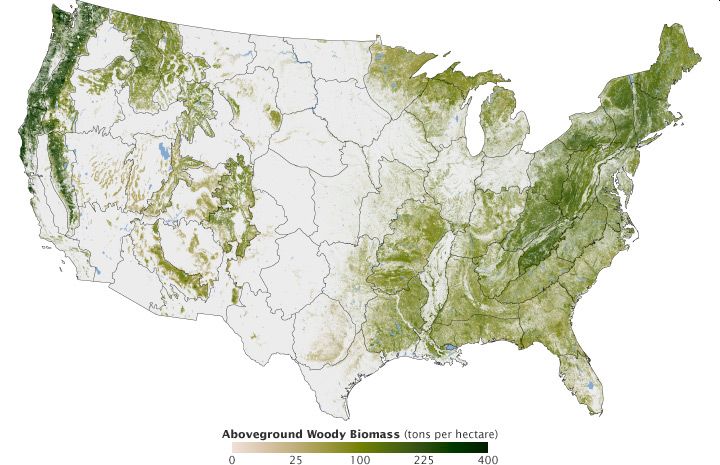
| 17:07, 11. Jan. 2021 | USA woody biomass.jpg (Datei) |  |
64 KB | Dieter Kasang | Oberirdische Holz-Biomasse in t/ha in den USA 2011 == Lizenzhinweis == {| style="border:1px solid #8888aa; background-color:#f7f8ff;padding:5px;font-size:95%;" | Quelle: NASA Earth Observatory (2012): [https://earthobservatory.nasa.gov/features/ForestCarbon Seeing Forests for the Trees and the Carbon: Mapping the World’s Forests in Three Dimensions]<br> Lizenz: public domain |} | 1 |
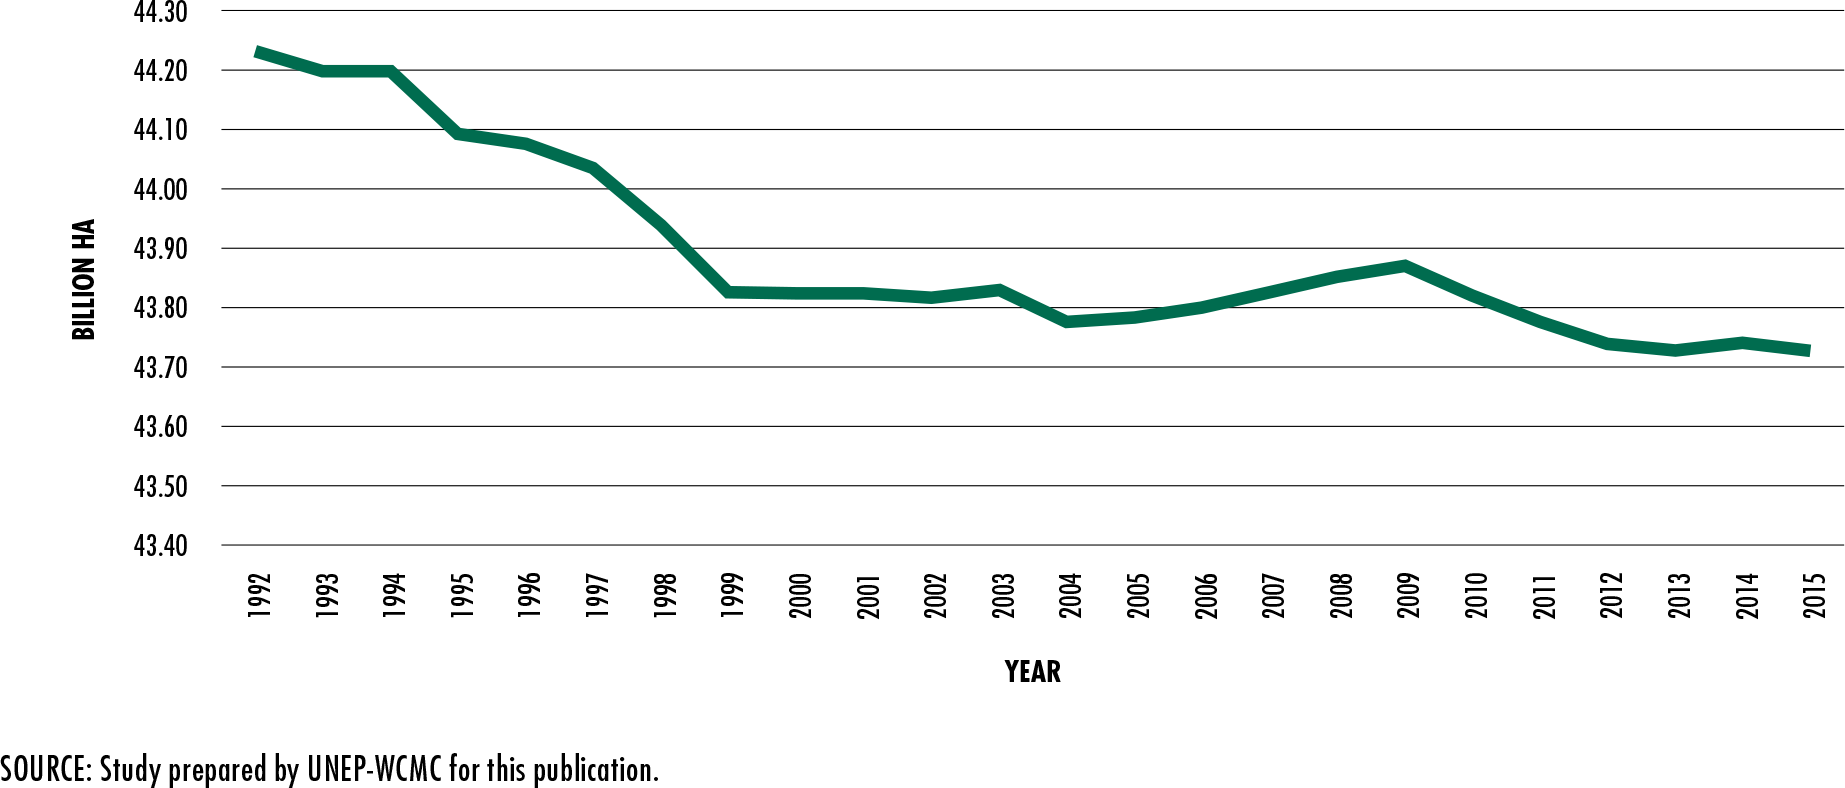
| 16:52, 11. Jan. 2021 | Global tree cover1992-2015.png (Datei) |  |
37 KB | Dieter Kasang | == Beschreibung == Änderung der globalen Baumbedeckung 1992-2015 in Mrd. ha == Lizenzhinweis == {| style="border:1px solid #8888aa; background-color:#f7f8ff;padding:5px;font-size:95%;" | Quelle: FAO and UNEP (2020): [https://doi.org/10.4060/ca8642en The State of the World’s Forests 2020. Forests, biodiversity and people.] Rome.<br> Lizenz: [https://creativecommons.org/licenses/by-nc-sa/3.0/igo/legalcode CC BY-NC-SA] |} | 1 |
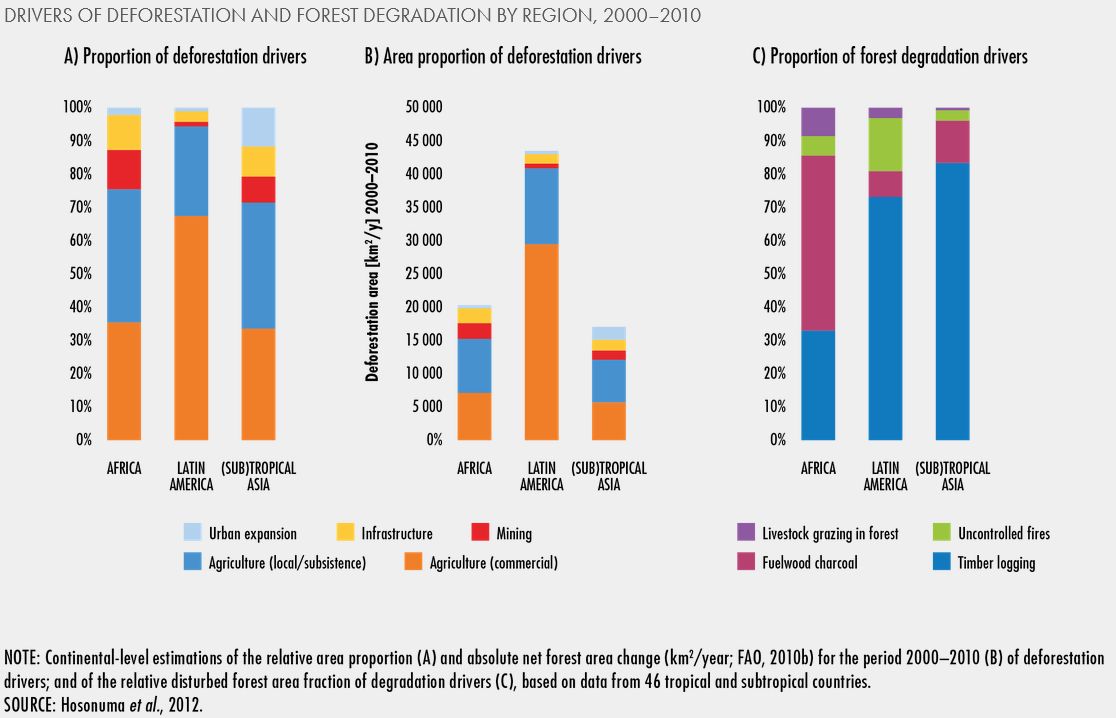
| 16:45, 11. Jan. 2021 | Deforestation drivers regions2000-2010.jpg (Datei) |  |
85 KB | Dieter Kasang | == Beschreibung == Ursachen von Entwaldung und Degradation von Wäldern 2000-2010 == Lizenzhinweis == {| style="border:1px solid #8888aa; background-color:#f7f8ff;padding:5px;font-size:95%;" | Quelle: FAO and UNEP (2020): [https://doi.org/10.4060/ca8642en The State of the World’s Forests 2020. Forests, biodiversity and people.] Rome.<br> Lizenz: [https://creativecommons.org/licenses/by-nc-sa/3.0/igo/legalcode CC BY-NC-SA] |} | 1 |